Exhibit 99.3
FELDMAN FINANCIAL ADVISORS, INC.
1001 CONNECTICUT AVENUE, NW— SUITE 840
WASHINGTON, DC 20036
202-467-6862— (FAX) 202-467-6963
Eagle Bancorp Montana, Inc.
Helena, Montana
Conversion Valuation Appraisal Report
Valued as of December 3, 2009
Prepared By
Feldman Financial Advisors, Inc.
Washington, D.C.
FELDMAN FINANCIAL ADVISORS, INC.
| 1001 CONNECTICUT AVENUE, NW — SUITE 840 | ||
| WASHINGTON, DC 20036 | ||
| 202-467-6862— (FAX) 202-467-6963 | ||
| December 3, 2009 | ||
Board of Directors
Eagle Bancorp Montana
1400 Prospect Avenue
Helena, Montana 59601
Members of the Board:
At your request, we have completed and hereby provide an updated independent appraisal (the “Appraisal”) of the estimated pro forma market value of the common stock to be issued (the “Stock Offering”) by Eagle Bancorp Montana, Inc. (“Eagle Montana” or the “Company”), Helena, Montana, as of December 3, 2009, in connection with the mutual-to-stock conversion of Eagle Financial, MHC (the “MHC”). Currently, the MHC’s principal activity is the ownership of the majority interest approximating 60.4% in Eagle Bancorp, Inc. (“Bancorp” or “Mid-Tier”), the mid-tier holding company for American Federal Savings Bank (the “Bank”). The remainder of the Mid-Tier’s shares (39.6%) is owned by public stockholders. Bancorp owns a 100% interest in the common stock of the Bank. At the conclusion of the conversion, the MHC will no longer exist. Eagle Montana is offering for sale common stock representing the majority ownership interest Bancorp that is currently held by Eagle Financial, MHC in a subscription offering to Eligible Account Holders, Supplemental Eligible Account Holders and Other Members. To the extent that shares remain available for purchase after satisfaction of all subscriptions received in the subscription offering, the shares may be offered for sale in a community offering to current holders of Bancorp shares as of the Record Date, members of the local community and the public at large. At the conclusion of the conversion, existing public stockholders of Bancorp, Inc. will receive new shares of common stock of the Company in exchange for their existing Bancorp Shares. This Appraisal has been prepared in accordance with the “Guidelines for Appraisal Reports for the Valuation of Savings and Loan Associations Converting from Mutual to Stock Form of Organization” of the OTS.
Feldman Financial Advisors, Inc. (“Feldman Financial”) is a financial consulting and economic research firm that specializes in financial valuations and analyses of business enterprises and securities in the thrift, banking, and mortgage industries. The background of Feldman Financial is presented in Exhibit I. In preparing the Appraisal, we conducted an analysis of the Company that included discussions with the Company’s management, the Company’s legal counsel, Nixon Peabody LLP, and the Company’s independent auditor, Davis, Kinard & Co., P.C. In addition, where appropriate, we considered information based on other available published sources that we believe are reliable; however, we cannot guarantee the accuracy and completeness of such information.
FELDMAN FINANCIAL ADVISORS, INC.
Board of Directors
Eagle Bancorp Montana, Inc.
December 3, 2009
Page Two
We also reviewed, among other factors, the economy in the Company’s primary market area and compared the Company’s financial condition and operating performance with that of selected publicly traded thrift institutions. We reviewed conditions in the securities markets in general and in the market for thrift institution common stocks in particular.
The Appraisal is based on the Company’s representation that the information contained in the Prospectus and additional evidence furnished to us by the Company and its independent auditor are truthful, accurate, and complete. We did not independently verify the financial statements and other information provided by the Company and its independent auditor, nor did we independently value the assets or liabilities of the Company. The Appraisal considers the Company only as a going concern and should not be considered as an indication of the liquidation value of the Company.
It is our opinion that, as of December 3, 2009, the estimated pro forma market value of the Company on a fully converted basis was within a range (the “Valuation Range”) of $33,801,360 to $45,731,250 with a midpoint of $39,766,300. Assuming an additional 15% increase above the maximum value would result in an adjusted maximum of $52,590,930. After consideration of the exchange of existing publicly held shares and the offering of the MHC’s 60.4% ownership interest to the public, assuming an offering price of $10.00 per share of common stock, the Company will offer a minimum of 2,040,00 shares, a midpoint of 2,400,000 shares, a maximum of 2,760,000 shares, and an adjusted maximum of 3,174,000 shares.
OTS regulations provide that in a conversion of a mutual holding company, the minority stockholders are entitled to exchange their current shares for newly issued shares of the fully converted Company. It is our understanding that the exchange ratio has been designed to preserve the current aggregate percentage ownership in Bancorp equal to 39.6%. The actual exchange ratio to be received by the existing minority shareholders of Bancorp will be determined at the end of the offering, based on the total number of shares sold in the subscription and community offerings. Based on this calculation, and the valuation offering range above, the Company’s legal exchange ratio would be 3.1548 shares, 3.7009 shares, 4.256 shares and 4.8944 shares at the minimum, midpoint, maximum and adjusted maximum of the offering range, respectively. Feldman Financial has no opinion on the proposed exchange ratio applied to the minority shares exchanged for newly issued shares of the Company.
FELDMAN FINANCIAL ADVISORS, INC.
Board of Directors
Eagle Bancorp Montana, Inc.
December 3, 2009
Page Three
Our Appraisal is not intended, and must not be construed, to be a recommendation of any kind as to the advisability of purchasing shares of common stock in the Stock Offering. Moreover, because the Appraisal is necessarily based upon estimates and projections of a number of matters, all of which are subject to change from time to time, no assurance can be given that persons who purchase shares of stock in the Stock Offering will thereafter be able to sell such shares at prices related to the foregoing estimate of the Company’s pro forma market value. Feldman Financial is not a seller of securities within the meaning of any federal or state securities laws and any report prepared by Feldman Financial shall not be used as an offer or solicitation with respect to the purchase or sale of any securities.
The valuation reported herein will be updated as appropriate. Further updates will consider, among other factors, any developments or changes in the Company’s operating performance, financial condition, or management policies, and current conditions in the securities markets for thrift institution common stocks. Should any such new developments or changes be material, in our opinion, to the valuation of the Company, appropriate adjustments to the estimated pro forma market value will be made. The reasons for any such adjustments will be explained in detail at that time.
Respectfully submitted, |
Feldman Financial Advisors, Inc. |
|
| Trent R. Feldman |
President |
|
| Greg E. Izydorczyk |
| Senior Vice President |
FELDMAN FINANCIAL ADVISORS, INC.
TABLE OF CONTENTS
TAB | PAGE | |||||
| INTRODUCTION | 1 | |||||
| I. | Chapter One – BUSINESS OF EAGLE BANCORP MONTANA | |||||
| General Overview | 4 | |||||
| Financial Condition | 7 | |||||
| Income and Expense Trends | 31 | |||||
| Interest Rate Risk Management | 41 | |||||
| Asset Quality | 43 | |||||
| Market Area | 49 | |||||
| Summary Outlook | 54 | |||||
| II. | Chapter Two – COMPARISONS WITH PUBLICLY HELD THRIFTS | |||||
| General Overview | 55 | |||||
| Selection Criteria | 56 | |||||
| Recent Financial Comparisons | 60 | |||||
| III. | Chapter Three – MARKET VALUE ADJUSTMENTS | |||||
| General Overview | 72 | |||||
| Earnings Prospects | 72 | |||||
| Financial Condition | 74 | |||||
| Market Area | 75 | |||||
| Management | 75 | |||||
| Dividend Policy | 76 | |||||
| Liquidity of the Issue | 76 | |||||
| Subscription Interest | 76 | |||||
| Stock Market Conditions | 78 | |||||
| Recent Acquisition Activity | 81 | |||||
| Marketability Discount | 81 | |||||
| Effect of Government Regulations and Regulatory Reform | 84 | |||||
| Adjustments Conclusion | 84 | |||||
| Valuation Approach | 85 | |||||
| Valuation Conclusion | 88 | |||||
| IV. | Appendix – EXHIBITS | |||||
| I | Background of Feldman Financial Advisors, Inc. | I-1 | ||||
| II-1 | Statement of Financial Condition | II-1 | ||||
| II-2 | Statement of Operations | II-2 | ||||
| II-3 | Loan Portfolio Composition | II-3 | ||||
| II-4 | Investment Portfolio Composition | II-4 | ||||
| II-5 | Deposit Account Distribution | II-5 | ||||
| III | Financial and Market Data for All Public Thrifts | III-1 | ||||
| IV-1 | Pro Forma Assumptions for Second-Stage Conversion Valuation | IV-1 | ||||
| IV-2 | Pro Forma Second-Stage Conversion Valuation Range | IV-2 | ||||
| IV-3 | Pro Forma Second-Stage Conversion Analysis at Midpoint | IV-3 | ||||
| IV-4 | Comparative Discount and Premium Analysis | IV-4 | ||||
i
FELDMAN FINANCIAL ADVISORS, INC.
LIST OF TABLES
TAB | PAGE | |||||
| I. | Chapter One – BUSINESS OF EAGLE BANCORP MONTANA | |||||
Table 1 | Selected Financial Condition Data | 7 | ||||
Table 2 | Selected Income Statement Information | 8 | ||||
Table 3 | Selected Financial and Performance Ratios | 9 | ||||
Table 4 | Loan Portfolio | 14 | ||||
Table 5 | Loan Originations | 21 | ||||
Table 6 | Securities Portfolio | 24 | ||||
Table 7 | Securities Portfolio by Contractual Maturity | 26 | ||||
Table 8 | Deposit Portfolio | 27 | ||||
Table 9 | Borrowings | 30 | ||||
Table 10 | Summary Income Statement Data | 31 | ||||
Table 11 | Average Balances and Yields | 32 | ||||
Table 12 | Rate/Volume Analysis | 34 | ||||
Table 13 | Interest Rate Risk Analysis | 42 | ||||
Table 14 | Nonperforming Asset Summary | 44 | ||||
Table 15 | Allowance for Loan Loss Summary | 45 | ||||
Table 16 | Allocation of Allowance for Loan Losses | 46 | ||||
Table 17 | Selected Demographic Data | 51 | ||||
Table 18 | Deposit Market Share by County | 53 | ||||
| II. | Chapter Two – COMPARISONS WITH PUBLICLY HELD THRIFTS | |||||
Table 19 | Comparative Group Operating Summary | 59 | ||||
Table 20 | Key Financial Comparisons | 62 | ||||
Table 21 | General Financial Performance Ratios | 66 | ||||
Table 22 | Income and Expense Analysis | 67 | ||||
Table 23 | Yield-Cost Structure and Growth Rates | 68 | ||||
Table 24 | Balance Sheet Composition | 69 | ||||
Table 25 | Regulatory Capital, Credit Risk, and Loan Composition | 70 | ||||
| III. | Chapter Three – MARKET VALUE ADJUSTMENTS | |||||
Table 26 | Comparative Stock Index Performance | 80 | ||||
Table 27 | Summary of Recent Acquisition Activity | 83 | ||||
Table 28 | Summary of Recent Second-Step Stock Offerings | 84 | ||||
Table 29 | Pro Forma Comparative Market Valuation Analysis | 89 | ||||
ii
FELDMAN FINANCIAL ADVISORS, INC.
INTRODUCTION
At your request, we have completed and hereby provide an independent appraisal (the “Appraisal”) of the estimated pro forma market value of the common stock to be issued (the “Stock Offering”) by Eagle Bancorp Montana, Inc. (“Eagle Montana” or the “Company”), Helena, Montana, as of December 3, 2009, in connection with the mutual-to-stock conversion of Eagle Financial, MHC (the “MHC”). Currently, the MHC’s principal activity is the ownership of the majority interest approximating 60.4% in Eagle Bancorp (“Bancorp” or “Mid-Tier”), the mid-tier holding company for American Federal Savings Bank (the “Bank”). Public stockholders own the remainder of the Mid-Tier’s shares (39.6%). Bancorp owns a 100% interest in the common stock of the Bank. At the conclusion of the conversion, the MHC will no longer exist. As part of the conversion, the Company is offering for sale common stock representing the majority ownership interest in Bancorp currently held by Eagle Financial, MHC in a subscription offering to Eligible Account Holders, Supplemental Eligible Account Holders and Other Members. To the extent that shares remain available for purchase after satisfaction of all subscriptions received in the subscription offering, the shares may be offered for sale in a community offering to current holders of Bancorp shares as of the Record Date, members of the local community and the public at large. At the conclusion of the conversion, existing public stockholders of Bancorp will receive new shares of common stock (adjusted for an exchange ratio) of the Company in exchange for their existing Bancorp Shares. This Appraisal has been prepared in accordance with the “Guidelines for Appraisal Reports for the Valuation of Savings and Loan Associations Converting from Mutual to Stock Form of Organization” of the Office of Thrift Supervision (“OTS”).
1
FELDMAN FINANCIAL ADVISORS, INC.
In the course of preparing the Appraisal, we reviewed and discussed with the Company’s management and the Company’s independent accountants, Davis, Kinard & Co., P.C., the audited financial statements of the Company’s operations for the years ended June 30, 2008 and 2009 and unaudited financials for the three-month period ended September 30, 2009. We also reviewed and discussed with management other financial matters of the Bank.
Where appropriate, we considered information based upon other available public sources, which we believe to be reliable; however, we cannot guarantee the accuracy or completeness of such information. We visited the Company’s primary market area and examined the prevailing economic conditions. We also examined the competitive environment within which the Company operates and assessed the Company’s relative strengths and weaknesses.
We examined and compared the Company’s financial performance with selected segments of the thrift industry and selected publicly traded thrift institutions. We reviewed conditions in the securities markets in general and the market for thrift institution common stocks in particular. We included in our analysis an examination of the potential effects of the Stock Offering on the Company’s operating characteristics and financial performance as they relate to the estimated pro forma market value of the Company.
In preparing the Appraisal, we have relied upon and assumed the accuracy and completeness of financial and statistical information provided by the Company and its independent accountants. We did not independently verify the financial statements and other information provided by the Company and its independent accountants, nor did we independently value the assets or liabilities of the Company. The Appraisal considers the Company only as a going concern and should not be considered as an indication of the liquidation value of the Company.
2
FELDMAN FINANCIAL ADVISORS, INC.
Our Appraisal is not intended, and must not be construed, to be a recommendation of any kind as to the advisability of purchasing shares of common stock in the Stock Offering. Moreover, because such the Appraisal is necessarily based on estimates and projections of a number of matters, all of which are subject to change from time to time, no assurance can be given that persons who purchase shares of common stock in the Stock Offering will thereafter be able to sell such shares at prices related to the foregoing estimate of the Company’s pro forma market value. Feldman Financial is not a seller of securities within the meaning of any federal and state securities laws and any report prepared by Feldman Financial shall not be used as an offer or solicitation with respect to the purchase or sale of any securities.
The valuation reported herein will be updated as appropriate. Future updates will consider, among other factors, any developments or changes in the Company’s financial performance or management policies, and current conditions in the securities market for thrift institution common stocks. Should any such developments or changes be material, in our opinion, to the Stock Offering valuation of the Company, appropriate adjustments to the estimated pro forma market value may be made. The reasons for any such adjustments will be explained in detail at that time.
3
FELDMAN FINANCIAL ADVISORS, INC.
I. BUSINESS OF EAGLE BANCORP MONTANA, INC.
General Overview
Eagle Montana is a newly formed Delaware corporation incorporated in December 2009 to be the successor corporation to Eagle Bancorp upon completion of the conversion. Eagle Montana will own all of the outstanding shares of common stock of American Federal Savings Bank upon completion of the conversion. Currently, Eagle Bancorp, the mid-tier stock holding company formed in 2000 owns all of the capital stock of the Bank. The mid-tier holding company is 60.4% owed by Eagle Financial, MHC and 39.6% owned by public shareholders. After the conversion, Eagle Financial, MHC will no longer exist. In addition, as part of the conversion, existing public stockholders of Bancorp will receive new shares of common stock in Eagle Montana in exchange for their existing shares of common stock of Bancorp. Eagle Montana’s executive offices are located at 1400 Prospect Avenue, Helena, Montana 59601.
American Federal Savings Bank is a federally chartered savings bank headquartered in Helena, Montana. The Bank was founded in 1922 as a Montana chartered building and loan association. In 1975, the Bank adopted a federal thrift charter and, in 2000, reorganized from the mutual (meaning no stockholders) structure into the mutual holding company structure, thereby becoming partially stockholder-owned. American Federal Savings Bank became the wholly owned subsidiary of Eagle Bancorp, a federal corporation, in 2000. The Bank currently operates seven retail-banking locations and seven automated teller machines in south central Montana. The Office of Thrift Supervision and the Federal Deposit Insurance Corporation regulate the Bank. At September 30, 2009, the Company had total assets of $300.7 million, deposits of $195.1 million and equity capital of $30.4 million.
4
FELDMAN FINANCIAL ADVISORS, INC.
The Bank’s primary lines of business are:
| • | Retail Lending.The Bank originates residential mortgage loans, home equity loans, and consumer loans primarily through its community banking office network. The Bank also offers its customers the choice of submitting online mortgage loan applications and receiving pre-approvals through the Bank’s website. |
| • | Commercial Lending.The Bank continues to place an emphasis on growing its commercial business and commercial real estate loan portfolios. In addition to commercial real estate loans, the Bank offers traditional business loans structured as unsecured lines of credit or loans secured by inventory, accounts receivable or other business assets. The Bank seeks to provide exceptional service with local decision-making and personal attention. |
| • | Deposit Products and Services.The Bank offers a full range of traditional deposit products such as checking accounts, savings accounts, money market accounts, retirement accounts, and certificates of deposit. These products can have additional features such as direct deposit, ATM and check card services, overdraft protection, telephone banking and Internet banking, thereby providing customers multiple channels to access their accounts. |
| • | Mortgage Servicing.The Bank provides loan servicing for other institutions. These services generally consist of collecting mortgage payments, maintaining escrow accounts, disbursing payments to investors and foreclosure processing. |
The Bank faces strong competition in its primary market area for the attraction of retail deposits and the origination of loans. Historically, Montana was a unit banking state. This means that the ability of Montana state banks to create branches was either prohibited or significantly restricted. As a result of unit banking, Montana has a significant number of independent financial institutions serving a single community in a single location. While the state’s population is approximately 973,000 people, there are 59 credit unions in Montana as well as two federally chartered thrift institutions, and 77 commercial banks as of June 30, 2009.
5
FELDMAN FINANCIAL ADVISORS, INC.
The Bank’s most direct competition for depositors has historically come from locally owned and out-of-state commercial banks, thrift institutions and credit unions operating in the Bank’s primary market area. The number of such competitor locations has increased significantly in recent years. Competition for loans also comes from banks, thrifts and credit unions in addition to mortgage bankers and brokers. The Bank’s principal market areas can be characterized as markets with moderately increasing incomes, relatively low unemployment, increasing wealth (particularly in the growing resort areas such as Bozeman), and moderate population growth. The ability of the Company to compete successfully is a significant factor affecting growth potential and profitability.
The Company’s primary reasons for converting to the stock holding company structure and raising additional capital through the offering are:
| • | to fund a loan to the employee stock ownership plan to purchase shares of common stock in the offering; |
| • | to finance, where opportunities are presented, the acquisition of financial institutions or other financial service companies as opportunities arise, particularly in, or adjacent to, south central Montana, although the Company does not currently have any agreements or understandings regarding any specific acquisition transaction and it is impossible to determine when, if ever, such opportunities may arise; |
| • | to pay cash dividends to stockholders; |
| • | to repurchase shares of our common stock for, among other things, the funding of our stock-based incentive plan; |
| • | to invest in securities; and |
| • | to use the additional capital for other general corporate purposes. |
The remainder of Chapter I examines in more detail the trends addressed in this section, including the impact of changes in the Company’s economic and competitive environment, and recent management initiatives. The discussion is supplemented by the exhibits in the Appendix. Exhibit II-1 summarizes the Company’s consolidated balance sheets as of the years ended June 30, 2008 and 2009 and the three month period ended September 30, 2009. Exhibit II-2 presents the Company’s consolidated income statements for the years ended June 30, 2007 to 2009 and the three-month periods ended September 30, 2008 and 2009.
6
FELDMAN FINANCIAL ADVISORS, INC.
Financial Condition
Table 1 presents selected data concerning the Company’s financial position as of September 30, 2009 and June 30 2005 to 2009 while Table 2 details selected income statement data for the three month periods ended September 30, 2008 and 2009 and for the years ended June 30, 2005 to 2009. Table 3 details selected financial performance data for the three-month periods ended September 30, 2008 and 2009 and for the years ended June 30, 2005 to 2009.
Table 1
Selected Financial Condition Data
As of September 30, 2009 and June 30, 2005 to 2009
| At Sept. 30, | At June 30, | |||||||||||||||||
| 2009 | 2009 | 2008 | 2007 | 2006 | 2005 | |||||||||||||
| (in thousands) | ||||||||||||||||||
Balance Sheet Data: | ||||||||||||||||||
Total assets | $ | 300,680 | $ | 289,709 | $ | 279,907 | $ | 244,686 | $ | 226,178 | $ | 206,414 | ||||||
Investment securities, available-for-sale | 92,100 | 82,263 | 78,417 | 64,774 | 64,198 | 75,227 | ||||||||||||
Investment securities, held-to-maturity | 265 | 375 | 697 | 921 | 1,018 | 1,201 | ||||||||||||
Loans receivable, net: | ||||||||||||||||||
Residential mortgages | 76,711 | 79,216 | 86,751 | 81,958 | 75,913 | 56,533 | ||||||||||||
Real estate construction | 6,119 | 4,642 | 7,317 | 8,253 | 6,901 | 2,723 | ||||||||||||
Home equity | 28,836 | 28,676 | 28,034 | 24,956 | 20,191 | 16,801 | ||||||||||||
Consumer | 11,074 | 10,835 | 11,558 | 11,438 | 11,820 | 10,909 | ||||||||||||
Commercial (1) | 46,005 | 44,254 | 34,699 | 31,987 | 26,509 | 20,347 | ||||||||||||
Total loans receivable, net | 168,185 | 167,197 | 168,149 | 158,140 | 140,858 | 106,839 | ||||||||||||
Mortgage loans held for sale | 3,494 | 5,349 | 7,370 | 1,175 | 918 | 2,148 | ||||||||||||
Mortgage servicing rights, net | 2,315 | 2,208 | 1,652 | 1,628 | 1,722 | 1,857 | ||||||||||||
Deposits | 195,080 | 187,199 | 178,851 | 179,647 | 174,342 | 172,497 | ||||||||||||
FHLB advances | 66,639 | 67,056 | 65,222 | 30,000 | 22,371 | 9,885 | ||||||||||||
Subordinated debentures | 5,155 | 5,155 | 5,155 | 5,155 | 5,155 | — | ||||||||||||
Shareholders’ equity | 30,427 | 27,792 | 25,634 | 24,088 | 22,545 | 22,265 | ||||||||||||
| (1) | Includes commercial real estate and land loans and commercial business loans. |
Source: Eagle Montana, preliminary prospectus.
7
FELDMAN FINANCIAL ADVISORS, INC.
Table 2
Selected Income Statement Information
For the Three Months Ended September 30, 2008 and 2009
For the Years Ended December 31, 2005 to 2009
| For the Three Months Ended September 30, | For the Year Ended June 30, | ||||||||||||||||||||||
| 2009 | 2008 | 2009 | 2008 | 2007 | 2006 | 2005 | |||||||||||||||||
| (Dollars in thousands, except per share amounts) | |||||||||||||||||||||||
Operating Data: | |||||||||||||||||||||||
Total interest income | $ | 3,724 | $ | 3,816 | $ | 15,348 | $ | 14,098 | $ | 12,651 | $ | 10,506 | $ | 9,043 | |||||||||
Total interest expense | 1,341 | 1,580 | 6,115 | 6,662 | 5,966 | 3,792 | 2,563 | ||||||||||||||||
Net interest income | 2,383 | 2,236 | 9,233 | 7,436 | 6,685 | 6,714 | 6,480 | ||||||||||||||||
Provision (credit) for loan losses | 135 | — | 257 | (175 | ) | — | — | — | |||||||||||||||
Net interest income after provision for loan losses | 2,248 | 2,236 | 8,976 | 7,611 | 6,685 | 6,714 | 6,480 | ||||||||||||||||
Noninterest income | 1,061 | (504 | ) | 2,999 | 2,224 | 2,261 | 2,165 | 2,059 | |||||||||||||||
Noninterest expense | 2,103 | 1,849 | 8,563 | 7,063 | 6,614 | 6,465 | 6,181 | ||||||||||||||||
Income (loss) before income taxes | 1,206 | (117 | ) | 3,412 | 2,772 | 2,332 | 2,414 | 2,358 | |||||||||||||||
Income tax expense (benefit) | 362 | (17 | ) | 1,024 | 662 | 554 | 629 | 615 | |||||||||||||||
Net income (loss) | $ | 844 | $ | (100 | ) | $ | 2,388 | $ | 2,110 | $ | 1,778 | $ | 1,785 | $ | 1,743 | ||||||||
Earnings (loss) per share: | |||||||||||||||||||||||
Basic | $ | 0.79 | $ | (0.09 | ) | $ | 2.23 | $ | 1.97 | $ | 1.66 | $ | 1.66 | $ | 1.55 | ||||||||
Diluted | $ | 0.69 | $ | (0.08 | ) | $ | 1.96 | $ | 1.74 | $ | 1.47 | $ | 1.48 | $ | 1.45 | ||||||||
Source: Eagle Montana, preliminary prospectus.
8
FELDMAN FINANCIAL ADVISORS, INC.
Table 3
Selected Financial and Performance Ratios
For the Three Months Ended September 30, 2008 and 2009
For the Years Ended December 31, 2005 to 2009
| At or For the Three Months Ended September 30, (1) | At or For the Year Ended June 30, | ||||||||||||||||||||
| 2009 | 2008 | 2009 | 2008 | 2007 | 2006 | 2005 | |||||||||||||||
Financial Ratios and Other Data: | |||||||||||||||||||||
Return on average assets (2) | 1.14 | % | (0.14 | )% | 0.84 | % | 0.83 | % | 0.75 | % | 0.83 | % | 0.86 | % | |||||||
Return on average equity (3) | 11.60 | % | (1.59 | )% | 9.19 | % | 8.25 | % | 7.41 | % | 7.88 | % | 7.48 | % | |||||||
Net interest rate spread (4) | 3.40 | % | 3.26 | % | 3.34 | % | 2.84 | % | 2.76 | % | 3.21 | % | 3.36 | % | |||||||
Net interest margin (5) | 3.58 | % | 3.50 | % | 3.52 | % | 3.15 | % | 3.06 | % | 3.41 | % | 3.51 | % | |||||||
Noninterest expense to average assets | 2.86 | % | 2.67 | % | 3.00 | % | 2.77 | % | 2.79 | % | 3.01 | % | 3.06 | % | |||||||
Efficiency ratio | 63.55 | % | 106.76 | % | 71.51 | % | 71.81 | % | 73.93 | % | 72.81 | % | 72.39 | % | |||||||
Noninterest income to average assets | 1.44 | x | (0.73 | )x | 1.05 | x | 0.87 | x | 0.95 | x | 1.01 | x | 1.02 | x | |||||||
Dividend payout ratio (6) | 13.15 | % | NM | 18.21 | % | 19.67 | % | 21.71 | % | 20.11 | % | 20.83 | % | ||||||||
Net interest income to noninterest expense | 1.13 | x | 1.21 | x | 1.08 | x | 1.05 | x | 1.01 | x | 1.04 | x | 1.05 | x | |||||||
Average interest-earning assets to average interest-bearing liabilities | 1.085 | x | 1.096 | x | 1.078 | x | 1.108 | x | 1.107 | x | 1.107 | x | 1.112 | x | |||||||
Nonperforming loans to net loans receivable | 0.93 | % | 0.04 | % | 0.75 | % | 0.02 | % | 0.13 | % | 0.33 | % | 0.47 | % | |||||||
Nonperforming assets to total assets | 0.52 | % | 0.03 | % | 0.43 | % | 0.01 | % | 0.09 | % | 0.20 | % | 0.24 | % | |||||||
Allowance for loan losses to net loans receivable | 0.37 | % | 0.17 | % | 0.31 | % | 0.18 | % | 0.33 | % | 0.38 | % | 0.54 | % | |||||||
Allowance for loan losses to nonperforming loans | 39.56 | % | 400.00 | % | 41.90 | % | 937.50 | % | 244.34 | % | 141.91 | % | 132.03 | % | |||||||
Average capital to average assets | 9.78 | % | 9.06 | % | 9.09 | % | 10.02 | % | 10.12 | % | 10.54 | % | 11.55 | % | |||||||
Capital to total assets | 10.12 | % | 8.51 | % | 9.59 | % | 9.16 | % | 9.84 | % | 9.97 | % | 10.79 | % | |||||||
Tangible equity to tangible assets | 10.12 | % | 8.51 | % | 9.59 | % | 9.16 | % | 9.84 | % | 9.97 | % | 10.49 | % | |||||||
Number of branch offices | 7 | 5 | 6 | 5 | 5 | 5 | 5 | ||||||||||||||
| (1) | Ratios are annualized where appropriate. |
| (2) | Represents net income divided by average total assets. |
| (3) | Represents net income divided by average equity. |
| (4) | Represents average yield on interest-earning assets less average cost of interest-bearing liabilities. |
| (5) | Represents net interest income as a percentage of average interest-earning assets. |
| (6) | The dividend payout ratio represents dividends declared per share divided by net income per share. |
Source: Eagle Montana, preliminary prospectus.
9
FELDMAN FINANCIAL ADVISORS, INC.
Asset Composition
The Company’s total assets experienced relatively steady growth, increasing by a compound annual rate of 8.5% from $206.4 million at June 30, 2005 to $300.7 million at September 30, 2009. The net asset expansion of approximately $94.3 million over this period occurred primarily in the loan portfolio. The loan portfolio increased from $106.8 million at June 30, 2005 to $168.2 million at September 30, 2009, an increase of $61.3 million. The ratio of loans to total assets increased from 51.8% at June 30, 2005 to 55.9% at September 30, 2009.
Comparison of Financial Condition at September 30, 2009 and June 30, 2009
Total assets increased by $10.97 million, or 3.79%, to $300.68 million at September 30, 2009, from $289.71 million at June 30, 2009. Total liabilities increased by $8.34 million to $270.25 million at September 30, 2009, from $261.92 million at June 30, 2009. Total equity increased $2.64 million to $30.43 million at September 30, 2009, from $27.79 million at June 30, 2009.
Loans receivable increased $988,000, or 0.59%, to $168.19 million at September 30, 2009 from $167.20 million at June 30, 2009. Commercial real estate loans were the loan category with the largest increase, $2.05 million, while residential mortgage loans decreased $2.51 million. Real estate construction loans also increased $1.48 million. Most other loan categories showed modest changes. Total loan originations were $43.07 million for the three months ended September 30, 2009, with single family mortgages accounting for $29.02 million of the total. Home equity and construction loan originations totaled $4.17 million and $2.5 million, respectively, for the same period. Commercial real estate and land loan originations totaled $3.47 million. Loans held-for-sale decreased to $3.49 million at September 30, 2009, from $5.35 million at June 30, 2009.
10
FELDMAN FINANCIAL ADVISORS, INC.
Deposits grew $7.88 million, or 4.21%, to $195.08 million at September 30, 2009 from $187.20 million at June 30, 2009. Growth in certificates of deposit and non-interest checking, interest-bearing checking accounts, and savings accounts contributed to the increase in deposits. Money market accounts declined slightly. Advances from the Federal Home Loan Bank of Seattle and other borrowings decreased $417,000, or 0.62%, to $66.64 million at September 30, 2009 from $67.06 million at June 30, 2009.
The increase in total equity was the result of net income of $844,000 for the three months ended September 30, 2009 and an increase in other comprehensive income of $1.89 million (mainly due to an increase in net unrealized gain on securities available-for-sale), offset by dividends paid, consisting of a $0.26 per share regular cash dividend, and treasury stock purchases.
Comparison of Financial Condition at June 30, 2009 and June 30, 2008
Total assets increased $9.80 million, or 3.50%, to $289.71 million at June 30, 2009, compared to $279.91 million at June 30, 2008. Total liabilities increased by $7.64 million, or 3.01%, to $261.92 million at June 30, 2009, from $254.27 million at June 30, 2008. The loan portfolio decreased $952,000 during the year. Total deposits increased $8.35 million. Noninterest checking increased $385,000 or 2.63%, to $15.00 million at June 30, 2009, and money market accounts increased $1.61 million, or 6.37%. Interest bearing checking and certificates of deposits increased $1.94 million, or 7.68%, and $1.87 million, or 2.22%, respectively. These increased deposits funded much of the asset growth.
11
FELDMAN FINANCIAL ADVISORS, INC.
Loans receivable decreased $952,000, or 0.57% to $167.20 million from $168.15 million. Significant refinancing activity contributed to the lower loan balances. $131.23 million in loans were sold during fiscal year 2009, an increase of $79.16 million from fiscal year 2008’s amount of $52.07 million. Origination activity on all loan categories with the exception of real estate construction loans and home equity loans increased in the current fiscal year. Commercial real estate and land loans increased $8.51 million during the year, and residential mortgage loans decreased $7.52 million. The available-for-sale investment portfolio increased $3.85 million, or 4.90%, to $82.26 million at June 30, 2009 from $78.42 million at June 30, 2008. The investment category with the largest increase was municipal obligations, which increased $6.70 million.
Total deposits increased $8.35 million. Of that amount, certificates of deposit increased $1.87 million, to $86.20 million at June 30, 2009 from $84.33 million at June 30, 2008. The Bank had no brokered deposits as of June 30, 2009. Interest-earning checking accounts increased $1.94 million while noninterest checking increased $385,000. Money market accounts increased $1.61 million and savings accounts increased $2.54 million. Deposit growth is expected to continue to be difficult to achieve due to fierce competition among financial institutions in the Bank’s markets. Advances from the Federal Home Loan Bank and other borrowings decreased to $67.06 million at year-end 2009 from $68.22 million at year-end 2008, a decrease of $1.17 million.
Total shareholders’ equity was $27.79 million at June 30, 2009, an increase of $2.16 million. This increase was the result of net income for the year and a decrease in accumulated other comprehensive loss of $240,000 (mainly due to a decrease in net unrealized loss on securities available-for-sale), partially offset by the purchase of treasury stock and dividends paid during the year.
12
FELDMAN FINANCIAL ADVISORS, INC.
Table 4 and Exhibit II-3 analyze the composition of the loan portfolio by loan category at the dates indicated. American Federal Savings Bank primarily originates one- to four-family residential real estate loans and, to a lesser extent, commercial real estate loans, real estate construction loans, home equity loans, consumer loans and commercial loans. Commercial real estate loans include loans on multi-family dwellings, loans on nonresidential property and loans on developed and undeveloped land. Home equity loans include loans secured by the borrower’s primary residence. Typically, the property securing such loans is subject to a prior lien. Consumer loans consist of loans secured by collateral other than real estate, such as automobiles, recreational vehicles and boats. Personal loans and lines of credit are made on deposits held by American Federal Savings Bank and on an unsecured basis. Commercial loans consist of business loans and lines of credit on a secured and unsecured basis.
13
FELDMAN FINANCIAL ADVISORS, INC.
Table 4
Loan Portfolio
As of September 30, 2009 and June 30, 2005 to 2009
(Dollars in Thousands)
| At June 30, | ||||||||||||||||||||||||||||||||||||||||||
| At September 30, 2009 | 2009 | 2008 | 2007 | 2006 | 2005 | |||||||||||||||||||||||||||||||||||||
| Amount | Percent of Total | Amount | Percent of Total | Amount | Percent of Total | Amount | Percent of Total | Amount | Percent of Total | Amount | Percent of Total | |||||||||||||||||||||||||||||||
Real estate loans: | ||||||||||||||||||||||||||||||||||||||||||
Residential mortgage (1-4 family) | $ | 76,711 | 45.46 | % | $ | 79,216 | 47.26 | % | $ | 86,751 | 51.53 | % | $ | 81,958 | 51.68 | % | $ | 75,913 | 53.71 | % | $ | 56,533 | 52.68 | % | ||||||||||||||||||
Real estate construction | 6,119 | 3.63 | % | 4,642 | 2.77 | % | 7,317 | 4.35 | % | 8,253 | 5.20 | % | 6,901 | 4.88 | % | 2,723 | 2.54 | % | ||||||||||||||||||||||||
Commercial real estate and land | 38,761 | 22.97 | % | 36,713 | 21.90 | % | 28,197 | 16.75 | % | 25,621 | 16.16 | % | 18,648 | 13.20 | % | 14,779 | 13.77 | % | ||||||||||||||||||||||||
Total real estate loans | 121,591 | 72.06 | % | 120,571 | 71.93 | % | 122,265 | 72.62 | % | 115,832 | 73.04 | % | 101,462 | 71.79 | % | 74,035 | 68.99 | % | ||||||||||||||||||||||||
Other loans: | ||||||||||||||||||||||||||||||||||||||||||
Home equity | 28,836 | 17.09 | % | 28,676 | 17.11 | % | 28,034 | 16.65 | % | 24,956 | 15.74 | % | 20,191 | 14.29 | % | 16,801 | 15.66 | % | ||||||||||||||||||||||||
Consumer | 11,074 | 6.56 | % | 10,835 | 6.46 | % | 11,558 | 6.87 | % | 11,438 | 7.21 | % | 11,820 | 8.36 | % | 10,909 | 10.16 | % | ||||||||||||||||||||||||
Commercial business | 7,244 | 4.29 | % | 7,541 | 4.50 | % | 6,502 | 3.86 | % | 6,366 | 4.01 | % | 7,861 | 5.56 | % | 5,568 | 5.19 | % | ||||||||||||||||||||||||
Total other loans | 47,154 | 27.94 | % | 47,052 | 28.07 | % | 46,094 | 27.38 | % | 42,760 | 26.96 | % | 39,872 | 28.21 | % | 33,278 | 31.01 | % | ||||||||||||||||||||||||
Total gross loans | $ | 168,745 | 100.00 | % | $ | 167,623 | 100.00 | % | $ | 168,359 | 100.00 | % | $ | 158,592 | 100.00 | % | $ | 141,334 | 100.00 | % | $ | 107,313 | 100.00 | % | ||||||||||||||||||
Less: | ||||||||||||||||||||||||||||||||||||||||||
Deferred loan fees | (65 | ) | (99 | ) | (90 | ) | (66 | ) | (59 | ) | (99 | ) | ||||||||||||||||||||||||||||||
Allowance for loan losses | 625 | 525 | 300 | 518 | 535 | 573 | ||||||||||||||||||||||||||||||||||||
Total loans, net | $ | 168,185 | $ | 167,197 | $ | 168,149 | $ | 158,140 | $ | 140,858 | $ | 106,839 | ||||||||||||||||||||||||||||||
Source: Eagle Montana, preliminary prospectus.
14
FELDMAN FINANCIAL ADVISORS, INC.
Residential Lending. American Federal Savings Bank’s primary lending activity consists of the origination of one- to four-family residential mortgage loans secured by property located in American Federal Savings Bank’s market area. Approximately 45.46% of American Federal Savings Bank’s total loan portfolio as of September 30, 2009 was comprised of such loans. American Federal Savings Bank generally originates one- to-four-family residential mortgage loans in amounts up to 80% of the lesser of the appraised value or the selling price of the mortgaged property without requiring private mortgage insurance. A mortgage loan originated by American Federal Savings Bank, whether fixed rate or adjustable rate, can have a term of up to 30 years. American Federal Savings Bank holds substantially all of its adjustable rate and its 8, 10 and 12-year fixed rate loans in portfolio. Adjustable rate loans limit the periodic interest rate adjustment and the minimum and maximum rates that may be charged over the term of the loan. American Federal Savings Bank’s fixed rate 15-year and 20-year loans are held in portfolio or sold in the secondary market depending on market conditions. Generally, all 30-year fixed rate loans are sold in the secondary market.
American Federal Savings Bank obtains a significant portion of its noninterest income from servicing loans sold. American Federal Savings Bank offers many of the fixed rate loans it originates for sale in the secondary market on a servicing retained basis. This means that we process the borrower’s payments and send them to the purchaser of the loan. This retention of servicing enables American Federal Savings Bank to increase fee income and maintain a relationship with the borrower. At September 30, 2009, American Federal Savings Bank had $272.30 million in residential mortgage loans and $12.33 million in commercial real estate loans sold with servicing retained. American Federal Savings Bank does not ordinarily purchase home mortgage loans from other financial institutions.
15
FELDMAN FINANCIAL ADVISORS, INC.
State certified and licensed independent appraisers who are approved annually by the board of directors make property appraisals on real estate securing American Federal Savings Bank’s single-family residential loans. Appraisals are performed in accordance with applicable regulations and policies. American Federal Savings Bank generally obtains title insurance policies on all first mortgage real estate loans originated. On occasion, refinancings of mortgage loans are approved using title reports instead of title insurance. Title reports are also allowed on home equity loans. Borrowers generally remit funds with each monthly payment of principal and interest, to a loan escrow account from which American Federal Savings Bank makes disbursements for such items as real estate taxes and hazard and mortgage insurance premiums as they become due.
Home Equity Loans. American Federal Savings Bank also originates home equity loans. These loans are secured by the borrowers’ primary residence, but are typically subject to a prior lien, which may or may not be held by American Federal Savings Bank. At September 30, 2009, $28.84 million or 17.1% of the Bank’s total loans were home equity loans. Borrowers may use the proceeds from American Federal Savings Bank’s home equity loans for many purposes, including home improvement, debt consolidation, or other purchasing needs. American Federal Savings Bank offers fixed rate, fixed payment home equity loans as well as variable and fixed rate home equity lines of credit. Fixed-rate home equity loans typically have terms of no longer than fifteen years.
16
FELDMAN FINANCIAL ADVISORS, INC.
Although home equity loans are secured by real estate, they carry a greater risk than first lien residential mortgages because of the existence of a prior lien on the property securing the loan, as well as the flexibility the borrower has with respect to the loan proceeds. American Federal Savings Bank attempts to minimize this risk by maintaining conservative underwriting policies on such loans. The Bank generally makes home equity loans for up to only 85% of appraised value of the underlying real estate collateral, less the amount of any existing prior liens on the property securing the loan.
Commercial Real Estate and Land Loans. American Federal Savings Bank originates commercial real estate mortgage and land loans, including both developed and undeveloped land loans, and loans on multi-family dwellings. Commercial real estate and land loans made up 22.97% of American Federal Savings Bank’s total loan portfolio, or $38.76 million at September 30, 2009. The majority of these loans are non-residential commercial real estate loans. American Federal Savings Bank’s commercial real estate mortgage loans are primarily permanent loans secured by improved property such as office buildings, retail stores, commercial warehouses and apartment buildings. The terms and conditions of each loan are tailored to the needs of the borrower and based on the financial strength of the project and any guarantors. Generally, commercial real estate loans originated by American Federal Savings Bank will not exceed 75% of the appraised value or the selling price of the property, whichever is less. Typically, the loans have fixed rates of interest and 5- to 15-year maturities. Upon maturity, the loan is repaid or the terms and conditions are renegotiated. Generally, all originated commercial real estate loans are within the market area of American Federal Savings Bank and all are within the state of Montana. American Federal Savings Bank’s largest single commercial real estate loan had a balance of approximately $1.65 million on September 30, 2009, and is secured by a residential lot subdivision.
17
FELDMAN FINANCIAL ADVISORS, INC.
Real Estate Construction Lending. American Federal Savings Bank also lends funds for the construction of one- to four-family homes and commercial real estate. Real estate construction loans are made both to individual homeowners for the construction of their primary residence and, to a lesser extent, to local builders for the construction of pre-sold houses or houses that are being built for sale in the future. Real estate construction loans accounted for $6.12 million or 3.63% of American Federal Savings Bank’s total loan portfolio at September 30, 2009.
Consumer Loans. As part of its strategy to invest in higher yielding shorter term loans, American Federal Savings Bank emphasized growth of its consumer lending portfolio in recent years. This portfolio includes personal loans secured by collateral other than real estate, unsecured personal loans and lines of credit, and loans secured by deposits held by American Federal Savings Bank. As of September 30, 2009, consumer loans totaled $11.07 million or 6.56% of American Federal Savings Bank’s total loan portfolio. These loans consist primarily of auto loans, RV loans, boat loans, personal loans and credit lines and deposit account loans. Consumer loans are originated in American Federal Savings Bank’s market area and generally have maturities of up to seven years. For loans secured by savings accounts, American Federal Savings Bank will lend up to 90% of the account balance on single payment loans and up to 100% for monthly payment loans.
Consumer loans have a shorter term and generally provide higher interest rates than residential mortgage loans. Consumer loans can be helpful in improving the spread between average loan yield and cost of funds and at the same time improve the matching of the maturities of rate sensitive assets and liabilities. Increasing its consumer loans has been a major part of American Federal Savings Bank’s strategy of operating more like a commercial bank than a traditional savings bank.
18
FELDMAN FINANCIAL ADVISORS, INC.
The underwriting standards employed by American Federal Savings Bank for consumer loans include a determination of the applicant’s credit history and an assessment of the applicant’s ability to meet existing obligations and payments on the proposed loan. The stability of the applicant’s monthly income may be determined by verification of gross monthly income from primary employment, and additionally from any verifiable secondary income. Creditworthiness of the applicant is of primary consideration; however, the underwriting process also includes a comparison of the value of the collateral in relation to the proposed loan amount.
Commercial Business Loans. Commercial business loans amounted to $7.24 million, or 4.29% of American Federal Savings Bank’s total loan portfolio at September 30, 2009. American Federal Savings Bank’s commercial business loans are traditional business loans and are not secured by real estate. Such loans may be structured as unsecured lines of credit or may be secured by inventory, accounts receivable or other business assets. While the commercial business loan portfolio amounted to only 4.29% of the total portfolio at September 30, 2009, American Federal Savings Bank intends to increase such lending by focusing on market segments which it has not previously emphasized, such as business loans to doctors, lawyers, architects and other professionals as well as to small businesses within its market area. Management believes that this strategy provides opportunities for growth, without significant additional cost outlays for staff and infrastructure.
19
FELDMAN FINANCIAL ADVISORS, INC.
Commercial business loans of this nature usually involve greater credit risk than one- to four-family residential mortgage loans the Bank originates. The collateral we receive is typically related directly to the performance of the borrower’s business, which means that repayment of commercial business loans is dependent on the successful operations and income stream of the borrower’s business. Such risks can be significantly affected by economic conditions. In addition, commercial lending generally requires substantially greater oversight efforts compared to residential real estate lending.
Loans to One Borrower. Under federal law, savings institutions have, subject to certain exemptions, lending limits to one borrower in an amount equal to the greater of $500,000 or 15% of the institution’s unimpaired capital and surplus. As of September 30, 2009, the Bank’s largest aggregation of loans to one borrower was approximately $8.47 million, consisting of two commercial real estate loans secured by detention facilities. Ninety percent, or $6.49 million, of one loan was sold to the Montana Board of Investments, leaving a net balance of $1.97 million for the two loans, which was below American Federal Savings Bank’s federal legal lending limit to one borrower of approximately $4.20 million. At September 30, 2009, these loans were performing in accordance to their terms. American Federal Savings Bank maintains the servicing for these loans.
Table 5 on the following page details total loans originated, purchased, sold and repaid during the periods indicated. Gross loan originations totaled $228.0 million for the fiscal year ended June 30, 2009 compared to $143.6 million for the year ended June 30, 2008. For the first three months of 2009, originations have totaled $43.1 million as compared to 36.7 million in the first three months of 2008. As compared to prior years, loan originations have increased, primarily in the category of residential mortgages.
20
FELDMAN FINANCIAL ADVISORS, INC.
Table 5
Loan Originations
For the Three Months Ended September 30, 2008 and 2009
For the Years Ended June 30, 2008 to 2009
(Dollars in Thousands)
| Three Months Ended September 30, | Year Ended June 30, | ||||||||||||||
| 2009 | 2008 | 2009 | 2008 | ||||||||||||
Loans originated | |||||||||||||||
Real estate loans: | |||||||||||||||
Residential mortgage (1-4 family) | $ | 29,017 | $ | 17,981 | $ | 164,657 | $ | 72,385 | |||||||
Real estate construction | 2,504 | 1,934 | 4,672 | 15,504 | |||||||||||
Commercial real estate and land | 3,466 | 9,042 | 21,500 | 19,375 | |||||||||||
Home equity | 4,167 | 4,860 | 20,043 | 20,461 | |||||||||||
Consumer | 2,000 | 1,748 | 8,341 | 7,637 | |||||||||||
Commercial business | 1,913 | 1,143 | 8,789 | 8,243 | |||||||||||
Total loans originated | 43,067 | 36,708 | 228,002 | 143,605 | |||||||||||
Loans purchased | |||||||||||||||
Whole loans | — | — | — | — | |||||||||||
Participations | — | — | — | — | |||||||||||
Total loans purchased | — | — | — | — | |||||||||||
Loans sold | |||||||||||||||
Whole loans | 28,135 | 10,517 | 125,232 | 47,732 | |||||||||||
Participations | — | 6,000 | 6,000 | 4,341 | |||||||||||
Total loans sold | 28,135 | 16,517 | 131,232 | 52,073 | |||||||||||
Principal repayments and loan refinancings | 15,733 | 15,351 | 99,509 | 75,522 | |||||||||||
Deferred loan fees decrease (increase) | 34 | 5 | (9 | ) | (24 | ) | |||||||||
Allowance for losses decrease (increase) | (100 | ) | — | (225 | ) | 218 | |||||||||
Net loan increase (decrease) | ($ | 867 | ) | $ | 4,845 | ($ | 2,973 | ) | $ | 16,204 | |||||
Net loans receivable at end of period | |||||||||||||||
(includes loans held for sale) | $ | 171,679 | $ | 180,364 | $ | 172,546 | $ | 175,519 | |||||||
Source: Eagle Montana, preliminary prospectus.
21
FELDMAN FINANCIAL ADVISORS, INC.
Exhibit II-4 and Table 6 present a summary of the Company’s investment portfolio as of September 30, 2009 and June 30, 2007 to 2009. Federally chartered savings banks such as American Federal Savings Bank have the authority to invest in various types of investment securities, including United States Treasury obligations, securities of various Federal agencies (including securities collateralized by mortgages), certificates of deposits of insured banks and savings institutions, municipal securities, corporate debt securities and loans to other banking institutions.
American Federal Savings Bank maintains liquid assets that may be invested in specified short-term securities and other investments. Liquidity levels may be increased or decreased depending on the yields on investment alternatives. They may also be increased based on management’s judgment as to the attractiveness of the yields then available in relation to other opportunities. Liquidity levels can also change based on management’s expectation of future yield levels, as well as management’s projections as to the short-term demand for funds to be used in American Federal Savings Bank’s loan origination and other activities. American Federal Savings Bank maintains an investment securities portfolio and a mortgage-backed securities portfolio as part of its investment portfolio.
The investment policy of American Federal Savings Bank, which is established by the board of directors, is designed to foster earnings and liquidity within prudent interest rate risk guidelines, while complementing American Federal Savings Bank’s lending activities. The policy provides for available-for-sale (including those accounted for under FASB ASC 825), held-to-maturity, and trading classifications. However, American Federal Savings Bank does not hold any securities for purposes of trading. The policy permits investments in high credit quality instruments with diversified cash flows while permitting the Bank to maximize total return
22
FELDMAN FINANCIAL ADVISORS, INC.
within the guidelines set forth in the interest rate risk and liquidity management policies. Permitted investments include but are not limited to U.S. government obligations, government agency or government-sponsored enterprise obligations, state, county and municipal obligations, and mortgage-backed securities. Collateralized mortgage obligations, investment grade corporate debt securities, and commercial paper are also included. The Bank also invests in Federal Home Loan Bank overnight deposits and federal funds, but these instruments are not considered part of the investment portfolio.
The investment policy also includes several specific guidelines and restrictions to insure adherence with safe and sound activities. The policy prohibits investments in high-risk mortgage derivative products (as defined within the policy) without prior approval from the board of directors. Management must demonstrate the business advantage of such investments.
The Bank does not participate in hedging programs, interest rate swaps, or other activities involving the use of off-balance sheet derivative financial instruments, except interest rate caps and certain financial instruments designated as cash flow hedges related to loans committed to be sold in the secondary market. Further, American Federal Savings Bank does not invest in securities that are not initially rated investment grade.
The Board, through its asset liability committee, has charged the President and CEO to implement the investment policy. All transactions are reported to the board of directors monthly, as well as the current composition of the portfolio, including market values and unrealized gains and losses.
23
FELDMAN FINANCIAL ADVISORS, INC.
The Bank maintains a portfolio of investment securities, classified as either available-for-sale (including those accounted for under FASB ASC 825) or held-to-maturity to enhance total return on investments. At September 30, 2009, investment securities included U.S. government and agency obligations, Small Business Administration pools, municipal securities, mortgage-backed securities, collateralized mortgage obligations and corporate obligations, all with varying characteristics as to rate, maturity and call provisions. Investment securities held-to-maturity represented 0.28% of American Federal Savings Bank’s total investment portfolio. Securities available-for-sale totaled 96.91% of American Federal Savings Bank’s total investment portfolio. The largest categories of securities available-for-sale are collateralized mortgage obligations, 36.8% of total securities, and municipal obligations, which total 35.7% of total securities.
Table 6
Securities Portfolio
As of September 30, 2009 and June 30, 2007 to 2009
(Dollars in Thousands)
| At September 30, | At June 30, | |||||||||||||||||||||||
| 2009 | 2009 | 2008 | 2007 | |||||||||||||||||||||
| Carrying Value | of Total | Carrying Value | of Total | Carrying Value | of Total | Carrying Value | of Total | |||||||||||||||||
Securities available-for-sale, at fair value: | ||||||||||||||||||||||||
U.S. Government and agency obligations | $ | 4,930 | 5.17 | % | $ | 3,882 | 4.57 | % | $ | 2,232 | 2.70 | % | $ | 3,643 | 5.41 | % | ||||||||
Corporate obligations | 10,037 | 10.52 | % | 9,493 | 11.18 | % | 12,722 | 15.38 | % | 13,623 | 20.22 | % | ||||||||||||
Municipal obligations | 34,036 | 35.67 | % | 28,893 | 34.04 | % | 22,190 | 26.83 | % | 20,728 | 30.77 | % | ||||||||||||
Collateralized mortgage obligations | 35,112 | 36.80 | % | 31,551 | 37.17 | % | 28,224 | 34.17 | % | 17,075 | 25.35 | % | ||||||||||||
Mortgage-backed securities | 7,985 | 8.37 | % | 8,444 | 9.95 | % | 13,016 | 15.74 | % | 7,872 | 11.68 | % | ||||||||||||
Common Stock | — | — | — | — | 33 | — | — | — | ||||||||||||||||
Corporate preferred stock | — | — | — | — | — | — | 1,833 | 2.72 | % | |||||||||||||||
Total securities available for sale | 92,100 | 96.52 | % | 82,263 | 96.91 | % | 78,417 | 94.82 | % | 64,774 | 96.15 | % | ||||||||||||
Securities held-to-maturity, at book value: | ||||||||||||||||||||||||
Mortgage-backed securities | — | — | — | — | 22 | 0 | 95 | 0.14 | % | |||||||||||||||
Municipal obligations | 265 | 0.28 | % | 375 | 0.44 | % | 675 | 0.82 | % | 826 | 1.23 | % | ||||||||||||
Total securities held to maturity | 265 | 0.28 | % | 375 | 0.44 | % | 697 | 0.85 | % | 921 | 1.37 | % | ||||||||||||
Preferred stock | 108 | 0.11 | % | 25 | 0.03 | % | 1,321 | 1.60 | % | N/A | N/A | |||||||||||||
Total securities | 92,473 | 96.91 | % | 82,663 | 97.38 | % | 80,435 | 97.27 | % | 65,695 | 98.00 | % | ||||||||||||
FHLB stock, at cost | 2,000 | 2.10 | % | 2,000 | 2.36 | % | 1,715 | 2.07 | % | 1,315 | 1.95 | % | ||||||||||||
Interest-bearing deposits | 944 | 0.99 | % | 224 | 0.26 | % | 549 | 0.66 | % | 360 | 0.53 | % | ||||||||||||
Total | $ | 95,417 | 100.00 | % | $ | 84,887 | 100.00 | % | $ | 82,699 | 100.00 | % | $ | 67,370 | 100.00 | % | ||||||||
Source: Eagle Montana, preliminary prospectus.
24
FELDMAN FINANCIAL ADVISORS, INC.
Table 7 sets forth certain information regarding the carrying values, weighted average yields and maturities of the Bank’s securities portfolio at September 30, 2009. This table shows contractual maturities and does not reflect repricing or the effect of prepayments.
Liability Composition
Deposits are the Company’s major external source of funds for lending and other investment purposes. Exhibit II-5 and Table 8 present a summary of the Company’s deposit composition as of June 30, 2007 to 2009 and September 30, 2009. Total deposits amounted to $195.1 million or 64.9% of total assets and 72.2% of total liabilities at September 30, 2009.
The Bank offers a variety of deposit accounts. Deposit account terms vary, primarily as to the required minimum balance amount, the amount of time that the funds must remain on deposit and the applicable interest rate.
Current deposit products include certificates of deposit accounts ranging in terms from 90 days to five years as well as checking, savings and money market accounts. Individual retirement accounts (IRAs) are included in certificates of deposit.
Deposits are obtained primarily from residents of Helena, Bozeman, Butte and Townsend. The Bank believes it is able to attract deposit accounts by offering outstanding service, competitive interest rates and convenient locations and service hours. The Bank uses traditional methods of advertising to attract new customers and deposits, including radio, television, print media advertising and sales training and incentive programs for employees. Management believes that non-residents of Montana hold an insignificant number of deposit accounts.
25
FELDMAN FINANCIAL ADVISORS, INC.
Table 7
Securities Portfolio by Contractual Maturity
As of September 30, 2009
(Dollars in Thousands)
| At September 30, 2009 | |||||||||||||||||||||||||||||||||
| One Year or Less | One to Five Years | Five to Ten Years | More than Ten Years | Total Investment Securities | |||||||||||||||||||||||||||||
| Carrying Value | Weighted Average Yield | Carrying Value | Weighted Average Yield | Carrying Value | Weighted Average Yield | Carrying Value | Weighted Average Yield | Carrying Value | Approximate Market Value | Weighted Average Yield | |||||||||||||||||||||||
Securities available-for-sale: | |||||||||||||||||||||||||||||||||
U.S. Gov’t and agency obligations | $ | 3,659 | 1.76 | % | $ | 831 | 1.06 | % | $ | 440 | 0.94 | % | $ | 4,930 | $ | 7,930 | 1.57 | % | |||||||||||||||
Corporate obligations | 7,263 | 4.90 | % | 1,053 | 5.45 | % | 1,721 | 7.51 | % | 10,037 | 10,037 | 5.41 | % | ||||||||||||||||||||
Municipal obligations | 2,399 | 2.78 | % | 7,532 | 5.59 | % | 24,105 | 6.70 | % | 34,036 | 34,036 | 6.18 | % | ||||||||||||||||||||
Collateralized mortgage obligations | $ | 106 | 2.60 | % | 3,697 | 3.20 | % | 31,309 | 4.70 | % | 35,112 | 35,112 | 4.54 | % | |||||||||||||||||||
Mortgage-backed securities | 194 | 4.29 | % | 396 | 3.75 | % | 101 | 5.38 | % | 7,294 | 5.20 | % | 7,985 | 7,985 | 5.11 | % | |||||||||||||||||
Total securities available for sale | 300 | 3.69 | % | 13,717 | 3.66 | % | 13,214 | 4.62 | % | 64,869 | 5.55 | % | 92,100 | 92,100 | 5.13 | % | |||||||||||||||||
Securities-held to-maturity: | |||||||||||||||||||||||||||||||||
Municipal obligations | 265 | 7.33 | % | 265 | 271 | 7.33 | % | ||||||||||||||||||||||||||
Total securities held to maturity | 265 | 7.33 | % | 265 | 271 | 7.33 | % | ||||||||||||||||||||||||||
Preferred – SFAS 159 | 108 | 108 | 108 | % | |||||||||||||||||||||||||||||
Total securities | 300 | 3.69 | % | 13,982 | 3.73 | % | 13,214 | 4.62 | % | 64,977 | 5.54 | % | 92,473 | 92,479 | 5.13 | % | |||||||||||||||||
Interest-bearing deposits & Federal funds sold | 4,155 | 0.59 | % | 4,155 | 4,155 | 0.59 | % | ||||||||||||||||||||||||||
Federal Home Loan Bank capital stock | 2,000 | ||||||||||||||||||||||||||||||||
Total | $ | 4,455 | 0.80 | % | $ | 13,982 | 3.73 | % | $ | 13,214 | 4.62 | % | $ | 66,977 | 5.37 | % | $ | 96,628 | $ | 96,634 | 4.93 | % | |||||||||||
Source: Eagle Montana, preliminary prospectus.
26
FELDMAN FINANCIAL ADVISORS, INC.
Table 8
Deposit Portfolio
As of September 30, 2009
And June 30, 2007 to 2009
| At September 30, 2009 | At June 30, | |||||||||||||||||||||||||||||||||||
| 2009 | 2008 | 2007 | ||||||||||||||||||||||||||||||||||
| Amount | Percent of Total | Weighted Average Rate | Amount | Percent of Total | Weighted Average Rate | Amount | Percent of Total | Weighted Average Amount | Amount | Percent of Total | Weighted Average Amount | |||||||||||||||||||||||||
Noninterest checking | $ | 18,902 | 9.69 | % | — | $ | 15,002 | 8.01 | % | — | $ | 14,617 | 8.17 | % | — | $ | 13,694 | 7.62 | % | — | ||||||||||||||||
Passbook savings | 26,979 | 13.83 | % | 0.41 | % | 26,445 | 14.13 | % | 0.41 | % | 23,906 | 13.37 | % | 0.65 | % | 22,521 | 12.54 | % | 0.65 | % | ||||||||||||||||
NOW account/Interest bearing checking | 34,785 | 17.83 | % | 0.25 | % | 32,665 | 17.45 | % | 0.33 | % | 30,721 | 17.18 | % | 0.38 | % | 30,954 | 17.23 | % | 0.21 | % | ||||||||||||||||
Money market accounts | 26,730 | 13.70 | % | 0.30 | % | 26,886 | 14.36 | % | 0.64 | % | 25,275 | 14.12 | % | 1.75 | % | 23,292 | 12.96 | % | 2.12 | % | ||||||||||||||||
Total | 107,395 | 55.05 | % | 0.26 | % | 100,997 | 53.95 | % | 0.38 | % | 94,518 | 52.85 | % | 0.76 | % | 90,460 | 50.35 | % | 0.78 | % | ||||||||||||||||
Certificates of deposit accounts: | ||||||||||||||||||||||||||||||||||||
IRA certificates | 23,447 | 12.02 | % | 2.85 | % | 23,121 | 12.35 | % | 2.96 | % | 22,108 | 12.36 | % | 3.15 | % | 21,534 | 11.99 | % | 3.97 | % | ||||||||||||||||
Brokered certificates | — | — | — | — | — | — | — | — | — | 4,411 | 2.46 | % | 5.30 | % | ||||||||||||||||||||||
Other certificates | 64,238 | 32.93 | % | 2.16 | % | 63,081 | 33.70 | % | 2.41 | % | 62,225 | 34.79 | % | 3.31 | % | 63,242 | 35.20 | % | 4.66 | % | ||||||||||||||||
Total certificates of deposit | 87,685 | 44.95 | % | 2.34 | % | 86,202 | 46.05 | % | 2.56 | % | 84,333 | 47.15 | % | 3.27 | % | 89,187 | 49.65 | % | 4.53 | % | ||||||||||||||||
Total deposits | $ | 195,080 | 100.00 | % | 1.19 | % | $ | 187,199 | 100.00 | % | 1.38 | % | $ | 178,851 | 100.00 | % | 1.94 | % | $ | 179,647 | 100.00 | % | 100.00 | % | ||||||||||||
Source: Eagle Montana, preliminary prospectus.
27
FELDMAN FINANCIAL ADVISORS, INC.
The Bank pays interest rates on deposits that are competitive in the market. Interest rates on deposits are set weekly by senior management, based on a number of factors, including: projected cash flow; a current survey of a selected group of competitors’ rates for similar products; external data which may influence interest rates; investment opportunities and loan demand; and scheduled certificate maturities and loan and investment repayments.
Core deposits are deposits that are more stable and somewhat less sensitive to rate changes. They also represent a lower cost source of funds than rate sensitive, more volatile accounts such as certificates of deposit. The Bank believes core deposits are its checking, as well as NOW accounts, statement savings accounts, money market accounts and IRA accounts. Based on historical experience, the Bank includes IRA accounts funded by certificates of deposit as core deposits because they exhibit the principal features of core deposits in that they are stable and generally are not rate sensitive. Core deposits amounted to $130.84 million or 67.07% of American Federal Savings Bank’s deposits at September 30, 2009 ($107.39 million or 55.05% if IRA certificates of deposit are excluded). The presence of a high percentage of core deposits and, in particular, transaction accounts, is part of the Bank’s strategy to restructure its liabilities to more closely resemble the lower cost liabilities of a commercial bank. However, a significant portion of deposits remains in certificate of deposit form. These certificates of deposit, should they mature and be renewed at higher rates, would result in an increase in the cost of funds.
To supplement deposits as a source of funds for lending or investment, the Bank also borrows funds in the form of advances from the Federal Home Loan Bank of Seattle and other borrowings from PNC Financial Services, Inc. to supplement the Bank’s supply of lendable funds and to meet deposit withdrawal requirements.
28
FELDMAN FINANCIAL ADVISORS, INC.
During the fiscal year ended June 30, 2006, Eagle Bancorp formed a special purpose subsidiary, Eagle Bancorp Statutory Trust I (the “Trust”), for the purpose of issuing trust preferred securities in the amount of $5.0 million. Eagle Bancorp has issued subordinated debentures to the Trust, and the coupon on the debentures matches the dividend payment on the trust preferred securities. For regulatory purposes, the securities qualify as Tier 1 Capital, while for accounting purposes they are recorded as long term debt. The securities have a 30 year maturity and carry a fixed coupon of 6.02% for the first five years, at which time the coupon becomes variable, at a spread of 142 basis points over 3 month LIBOR.
Table 9 sets forth certain information regarding borrowings from the Federal Home Loan Bank of Seattle and PNC at the end of, and during, the periods indicated.
Equity Capital
As of September 30, 2009, American Federal Savings Bank’s regulatory capital was in excess of all applicable regulatory requirements and is considered “well capitalized” by regulatory standards. At September 30, 2009, American Federal Savings Bank’s tangible, core, and risk-based capital ratios amounted to 9.45%, 9.45, and 13.72%, respectively, compared to regulatory requirements of 1.5%, 3.0%, and 8.0%, respectively.
29
FELDMAN FINANCIAL ADVISORS, INC.
Table 9
Borrowings
At or for the Three Months Ended September 30, 2008 and 2009
and for the Years Ended June 30, 2007 to 2009
| At or For the Three Months Ended September 30, | At or For the Year Ended June 30, | |||||||||||||||||||
| 2009 | 2008 | 2009 | 2008 | 2007 | ||||||||||||||||
FHLB Advances: | ||||||||||||||||||||
Average balance | $ | 43,778 | $ | 40,351 | $ | 44,144 | $ | 21,964 | $ | 23,435 | ||||||||||
Maximum balance at any month-end | 43,917 | 45,919 | 46,889 | 42,222 | 29,487 | |||||||||||||||
Balance at period end | 43,639 | 45,919 | 44,056 | 42,222 | 16,000 | |||||||||||||||
Weighted average interest rate during the period | 3.70 | % | 3.72 | % | 3.54 | % | 4.21 | % | 5.13 | % | ||||||||||
Weighted average interest rate at period end | 3.69 | % | 3.70 | % | 3.69 | % | 3.57 | % | 4.99 | % | ||||||||||
Repurchase Agreements: | ||||||||||||||||||||
Average balance | 23,000 | 23,000 | 23,000 | 21,347 | 5,493 | |||||||||||||||
Maximum balance at any month-end | 23,000 | 23,000 | 23,000 | 23,000 | 14,000 | |||||||||||||||
Balance at period end | 23,000 | 23,000 | 23,000 | 23,000 | 14,000 | |||||||||||||||
Weighted average interest rate during the period | 4.66 | % | 4.66 | % | 4.66 | % | 4.81 | % | 4.64 | % | ||||||||||
Weighted average interest rate at period end | 4.66 | % | 4.66 | % | 4.66 | % | 4.66 | % | 4.69 | % | ||||||||||
Other: | ||||||||||||||||||||
Average balance | — | 1,081 | 628 | 401 | 143 | |||||||||||||||
Maximum balance at any month-end | — | 2,760 | 3,900 | 3,000 | 3,800 | |||||||||||||||
Balance at period end | — | — | — | 3,000 | 3,800 | |||||||||||||||
Weighted average interest rate during the period | 2.18 | % | 1.28 | % | 3.79 | % | 5.32 | % | ||||||||||||
Weighted average interest rate at period end | n/a | n/a | 3.15 | % | 5.32 | % | ||||||||||||||
Total borrowings: | ||||||||||||||||||||
Average balance | 66,778 | 64,432 | 67,772 | 43,712 | 29,071 | |||||||||||||||
Maximum balance at any month-end | 66,917 | 68,919 | 73,789 | 68,222 | 36,695 | |||||||||||||||
Balance at period end | 66,639 | 68,919 | 67,056 | 68,222 | 33,800 | |||||||||||||||
period | 4.03 | % | 4.03 | % | 3.90 | % | 4.50 | % | 5.04 | % | ||||||||||
Weighted average interest rate at period end | 4.03 | % | 4.02 | % | 4.02 | % | 3.94 | % | 4.90 | % | ||||||||||
Source: Eagle Montana, preliminary prospectus.
30
FELDMAN FINANCIAL ADVISORS, INC.
Income and Expense Trends
Table 10 displays the main components of the Company’s earnings performance over the years ended June 30, 2005 to 2009 and the three-month periods ending September 30, 2008 and 2009. Tables 11 set forth certain average balance and yield information relating to the Company at and for the periods indicated. The average yields and costs are derived by dividing income or expense by the daily average balance of assets or liabilities, respectively, for the periods presented. Table 12 reflects the sensitivity of the Company’s interest income and interest expense to changes in volume and in prevailing interest rates during the periods indicated.
Table 10
Summary Income Statement Data
For the Years Ended June 30, 2005 to 2009
And for the Nine Months Ended September 30, 2008 and 2009
(Dollars in Thousands)
| For the Three Months Ended September 30, | For the Year Ended June 30, | |||||||||||||||||||||
| 2009 | 2008 | 2009 | 2008 | 2007 | 2006 | 2005 | ||||||||||||||||
Total interest income | $ | 3,724 | $ | 3,816 | $ | 15,348 | $ | 14,098 | $ | 12,651 | $ | 10,506 | $ | 9,043 | ||||||||
Total interest expense | 1,341 | 1,580 | 6,115 | 6,662 | 5,966 | 3,792 | 2,563 | |||||||||||||||
Net interest income | 2,383 | 2,236 | 9,233 | 7,436 | 6,685 | 6,714 | 6,480 | |||||||||||||||
Provision (credit) for loan losses | 135 | — | 257 | -175 | — | — | — | |||||||||||||||
Net interest income after provision for loan losses | 2,248 | 2,236 | 8,976 | 7,611 | 6,685 | 6,714 | 6,480 | |||||||||||||||
Noninterest income | 1,061 | -504 | 2,999 | 2,224 | 2,261 | 2,165 | 2,059 | |||||||||||||||
Noninterest expense | 2,103 | 1,849 | 8,563 | 7,063 | 6,614 | 6,645 | 6,181 | |||||||||||||||
Income (loss) before income taxes | 1,206 | -117 | 3,412 | 2,772 | 2,332 | 2,414 | 2,358 | |||||||||||||||
Income tax expense | 362 | -17 | 1,024 | 662 | 554 | 629 | 615 | |||||||||||||||
Net income (loss) | $ | 844 | ($ | 100 | ) | $ | 2,388 | $ | 2,110 | $ | 1,778 | $ | 1,785 | $ | 1,743 | |||||||
Earnings per share: | ||||||||||||||||||||||
Basic | $ | 0.79 | ($ | 0.09 | ) | $ | 2.23 | $ | 1.97 | $ | 1.66 | $ | 1.66 | $ | 1.55 | |||||||
Diluted | $ | 0.69 | ($ | 0.08 | ) | $ | 1.96 | $ | 1.74 | $ | 1.47 | $ | 1.48 | $ | 1.45 | |||||||
Source: Eagle Montana, preliminary prospectus
31
FELDMAN FINANCIAL ADVISORS, INC.
Table 11
Average Balances and Yields
For the Three Months Ended September 30, 2008 and 2009
(Dollars in Thousands)
| For the Three Months Ended September 30, | |||||||||||||||||
| 2009 | 2008 | ||||||||||||||||
| Average Daily Balance | Interest and Dividends | Yield/ Cost(3) | Average Daily Balance | Interest and Dividends | Yield/ Cost(3) | ||||||||||||
Assets: | |||||||||||||||||
Interest-earning assets: | |||||||||||||||||
FHLB stock | $ | 2,000 | — | 0.00 | % | $ | 1,781 | $ | 7 | 1.57 | % | ||||||
Loans receivable, net | 171,262 | 2,708 | 6.32 | % | 174,370 | 2,837 | 6.50 | % | |||||||||
Investment securities | 84,983 | 1,008 | 4.74 | % | 79,004 | 968 | 4.91 | % | |||||||||
Interest-bearing deposits with banks | 8,123 | 8 | 0.44 | % | 665 | 4 | 2.41 | % | |||||||||
Total interest-earning assets | 266,368 | 3,724 | 5.59 | % | 255,820 | 3,816 | 5.97 | % | |||||||||
Noninterest-earning assets | 28,072 | 21,191 | |||||||||||||||
Total assets | $ | 294,440 | $ | 277,011 | |||||||||||||
Liabilities and Equity: | |||||||||||||||||
Interest-bearing liabilities: | |||||||||||||||||
Deposit accounts: | |||||||||||||||||
Money market | $ | 27,103 | 41 | 0.61 | % | $ | 25,692 | 111 | 1.73 | % | |||||||
Passbooks | 26,979 | 28 | 0.42 | % | 24,093 | 39 | 0.65 | % | |||||||||
Checking | 34,948 | 22 | 0.25 | % | 30,958 | 30 | 0.39 | % | |||||||||
Certificates of deposit | 85,772 | 521 | 2.43 | % | 84,415 | 682 | 3.23 | % | |||||||||
Advances from FHLB and subordinated debt | 70,647 | 730 | 4.13 | % | 68,298 | 718 | 4.21 | % | |||||||||
Total interest-bearing liabilities | 245,449 | 1,341 | 2.19 | % | 233,456 | 1,580 | 2.71 | % | |||||||||
Non-interest checking | 17,291 | 15,160 | |||||||||||||||
Other noninterest-bearing liabilities | 2,889 | 3,291 | |||||||||||||||
Total liabilities | 265,629 | 251,907 | |||||||||||||||
Total equity | 28,811 | 25,104 | |||||||||||||||
Total liabilities and equity | $ | 294,440 | $ | 277,011 | |||||||||||||
Net interest income/interest rate spread(1) | 2,383 | 3.40 | % | 2,236 | 3.26 | % | |||||||||||
Net interest margin(2) | 3.58 | % | 3.50 | % | |||||||||||||
Total interest-earning assets to interest bearing liabilities | 108.52 | % | 109.58 | % | |||||||||||||
| (1) | Interest rate spread represents the difference between the average yield on interest-earning assets and the average rate on interest-bearing liabilities. |
| (2) | Net interest margin represents income before the provision for loan losses divided by average interest-earning assets. |
| (3) | Annualized |
Source: Eagle Montana, preliminary prospectus.
32
FELDMAN FINANCIAL ADVISORS, INC.
Table 11 (continued)
Average Balances and Yields
For the Years Ended June 30, 2007 to 2009
(Dollars in Thousands)
| For the Year Ended June 30, | |||||||||||||||||||||||||||
| 2009 | 2008 | 2007 | |||||||||||||||||||||||||
| Average Daily Balance | Interest and Dividends | Yield/ Cost | Average Daily Balance | Interest and Dividends | Yield/ Cost | Average Daily Balance | Interest and Dividends | Yield/ Cost | |||||||||||||||||||
Assets: | |||||||||||||||||||||||||||
Interest-earning assets: | |||||||||||||||||||||||||||
FHLB stock | $ | 1,891 | $ | — | 0.00 | % | $ | 1,336 | $ | 16 | 1.20 | % | $ | 1,315 | $ | 7 | 0.53 | % | |||||||||
Loan receivable, net | 177,354 | 11,411 | 6.43 | % | 165,470 | 10,905 | 6.59 | % | 149,818 | 9,731 | 6.50 | % | |||||||||||||||
Investment securities | 79,432 | 3,922 | 4.94 | % | 67,837 | 3,105 | 4.58 | % | 66,723 | 2,863 | 4.28 | % | |||||||||||||||
Interest-bearing deposits with banks | 3,271 | 15 | 0.46 | % | 1,587 | 63 | 3.97 | % | 922 | 50 | 5.42 | % | |||||||||||||||
Total interest-earning assets | 261,948 | $ | 15,348 | 5.86 | % | 236,230 | $ | 14,089 | 5.96 | % | 218,778 | $ | 12,651 | 5.78 | % | ||||||||||||
Noninterest-earning assets | 23,642 | 19,070 | 18,351 | ||||||||||||||||||||||||
Total assets | $ | 285,590 | $ | 255,300 | $ | 237,129 | |||||||||||||||||||||
Liabilities and Equity: | |||||||||||||||||||||||||||
Interest-bearing liabilities: | |||||||||||||||||||||||||||
Deposit accounts: | |||||||||||||||||||||||||||
Money market | $ | 26,344 | $ | 308 | 1.17 | % | $ | 21,981 | $ | 420 | 1.91 | % | $ | 25,648 | $ | 525 | 2.05 | % | |||||||||
Passbooks | 24,069 | 131 | 0.54 | % | 22,965 | 150 | 0.65 | % | 23,139 | 152 | 0.66 | % | |||||||||||||||
Checking | 32,994 | 114 | 0.35 | % | 30,550 | 71 | 0.23 | % | 30,789 | 63 | 0.20 | % | |||||||||||||||
Certificates of deposit | 86,666 | 2,608 | 3.01 | % | 88,888 | 3,746 | 4.21 | % | 83,753 | 3,451 | 4.12 | % | |||||||||||||||
Advances from FHLB and subordinated debt | 72,927 | 2,954 | 4.05 | % | 48,867 | 2,266 | 4.64 | % | 34,226 | 1,775 | 5.19 | % | |||||||||||||||
Total interest-bearing liabilities | 243,000 | $ | 6,115 | 2.52 | % | 213,251 | $ | 6,653 | 3.12 | % | 197,555 | $ | 5,966 | 3.02 | % | ||||||||||||
Non-interest checking | 14,502 | 14,063 | 13,382 | ||||||||||||||||||||||||
Other noninterest-bearing liabilities | 2,117 | 2,403 | 2,189 | ||||||||||||||||||||||||
Total liabilities | 259,619 | 229,717 | 213,126 | ||||||||||||||||||||||||
Total equity | 25,971 | 25,583 | 24,003 | ||||||||||||||||||||||||
Total liabilities and equity | $ | 285,590 | $ | 255,300 | $ | 237,129 | |||||||||||||||||||||
Net interest income/interest rate spread(1) | $ | 9,233 | 3.34 | % | $ | 7,436 | 2.84 | % | $ | 6,685 | 2.76 | % | |||||||||||||||
Net interest margin(2) | 3.52 | % | 3.15 | % | 3.06 | % | |||||||||||||||||||||
Total interest-earning assets to interest bearing liabilities | 107.80 | % | 110.78 | % | 110.74 | % | |||||||||||||||||||||
| (1) | Interest rate spread represents the difference between the average yield on interest-earning assets and the average rate on interest-bearing liabilities. |
| (2) | Net interest margin represents income before the provision for loan losses divided by average interest-earning assets. |
Source: Eagle Montana, preliminary prospectus.
33
FELDMAN FINANCIAL ADVISORS, INC.
Table 12
Rate/Volume Analysis
| Three Months Ended September 30, | Year Ended June 30, | |||||||||||||||||||||||||||||||||||
| Increase (Decrease) | Increase (Decrease) | |||||||||||||||||||||||||||||||||||
| 2009 vs. 2008 | 2009 vs. 2008 | 2008 vs. 2007 | ||||||||||||||||||||||||||||||||||
| Due to | Due to | Due to | ||||||||||||||||||||||||||||||||||
| Volume | Rate | Net | Volume | Rate | Net | Volume | Rate | Net | ||||||||||||||||||||||||||||
Interest earning assets: | ||||||||||||||||||||||||||||||||||||
Loans receivable, net | ($ | 50 | ) | ($ | 77 | ) | ($ | 127 | ) | $ | 783 | ($ | 277 | ) | $ | 506 | $ | 1,017 | $ | 157 | $ | 1,174 | ||||||||||||||
Investment securities | 68 | (31 | ) | 37 | 583 | 263 | 801 | 48 | 203 | 251 | ||||||||||||||||||||||||||
Interest-earning deposits with banks | 18 | (13 | ) | 5 | 67 | (115 | ) | (48 | ) | 36 | (23 | ) | 13 | |||||||||||||||||||||||
Other earning assets | — | (7 | ) | (7 | ) | — | — | — | — | 9 | 9 | |||||||||||||||||||||||||
Total interest earning assets | 36 | (128 | ) | (92 | ) | 1,388 | (129 | ) | 1,259 | 1,101 | 346 | 1,447 | ||||||||||||||||||||||||
Interest bearing liabilities: | ||||||||||||||||||||||||||||||||||||
Passbook, money market and checking accounts | 21 | (110 | ) | (89 | ) | 96 | (184 | ) | (88 | ) | (76 | ) | (23 | ) | (99 | ) | ||||||||||||||||||||
Certificates of deposit | 11 | (172 | ) | (161 | ) | (94 | ) | (1,044 | ) | (1,138 | ) | 212 | 83 | 295 | ||||||||||||||||||||||
Borrowings | 27 | (15 | ) | 12 | 1,116 | (428 | ) | 688 | 755 | (255 | ) | 500 | ||||||||||||||||||||||||
Total interest bearing liabilities | 59 | (297 | ) | (238 | ) | 1,118 | (1,656 | ) | (538 | ) | 891 | (195 | ) | 696 | ||||||||||||||||||||||
Change in net interest income | ($ | 23 | ) | $ | 169 | $ | 146 | $ | 270 | $ | 1,527 | $ | 1,797 | $ | 210 | $ | 541 | $ | 751 | |||||||||||||||||
Source: Eagle Montana, preliminary prospectus.
Comparison of Operating Results for the Three Months Ended Sept. 30, 2009 and 2008
Net Income. Net income was $844,000 for the three months ended September 30, 2009. Because of the election to apply FASB ASC 825, the Company reported a net loss of $100,000 for the three months ended September 30, 2008, stemming primarily from a loss in value of Freddie Mac and Fannie Mae preferred stock investments for which the FASB ASC 825 election was applied. The return to profitability in the first quarter of the 2010 fiscal year reflected traditional core earnings and relatively small recovery in value in the holdings of Fannie Mae and Freddie Mac preferred stock of $84,000. While the Company continues to hold these securities, other value adjustments may occur in future periods under FASB ASC 825. The tax provision was $379,000 higher in the current quarter. Basic earnings per share were $0.79 for the current period, compared to a loss per share of $0.09 for the previous year’s period.
34
FELDMAN FINANCIAL ADVISORS, INC.
Net Interest Income. Net interest income increased to $2.4 million for the quarter ended September 30, 2009, from $2.2 million for the quarter ended September 30, 2008. This increase of $147,000 was the result of a decrease in interest expense of $239,000 partially offset by a decrease in interest and dividend income of $92,000.
Interest and Dividend Income. Total interest and dividend income was $3.7 million for the quarter ended September 30, 2009, compared to $3.8 million for the quarter ended September 30, 2008, representing a decrease of $92,000, or 2.41%. Interest and fees on loans decreased to $2.7 million for the three months ended September 30, 2009 from $2.8 million for the same period ended September 30, 2008. This decrease of $129,000, or 4.55%, was due to the decrease in the average balances of loans receivable for the quarter ended September 30, 2009. Average balances for loans receivable, net, for the quarter ended September 30, 2009 were $171.3 million, compared to $174.4 million for the previous year. This represents a decrease of $3.1 million, or 1.78%. The average interest rate earned on loans receivable decreased by 18 basis points, from 6.50% at September 30, 2008 to 6.32% at September 30, 2009. Interest and dividends on investment securities available-for-sale increased to $1.00 million for the quarter ended September 30, 2009 from $963,000 for the same quarter last year. Average balances on investments increased to $85.0 million for the quarter ended September 30, 2009, compared to $79.0 million for the quarter ended September 30, 2008. The average interest rate earned on investments decreased to 4.74% from 4.91%.
Interest Expense. Total interest expense decreased to $1.3 million for the quarter ended September 30, 2009, from $1.6 million for the quarter ended September 30, 2008, a decrease of $239,000, or 15.13%. Interest on deposits decreased to $611,000 for the quarter ended September 30, 2009, from $862,000 for the quarter ended September 30, 2008. This decrease of $251,000, or 29.12%,
35
FELDMAN FINANCIAL ADVISORS, INC.
was the result of a decrease in average rates paid on deposits from 2.09% at September 30, 2008, to 1.40% at September 30, 2009. All categories of deposits showed decreases in average rates paid. Average balances in interest-bearing deposit accounts increased to $174.8 million for the quarter ended September 30, 2009, compared to $165.2 million for the same quarter in the previous year. The increase in the average balance of FHLB and other borrowings resulted in an increase in interest paid on borrowings to $655,000 in the current quarter compared to $643,000 in the previous year’s quarter. The average rate paid on borrowings decreased from 4.21% for the quarter ended September 30, 2008 to 4.13% for the quarter ended September 30, 2009. The average rate paid on all liabilities decreased 52 basis points from the quarter ended September 30, 2008 to the quarter ended September 30, 2009.
Provision for Loan Losses. A provision of $135,000 was made for loan losses for the quarter ended September 30, 2009, and none in the quarter ended September 30, 2008. This is a reflection of the continued strong asset quality of American Federal Savings Bank’s loan portfolio, as non-performing loan ratios continue to be below peer averages. Total classified assets increased from $1.6 million at June 30, 2009 to $2.0 million at September 30, 2009. At quarter end, American Federal Savings Bank had $158,000 in other real estate owned and $5,000 in repossessed property.
Noninterest Income. Total noninterest income increased to $1. 1 million for the quarter ended September 30, 2009, from a negative $504,000 for the quarter ended September 30, 2008. As noted above, the loss for the three months ended September 30, 2008 stemmed primarily from a loss in value of Freddie Mac and Fannie Mae preferred stock investments for which the FASB ASC 825
36
FELDMAN FINANCIAL ADVISORS, INC.
election was applied. Income from the sale of loans increased to $440,000 from $183,000 due to $17.6 million more in mortgage loan sales in the current period versus last year’s period and a relatively small recovery in value in the holdings of Fannie Mae and Freddie Mac preferred stock.
Noninterest Expense. Noninterest expense increased by $254,000 or 13.74% to $2.1 million for the quarter ended September 30, 2009, from $1.8 million for the quarter ended September 30, 2008. This increase was primarily due to an increase in FDIC insurance premiums of $58,000 and an increase in salaries and employee benefits of $53,000. Other expense categories showed minor changes.
Income Tax Expense/Benefit. Income tax expense was $362,000 for the quarter ended September 30, 2009, compared to a benefit of $17,000 for the quarter ended September 30, 2008. The effective tax rate for the quarter ended September 30, 2009 was 30.02% and was 14.53% for the quarter ended September 30, 2008.
Comparison of Results of Operations for the Years Ended June 30, 2009 and 2008
Net Income. Net income was $2.4 million and $2.1 million for the years ended June 30, 2009 and 2008, respectively. This increase of $278,000, or 13.18%, was the result of an increase in net interest income of $1.797 million and an increase in net noninterest income of $775,000, offset by increases in noninterest expense of $1.5 million and the provision for loan losses of $257,000. Tax provision was $362,000 higher in 2009. Basic earnings per share for the year ended June 30, 2009 were $2.23, compared to $1.97 for the year ended June 30, 2008. Diluted earnings per share were $1.96 and $1.74 for 2009 and 2008, respectively.
37
FELDMAN FINANCIAL ADVISORS, INC.
Net Interest Income. Net interest income increased to $9.2 million for the year ended June 30, 2009, from $7.4 million for the previous year. This increase of $1.8 million, or 24.17%, was the result of an increase in interest income of $1.3 million and a decrease in interest expense of $547,000. This increase is mainly attributable a larger average balance of loans and investments and lower rates on deposits.
Interest and Dividend Income. Total interest and dividend income was $15.3 million for the year ended June 30, 2009, compared to $14.1 million for the year ended June 30, 2008, an increase of $1.3 million, or 8.87%. Interest and fees on loans increased to $11.4 million for 2009 from $10.9 million for 2008. This increase of $506,000, or 4.64%, was due primarily to the increase in the average balances on loans receivable for the year ended June 30, 2009. The average interest rate earned on loans receivable decreased by 16 basis points, to 6.43% from 6.59%. Average balances for loans receivable, net, for the year ended June 30, 2009 were $177.4 million, compared to $165.5 million for the previous year. This represents an increase of $11.9 million, or 7.18%. Interest and dividends on investment securities available-for-sale (“AFS”) increased to $3.9 million for the year ended June 30, 2009 from $3.1 million for the year ended June 30, 2008, an increase of $822,000, or 26.77%. This increase was the result of higher average interest rates on the AFS portfolio during the year, along with a higher average balance. Interest earned from deposits at other banks decreased slightly for the year ended June 30, 2009 due to much lower rates. Interest and dividends on investments held-to-maturity (HTM) also experienced a slight decline.
Interest Expense. Total interest expense decreased to $6.1 million for the year ended June 30, 2009 from $6.7 million for the year ended June 30, 2008, a decrease of $547,000, or 8.2%. Interest on deposits decreased to $3.2 million for the year ended
38
FELDMAN FINANCIAL ADVISORS, INC.
June 30, 2009 from $4.4 million for the year ended June 30, 2008. This decrease of $1.2 million, or 27.95%, was due primarily to a decrease on average rates paid. The average cost of deposits decreased 81 basis points, to 1.86% in 2009 from 2.67% in 2008. Certificates of deposit were the only category to show a decrease in average balances in 2009. An increase in the average balance of borrowings was partially offset by a decrease in the average rate paid and resulted in an increase in interest paid on borrowings to $3.0 million for the year ended June 30, 2009 from $2.3 million for the year ended June 30, 2008. The average balance of borrowings increased to $72.9 million for the year ended June 30, 2009, compared to $48.9 million for the year ended June 30, 2008 and resulted principally from an increase in FHLB borrowings. The average rate paid on borrowings decreased to 4.05% in 2009 from 4.64% in 2008.
Provision for Loan Losses. A provision to increase the allowance for loan losses by $257,000 was made for the year ended June 30, 2009 while an adjustment of $175,000 was made to reduce the allowance for loan loss for the year ended June 30, 2008.
Noninterest Income. Total noninterest income increased to $3.0 million for the year ended June 30, 2009, from $2.2 million for the year ended June 30, 2008, an increase of $775,000 or 34.85%. This increase was primarily due to an increase in gain on sale of loans of $1.4 million offset by recognized losses of $785,000 on Freddie Mac and Fannie Mae preferred stock that is accounted for under FASB ASC 825. The preferred stock of Freddie Mac and Fannie Mae currently held by the bank constitutes $25,000 or .009% of total assets as of June 30, 2009. Net gain on sale of loans increased due to significant refinance activity that occurred particularly in the third and fourth quarters of the fiscal year. Service charges on deposit accounts increased $34,000 to $745,000 for the year ended
39
FELDMAN FINANCIAL ADVISORS, INC.
June 30, 2009 from $711,000 for the year ended June 30, 2008. This was primarily due to an increase in overdraft protection fees. Other noninterest income increased $43,000 to $652,000, primarily due to increased fee income on electronic payments and higher fee income on loan products. The single largest item in other noninterest income is earnings from bank owned life insurance of $264,000.
Noninterest Expense. Noninterest expense increased by $1.5 million or 21.23% to $8.6 million for the year ended June 30, 2009 from $7.1 million for the year ended June 30, 2008. This increase was primarily due to increases in salaries and benefits of $446,000, federal deposit insurance premiums of $287,000, amortization of mortgage servicing rights of $285,000, and advertising expense of $101,000. The increase in salaries and benefits was due to normal pay raises and incentive pay related to mortgage originations. Federal deposit insurance increased due to the special assessment applied to institutions in June 2009 and other premium increases assessed effective January 2009. The amortization of mortgage servicing rights increased due to the increase in loan prepayments that resulted from the significant increase in refinance activity, and advertising expenses were higher due to increased promotion of deposit products. Other categories of noninterest expense showed modest changes.
Income Tax Expense. Eagle’s income tax expense was $1.0 million for the year ended June 30, 2009, compared to $662,000 for the year ended June 30, 2008. The effective tax rate for the year ended June 30, 2009 was 30.0% as opposed to 23.9% for the year ended June 30, 2008.
40
FELDMAN FINANCIAL ADVISORS, INC.
Interest Rate Risk Management
Because the majority of the Company’s assets and liabilities are sensitive to changes in interest rates, a significant form of market risk for the Company is interest rate risk, or changes in interest rates. Notwithstanding the unpredictability of future interest rates, management expects that changes in interest rates may have a significant, adverse impact on net interest income.
The Company’s ability to make a profit largely depends on its net interest income, which could be negatively affected by changes in interest rates. Net interest income is the difference between the interest income earned on interest-earning assets, such as loans and securities, and the interest expense paid on interest-bearing liabilities, such as deposits and borrowings.
In addition to the asset/liability committee, the board of directors reviews the asset and liability policies. The board of directors reviews interest rate risk and interest rate trends quarterly, as well as liquidity and capital ratio requirements. Management administers the policies and determinations of the board of directors with respect to asset and liability goals and strategies. The Company’s asset and liability policy and strategies are expected to continue as described so long as competitive and regulatory conditions in the financial institution industry and market interest rates continue as they have in recent years.
Table 13 presents the Bank’s net portfolio value (“NPV”) as of September 30, 2009. The net portfolio values shown in this table were calculated by the Office of Thrift Supervision, based on information provided by the Bank.
As shown in Table 13, a rising interest rate scenario of 100 basis points would have a negative effect on the Company’s NPV. Under this scenario, NPV would decrease to a ratio of 12.18% of assets. In the event of a 200 basis point increase in interest rates, the
41
FELDMAN FINANCIAL ADVISORS, INC.
resulting NPV ratio would be 10.74%. A downward movement in market rates by 100 basis points would result in a positive impact on NPV with the Company’s NPV ratio measuring 13.63% under this declining rate scenario. Given the current relatively low level of market interest rates, an NPV calculation for an interest rate decrease of greater than 100 basis points has not been prepared.
Table 13
Interest Rate Risk Analysis
Net Portfolio Value
Changes in Market Interest Rates | Net Portfolio Value as % of PV of Assets | |||||
| At September 30, 2009 Projected NPV | Board Policy Limit (if applicable) | |||||
| (Basis Points) | ||||||
| Must be at least: | ||||||
+400 | N/A | |||||
+300 | 8.93 | % | 7.00 | % | ||
+200 | 10.74 | % | 8.00 | % | ||
+100 | 12.18 | % | 9.00 | % | ||
0 | — | — | ||||
-100 | 13.63 | % | 10.00 | % | ||
Source: Eagle Montana, preliminary prospectus.
42
FELDMAN FINANCIAL ADVISORS, INC.
Asset Quality
Table 14 provides information regarding the Bank’s nonperforming loans, other nonperforming assets. Tables 15 and 16 detail the Bank’s allowance for loan loss reserves and the allocation of the reserve among loan types for the periods ending June 30, 2005 to 2009 and at September 30, 2009. At September 30, 2009, the allowance for loan losses totaled $625,000, nonperforming loans totaled $1.4 million, and the ratio of allowance for loan losses to nonperforming loans was 39.6%.
The Company’s overall asset quality has remained excellent over the recent years. As of September 30, 2009, nonperforming loans (“NPLs”) measured $1.4 million or 0.93% of total loans and 0.52% of total assets. At September 30, 2009, the nonperforming loans were comprised primarily of commercial real estate loans totaling $948,000. The Company had $158,000 of foreclosed assets at September 30, 2009.
Management, in compliance with regulatory guidelines, conducts an internal loan review program, whereby loans are placed or classified in categories depending upon the level of risk of nonpayment or loss. These categories are special mention, substandard, doubtful or loss. When a loan is classified as substandard or doubtful, management is required to establish an allowance for loan losses in an amount that is deemed prudent. When management classifies a loan as a loss asset, a reserve equal to 100% of the loan balance is required to be established or the loan is required to be charged-off. The allowance for loan losses is composed of an allowance for both inherent risk associated with lending activities and specific problem assets.
43
FELDMAN FINANCIAL ADVISORS, INC.
Table 14
Nonperforming Asset Summary
As of September 30, 2009
And June 30, 2005 to 2009
(Dollars in Thousands)
| At Sept. 30 | At June 30, | |||||||||||||||||||||||
| 2009 | 2009 | 2008 | 2007 | 2006 | 2005 | |||||||||||||||||||
Non-accrual loans | ||||||||||||||||||||||||
Real estate loans: | ||||||||||||||||||||||||
Residential mortgage (1-4 family) | $ | 38 | $ | 265 | $ | 32 | $ | — | $ | 80 | $ | 98 | ||||||||||||
Real estate construction | — | — | — | — | — | — | ||||||||||||||||||
Commercial real estate and land | 948 | 527 | — | — | — | 87 | ||||||||||||||||||
Home equity | — | — | — | — | — | — | ||||||||||||||||||
Consumer | 76 | 26 | — | 21 | 5 | — | ||||||||||||||||||
Commercial business loans | 177 | 184 | — | — | 260 | 249 | ||||||||||||||||||
Accruing loans delinquent 90 days or more | 171 | 251 | — | 191 | 114 | 67 | ||||||||||||||||||
Total nonperforming loans | 1,410 | 1,253 | 32 | 212 | 459 | 501 | ||||||||||||||||||
Real estate owned | 158 | — | — | — | — | — | ||||||||||||||||||
Total nonperforming assets | $ | 1,568 | $ | 1,253 | $ | 32 | $ | 212 | $ | 459 | $ | 501 | ||||||||||||
Total nonperforming loans to net loans | 0.93 | % | 0.75 | % | 0.02 | % | 0.13 | % | 0.33 | % | 0.47 | % | ||||||||||||
Total nonperforming loans to total assets | 0.52 | % | 0.43 | % | 0.01 | % | 0.09 | % | 0.20 | % | 0.24 | % | ||||||||||||
Total nonperforming assets to total assets | 0.52 | % | 0.43 | % | 0.01 | % | 0.09 | % | 0.20 | % | 0.24 | % | ||||||||||||
Source: Eagle Montana, preliminary prospectus.
44
FELDMAN FINANCIAL ADVISORS, INC.
Table 15
Allowance for Loan Loss Summary
As of September 30, 2008 to 2009
And as of June 30, 2005 to 2009
(Dollars in Thousands)
| Three Months Ended September 30, | Year Ended June 30, | |||||||||||||||||||||||||||
| 2009 | 2008 | 2009 | 2008 | 2007 | 2006 | 2005 | ||||||||||||||||||||||
Balance at beginning of period: | $ | 525 | $ | 300 | $ | 300 | $ | 518 | $ | 535 | $ | 573 | $ | 628 | ||||||||||||||
Provision for loan losses | 135 | — | 257 | (175 | ) | — | — | — | ||||||||||||||||||||
Reclassification to repossessed property reserve | — | (3 | ) | — | — | — | (15 | ) | (15 | ) | ||||||||||||||||||
Loans charged-off: | ||||||||||||||||||||||||||||
Real estate loans | — | — | — | — | — | — | (15 | ) | ||||||||||||||||||||
Home equity | (28 | ) | — | — | — | — | — | — | ||||||||||||||||||||
Consumer | (8 | ) | — | (47 | ) | (54 | ) | (29 | ) | (48 | ) | (50 | ) | |||||||||||||||
Commercial business loans | — | — | — | — | — | — | — | |||||||||||||||||||||
Recoveries: | — | — | — | — | — | — | — | |||||||||||||||||||||
Real estate loans | — | — | — | — | — | — | — | |||||||||||||||||||||
Home equity | — | — | — | — | — | — | — | |||||||||||||||||||||
Consumer | 1 | 3 | 15 | 11 | 12 | 25 | 10 | |||||||||||||||||||||
Commercial business loans | — | — | — | — | — | — | — | |||||||||||||||||||||
Net (charge-offs) recoveries | (35 | ) | 0 | (32 | ) | (43 | ) | (17 | ) | (23 | ) | (40 | ) | |||||||||||||||
Balance at end of period | $ | 625 | $ | 300 | $ | 525 | $ | 300 | $ | 518 | $ | 535 | $ | 573 | ||||||||||||||
Allowance for loan losses to total loans | 0.37 | % | 0.17 | % | 0.31 | % | 0.18 | % | 0.33 | % | 0.38 | % | 0.53 | % | ||||||||||||||
Allowance for loan losses to total nonperforming loans | 39.56 | % | 400.00 | % | 41.90 | % | 937.50 | % | 244.34 | % | 141.91 | % | 132.03 | % | ||||||||||||||
Net charge-offs to average loans outstanding during the period | 0.02 | % | 0.00 | % | -0.02 | % | -0.03 | % | -0.01 | % | -0.02 | % | -0.05 | % | ||||||||||||||
Source: Eagle Montana, preliminary prospectus.
45
FELDMAN FINANCIAL ADVISORS, INC.
Table 16
Allocation of Allowance for Loan Losses
As of September 30, 2009
And June 30, 2005 to 2009
(Dollars in Thousands)
| At June 30, | ||||||||||||||||||||||||||||||||||||
| At Sept. 30, 2009 | 2009 | 2008 | 2007 | 2006 | 2005 | |||||||||||||||||||||||||||||||
| Amount | Loan Category as a % of Total Loans | Amount | Loan Category as a % of Total Loans | Amount | Loan Category as a % of Total Loans | Amount | Loan Category as a % of Total Loans | Amount | Loan Category as a % of Total Loans | Amount | Loan Category as a % of Total Loans | |||||||||||||||||||||||||
Real estate loans: | ||||||||||||||||||||||||||||||||||||
Residential mortgage (1-4 family) | $ | 187 | 29.92 | % | $ | 190 | 47.26 | % | $ | 133 | 51.53 | % | $ | 189 | 51.68 | % | $ | 60 | 53.71 | % | $ | 51 | 52.68 | % | ||||||||||||
Real estate construction | 15 | 2.40 | % | 10 | 2.77 | % | 10 | 4.35 | % | 13 | 5.20 | % | 3 | 4.88 | % | 3 | 13.77 | % | ||||||||||||||||||
Commercial real estate and land | 198 | 31.68 | % | 158 | 21.90 | % | 34 | 16.75 | % | 27 | 16.16 | % | 8 | 13.20 | % | 19 | 2.53 | % | ||||||||||||||||||
Total real estate loans | 400 | 64.00 | % | 358 | 71.93 | % | 177 | 72.62 | % | 229 | 73.04 | % | 71 | 71.79 | % | 73 | 68.99 | % | ||||||||||||||||||
Home equity | 70 | 11.20 | % | 67 | 17.11 | % | 62 | 16.65 | % | 48 | 15.74 | % | 37 | 14.29 | % | 8 | 15.66 | % | ||||||||||||||||||
Consumer | 118 | 18.88 | % | 68 | 6.46 | % | 51 | 6.87 | % | 141 | 7.21 | % | 245 | 8.36 | % | 327 | 10.17 | % | ||||||||||||||||||
Commercial business | 37 | 5.92 | % | 32 | 4.50 | % | 10 | 3.86 | % | 100 | 4.01 | % | 182 | 5.56 | % | 165 | 5.20 | % | ||||||||||||||||||
Total other loans | 225 | 36.00 | % | 167 | 28.07 | % | 123 | 27.38 | % | 289 | 26.96 | % | 464 | 28.21 | % | 500 | 31.01 | % | ||||||||||||||||||
Total | $ | 625 | 100.00 | % | $ | 525 | 100.00 | % | $ | 300 | 100.00 | % | $ | 518 | 100.00 | % | $ | 535 | 100.00 | % | $ | 573 | 100.00 | % | ||||||||||||
Source: Eagle Montana, preliminary prospectus.
46
FELDMAN FINANCIAL ADVISORS, INC.
Management’s evaluation of the classification of assets and the adequacy of the allowance for loan losses is reviewed by the Board on a regular basis and by the regulatory agencies as part of their examination process. In addition, each loan that exceeds $500,000 is monitored more closely.
American Federal Savings Bank segregates its loan portfolio for loan losses into the following broad categories: real estate loans (consisting of one- to four-family residential mortgages, real estate construction, commercial real estate and land), home equity loans, consumer loans and commercial business loans. American Federal Savings Bank provides for a general allowance for losses inherent in the portfolio by the above categories, which consists of two components. General loss percentages are calculated based on historical analyses and other factors such as volume and severity of delinquencies, local and national economy, underwriting standards, and other factors. A supplemental portion of the allowance is calculated for inherent losses, which probably exist as of the evaluation date even though they might not have been identified by the more objective processes, used. This is due to the risk of error and/or inherent imprecision in the process.
This portion of the allowance is particularly subjective and requires judgments based on qualitative factors, which do not lend themselves to exact mathematical calculations such as: trends in delinquencies and non-accruals; trends in volume; terms and portfolio mix; new credit products; changes in lending policies and procedures; and changes in the outlook for the local, regional and national economy.
At least quarterly, management of American Federal Savings Bank evaluates the need to establish reserves against losses on loans and other assets based on estimated losses on specific loans and on any real estate owned when a finding is made that a loss is
47
FELDMAN FINANCIAL ADVISORS, INC.
estimable and probable. Such evaluation includes a review of all loans for which full collectibility may not be reasonably assured and considers; among other matters; the estimated market value of the underlying collateral of problem loans; prior loss experience; economic conditions; and overall portfolio quality. Provisions for, or adjustments to, estimated losses are included in earnings in the period they are established.
While the Bank believes it has established the existing allowance for loan losses in accordance with generally accepted accounting principles, there can be no assurance that bank regulators, in reviewing the loan portfolio, will not request a significant increase in the allowance for loan losses, or that general economic conditions, a deteriorating real estate market, or other factors will not cause the Bank to significantly increase its allowance for loan losses, therefore negatively affecting the Bank’s financial condition and earnings.
In making loans, the Bank recognize that credit losses will be experienced and that the risk of loss will vary with, among other things, the type of loan being made, the creditworthiness of the borrower over the term of the loan and, in the case of a secured loan, the quality of the security for the loan. It is policy to review the loan portfolio, in accordance with regulatory classification procedures, on at least a quarterly basis.
48
FELDMAN FINANCIAL ADVISORS, INC.
Market Area
The Company is headquartered in Helena, Montana, and operates seven full service retail-banking offices, including the main office. The full service branches are located in Helena, Skyway (opened 2009), Bozeman (opened 1980 and 2009), Butte (opened 1979) and Townsend (opened 1979), Montana.
Montana is one of the largest states in terms of land mass but ranks as one of the least populated states. The current population estimate for the state 973,235 as of 2009. Helena, which serves as both the county seat of Lewis and Clark County and the capital of the state, has a population of approximately 61,229 as of 2009 and is located within 120 miles of four of Montana’s other five largest cities: Missoula, Great Falls, Bozeman and Butte. Helena is approximately midway between Yellowstone and Glacier National Parks. The Helena economy has shown moderate growth, in terms of both employment and income. State government and the numerous offices of the federal government comprise the largest employment sector. Helena also has significant employment in the service industries. Specifically, it has evolved into a central health care center with employment in the medical and the supporting professions as well as the medical insurance industry. The local economy is also dependent to a lesser extent upon ranching and agriculture.
Table 17 displays selected demographic data for the United States, the state of Montana, Lewis and Clark County and Helena, Montana. Household and per capita income levels for both Lewis and Clark County and the city of Helena were above the comparable demographic data for the state of Montana but trailed the figures for the United States. The median household income for
49
FELDMAN FINANCIAL ADVISORS, INC.
Lewis and Clark County was estimated at $46,326 in 2009, compared to the state median household income level of $40,864 and $54,719 for the United States.
Bozeman is approximately 95 miles southeast of Helena. It is located in Gallatin County, which has a population of approximately 80,900. Bozeman is home to Montana State University and achieved its growth in part due to the growth of the University. In addition, increased tourism for resort areas in and near Bozeman has assisted in the growth of the region. Agriculture, however, remains an important part of Bozeman’s economy. Bozeman has become an attractive location for retirees, primarily from the West Coast, owing to its many winter and summer recreational opportunities and the presence of the University.
Butte, Montana is approximately 64 miles southwest of Helena. Butte and the surrounding Silver-Bow County have a population of approximately 32,800. Butte’s economy is somewhat reliant on the mining industry and the economy has been volatile from the fluctuations in metal and mineral commodity prices.
Townsend is the smallest community in which the Bank operates. It has a population of about 2,000 and many of its residents commute to other Montana locations for work. Other employment in Townsend is primarily in agriculture and services. Townsend is approximately 32 miles southeast of Helena.
50
FELDMAN FINANCIAL ADVISORS, INC.
Table 17
Selected Demographic Data
United States, Montana, Lewis and Clark County and City of Helena
| United States | State of Montana | Lewis and Clark County | City of Helena | |||||||||||||
Total Population | ||||||||||||||||
2009 - Current | 309,731,508 | 973,235 | 61,229 | 26,459 | ||||||||||||
% Change 2000-09 | 10.1 | % | 7.9 | % | 9.9 | % | 2.6 | % | ||||||||
% Change 2009-14 | 4.6 | % | 4.2 | % | 4.9 | % | 2.2 | % | ||||||||
Age Distribution, 2008 | ||||||||||||||||
0 -14 Age Group | 20.2 | % | 18.6 | % | 18.6 | % | 16.3 | % | ||||||||
15 -34 Age Group | 27.3 | % | 26.2 | % | 25.5 | % | 28.1 | % | ||||||||
35 -54 Age Group | 28.4 | % | 28.2 | % | 29.6 | % | 26.4 | % | ||||||||
55+ Age Group | 24.2 | % | 27.0 | % | 26.3 | % | 29.2 | % | ||||||||
Median Age (years) | 36.9 | 39.4 | 40.0 | 40.2 | ||||||||||||
Total Households | ||||||||||||||||
2009 - Current | 116,523,156 | 390,009 | 25,460 | 12,054 | ||||||||||||
% Change 2000-09 | 10.5 | % | 8.7 | % | 11.4 | % | 4.5 | % | ||||||||
% Change 2009-14 | 4.8 | % | 4.7 | % | 5.5 | % | 3.0 | % | ||||||||
Total Household Income | ||||||||||||||||
$0-25K Households (%) | 20.9 | % | 28.8 | % | 22.8 | % | 25.8 | % | ||||||||
$25-50K Households (%) | 24.5 | % | 31.4 | % | 30.9 | % | 28.6 | % | ||||||||
$50-100K Households (%) | 35.3 | % | 31.1 | % | 35.8 | % | 34.4 | % | ||||||||
$100K+ Households (%) | 19.3 | % | 8.8 | % | 10.6 | % | 11.3 | % | ||||||||
Median Household Net Worth | $ | 97,724 | $ | 58,422 | $ | 79,734 | $ | 60,847 | ||||||||
Average Household Income | ||||||||||||||||
2009 - Current | $ | 71,437 | $ | 51,691 | $ | 56,277 | $ | 56,465 | ||||||||
% Change 2000-09 | 26.1 | % | 21.7 | % | 23.9 | % | 28.3 | % | ||||||||
% Change 2009-14 | 4.2 | % | 2.3 | % | 1.4 | % | 1.7 | % | ||||||||
Median Household Income | ||||||||||||||||
2009 - Current | $ | 54,719 | $ | 40,864 | $ | 46,326 | $ | 44,933 | ||||||||
% Change 2000-09 | 29.8 | % | 23.6 | % | 23.8 | % | 30.7 | % | ||||||||
% Change 2009-14 | 4.1 | % | 4.0 | % | 2.3 | % | 3.7 | % | ||||||||
Per Capita Income | ||||||||||||||||
2009 - Current | $ | 27,277 | $ | 21,013 | $ | 23,646 | $ | 26,159 | ||||||||
% Change 2000-09 | 26.4 | % | 22.5 | % | 26.0 | % | 30.7 | % | ||||||||
% Change 2009-14 | 4.5 | % | 2.8 | % | 2.0 | % | 2.7 | % | ||||||||
Unemployment Rate (%) | ||||||||||||||||
September 2009 | 9.8 | % | 5.9 | % | 4.3 | % | NA | |||||||||
December 2008 | 7.2 | % | 5.5 | % | 3.9 | % | NA | |||||||||
December 2007 | 4.9 | % | 4.2 | % | 3.0 | % | NA | |||||||||
Source: SNL Financial and ESRI.
51
FELDMAN FINANCIAL ADVISORS, INC.
Table 18 summarizes deposit market data for all commercial banks and thrift institutions with offices in the counties in which the Bank operates. Based on deposit data as of June 30, 2009 and adjusted for any subsequent merger transactions, the Company ranked fifth among the financial institutions operating in Lewis and Clark County. As of such date, the Company had total deposits of $90.7 million in the county, which reflected a 9.05% market share based on the region’s total deposits of $1.0 billion. Three commercial banks occupied the top of the market share rankings of deposits in the county. Mountain West Financial Corp., Glacier Bancorp, Inc., and Wells Fargo & Co. held market shares of 29.6%, 19.4%, and 18.8%, respectively. Eagle is the only thrift operating in this market.
52
FELDMAN FINANCIAL ADVISORS, INC.
Table 18
Deposit Market Share by County
Data as of June 30, 2008 and 2009
(adjusted for pending and completed mergers)
| Lewis and Clark, MT | ||||||||||||||||
2009 Rank | 2008 Rank | Institution (ST) | Type | 2009 Number of Branches | 2009 Total Deposits in Market ($000) | 2009 Total Market Share (%) | 2008 Total Deposits in Market ($000) | 2008 Total Market Share (%) | ||||||||
| 1 | 1 | Mountain West Financial Corp. (MT) | Bank | 5 | 296,465 | 29.59 | 290,205 | 29.11 | ||||||||
| 2 | 2 | Glacier Bancorp Inc. (MT) | Bank | 6 | 194,331 | 19.40 | 187,694 | 18.83 | ||||||||
| 3 | 4 | Wells Fargo & Co. (CA) | Bank | 4 | 188,800 | 18.84 | 162,694 | 16.32 | ||||||||
| 4 | 3 | U.S. Bancorp (MN) | Bank | 1 | 102,416 | 10.22 | 167,412 | 16.79 | ||||||||
| 5 | 5 | Eagle Bancorp (MHC) (MT) | Thrift | 3 | 90,684 | 9.05 | 84,810 | 8.51 | ||||||||
| 6 | 7 | First Interstate BancSystem (MT) | Bank | 2 | 55,958 | 5.59 | 35,415 | 3.55 | ||||||||
| 7 | 6 | F.S.B. Holding Co. (MT) | Bank HC | 1 | 42,061 | 4.20 | 38,816 | 3.89 | ||||||||
| 8 | 9 | Lincoln Holding Co. (MT) | Bank HC | 1 | 11,412 | 1.14 | 10,192 | 1.02 | ||||||||
| 9 | 8 | Countricorp (MT) | Bank HC | 1 | 11,182 | 1.12 | 12,207 | 1.22 | ||||||||
| 10 | 10 | First Community Bancorp Inc. (MT) | Bank HC | 1 | 8,613 | 0.86 | 7,421 | 0.74 | ||||||||
| Total For Institutions In Market | 25 | 1,001,922 | 100.00 | 996,866 | 100.00 | |||||||||||
| Silver Bow, MT | ||||||||||||||||
2009 Rank | 2008 Rank | Institution (ST) | Type | 2009 Number of Branches | 2009 Total Deposits in Market ($000) | 2009 Total Market Share (%) | 2008 Total Deposits in Market ($000) | 2008 Total Market Share (%) | ||||||||
| 1 | 1 | Wells Fargo & Co. (CA) | Bank | 2 | 112,730 | 22.03 | 112,127 | 23.30 | ||||||||
| 2 | 2 | U.S. Bancorp (MN) | Bank | 1 | 102,726 | 20.07 | 85,191 | 17.70 | ||||||||
| 3 | 3 | Glacier Bancorp Inc. (MT) | Bank | 3 | 87,349 | 17.07 | 84,763 | 17.61 | ||||||||
| 4 | 4 | First National Bancorp Inc. (MT) | Bank HC | 1 | 70,835 | 13.84 | 66,917 | 13.90 | ||||||||
| 5 | 5 | Butte Bank Shares Inc. (MT) | Bank HC | 2 | 56,270 | 10.99 | 55,669 | 11.57 | ||||||||
| 6 | 6 | Eagle Bancorp (MHC) (MT) | Thrift | 1 | 50,971 | 9.96 | 51,244 | 10.65 | ||||||||
| 7 | 7 | Flint Creek Holding Company (MT) | Bank HC | 1 | 15,971 | 3.12 | 15,220 | 3.16 | ||||||||
| 8 | 8 | Bridger Co. (MT) | Bank HC | 1 | 14,928 | 2.92 | 10,128 | 2.10 | ||||||||
| Total For Institutions In Market | 12 | 511,780 | 100.00 | 481,259 | 100.00 | |||||||||||
| Gallatin, MT | ||||||||||||||||
2009 Rank | 2008 Rank | Institution (ST) | Type | 2009 Number of Branches | 2009 Total Deposits in Market ($000) | 2009 Total Market Share (%) | 2008 Total Deposits in Market ($000) | 2008 Total Market Share (%) | ||||||||
| 1 | 1 | Inter-Mountain Bancorp. Inc. (MT) | Bank HC | 8 | 385,560 | 22.08 | 350,212 | 21.90 | ||||||||
| 2 | 2 | First Interstate BancSystem (MT) | Bank | 5 | 251,882 | 14.42 | 193,031 | 12.07 | ||||||||
| 3 | 3 | Glacier Bancorp Inc. (MT) | Bank | 5 | 180,525 | 10.34 | 192,167 | 12.02 | ||||||||
| 4 | 4 | Guaranty Dev. Co. (MT) | Bank HC | 3 | 171,256 | 9.81 | 163,502 | 10.22 | ||||||||
| 5 | 5 | Wells Fargo & Co. (CA) | Bank | 2 | 122,319 | 7.00 | 121,458 | 7.59 | ||||||||
| 6 | 7 | MSB Financial Inc. (MT) | Bank HC | 4 | 105,236 | 6.03 | 93,754 | 5.86 | ||||||||
| 7 | 6 | U.S. Bancorp (MN) | Bank | 2 | 101,937 | 5.84 | 98,645 | 6.17 | ||||||||
| 8 | 8 | Stockman Financial Corp. (MT) | Bank HC | 2 | 93,265 | 5.34 | 76,392 | 4.78 | ||||||||
| 9 | 9 | Bozeman Bancorp Inc. (MT) | Bank HC | 1 | 70,006 | 4.01 | 67,567 | 4.23 | ||||||||
| 10 | 10 | Flathead Hldg Co. of Bigfork (MT) | Bank HC | 2 | 64,347 | 3.68 | 63,753 | 3.99 | ||||||||
| 13 | 13 | Eagle Bancorp (MHC) (MT) | Thrift | 2 | 33,236 | 1.90 | 30,841 | 1.93 | ||||||||
| All Other Institutions | 7 | 166,956 | 9.56 | 147,891 | 9.25 | |||||||||||
| Total For Institutions In Market | 43 | 1,746,525 | 100.00 | 1,599,213 | 100.00 | |||||||||||
| Broadwater, MT | ||||||||||||||||
2009 Rank | 2008 Rank | Institution (ST) | Type | 2009 Number of Branches | 2009 Total Deposits in Market ($000) | 2009 Total Market Share (%) | 2008 Total Deposits in Market ($000) | 2008 Total Market Share (%) | ||||||||
| 1 | 1 | S.B.T. Financial Inc. (MT) | Bank HC | 1 | 36,661 | 73.92 | 34,561 | 73.41 | ||||||||
| 2 | 2 | Eagle Bancorp (MHC) (MT) | Thrift | 1 | 12,937 | 26.08 | 12,520 | 26.59 | ||||||||
| Total For Institutions In Market | 2 | 49,598 | 100.00 | 47,081 | 100.00 | |||||||||||
Source: SNL Financial.
53
FELDMAN FINANCIAL ADVISORS, INC.
Summary Outlook
Over the past few years, the Company has produced strong financial performance with earnings above the industry median and low levels of non-performing assets. Management believes the Company is able to obtain a competitive advantage against its competitors based upon the following:
| • | A strong and experienced management team and a team of dedicated and qualified personnel to support the growth of the Company. |
| • | High level of core deposits. |
| • | Strong asset quality. |
| • | Operates in a market that has a relatively healthy economic climate. |
Going forward, management is focused on the following:
| • | Continue to diversify the loan portfolio by emphasizing recent growth in commercial real estate and commercial business loans as a complement to traditional single-family residential real estate lending. |
| • | Continue to emphasize core deposits as a main source of funding. |
| • | Maintaining strong asset quality, exercising prudent loan underwriting, and administration standards. |
| • | Expand the Company’s geographic reach through complementary acquisitions and de novo branching. |
| • | Increase capital to support future growth and using the capital raised to take advantage of strategic growth and acquisition opportunities. |
| • | Continue to operate as a community-oriented independent financial institution that offers a broad array of financial services with high levels of customer service. |
54
FELDMAN FINANCIAL ADVISORS, INC.
II. COMPARISONS WITH PUBLICLY HELD THRIFTS
General Overview
The comparative market approach provides a sound basis for determining estimates of going-concern valuations where a regular and active market exists for the stocks of peer institutions. The comparative market approach was utilized in determining the estimated pro forma market value of the Company because: (i) reliable market and financial data are readily available for comparable institutions; (ii) the comparative market method is required by the applicable regulatory guidelines; and (iii) other alternative valuation methods (such as income capitalization, liquidation analysis, or discounted cash flow) are unlikely to produce a valuation relevant to the future trading patterns of the related equity interest. The generally employed valuation method in initial public offerings, where possible, is the comparative market approach, which also can be relied upon to determine pro forma market value in a thrift stock conversion.
The comparative market approach derives valuation benchmarks from the trading patterns of selected peer institutions that, due to certain factors such as financial performance and operating strategies, enable the appraiser to estimate the potential value of the subject institution in a stock conversion offering. The pricing and trading history of recent initial public offerings and second-stage offerings of thrifts are also examined to provide evidence of the “new issue discount” or “marketability” that must be considered. In Chapter II, our valuation analysis focuses on the selection and comparison of the Company with a comparable group of publicly traded thrift institutions (the “Comparative Group”). Chapter III will detail any additional discounts or premiums that we believe are appropriate to the Company’s pro forma market value.
55
FELDMAN FINANCIAL ADVISORS, INC.
Selection Criteria
Selected market price and financial performance data for all public thrifts are shown in Exhibit III. The list excludes companies that are subject to being acquired under a pending transaction and companies that have a majority ownership interest controlled by a mutual holding company. Several criteria, discussed below, were used to select the individual members of the Comparative Group from the overall universe of publicly held thrifts.
| • | Operating characteristics – An institution's operating characteristics are the most important factors because they affect investors’ expected rates of return on a company’s stock under various business/economic scenarios, and they influence the market’s general perception of the quality and attractiveness of a given company. Operating characteristics, which may vary in importance during the business cycle, include financial variables such as profitability, balance sheet growth, capitalization, asset quality, and other factors such as lines of business and management strategies. |
| • | Degree of marketability and liquidity – Marketability of a stock reflects the relative ease and promptness with which a security may be sold when desired, at a representative current price, without material concession in price merely because of the necessity of sale. Marketability also connotes the existence of buying interest as well as selling interest and is usually indicated by trading volumes and the spread between the bid and asked price for a security. Liquidity of the stock issue refers to the organized market exchange process whereby the security can be converted into cash. We attempted to limit our selection to companies that have access to a regular trading market or price quotations. We eliminated from the comparative group companies with market prices that were materially influenced by publicly announced or widely rumored acquisitions. However, the expectation of industry consolidation is currently embedded in thrift equity valuations. |
| • | Geographic Location – The region of the country where a company operates is also of importance in selecting the comparative group. The operating environment for thrift institutions varies from region to region with respect to business and economic environments, real estate market conditions, speculative takeover activity, and investment climates. Economic and investor climates can also vary greatly within a region, particularly due to takeover activity. |
56
FELDMAN FINANCIAL ADVISORS, INC.
The operations of the Company fit the general profile of a profitable, full service community bank that offers both retail and commercial loan and deposit products in all of its markets. While residential mortgages remain the core product in the Company’s loan portfolio, commercial real estate, commercial business and home equity lending have increased over the past five years.
In determining the Comparative Group composition, we focused on the Company’s corporate structure, asset size, profitability, and equity level. As with any composition of a group of comparable companies, we broadened the selection criteria sufficiently to assemble a meaningful number of members for inclusion. Specifically, we applied the following selection criteria:
| • | Publicly traded thrift – stock-form thrift whose shares are traded on a major stock exchange or listed on NASDAQ. |
| • | Non-acquisition target – company is not subject to a pending acquisition. |
| • | Ownership profile – fully-converted thrifts (excludes mutual holding companies). |
| • | Current financial data – publicly reported financial data available as of September 30, 2009. |
| • | Asset size – total assets less than $1.0 billion. |
| • | Profitability measure – net income measuring greater than 0.50% relative to average assets for the year-to-date period ending September 30, 2009. |
| • | Capital level– tangible equity to assets ratio greater than 8.0% |
| • | Asset quality– Non-performing assets as a percentage of total assets less than 1.5%. |
57
FELDMAN FINANCIAL ADVISORS, INC.
To include one western thrift in the Comparative Group, we eliminated the asset quality selection criteria.
Due to the lack of thrifts located in the western mountain states (MT, OR, WA, ND, SD, UY, WY, CO and ID), we did not place a great emphasis on geography. Outside of the Company, there are no publicly traded thrifts in Montana, and only eight in the mountain states, with five headquartered in the state of Washington. All eight of these thrifts are greater than $700 million in asset size and four of the eight were greater than $1.0 billion in asset size. Only two of the eight generated returns of greater than 0.50% ROA and one of them was included in the Comparative Group.
As a result of applying the above criteria, the screening process produced a reliable representation of publicly traded thrifts with operations comparable to those of the Company. A general operating summary of the ten members selected for the Comparative Group is presented in Table 19
The companies in the Comparative Group were drawn from across the United States with four located in the Mid-Atlantic region (two in Pennsylvania and two from New York), one from the Midwest (Missouri), one from the Northeast (Massachusetts), three from the Southeast (all in Louisiana) and one from the West (Idaho). The asset sizes of the selected companies range from $332.2 million at Louisiana Bancorp, Inc. to $827.9 million at Home Federal Bancorp, Inc. The median asset size of the Comparative Group was $519.7 million, larger than the Company’s asset size of $300.7 million.
58
FELDMAN FINANCIAL ADVISORS, INC.
In comparison to recent performance trends of the aggregate public thrift industry, the Comparative Group companies generally exhibited well above-average profitability ratios, slightly higher capital ratios, with lower levels of problem assets when compared to national medians. While some differences inevitably may exist between the Company and the individual companies, we believe that the chosen Comparative Group as a whole provides a meaningful basis of financial comparison for valuation purposes.
Table 19
Comparative Group Operating Summary
As of September 30, 2009
Company | City | State | No. of Offices | Initial Conversion Date | Total Assets ($000s) | Equity/ Assets (%) | ||||||
Eagle Montana | Helena | MT | 7 | 04/05/00 | 300,680 | 10.12 | ||||||
Elmira Savings Bank, FSB | Elmira | NY | 10 | 03/01/85 | 505,896 | 10.73 | ||||||
Home Bancorp, Inc. | Lafayette | LA | 11 | 10/03/08 | 533,410 | 24.86 | ||||||
Home Federal Bancorp, Inc. | Nampa | ID | 24 | 12/20/07 | 827,899 | 25.32 | ||||||
Liberty Bancorp, Inc. | Liberty | MO | 10 | 07/24/06 | 384,243 | 11.26 | ||||||
Louisiana Bancorp, Inc. | Metairie | LA | 3 | 07/10/07 | 332,237 | 23.82 | ||||||
LSB Corporation | North Andover | MA | 8 | NA | 806,953 | 9.46 | ||||||
Rome Bancorp, Inc. | Rome | NY | 5 | 03/30/05 | 338,035 | 17.81 | ||||||
Teche Holding Company | New Iberia | LA | 20 | 04/19/95 | 765,071 | 9.34 | ||||||
TF Financial Corporation | Newtown | PA | 14 | 07/13/94 | 711,849 | 10.05 | ||||||
WVS Financial Corp. | Pittsburgh | PA | 6 | 11/29/93 | 369,989 | 8.37 | ||||||
Source: Eagle Montana; SNL Financial; Feldman Financial.
Source: Eagle Montana; SNL Financial.
59
FELDMAN FINANCIAL ADVISORS, INC.
Recent Financial Comparisons
Table 20 summarizes certain key financial comparisons between the Company and the Comparative Group. Tables 21 through 25 contain the detailed financial comparisons of the Company with the individual Comparative Group companies based on measures of profitability, income and expense components, yield-cost structure, capital levels, credit risk, balance sheet composition, and growth rates. Financial data for the Company, the Comparative Group, and All Public Thrift aggregate were utilized as of or for the most recent available last twelve month (“LTM”) period ending September 30, 2009.
The Company’s LTM return on average assets was 1.15%, reflecting a profitability measure above the Comparative Group median of 0.84% and significantly higher than the All Public Thrift median of 0.23%. The Company’s stronger earnings level was attributable primarily to level of net interest income and higher level of non-interest income aided by its high level of gains on sales of loans and fees related to servicing. All members of the Comparative Group exhibited an LTM ROAA below than the Company’s profitability ratio. The Company’s LTM return on average equity at 12.54% also compared favorably to the Comparative Group median of 5.21% and the All Public Thrift median of 1.52%.
The Company’s net interest income level of 3.25% relative to average assets was positioned above the Comparative Group median of 2.68% and the All Public Thrift median of 2.94%. The Company’s higher level of net interest income production was attributable primarily by its higher yield on earning assets and comparable level of cost of interest-bearing liabilities as compared to both the Comparative Group and the All Public Group. The Company’s net interest spread of 3.37% was slightly lower than the Comparative Group median of 3.55% but above the All Public Thrift median of 2.88%.
60
FELDMAN FINANCIAL ADVISORS, INC.
The Company’s earning asset yield measured 5.76% and exceeded the Comparative Group median of 5.68% and the All Public Thrift median of 5.41%. The Company’s higher asset yield resulted from having a larger concentration of non-mortgage loans and a lower percentage of residential mortgage loans as a percentage of total loans as compared to the Comparative Group. The Company’s ratio of non-mortgage loans to total loans measured 31.6% compared to the Comparative Group median of 26.7%. The Company’s ratio of residential mortgages to total loans measured 45.4% as compared to median of 54.8% for the Comparative Group. The Company’s cost of interest-bearing liabilities at 2.39% was comparable to the Comparative Group median cost of funds of 2.37% and below the All Public Thrift median of 2.55%. The Company’s level of borrowed funds was above the Comparative Group’s median debt utilization. Borrowings measured 23.9% of the Company’s assets and 15.9% for the Comparative Group median and 16.0% for the All Public Thrift median.
The Company’s non-interest operating income totaled 1.36% of average assets, exceeding the Comparative Group and All Public Thrift medians of 0.41% and 0.54%, respectively. Fees and service charges and servicing income revenue were the largest contributors to the Company’s non-interest revenue.
61
FELDMAN FINANCIAL ADVISORS, INC.
Table 20
Key Financial Comparisons
Eagle Bancorp Montana and the Comparative Group
As of or for the Last Twelve Months Ended September 30, 2009
| Eagle Bancorp Montana | Comp. Group Median | All Public Thrift Median | |||||||
Profitability | |||||||||
LTM Return on Average Assets | 1.15 | % | 0.84 | % | 0.23 | % | |||
LTM Return on Average Equity | 12.50 | 5.21 | 1.52 | ||||||
Core Return on Average Assets | 1.18 | 0.82 | 0.28 | ||||||
Core Return on Average Equity | 12.87 | 5.63 | 2.16 | ||||||
Income and Expense (% of avg. assets) | |||||||||
Total Interest Income | 5.28 | 5.23 | 5.11 | ||||||
Total Interest Expense | 2.03 | 2.44 | 2.23 | ||||||
Net Interest Income | 3.25 | 2.68 | 2.94 | ||||||
Provision for Loan Losses | 0.14 | 0.21 | 0.47 | ||||||
Other Operating Income | 1.35 | 0.41 | 0.54 | ||||||
Net Gains and Nonrecurring Income | 0.86 | 0.04 | 0.04 | ||||||
General and Administrative Expense | 2.78 | 2.88 | 2.81 | ||||||
Intangibles Amortization Expense | 0.00 | 0.00 | 0.00 | ||||||
Nonrecurring Expense | 0.05 | 0.04 | 0.05 | ||||||
Pre-tax Core Earnings | 1.69 | 1.03 | 0.32 | ||||||
Efficiency Ratio | 60.40 | 66.33 | 68.20 | ||||||
Yield-Cost Data | |||||||||
Yield on Interest-earning Assets | 5.76 | 5.68 | 5.41 | ||||||
Cost of Interest-bearing Liabilities | 2.37 | 2.37 | 2.55 | ||||||
Net Interest Spread | 3.37 | 3.55 | 2.88 | ||||||
Asset Utilization (% of avg. total assets) | |||||||||
Avg. Interest-earning Assets | 92.72 | 93.25 | 92.93 | ||||||
Avg. Interest-bearing Liabilities | 85.22 | 80.55 | 82.69 | ||||||
Avg. Net Interest-earning Assets | 7.20 | 10.30 | 10.25 | ||||||
62
FELDMAN FINANCIAL ADVISORS, INC.
Table 20 (continued)
Key Financial Comparisons
Eagle Bancorp Montana and the Comparative Group
As of or for the Last Twelve Months Ended September 30, 2009
| Eagle Bancorp Montana | Comp. Group Median | All Public Thrift Median | |||||||
Balance Sheet Composition (% of total assets) | |||||||||
Cash and Securities | 34.08 | % | 29.54 | % | 20.50 | % | |||
Loans Receivable, net | 57.19 | 63.75 | 72.21 | ||||||
Real Estate | 0.05 | 0.12 | 0.23 | ||||||
Intangible Assets | 0.00 | 0.00 | 0.08 | ||||||
Other Assets | 8.00 | 5.11 | 4.46 | ||||||
Total Deposits | 64.88 | 67.32 | 71.53 | ||||||
Borrowed Funds | 23.88 | 15.91 | 15.95 | ||||||
Other Liabilities | 1.12 | 1.09 | 0.94 | ||||||
Total Equity | 10.12 | 11.00 | 10.00 | ||||||
Loan Portfolio (% of total loans) | |||||||||
Residential Mortgage Loans | 45.44 | 54.78 | 36.79 | ||||||
Other Real Estate Mortgage Loans | 22.96 | 28.81 | 33.69 | ||||||
Non-mortgage Loans | 31.60 | 26.68 | 29.52 | ||||||
Growth Rates | |||||||||
Total Assets | 5.86 | 7.71 | 3.33 | ||||||
Total Loans | (4.82 | ) | 4.23 | (0.04 | ) | ||||
Total Deposits | 6.55 | 7.28 | 8.28 | ||||||
Regulatory Capital Ratios | |||||||||
Tier 1 Leverage Ratio | 9.45 | 9.39 | 8.80 | ||||||
Tier 1 Risk-based Capital | 13.43 | 14.40 | 12.22 | ||||||
Total Risk-based Capital | 13.72 | 15.47 | 13.32 | ||||||
Credit Risk Ratios | |||||||||
Nonperforming Loans / Total Loans | 0.73 | 0.93 | 2.46 | ||||||
Nonperforming Assets / Total Assets | 0.47 | 0.66 | 2.01 | ||||||
Reserves / Total Loans | 0.36 | 1.07 | 1.29 | ||||||
Reserves / Nonperforming Assets | 44.36 | 93.11 | 47.20 | ||||||
Source: Eagle Bancorp; SNL Financial; Feldman Financial.
63
FELDMAN FINANCIAL ADVISORS, INC.
The Company’s provision for loan losses measured 0.14% of average assets, as compared to the Comparative Group median of 0.21% and the All Public Thrift median of 0.47%. The Company’s nonperforming asset ratio measured 0.47% of total assets versus the Comparative Group median of 0.66% and All Public Thrift median of 2.01%. The Company’s nonperforming loan ratio as a percent of gross loans was 0.73% and was below the corresponding Comparative Group median of 0.93% and the All Public Thrift median of 2.46%. The Company maintained a lower level of loan loss reserves at 0.36% of total loans versus the Comparative Group median of 1.07% and the All Public Thrift median of 1.09%.
The Company’s operating expense ratio was lower than both the Comparative Group and All Public Group medians. The Company’s general and administrative expense ratio was 2.78% as compared to the Comparative Group median of 2.88% and the All Public Thrift median of 2.81%. Following the Conversion, operating expenses are likely to increase as the Company will recognize additional employee compensation and benefit expenses resulting from the shares and options granted to employees and executives under the benefit plans.
The Company’s balance sheet composition had a higher concentration of cash and securities and a lower level of loans compared to the Comparative Group and All Public Group. Total net loans amounted to 57.2% of assets at the Company as of September 30, 2009, versus 63.8% for the Comparative Group median and 72.2% for the All Public Group. Cash and securities aggregated 34.1% of assets at the Company, compared to medians of 29.5% and 20.6% for the Comparative Group and All Public Group, respectively. The Company had no intangible assets, same as the Comparative Group median. The All Public Group had a median intangible asset to total assets ratio 0.08%. Other assets, excluding intangibles and foreclosed real estate, composed 8.0% of the Company’s assets versus the Comparative Group median of 5.1% and the All Public Group median of 4.5%.
64
FELDMAN FINANCIAL ADVISORS, INC.
The Company’s borrowings level at 23.9% of assets reflected the continued usage of FHLB advances as a supplemental funding source. Companies characterize the Comparative Group with borrowing activity lower than the Company and similar to the overall thrift industry as demonstrated by the median debt level of 15.9% of total assets versus the All Public Thrift median of 16.0%. The Company’s equity level before the Stock Offering was 10.1% relative to assets, which was just below the Comparative Group median of 11.0% and comparable to the All Public Group median of 10.0%. The Company’s risk-based capital ratios were comparable to the Comparative Group median and the All Public Thrift median.
While the Company’s asset size has grown over the past year, the level of loans has declined. Over the past year, assets have grown 5.9% compared to median growth rates of 7.7% and 3.3% for the Comparative Group and All Public Group, respectively. The Company’s loan growth was a negative 4.8%, compared to median growth of 4.2% for the Comparative Group and a negative 0.04% for the All Public Group. The Company’s deposit growth measured 6.6%, compared to a median of 7.3% for the Comparative Group and 8.3% for the All Public Group.
In summary, the Company’s recent earnings performance exceeded the results attained by the Comparative Group and All Public Thrift aggregate when based on returns on assets and returns on equity. The Company’s profitability was a result of a higher level of net interest income and strong non
65
FELDMAN FINANCIAL ADVISORS, INC.
Table 21
General Financial Performance Ratios
As of or for the Latest Twelve Months Ended September 30, 2009
| Total Assets ($000s) | Total Deposits ($000s) | Total Equity/ Assets (%) | Tang. Equity/ Assets (%) | Net Interest Margin (%) | Effcy. Ratio (%) | LTM ROA (%) | LTM ROE (%) | Core ROA (%) | Core ROE (%) | |||||||||||||||
Eagle Montana | 300,680 | 195,080 | 10.12 | 10.12 | 3.50 | 60.40 | 1.15 | 12.54 | 1.18 | 12.91 | ||||||||||||||
Comparative Group Average | 557,558 | 367,181 | 15.10 | 14.71 | 3.43 | 66.57 | 0.80 | 6.21 | 0.80 | 6.65 | ||||||||||||||
Comparative Group Median | 519,653 | 368,361 | 11.00 | 10.12 | 3.55 | 66.33 | 0.84 | 5.21 | 0.82 | 5.63 | ||||||||||||||
All Public Thrift Average | 2,959,439 | 1,782,124 | 10.90 | 10.08 | 3.07 | 70.46 | (0.41 | ) | (7.36 | ) | (0.31 | ) | (6.04 | ) | ||||||||||
All Public Thrift Median | 913,866 | 662,494 | 10.00 | 9.13 | 3.15 | 68.20 | 0.23 | 1.52 | 0.28 | 2.16 | ||||||||||||||
Comparative Group | ||||||||||||||||||||||||
Elmira Savings Bank, FSB | 505,896 | 360,085 | 10.73 | 8.35 | 3.59 | 68.75 | 0.91 | 8.84 | 0.71 | 6.79 | ||||||||||||||
Home Bancorp, Inc. | 533,410 | 376,636 | 24.86 | 24.86 | 4.72 | 65.11 | 0.74 | 3.11 | 1.11 | 4.87 | ||||||||||||||
Home Federal Bancorp, Inc. | 827,899 | 514,858 | 25.32 | 25.32 | 3.50 | 86.66 | 1.14 | 3.99 | NA | NA | ||||||||||||||
Liberty Bancorp, Inc. | 384,243 | 279,576 | 11.26 | 10.77 | 3.64 | 63.98 | 0.57 | 4.73 | 0.58 | 4.85 | ||||||||||||||
Louisiana Bancorp, Inc. | 332,237 | 186,609 | 23.82 | 23.82 | 3.34 | 62.23 | 0.82 | 3.16 | 0.82 | 3.19 | ||||||||||||||
LSB Corporation | 806,953 | 471,351 | 9.46 | 9.46 | 2.51 | 62.48 | 0.94 | 10.54 | 0.94 | 10.38 | ||||||||||||||
Rome Bancorp, Inc. | 338,035 | 216,422 | 17.81 | 17.81 | 4.24 | 67.54 | 0.86 | 4.82 | 0.93 | 5.24 | ||||||||||||||
Teche Holding Company | 765,071 | 585,469 | 9.34 | 8.90 | 4.01 | 67.57 | 0.91 | 9.98 | 1.03 | 11.26 | ||||||||||||||
TF Financial Corporation | 711,849 | 531,949 | 10.05 | 9.47 | 3.27 | 69.08 | 0.53 | 5.60 | 0.54 | 5.63 | ||||||||||||||
WVS Financial Corp. | 369,989 | 148,857 | 8.37 | 8.37 | 1.49 | 52.28 | 0.54 | 7.33 | 0.56 | 7.64 | ||||||||||||||
Source: Eagle Montana; SNL Financial; Feldman Financial.
66
FELDMAN FINANCIAL ADVISORS, INC.
Table 22
Income and Expense Analysis
For the Latest Twelve Months Ended September 30, 2009
| As a Percent of Average Assets | |||||||||||||||||||||||
| Interest Income | Interest Expense | Net Interest Income | Other Oper. Income | Gains & Non-rec. Income | Loan Loss Prov. | Gen. & Admin. Expense | Amort. of Intang, | Non-rec. Expense | Pretax Core Earnings | ||||||||||||||
Eagle Montana | 5.28 | 2.03 | 3.25 | 1.36 | 0.86 | 0.14 | 2.78 | 0.00 | 0.05 | 1.69 | |||||||||||||
Comparative Group Average | 5.16 | 2.32 | 2.64 | 0.69 | 0.05 | 0.40 | 2.74 | 0.01 | 0.04 | 1.11 | |||||||||||||
Comparative Group Median | 5.23 | 2.44 | 2.68 | 0.41 | 0.04 | 0.21 | 2.88 | 0.00 | 0.04 | 1.03 | |||||||||||||
All Public Thrift Average | 5.08 | 2.21 | 2.88 | 0.83 | (0.03 | ) | 1.00 | 2.91 | 0.22 | 0.05 | (0.23 | ) | |||||||||||
All Public Thrift Median | 5.11 | 2.23 | 2.94 | 0.54 | 0.04 | 0.47 | 2.81 | 0.00 | 0.05 | 0.32 | |||||||||||||
Comparative Group | |||||||||||||||||||||||
Elmira Savings Bank, FSB | 5.23 | 2.02 | 2.53 | 0.36 | 0.60 | 0.22 | 2.92 | 0.05 | 0.05 | 1.03 | |||||||||||||
Home Bancorp, Inc. | 5.78 | 2.69 | 2.08 | 1.16 | (0.45 | ) | 0.19 | 3.41 | 0.00 | 0.04 | 1.63 | ||||||||||||
Home Federal Bancorp, Inc. | 5.01 | 2.79 | 2.04 | 1.13 | 0.17 | 2.25 | 4.02 | 0.00 | 0.03 | NA | |||||||||||||
Liberty Bancorp, Inc. | 5.32 | 2.54 | 2.06 | 0.45 | 0.12 | 0.29 | 2.84 | 0.04 | 0.05 | 0.81 | |||||||||||||
Louisiana Bancorp, Inc. | 5.28 | 1.68 | 2.72 | 0.11 | 0.03 | 0.04 | 2.14 | 0.00 | 0.04 | 1.26 | |||||||||||||
LSB Corporation | 5.23 | 1.42 | 3.46 | 0.24 | 0.04 | 0.20 | 1.69 | 0.00 | 0.05 | 0.81 | |||||||||||||
Rome Bancorp, Inc. | 5.23 | 2.34 | 2.81 | 0.72 | (0.03 | ) | 0.12 | 3.11 | 0.00 | 0.04 | 1.37 | ||||||||||||
Teche Holding Company | 5.66 | 2.75 | 2.64 | 2.22 | (0.06 | ) | 0.39 | 3.97 | 0.01 | 0.05 | 1.51 | ||||||||||||
TF Financial Corporation | 5.13 | 1.83 | 2.75 | 0.34 | 0.12 | 0.40 | 2.41 | 0.00 | 0.05 | 0.76 | |||||||||||||
WVS Financial Corp. | 3.71 | 3.13 | 3.28 | 0.14 | 0.00 | (0.07 | ) | 0.84 | 0.00 | 0.04 | 0.84 | ||||||||||||
Source: Eagle Montana; SNL Financial; Feldman Financial.
67
FELDMAN FINANCIAL ADVISORS, INC.
Table 23
Yield-Cost Structure and Growth Rates
For the Latest Twelve Months Ended September 30, 2009
| Avg. Int. Earn. Assets/ Assets | Avg. Int.-Bear. Liabs./ Assets | Avg. Net Earning Assets/ Assets | Avg. Equity/ Assets | Yield on Int.-Earn. Assets | Cost of Int-Bear. Liabs. | Net Interest Spread | Asset Growth Rate | Loan Growth Rate | Deposit Growth Rate | ||||||||||||||
Eagle Montana | 92.72 | 85.22 | 7.20 | 8.84 | 5.76 | 2.39 | 3.37 | 5.86 | (4.82 | ) | 6.55 | ||||||||||||
Comparative Group Average | 93.35 | 77.87 | 14.62 | 14.76 | 5.71 | 2.39 | 3.37 | 5.61 | 8.61 | 12.83 | |||||||||||||
Comparative Group Median | 93.25 | 80.55 | 10.30 | 10.63 | 5.68 | 2.37 | 3.55 | 7.71 | 4.23 | 7.28 | |||||||||||||
All Public Thrift Average | 92.53 | 80.13 | 11.00 | 10.84 | 5.44 | 2.54 | 2.97 | 6.47 | 2.77 | 12.99 | |||||||||||||
All Public Thrift Median | 92.93 | 82.69 | 10.25 | 9.72 | 5.41 | 2.55 | 2.88 | 3.33 | (0.04 | ) | 8.28 | ||||||||||||
Comparative Group | |||||||||||||||||||||||
Elmira Savings Bank, FSB | 85.69 | 78.08 | 7.61 | 9.90 | 5.87 | 2.50 | 3.37 | 9.37 | (2.40 | ) | 5.53 | ||||||||||||
Home Bancorp, Inc. | 93.90 | 60.61 | 33.29 | 23.28 | 6.04 | 2.04 | 4.00 | 6.04 | 7.47 | 6.55 | |||||||||||||
Home Federal Bancorp, Inc. | 82.32 | NA | NA | 24.59 | NA | NA | NA | 14.18 | 10.56 | 38.06 | |||||||||||||
Liberty Bancorp, Inc. | 87.70 | NA | NA | 11.37 | NA | NA | NA | 12.10 | 19.86 | 23.81 | |||||||||||||
Louisiana Bancorp, Inc. | 94.60 | NA | NA | 24.79 | 5.36 | NA | NA | 14.53 | 36.35 | 25.17 | |||||||||||||
LSB Corporation | 92.60 | 83.01 | 9.58 | 8.53 | 5.41 | 3.24 | 2.17 | 10.66 | 18.62 | 17.73 | |||||||||||||
Rome Bancorp, Inc. | 91.44 | 71.00 | 20.44 | 17.62 | 5.68 | 1.85 | 3.82 | 0.64 | (3.18 | ) | 4.19 | ||||||||||||
Teche Holding Company | 94.42 | 83.40 | 11.02 | 9.34 | 6.12 | 2.40 | 3.72 | (0.57 | ) | 0.67 | (0.64 | ) | |||||||||||
TF Financial Corporation | 96.87 | 91.10 | 5.77 | 9.72 | 5.47 | 2.33 | 3.13 | (0.87 | ) | (2.87 | ) | 8.00 | |||||||||||
WVS Financial Corp. | 113.94 | NA | NA | 8.45 | NA | NA | NA | (10.01 | ) | 0.98 | (0.08 | ) | |||||||||||
Source: Eagle Montana; SNL Financial; Feldman Financial.
68
FELDMAN FINANCIAL ADVISORS, INC.
Table 24
Balance Sheet Composition
As of the Latest Twelve Months Ended September 30, 2009
| As a Percent of Total Assets | ||||||||||||||||||||
| Cash & Securities | Net Loans | Real Estate | Intang. Assets | Other Assets | Total Deposits | Borrowed Funds | Other Liabs. | Total Liabs. | Total Equity | |||||||||||
Eagle Montana | 34.08 | 57.19 | 0.05 | 0.00 | 8.00 | 64.88 | 23.88 | 1.12 | 89.88 | 10.12 | ||||||||||
Comparative Group Average | 32.22 | 62.81 | 0.39 | 0.43 | 4.61 | 64.68 | 19.04 | 1.18 | 84.90 | 15.10 | ||||||||||
Comparative Group Median | 29.54 | 63.75 | 0.12 | 0.00 | 5.11 | 67.32 | 15.91 | 1.09 | 89.00 | 11.00 | ||||||||||
All Public Thrift Average | 23.97 | 70.09 | 0.53 | 0.91 | 4.73 | 69.73 | 18.26 | 1.16 | 89.10 | 10.90 | ||||||||||
All Public Thrift Median | 20.57 | 72.21 | 0.23 | 0.08 | 4.46 | 71.53 | 15.95 | 0.94 | 90.00 | 10.00 | ||||||||||
Comparative Group | ||||||||||||||||||||
Elmira Savings Bank, FSB | 31.86 | 62.24 | 0.10 | 2.60 | 3.45 | 71.18 | 17.23 | 0.86 | 89.27 | 10.73 | ||||||||||
Home Bancorp, Inc. | 31.34 | 63.78 | 0.00 | 0.00 | 5.11 | 70.61 | 3.73 | 0.81 | 75.14 | 24.86 | ||||||||||
Home Federal Bancorp, Inc. | 27.73 | 63.06 | 2.22 | 0.00 | 8.26 | 62.19 | 10.24 | 2.25 | 74.68 | 25.32 | ||||||||||
Liberty Bancorp, Inc. | 12.97 | 79.15 | 0.99 | 0.55 | 6.48 | 72.76 | 15.36 | 0.62 | 88.74 | 11.26 | ||||||||||
Louisiana Bancorp, Inc. | 55.21 | 43.70 | 0.17 | 0.00 | 1.20 | 56.17 | 18.52 | 1.50 | 76.18 | 23.82 | ||||||||||
LSB Corporation | 33.51 | 63.72 | 0.01 | 0.00 | NA | 58.41 | 31.58 | 0.55 | 90.54 | 9.46 | ||||||||||
Rome Bancorp, Inc. | 9.28 | 84.55 | 0.00 | 0.00 | 6.26 | 64.02 | 16.46 | 1.70 | 82.19 | 17.81 | ||||||||||
Teche Holding Company | 16.35 | 77.13 | 0.26 | 0.49 | 5.99 | 76.52 | 13.15 | 0.98 | 90.66 | 9.34 | ||||||||||
TF Financial Corporation | 20.64 | 74.96 | 0.14 | 0.64 | 3.77 | 74.73 | 14.01 | 1.21 | 89.95 | 10.05 | ||||||||||
WVS Financial Corp. | 83.31 | 15.84 | 0.00 | 0.00 | 1.00 | 40.23 | 50.10 | 1.29 | 91.63 | 8.37 | ||||||||||
Source: Eagle Montana; SNL Financial; Feldman Financial.
69
FELDMAN FINANCIAL ADVISORS, INC.
Table 25
Regulatory Capital, Credit Risk, and Loan Composition
As of or for the Latest Twelve Months Ended September 30, 2009
| Tier 1 Leverage Capital Ratio | Tier 1 Risk- based Capital | Total Risk- based Capital | NPLs/ Loans | Total NPAs/ Assets | Resrvs./ NPAs | Resrvs./ Loans | Resid. Mtgs./ Loans | Other Real Est. Mtgs./ Loans | Nonmtg. Loans/ Loans | |||||||||||
Eagle Montana | 9.45 | 13.43 | 13.72 | 0.73 | 0.47 | 44.36 | 0.36 | 45.44 | 22.96 | 31.60 | ||||||||||
Comparative Group Average | 12.46 | 20.67 | 21.64 | 1.00 | 0.69 | 95.15 | 1.44 | 46.87 | 29.85 | 23.28 | ||||||||||
Comparative Group Median | 9.39 | 14.40 | 15.47 | 0.93 | 0.66 | 93.11 | 1.07 | 54.78 | 28.81 | 26.68 | ||||||||||
All Public Thrift Average | 9.55 | 14.16 | 15.20 | 3.65 | 3.21 | 61.79 | 1.71 | 38.15 | 33.97 | 27.89 | ||||||||||
All Public Thrift Median | 8.80 | 12.22 | 13.32 | 2.46 | 2.01 | 47.20 | 1.29 | 36.79 | 33.69 | 29.52 | ||||||||||
Comparative Group | ||||||||||||||||||||
Elmira Savings Bank, FSB | 8.12 | 13.82 | 14.94 | 0.93 | 0.68 | 93.61 | 1.02 | NA | NA | NA | ||||||||||
Home Bancorp, Inc. | 19.86 | 29.49 | 30.38 | 1.03 | 0.66 | 93.11 | 0.96 | 36.79 | 28.81 | 34.40 | ||||||||||
Home Federal Bancorp, Inc. | 19.61 | 33.57 | 34.89 | NA | NA | NA | 5.32 | NA | NA | NA | ||||||||||
Liberty Bancorp, Inc. | 9.81 | 11.61 | 12.68 | 0.14 | 1.11 | 65.90 | 0.92 | NA | NA | NA | ||||||||||
Louisiana Bancorp, Inc. | 18.22 | 43.81 | 44.73 | 1.25 | 0.72 | 70.70 | 1.15 | 54.94 | 34.79 | 10.27 | ||||||||||
LSB Corporation | 8.97 | 12.64 | 13.83 | 0.68 | 0.45 | 180.92 | 1.28 | 25.04 | 48.28 | 26.68 | ||||||||||
Rome Bancorp, Inc. | 15.58 | 21.79 | 22.51 | 0.59 | 0.50 | 122.11 | 0.72 | 54.78 | 18.00 | 27.22 | ||||||||||
Teche Holding Company | 7.89 | 11.51 | 12.72 | 1.02 | 1.05 | 84.97 | 1.14 | 62.79 | 19.38 | 17.83 | ||||||||||
TF Financial Corporation | 8.80 | 14.97 | 16.00 | 0.58 | 0.58 | 104.76 | 0.80 | NA | NA | NA | ||||||||||
WVS Financial Corp. | 7.70 | 13.45 | 13.76 | 2.78 | 0.44 | 40.31 | 1.12 | NA | NA | NA | ||||||||||
Source: Eagle Montana; SNL Financial; Feldman Financial.
70
FELDMAN FINANCIAL ADVISORS, INC.
III. MARKET VALUE ADJUSTMENTS
General Overview
This concluding chapter of the Appraisal identifies certain additional adjustments to the Company’s estimated pro forma market value relative to the Comparative Group selected in Chapter II. The adjustments discussed in this chapter are made from the viewpoints of potential investors, which would include depositors holding subscription rights and unrelated parties who may purchase stock in a community offering. It is assumed that these potential investors are aware of all relevant and necessary facts as they would pertain to the value of the Company relative to other publicly traded thrift institutions and relative to alternative investments.
Our appraised value is predicated on a continuation of the current operating environment for the Company and thrift institutions in general. Changes in the Company’s operating performance along with changes in the local and national economy, the stock market, interest rates, the regulatory environment, and other external factors may occur from time to time, often with great unpredictability, which could impact materially the pro forma market value of the Company or thrift stocks in general. Therefore, the Valuation Range provided herein is subject to a more current re-evaluation prior to the actual completion of the Stock Offering.
In addition to the comparative operating fundamentals discussed in Chapter II, it is important to address additional market value adjustments based on certain financial and other criteria, which include, among other factors:
| (1) | Earnings Prospects |
| (2) | Financial Condition |
| (3) | Market Area |
| (4) | Management |
71
FELDMAN FINANCIAL ADVISORS, INC.
| (5) | Dividend Policy |
| (6) | Liquidity of the Issue |
| (7) | Subscription Interest |
| (8) | Stock Market Conditions |
| (9) | Recent Acquisition Activity |
| (10) | New Issue Discount |
| (11) | Effect of Government Regulations and Regulatory Reform |
Earnings Prospects
Earnings prospects are dependent upon the sensitivity of asset yields and liability costs to changes in market interest rates, the credit quality of assets, the stability of non-interest components of income and expense, and the ability to profitably leverage the balance sheet. Each of the foregoing is an important factor to investors in assessing earnings prospects.
As the nation’s economy continues to deal with the ramifications of the downturn in the housing industry, the contraction in the credit markets and high levels of unemployment, the U.S. Federal Reserve has lowered rates in an effort to stimulate the credit markets and to help the U.S. economy recover from the recently ended recession. The Bank derives its income mainly from the difference or “spread” between the interest earned on loans, securities and other interest-earning assets, and interest paid on deposits, borrowings and other interest-bearing liabilities. To counter the slowdown in the economy and in an effort to open up the credit markets and stimulate the economy, the Federal Reserve has reduced the fed funds rate to its current target level of 0.00% to 0.25%.
While the Company derives its income mainly from the difference or “spread” between the interest earned on loans, securities and other interest-earning assets, and interest paid on deposits, borrowings and other interest-bearing liabilities, it also generates significant levels of noninterest income due to its mortgage banking and mortgage servicing operations. For the fiscal years ended
72
FELDMAN FINANCIAL ADVISORS, INC.
June 30, 2005 to 2009 and for the three months ended September 30, 2009, the Company has been able to maintain a relatively constant net interest rate spread and has supplemented this with a strong level of noninterest income. For the year ended June 30, 2005, the Company recorded a net interest spread of 3.51% and reported a net interest spread of 3.52% for the year ended June 30, 2009. The lowest level the net interest spread reached was 3.06% for fiscal year 2007. For the three months ended September 30, 2009, the Company reported a net interest spread of 3.58%. During this same period, the Company’s level on noninterest income to average assets ranged from 0.87% for fiscal year 2008 to 1.05% for fiscal 2009. For the three months ended September 30, 2009, the Company reported a level on noninterest income of 1.44%. The Company’s noninterest income is bolstered by a significant level of servicing and mortgage banking income.
The infusion of capital from the Stock Offering will provide the Company with the additional operating flexibility and opportunities, although it will take time for the Company to prudently invest these proceeds and generate significant returns on these funds. In the current business cycle, interest rate risk poses a threat to the Company’s future earnings growth. While the reinvestment returns from the offering proceeds will augment the Company’s net income, the positive impact is restrained by the added expenses associated with the stock benefit plans. Future growth is dependent on acquisitions as organic growth in the market is limited. In light of the Company’s current earnings base, its pro forma profitability ratios (ROA, ROE and efficiency ratio) are expected to continue to exceed the Comparative Group’s performance in the near term. Thus, we believe an upward adjustment is warranted for the Company’s near term earnings prospects as compared to the Comparative Group.
73
FELDMAN FINANCIAL ADVISORS, INC.
Financial Condition
As noted in Chapter II, with total assets of $300.7 million, the Company is smaller as compared to the Comparative Group median of $519.7 million. At the pro forma midpoint of the offering range, the Company is expected to have total assets approximating $320.0 million. The Company has a lower level of net loans as a percentage of total assets at 57.2% compared to the Comparative Group median of 63.8% while having a higher level of cash and securities at 34.1% of total assets as compared to the Comparative Group median of 29.5%.
The Company has a lower level of deposits and a higher reliance on borrowed funds as compared to the Comparative Group. As a percentage of total assets, the Company has a deposit ratio of 64.9% and a borrowings-to-assets ratio of 23.9% compared to the Comparative Group medians of 67.3% and 15.9%, respectively.
The Company’s equity to assets ratio of 10.12% is similar to the Comparative Group median of 11.00%. At the pro forma midpoint of the offering range, the Company is projected to have a significantly enhanced equity-to-assets ratio of 15.5%. The Company has an intangibles-to-assets ratio of 0.0% compared to the Comparative Group median of 0.0%.
An area of importance for investors is the level of nonperforming loans and the level of allowance for loan losses as compared to the level of nonperforming assets. The Company’s level of nonperforming assets as a percentage of total assets at 0.47% is lower than the Comparative Group median of 0.66%. The Company’s level of reserves as a percentage on nonperforming assets at 44.4% is significantly lower than that of Comparative Group median of 93.1%.
Taken as a whole, we believe that no adjustment is warranted for financial condition.
74
FELDMAN FINANCIAL ADVISORS, INC.
Market Area
The Company’s market area can be defined as having a relatively stable economic climate, which enables the Company to continue to produce strong earnings while keeping non-performing assets at low levels. This stable economic climate is offset somewhat by the limited growth of the market. The members of the Comparative Group were drawn from across the United States and are characterized by a cross-section of market areas. Demographic data for the Company’s local market projects income growth below that of the United States as a whole. The Company’s market area has lower per capita and household income levels and lower unemployment rates than those of the United States. We do not believe that market area conditions affecting the Company warrant a valuation adjustment.
Management
The Company’s current Chief Executive Officer (“CEO”), Peter J. Johnson, assumed his position in 2007. Prior to being named President, he had served as American Federal Savings Bank’s Executive Vice President and Chief Financial Officer and he joined American Federal Savings Bank in 1981. The previous CEO, Larry A. Dreyer, currently serves as the Chairman of the Board. He was previously the President and Chief Executive Officer of American Federal Savings Bank from 1993 and 1995, respectively, to July 2007 and he joined American Federal Savings Bank in 1973. Under their leadership, the Company has produced strong financial performance over the past few years. We believe that investors will take into account that the Company is professionally and knowledgeably managed by a team of experienced banking executives. Based on these considerations, we believe no adjustment is warranted based on management.
75
FELDMAN FINANCIAL ADVISORS, INC.
Dividend Policy
As of September 30, 2009, Eagle Bancorp paid a quarterly cash dividend of $0.26 per share, which equals $1.04 per share on an annualized basis. After the conversion, the Company intends to continue to pay cash dividends on a quarterly basis.
Payment of cash dividends has become commonplace among publicly traded thrifts. Eight of the ten members of the Comparative Group companies currently pay dividends. The median dividend yield of the Comparative Group was 2.98% as of December 3, 2009, and was above the median All Public Thrift dividend yield of 2.36%. We believe that no adjustment is necessary for this factor.
Liquidity of the Issue
Nine of the ten members of the Comparative Group are listed on the NASDAQ National Market, while one company is listed on NYSE AMEX (American Stock Exchange). The Company currently has its common stock listed for trading on the NASDAQ National Market and following the Stock Offering will continue to be a listed company. Thus, we do not believe that any further adjustment is necessary to address this factor.
Subscription Interest
Until the downturn in the housing market and the related tightening of both the credit and capital markets, initial public offerings (“IPOs”) of thrift stocks had attracted a great deal of investor interest. As recently as 2007, there were 26 total completed conversions. The total number fell to ten for 2008 and only four through November of 2009. Of the 26 completed transactions in 2007, eight were standard conversions, seven were second-step MHC conversions and eleven were initial MHC transactions.
76
FELDMAN FINANCIAL ADVISORS, INC.
The Company has retained the services of Stifel, Nicolaus & Company, Incorporated to assist in the marketing and sale of the Stock Offering. The Company also has an employee stock ownership plan (“ESOP”) that will purchase common stock in the offering. The Company’s Board members and executive officers currently anticipate purchasing 75,000 shares representing an aggregate amount of $750,000 of common stock. The maximum number of shares of common stock that may be purchased by a person or persons exercising subscription rights through a single qualifying deposit account held jointly is 25,000 shares. In addition to the above purchase limitations, there is an ownership limitation for stockholders other than the employee stock ownership plan. Shares of common stock that individuals purchase in the offering individually and together with persons described above, plus any shares you and they receive in exchange for existing shares of Eagle Bancorp common stock, may not exceed 5% of the total shares of common stock to be issued and outstanding after the completion of the conversion and offering.
As interest in thrift IPOs has waned over the past two years, second-step offerings have found it even harder to generate investor interest. After seven second-step conversions closed during 2007, only one closed during 2008 and none since the most recently completed in April 2008. As demand has dropped and market valuations have declines, so to have the pricing ratios for second-step conversions. The most recently completed second-step priced at 61.5% of pro forma book value. With a second-step offering, potential investors have the opportunity to purchase existing traded stock before the offering in the public markets. Further, the aftermarket demand for shares in second-step offerings has not been as strong as standard or MHC thrift IPOs. As an indication of this factor, it is anticipated that approximately 30% of the to-be issued stock will be sold in the subscription offering. After this consideration of historical experience, we believe a downward adjustment is warranted.
77
FELDMAN FINANCIAL ADVISORS, INC.
Stock Market Conditions
Table 27 graphically displays the performance of the SNL Thrift Index of all publicly traded thrifts and the SNL Thrift Index (of thrifts with assets less than $500 million) as compared to the Standard & Poor’s 500-Stock Index (“S&P 500”) since year-end 2005. The SNL Thrift Index and SNL Index < $500 Million asset thrifts have both significantly underperformed the broader stock index, declining 65.9% and 30.6%, respectively, during the period from December 31, 2005 to December 3, 2009, as compared to the S&P 500 decreasing by 11.9%. Since December 31, 2008, the SNL Thrift Index declined 13.9% and the SNL Thrift Index < $500 Million increased 3.6% compared to a 23.5% increase in the S&P 500.
After reporting record net income of $16.4 billion in 2005 and near record earnings of $15.9 billion in 2006, earnings of thrift industry institutions began to suffer as the housing market turned negative. The problems in the housing industry also had a negative effect on asset quality measures.
The OTS reported that the thrift industry reported a net loss of $13.4 billion for 2008. Through the first quarter of 2009, the thrift industry reported six consecutive quarters on negative earnings. However, the industry has now reported consecutive quarters of basically break-even operations. The thrift industry reported a profit of $1.3 billion for the third quarter, or 0.49% of average assets (ROA). However, $1.1 billion of that amount was due to one thrift’s large nonoperating gain. Absent that nonoperating gain, net income would have been approximately $200 million, or about 0.07% of average assets. Third quarter results were an improvement from the third quarter one year ago when the industry reported losses of $4.4 billion, or 1.48% of average assets.
78
FELDMAN FINANCIAL ADVISORS, INC.
Second quarter 2009 earnings were revised downward from a $4 million profit to a loss of $94 million. That amount included the $325 million after-tax FDIC special assessment expense. Absent that nonoperating charge, net income would have been approximately $230 million, or 0.08% of average assets.
The problems facing the thrift industry are the same issues facing the entire financial services sector and the economy as a whole. According to the National Bureau of Economic Research (“NBER”), the economy has been in a recession since December 2007, which only recently technically ended with the positive Gross Domestic Product (“GDP”) growth of 3.5% for the third quarter of 2009. While this technically ends the recession, the U.S. economy continues to suffer as unemployment has risen above 10% and home foreclosures continue to grow.
The effects of the downturn in the housing markets and the related freezing of the credit markets, has had a wide impact on the financial services industry. Major institutions, including Washington Mutual, Citicorp, Lehman Brothers, AIG, Wachovia, National City, IndyMac, Fannie Mae and Freddie Mac have either gone bankrupt, failed or required government intervention to remain solvent. In response to these problems, the Treasury Department (“Treasury”) established the Trouble Asset Relief Program (“TARP”), which was a $700 billion fund that the Treasury was going to use to buy certain problem assets from financial institutions. The program has since morphed into the Treasury making direct investments in companies but no longer buying troubled assets, although the Treasury did purchase $50 billion in problem assets from AIG.
79
FELDMAN FINANCIAL ADVISORS, INC.
Table 26
Comparative Stock Index Performance
December 31, 2005 to December 3, 2009
(Index Value 100 = 12/31/05)
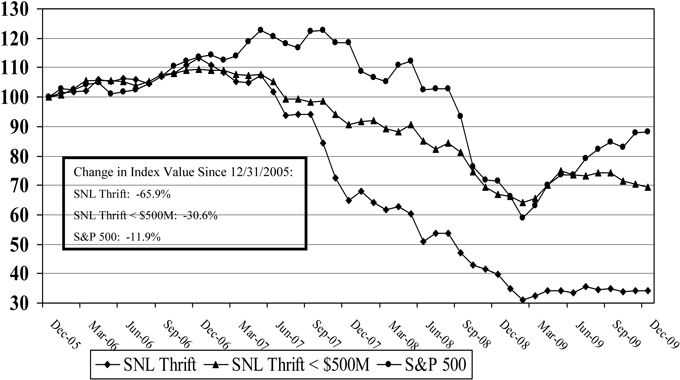
80
FELDMAN FINANCIAL ADVISORS, INC.
Recent Acquisition Activity
Acquisition speculation is one factor underpinning the prices of thrift stocks. Table 27 summarizes recent acquisition activity involving banks and thrifts based in Montana. Since January 1, 2005, there have been five acquisitions involving Montana financial institutions, none of which were thrift institutions. There has been only one completed acquisition during each of 2008 and 2009 and none during 2007. Given the lack of recent merger activity in Montana and the fact that the Company is undertaking a second-step offering, we do not believe that acquisition premiums are a factor to consider in determining the Company’s pro forma market value. We believe that any speculative interest may be reflected to some degree in the general trading values of thrift stocks and encompass members of the Comparative Group as well. However, since converting thrifts are subject to a three-year regulatory moratorium from being acquired and due to the limited acquisitions completed in the state, acquisition speculation in the Company’s stock should tend to be less compared to the stocks of the Comparative Group companies.
Marketability Discount
A “marketability” discount that reflects investor concerns and investment risks inherent in IPOs and second-step offerings is a factor to be considered for purposes of valuing converting thrifts. The magnitude of the new issue discount typically expands during periods of declining thrift stock prices as investors require larger inducements, and narrows during strong market conditions. As stock prices for financial institutions fell over the past two years, it became more difficult to provide a discount significantly low enough to induce investors due to public companies trading at such low market multiples, hence the slowdown in conversion activity discussed
81
FELDMAN FINANCIAL ADVISORS, INC.
earlier. The thrift conversion market continues to be timid as evidenced by the limited number of completed conversions during 2008 and 2009. In addition, after-market conditions for second-step offerings have been generally unfavorable. Table 28 presents a summary of thrifts that have completed second-stage stock offerings since January 1, 2007.
There were a total of 18 stock offerings during 2006 and 26 in 2007. Since then, there has been only ten completed during 2008 and four through November 2009. There have been no second-step conversions completed since April 2008. The after-market performance of second-step thrift conversions has been restrained. Of the eight second-step stock offerings completed since January 1, 2007, the median first day price increase was 2.8%, with a median price increase of 2.1% and 2.5% for the one-week and one-month periods, respectively. Six of these companies are now trading at a discount to their offering price. The most recently completed second-stage offering was that of BCSB Bancorp, Inc (“BCSB”). BCSB completed its offering of $15.7 million of net proceeds on April 11, 2008. The transaction priced at a pro forma price-to-book ratio of 61.8%. BCSB is currently trading approximately 14.9% below its offering price.
Thrift conversions continue to be priced at discounts to publicly traded thrifts. This is due to the relatively high pro forma equity ratios, expected low returns on equity, and the uncertainty regarding the prospects of an institution to adeptly leverage the balance sheet in the currently low interest rate environment. Moreover, the poor after-market performance of recent thrift second-step offerings provides added reason to continue to factor in a “marketability” discount for valuation of current thrift IPOs.
82
FELDMAN FINANCIAL ADVISORS, INC.
Table 27
Summary of Recent Montana Acquisition Activity
Transactions Announced Since January 1, 2005
| Seller's Prior Financial Data | Offer Value to | |||||||||||||||||||||||||||||
Buyer | State | Seller | B/T (1) | Total Assets ($Mil.) | Equity/ Assets (%) | YTD ROA (%) | YTD ROE (%) | Date Anncd. | Status (2) | Offer Value ($Mil.) | Book Value (%) | Tang. Book (%) | LTM EPS (x) | Total Assets (%) | ||||||||||||||||
Average | 215.1 | 8.86 | 0.79 | 9.72 | NA | NA | 43.8 | 186.7 | 189.3 | 16.60 | 15.26 | |||||||||||||||||||
Median | 151.5 | 8.49 | 1.06 | 13.37 | NA | NA | 47.4 | 184.2 | 184.2 | 16.41 | 15.97 | |||||||||||||||||||
Hulett Bancorp | WY | First National Bank of Ekalaka | B | 30.2 | 7.18 | 0.57 | 7.45 | 05/27/09 | C | 3.4 | 155.6 | 155.6 | 20.20 | 11.18 | ||||||||||||||||
CBT Corporation Inc. | MT | Continental NB of Harlowton | B | 45.8 | 11.99 | (0.06 | ) | (0.51 | ) | 05/13/08 | C | NA | NA | NA | NA | NA | ||||||||||||||
U.S. Bancorp | MN | United Financial Corp. | B | 418.1 | 7.94 | 1.06 | 13.37 | 11/06/06 | C | 72.7 | 222.7 | 233.1 | 16.72 | 17.44 | ||||||||||||||||
Glacier Bancorp Inc. | MT | Citizens Development Co. | B | 430.0 | 8.72 | 1.15 | 13.84 | 04/20/06 | C | 77.0 | 205.4 | 205.4 | 16.09 | 17.91 | ||||||||||||||||
Glacier Bancorp Inc. | MT | Thompson Falls Holding Company | B | 151.5 | 8.49 | 1.21 | 14.46 | 07/14/05 | C | 22.0 | 163.0 | 163.0 | 13.38 | 14.50 | ||||||||||||||||
| (1) | B=bank; T=thrift. |
| (2) | P=pending; C=completed. |
Source: SNL Financial.
83
FELDMAN FINANCIAL ADVISORS, INC.
Table 28
Second-Step Stock Offering
Since January 2007
| Price/Pro Forma | After-Market Price Change | Change Through 12/3/09 (%) | ||||||||||||||||||||||||||
Company | St | Exchange | IPO Date | Net Proceeds ($Mil.) | Book Tang. Value (%) | Book Value (%) | IPO Price ($) | 12/3/09 Price ($) | One Day (%) | One Week (%) | One Month (%) | |||||||||||||||||
Medians | 84.0 | 95.4 | 95.4 | 2.8 | 2.1 | 1.5 | (16.6 | ) | ||||||||||||||||||||
BCSB Bancorp, Inc. | MD | NASDAQ | 4/11/08 | 15.7 | 61.8 | 65.0 | 10.00 | 8.51 | 10.4 | 14.9 | 13.5 | (14.9 | ) | |||||||||||||||
Home Federal Bancorp | ID | NASDAQ | 12/20/07 | 85.8 | 88.3 | 88.3 | 10.00 | 12.37 | (1.2 | ) | 0.2 | 3.0 | 23.7 | |||||||||||||||
United Financial Banco | MA | NASDAQ | 12/4/07 | 82.1 | 80.4 | 80.5 | 10.00 | 12.72 | 3.0 | 4.5 | 7.7 | 27.2 | ||||||||||||||||
North Penn Bancorp, Inc. | PA | OTCBB | 10/2/07 | 6.7 | 79.0 | 79.0 | 10.00 | 9.10 | 2.6 | 0.5 | (0.5 | ) | (9.0 | ) | ||||||||||||||
Abington Bancorp, Inc. | PA | NASDAQ | 6/28/07 | 121.4 | 102.5 | 102.5 | 10.00 | 6.75 | (4.0 | ) | (3.1 | ) | (4.8 | ) | (32.5 | ) | ||||||||||||
People’s United Financial | CT | NASDAQ | 4/16/07 | 2915.9 | 143.3 | 147.0 | 20.00 | 16.00 | 3.8 | 3.7 | (0.1 | ) | (20.0 | ) | ||||||||||||||
Osage Bancshares, Inc. | OK | NASDAQ | 1/18/07 | 21.7 | 103.3 | 103.3 | 10.00 | 7.79 | (0.5 | ) | 0.0 | (6.8 | ) | (22.1 | ) | |||||||||||||
Westfield Financial, Inc | MA | NASDAQ | 1/4/07 | 170.1 | 111.7 | 111.7 | 10.00 | 8.18 | 7.0 | 7.2 | 9.0 | (18.2 | ) | |||||||||||||||
Source: SNL Securities LLC
Effect of Government Regulations and Regulatory Reform
As a fully converted stock thrift regulated by the OTS and FDIC, the Bank will continue to operate in the same regulatory environment that is substantially similar to that faced by the Comparative Group companies. As of September 30, 2009, the Bank was considered a well-capitalized institution, as were all the members of the Comparative Group. Therefore, given these factors, we believe that no adjustment is necessary for the effect of government regulations and regulatory reform.
Adjustments Conclusion
Based upon our analysis, we believe that an upward adjustment is appropriate for earnings and downward adjustments are appropriate for subscription interest, acquisition activity and marketability discount, but do not believe that any of the other previously described areas specifically analyzed result in an upward or downward adjustment relative to the Comparative Group.
84
FELDMAN FINANCIAL ADVISORS, INC.
Valuation Approach
In determining the estimated pro forma market value of the Company, we have employed the comparative company approach and considered the following pricing ratios: price-to-earnings per share (“P/E”), price-to-book value per share (“P/B”), price-to-tangible book value per share (“P/TB”), and price-to-assets (“P/A”). Due to the problems in the banking industry, investors have placed a greater emphasis on the P/B and P/TB multiples for many institutions. Accordingly, we have placed greater emphasis on the P/B and P/TB ratios as a pricing guideline. However, due to the strong earnings of the Company, we also gave strong consideration to the resultant P/E ratios.
Table 29 displays the market price valuation ratios of the Comparative Group as of December 3, 2009. Averages for the All Public Thrift aggregate are also shown in Table 29. Table 29 also includes the pro forma valuation ratios attributable to the Bank as compared to the Comparative Group. Exhibit IV displays the pro forma assumptions and calculations utilized in analyzing the Bank’s valuation ratios. In reaching our conclusions of the Valuation Range, we evaluated the relationship of the Bank’s pro forma valuation ratios relative to the Comparative Group valuation data and recent thrift IPO valuations.
Investors continue to make decisions to purchase thrift conversion stocks and more seasoned thrift issues based upon consideration of core earnings profitability and P/B and P/TB comparisons. The P/B and P/TB ratios are an important valuation ratio in the current thrift stock environment and were a key focus in developing our estimate of the Bank’s pro forma market value.
85
FELDMAN FINANCIAL ADVISORS, INC.
Based on the Company’s operating performance, market movements of the Company’s currently traded MHC securities, the Comparative Group and the current market conditions for thrift stocks; we have determined the midpoint of the valuation range, on a fully converted basis, to be $39.8 million as of December 3, 2009. This midpoint valuation produces a minimum valuation of $33.8 million, a maximum of $45.7 million and an adjusted maximum of $52.6 million.
The median P/B ratio for the Comparative Group was 88.7% and the median P/TB ratio was 94.0%. At the midpoint value of $39.8 million based on the assumptions summarized in Exhibit IV, we have determined a pro forma P/B and P/TB ratio of 79.9% for the Company. Employing a range of 15% above and below the midpoint, the resulting minimum value of $33.8 million reflects a 72.3% P/B and P/TB ratio and the resulting maximum value of approximately $45.7 million reflects a 86.7% P/B and P/TB ratio. The adjusted maximum, an additional 15.0% above the maximum, is positioned at approximately $52.6 million and a P/B and P/TB ratio of 93.5%.
The Company’s pro forma midpoint P/B and P/TB ratio of 79.9% reflects a 9.9% discount to the Comparative Group median P/B ratio of 88.7% and a 15.0% discount to the Comparative group median P/TB ratio of 94.0%. Compared to the All Public Thrift P/B median of 70.0% and median P/TB ratio of 74.0%, the Company’s ratio at the midpoint reflect premiums of 14.3% and 8.1%, respectively. The relatively low discounts for P/B and P/TB ratios are a result of the Company’s strong earnings and the resulting P/E ratios discussed later. At the minimum, the Company’s pro forma P/B and P/TB ratio of 72.4% reflects an 18.5% discount to the Comparative Group median P/B ratio and a 23.1% discount to the Comparative Group median P/TB ratio.
86
FELDMAN FINANCIAL ADVISORS, INC.
The Company’s pro forma midpoint P/E ratio of 11.9x reflects a 15.1% discount to the Comparative Group median P/E ratio of 14.0x and an 8.1% discount to the All Public Thrift median of 13.0x. At the minimum, the Company’s pro forma P/E ratio of 10.1x reflects a 28.0% discount to the Comparative Group median and a 22.0% discount to the All Public Thrift median.
Based on the P/A measure, the Company’s pro forma midpoint of $39.8 million reflects a corresponding valuation ratio of 12.4%, ranging from 10.7% at the minimum to 14.2% and 16.1% at the maximum and adjusted maximum, respectively. Pricing at the midpoint, the P/A ratio is at a 46.4% premium to the Comparative Group median of 8.5%, and a 107.5% premium to the All Public Thrift median of 6.0%.
Eagle Bancorp Montana, in its current mutual holding company ownership structure, has public shares outstanding and is currently traded on the NASDAQ. As such, it may be an indicator of investor interest in the Company’s conversion stock and therefore received some consideration in our valuation. Based on Eagle Bancorp Montana’s current trading level of $30.75 as of December 3, 2009, its market capitalization approximates $33.0 million or $6.7 million less than the midpoint of the valuation range and was considered in the valuation process. Eagle Bancorp Montana’s market price has ranged from $28.50 to $31.50 per share since September 30, 2009. However, since the conversion stock will have different characteristics than the minority shares, and since pro forma information has not been publicly disseminated to date, the current market value of Eagle Bancorp Montana’s stock was somewhat discounted herein. However, Eagle Bancorp Montana’s trading market value may become more important towards the closing of the offering.
87
FELDMAN FINANCIAL ADVISORS, INC.
Valuation Conclusion
It is our opinion that, as of December 3, 2009, the aggregate estimated pro forma market value of the Company on a fully converted basis was within the Valuation Range of $33,801,360 to $45,731,250 with a midpoint of $39,766,300. The Valuation Range was based upon a 15% decrease from the midpoint to determine the minimum and a 15% increase to establish the maximum. An additional 15% increase above the maximum results in an adjusted maximum of $52,590,930. Exhibit IV displays the assumptions and calculations utilized in determining the Company’s estimated pro forma market value on a fully converted basis.
88
FELDMAN FINANCIAL ADVISORS, INC.
Table 29
Pro Forma Comparative Valuation Analysis
Eagle Bancorp Montana and the Comparative Group
Computed from Market Price Data as of December 3, 2009
Company | Closing Stock Price ($) | Total Market Value ($Mil.) | Price/ LTM EPS (x) | Price/ Core EPS (x) | Price/ Book Value (%) | Price/ Tang. Book (%) | Price/ Total Assets (%) | Total Equity/ Assets (%) | Current Dividend Yield (%) | ||||||||||
Eagle Bancorp Montana | |||||||||||||||||||
Pro Forma Minimum | $ | 10.00 | 33.8 | 10.1 | 9.8 | 72.3 | 72.3 | 10.66 | 14.75 | 3.26 | |||||||||
Pro Forma Midpoint | $ | 10.00 | 39.8 | 11.9 | 11.6 | 79.9 | 79.9 | 12.43 | 15.55 | 2.77 | |||||||||
Pro Forma Maximum | $ | 10.00 | 45.7 | 13.9 | 13.5 | 86.7 | 86.7 | 14.16 | 16.34 | 2.41 | |||||||||
Pro Forma Adjusted Maximum | $ | 10.00 | 52.6 | 16.1 | 15.6 | 93.5 | 93.5 | 16.11 | 17.22 | 2.09 | |||||||||
Comparative Group Average | NA | 69.9 | 16.3 | 14.4 | 85.5 | 91.4 | 12.79 | 15.10 | 2.74 | ||||||||||
Comparative Group Median | NA | 54.1 | 14.0 | 13.3 | 88.7 | 94.0 | 8.49 | 11.00 | 2.97 | ||||||||||
All Public Thrift Average | NA | 310.4 | 14.8 | 12.9 | 69.8 | 75.0 | 7.42 | 10.90 | 2.41 | ||||||||||
All Public Thrift Median | NA | 48.9 | 13.0 | 10.4 | 70.0 | 74.0 | 5.99 | 10.00 | 2.39 | ||||||||||
Comparative Group | |||||||||||||||||||
Elmira Savings Bank, FSB | $ | 15.06 | 28.9 | 9.2 | 13.3 | 80.4 | 126.7 | 5.92 | 10.73 | 5.31 | |||||||||
Home Bancorp, Inc. | $ | 12.27 | 108.0 | 26.7 | 17.4 | 82.6 | 82.6 | 20.53 | 24.86 | 0.00 | |||||||||
Home Federal Bancorp, Inc. | $ | 12.37 | 206.6 | 23.8 | NA | 98.5 | 98.5 | 24.94 | 25.32 | 1.78 | |||||||||
Liberty Bancorp, Inc. | $ | 7.75 | 28.0 | 14.6 | 14.1 | 64.9 | 68.2 | 7.31 | 11.26 | 1.29 | |||||||||
Louisiana Bancorp, Inc. | $ | 14.35 | 72.6 | 27.1 | 26.8 | 94.3 | 94.3 | 22.46 | 23.82 | 0.00 | |||||||||
LSB Corporation | $ | 11.50 | 51.8 | 7.7 | 7.7 | 83.7 | 83.7 | 6.53 | 9.46 | 1.74 | |||||||||
Rome Bancorp, Inc. | $ | 8.20 | 56.4 | 18.6 | 17.2 | 93.7 | 93.7 | 16.69 | 17.81 | 4.15 | |||||||||
Teche Holding Company | $ | 32.38 | 67.9 | 9.7 | 8.6 | 95.0 | 100.1 | 8.87 | 9.34 | 4.39 | |||||||||
TF Financial Corporation | $ | 18.36 | 48.9 | 12.0 | 12.0 | 64.8 | 69.0 | 6.51 | 10.05 | 4.36 | |||||||||
WVS Financial Corp. | $ | 14.50 | 30.0 | 13.4 | 12.9 | 96.9 | 96.9 | 8.11 | 8.37 | 4.41 | |||||||||
Source: Eagle Bancorp Montana; SNL Financial; Feldman Financial.
89
FELDMAN FINANCIAL ADVISORS, INC.
Exhibit I
Background of Feldman Financial Advisors, Inc.
Overview of Firm
Feldman Financial Advisors provides consulting and advisory services to financial institutions and mortgage companies in the areas of corporate valuations, mergers and acquisitions, strategic planning, branch sales and purchases, developing and implementing regulatory business and capital plans, and expert witness testimony and analysis. Our senior staff members have been involved in the stock conversion process since 1982 and have valued more than 350 converting institutions.
Feldman Financial Advisors was incorporated in February 1996 by a group of consultants who were previously associated with CS First Boston and Kaplan Associates. Each of the principals at Feldman Financial Advisors has more than 10 years experience in consulting and all were officers of their prior firm. Our senior staff collectively has worked with more than 1,000 banks, thrifts and mortgage companies nationwide. The firm’s office is located in Washington, D.C.
Background of Senior Professional Staff
Trent Feldman - President. Trent is a nationally recognized expert in providing strategic advice to and valuing service companies, and advising on mergers and acquisitions. Trent was with Kaplan Associates for 14 years and was one of three founding principals at that firm. Trent also has worked at the Federal Home Loan Bank Board and with the California legislature. Trent holds Bachelors and Masters Degrees from the University of California at Los Angeles.
Peter Williams - Principal. Peter specializes in merger and acquisition analysis, stock and other corporate valuations, strategic business plans and retail delivery analysis. Peter was with Kaplan Associates for 13 years. Peter also served as a Corporate Planning and Development Analyst with the Wilmington Trust Company in Delaware. Peter holds a BA in Economics from Yale University and an MBA in Finance and Investments from George Washington University.
Michael Green - Principal. Mike is an expert in mergers and acquisition analysis, financial institution and corporate valuations, and strategic and business plans. During Mike’s 10 years at Kaplan Associates, his experience also included business restructurings, litigation support, mark-to-market analysis, and goodwill valuations. Mike holds a BA in Finance and Economics from Rutgers College.
Greg Izydorczyk - Senior Vice President. Greg specializes in merger and acquisition analysis and corporate valuations and also has experience in mark-to-market analysis and business plans. Greg was with Kaplan Associates for three years. Previous, Greg worked as a Senior Auditor for First Virginia Bank and Integra Financial and as a Financial Analyst with Airbus Industrie of N.A. Greg holds a BS in Finance from Pennsylvania State University and an MBA in Finance from the Katz Graduate School, University of Pittsburgh.
I-1
FELDMAN FINANCIAL ADVISORS, INC.
Exhibit II-1
Statement of Financial Condition
As of September 30, 2009 and June 30, 2009
(Dollars in Thousands)
| September 30, | At June 30, | |||||||||||
| 2009 | 2009 | 2008 | ||||||||||
| (Unaudited) | (Audited) | (Audited) | ||||||||||
Cash and due from banks | $ | 3,687 | $ | 2,487 | $ | 3,541 | ||||||
Interest-bearing deposits with banks | 944 | 224 | 549 | |||||||||
Federal Funds sold | 3,211 | 3,617 | — | |||||||||
Cash and cash equivalents | 7,842 | 6,328 | 4,090 | |||||||||
Securities, available-for-sale | 92,100 | 82,263 | 78,417 | |||||||||
Securities, held-to-maturity | 265 | 375 | 697 | |||||||||
Preferred stock - SFAS 159, at market value | 108 | 25 | 1,321 | |||||||||
FHLB stock | 2,000 | 2,000 | 1,715 | |||||||||
Investment in Eagle Bancorp Statutory Trust I | 155 | 155 | 155 | |||||||||
Mortgage loans held-for-sale | 3,494 | 5,349 | 7,370 | |||||||||
Loans receivable | 168,810 | 167,722 | 168,449 | |||||||||
Less: Allowance for loan losses | (625 | ) | (525 | ) | (300 | ) | ||||||
Loans, net | 168,185 | 167,197 | 168,149 | |||||||||
Accrued interest and dividends receivable | 1,540 | 1,399 | 1,426 | |||||||||
Mortgage servicing rights, net | 2,315 | 2,208 | 1,652 | |||||||||
Premises and equipment, net | 15,371 | 13,761 | 8,080 | |||||||||
Cash surrender value of life insurance | 6,544 | 6,496 | 6,285 | |||||||||
Real estate acquired in settlement of loans, net of allowances | 158 | — | — | |||||||||
Other assets | 603 | 2,153 | 550 | |||||||||
TOTAL ASSETS | $ | 300,680 | $ | 289,709 | $ | 279,907 | ||||||
LIABILITIES: | ||||||||||||
Deposit accounts | ||||||||||||
Noninterest bearing | $ | 18,902 | $ | 15,002 | $ | 14,617 | ||||||
Interest bearing | 176,178 | 172,197 | 164,234 | |||||||||
Total deposits | 195,080 | 187,199 | 178,851 | |||||||||
Accrued expenses and other liabilities | $ | 3,379 | $ | 2,507 | $ | 2,045 | ||||||
Federal funds purchased | — | — | 3,000 | |||||||||
FHLB advances and other borrowings | 66,639 | 67,056 | 65,222 | |||||||||
Subordinated debentures | 5,155 | 5,155 | 5,155 | |||||||||
Total liabilities | 270,253 | 261,917 | 254,273 | |||||||||
EQUITY: | ||||||||||||
Preferred stock | — | — | — | |||||||||
Common stock | 12 | 12 | 12 | |||||||||
Additional paid-in-capital | 4,589 | 4,564 | 4,487 | |||||||||
Unallocated stock held by ESOP | (9 | ) | (18 | ) | (55 | ) | ||||||
Treasury stock | (5,056 | ) | (5,034 | ) | (5,013 | ) | ||||||
Retained earnings | 29,583 | 28,850 | 27,025 | |||||||||
Accumulated other comprehensive gain (loss) | 1,308 | (582 | ) | (822 | ) | |||||||
Total equity | $ | 30,427 | $ | 27,792 | $ | 25,634 | ||||||
TOTAL LIABILITIES AND RETAINED EARNINGS | $ | 300,680 | $ | 289,709 | $ | 279,907 | ||||||
Source: Eagle Bancorp Montana, audited financial statements.
II-1
FELDMAN FINANCIAL ADVISORS, INC.
Exhibit II-2
Statement of Operations
For the Three Months Ended September 30, 2009 and 2008
and the Years Ended June 30, 2008 and 2009
(Dollars in Thousands)
| Three Months Ended September 30, | Year Ended June 30, | ||||||||||||||
| 2009 | 2008 | 2009 | 2008 | ||||||||||||
Interest and Dividend Income: | |||||||||||||||
Interest and fees on loans | $ | 2,708 | $ | 2,837 | $ | 11,411 | $ | 10,905 | |||||||
Securities available-for-sale | 1,004 | 963 | 3,893 | 3,071 | |||||||||||
Securities held-to-maturity | 4 | 5 | 20 | 34 | |||||||||||
Trust preferred securities | 0 | 0 | 9 | 9 | |||||||||||
Interest on deposits with banks | 8 | 4 | 15 | 63 | |||||||||||
FHLB dividends | 0 | 7 | 0 | 16 | |||||||||||
Total interest income | 3,724 | 3,816 | 15,348 | 14,098 | |||||||||||
Interest Expense: | |||||||||||||||
Deposits | 611 | 862 | 3,161 | 4,387 | |||||||||||
FHLB advances and other borrowings | 655 | 643 | 2,645 | 1,966 | |||||||||||
Subordinated debentures | 75 | 75 | 309 | 309 | |||||||||||
Total interest expense | 1,341 | 1,580 | 6,115 | 6,662 | |||||||||||
Net Interest Income | 2,383 | 2,236 | 9,233 | 7,436 | |||||||||||
Loan Loss Provision | 135 | 0 | 257 | (175 | ) | ||||||||||
Net Interest Income After Loan Loss Provision | 2,248 | 2,236 | 8,976 | 7,611 | |||||||||||
Noninterest Income: | |||||||||||||||
Service charges on deposit accounts | 195 | 190 | 745 | 711 | |||||||||||
Net gain on sale of loans | 440 | 183 | 2,216 | 801 | |||||||||||
Mortgage loan servicing fees | 185 | 140 | 628 | 542 | |||||||||||
Net gain (loss) on sale of available-for-sale securities | 0 | 57 | 54 | 72 | |||||||||||
Net gain (loss) on preferred stock | 84 | (1,239 | ) | (1,296 | ) | (511 | ) | ||||||||
Other | 157 | 165 | 652 | 609 | |||||||||||
Total noninterest income | 1,061 | (504 | ) | 2,999 | 2,224 | ||||||||||
Noninterest Expense: | |||||||||||||||
Salaries and employee benefits | 1,099 | 1,046 | 4,411 | 3,965 | |||||||||||
Occupancy and equipment expense | 219 | 216 | 900 | 818 | |||||||||||
Data processing | 88 | 73 | 370 | 297 | |||||||||||
Advertising | 106 | 91 | 394 | 293 | |||||||||||
Amortization of mortgage servicing rights | 126 | 71 | 598 | 313 | |||||||||||
Federal insurance premiums | 65 | 7 | 307 | 20 | |||||||||||
Legal, accounting and examination fees | 75 | 48 | 231 | 220 | |||||||||||
Consulting fees | 57 | 43 | 114 | 116 | |||||||||||
Other | 268 | 254 | 1,238 | 1,021 | |||||||||||
Total noninterest expense | 2,103 | 1,849 | 8,563 | 7,063 | |||||||||||
Income before provision for taxes | 1,206 | (117 | ) | 3,412 | 2,772 | ||||||||||
Provision for income taxes | 362 | (17 | ) | 1,024 | 662 | ||||||||||
Net Income | $ | 844 | ($ | 100 | ) | $ | 2,388 | $ | 2,110 | ||||||
Source: Eagle Bancorp Montana, financial statements.
II-2
FELDMAN FINANCIAL ADVISORS, INC.
Exhibit II-3
Loan Portfolio Composition
As of September 30, 2009 and June 30, 2005 to 2009
(Dollars in Thousands)
| At September 30, 2010 | At June 30, | |||||||||||||||||||||||||||||||||||||||||
| 2009 | 2008 | 2007 | 2006 | 2005 | ||||||||||||||||||||||||||||||||||||||
| Amount | Percent of Total | Amount | Percent of Total | Amount | Percent of Total | Amount | Percent of Total | Amount | Percent of Total | Amount | Percent of Total | |||||||||||||||||||||||||||||||
Real estate loans: | ||||||||||||||||||||||||||||||||||||||||||
Residential mortgage | $ | 76,711 | 45.46 | % | $ | 79,216 | 47.26 | % | $ | 86,751 | 51.53 | % | $ | 81,958 | 51.68 | % | $ | 75,913 | 53.71 | % | $ | 56,533 | 52.68 | % | ||||||||||||||||||
Real estate construction | 6,119 | 3.63 | % | 4,642 | 2.77 | % | 7,317 | 4.35 | % | 8,253 | 5.20 | % | 6,901 | 4.88 | % | 2,723 | 2.54 | % | ||||||||||||||||||||||||
Commercial real estate and land | 38,761 | 22.97 | % | 36,713 | 21.90 | % | 28,197 | 16.75 | % | 25,621 | 16.16 | % | 18,648 | 13.20 | % | 14,779 | 13.77 | % | ||||||||||||||||||||||||
Total real estate loans | 121,591 | 72.06 | % | 120,571 | 71.93 | % | 122,265 | 72.62 | % | 115,832 | 73.04 | % | 101,462 | 71.79 | % | 74,035 | 68.99 | % | ||||||||||||||||||||||||
Other loans: | ||||||||||||||||||||||||||||||||||||||||||
Home equity | 28,836 | 17.09 | % | 28,676 | 17.11 | % | 28,034 | 16.65 | % | 24,956 | 15.74 | % | 20,191 | 14.29 | % | 16,801 | 15.66 | % | ||||||||||||||||||||||||
Consumer | 11,074 | 6.56 | % | 10,835 | 6.46 | % | 11,558 | 6.87 | % | 11,438 | 7.21 | % | 11,820 | 8.36 | % | 10,909 | 10.16 | % | ||||||||||||||||||||||||
Commercial business loans | 7,244 | 4.29 | % | 7,541 | 4.50 | % | 6,502 | 3.86 | % | 6,366 | 4.01 | % | 7,861 | 5.56 | % | 5,568 | 5.19 | % | ||||||||||||||||||||||||
Total other loans | 47,154 | 27.94 | % | 47,052 | 28.07 | % | 46,094 | 27.38 | % | 42,760 | 26.96 | % | 39,872 | 28.21 | % | 33,278 | 31.01 | % | ||||||||||||||||||||||||
Total gross loans | $ | 168,745 | 100.00 | % | $ | 167,623 | 100.00 | % | $ | 168,359 | 100.00 | % | $ | 158,592 | 100.00 | % | $ | 141,334 | 100.00 | % | $ | 107,313 | 100.00 | % | ||||||||||||||||||
Less: | ||||||||||||||||||||||||||||||||||||||||||
Deferred loan fees | (65 | ) | (99 | ) | (90 | ) | (66 | ) | (59 | ) | (99 | ) | ||||||||||||||||||||||||||||||
Allowance for loan losses | 625 | 525 | 300 | 518 | 535 | 573 | ||||||||||||||||||||||||||||||||||||
Total loans, net | $ | 168,185 | $ | 167,197 | $ | 168,149 | $ | 158,140 | $ | 140,858 | $ | 106,839 | ||||||||||||||||||||||||||||||
Source: Eagle Bancorp Montana, preliminary prospectus.
II-3
FELDMAN FINANCIAL ADVISORS, INC.
Exhibit II-4
Investment Portfolio Composition
As of September 30, 2009 and June 30, 2007 to 2009
(Dollars in Thousands)
| At September 30, | At June 30, | |||||||||||||||||||||||
| 2009 | 2009 | 2008 | 2007 | |||||||||||||||||||||
| Carrying Value | of Total | Carrying Value | of Total | Carrying Value | of Total | Carrying Value | of Total | |||||||||||||||||
Securities available-for-sale, at fair value: | ||||||||||||||||||||||||
U.S. Government and agency obligations | $ | 4,930 | 5.17 | % | $ | 3,882 | 4.57 | % | $ | 2,232 | 2.70 | % | $ | 3,643 | 5.41 | % | ||||||||
Corporate obligations | 10,037 | 10.52 | % | 9,493 | 11.18 | % | 12,722 | 15.38 | % | 13,623 | 20.22 | % | ||||||||||||
Municipal obligations | 34,036 | 35.67 | % | 28,893 | 34.04 | % | 22,190 | 26.83 | % | 20,728 | 30.77 | % | ||||||||||||
Collateralized mortgage obligations | 35,112 | 36.80 | % | 31,551 | 37.17 | % | 28,224 | 34.17 | % | 17,075 | 25.35 | % | ||||||||||||
Mortgage-backed securities | 7,985 | 8.37 | % | 8,444 | 9.95 | % | 13,016 | 15.74 | % | 7,872 | 11.68 | % | ||||||||||||
Common Stock | — | — | — | — | 33 | — | — | — | ||||||||||||||||
Corporate preferred stock | — | — | — | — | — | — | 1,833 | 2.72 | % | |||||||||||||||
Total securities available for sale | 92,100 | 96.52 | % | 82,263 | 96.91 | % | 78,417 | 94.82 | % | 64,774 | 96.15 | % | ||||||||||||
Securities held-to-maturity, at book value: | ||||||||||||||||||||||||
Mortgage-backed securities | — | — | — | — | 22 | 0 | 95 | 0.14 | % | |||||||||||||||
Municipal obligations | 265 | 0.28 | % | 375 | 0.44 | % | 675 | 0.82 | % | 826 | 1.23 | % | ||||||||||||
Total securities held to maturity | 265 | 0.28 | % | 375 | 0.44 | % | 697 | 0.85 | % | 921 | 1.37 | % | ||||||||||||
Preferred stock | 108 | 0.11 | % | 25 | 0.03 | % | 1,321 | 1.60 | % | N/A | N/A | |||||||||||||
Total securities | 92,473 | 96.91 | % | 82,663 | 97.38 | % | 80,435 | 97.27 | % | 65,695 | 98.00 | % | ||||||||||||
FHLB stock, at cost | 2,000 | 2.10 | % | 2,000 | 2.36 | % | 1,715 | 2.07 | % | 1,315 | 1.95 | % | ||||||||||||
Interest-bearing deposits | 944 | 0.99 | % | 224 | 0.26 | % | 549 | 0.66 | % | 360 | 0.53 | % | ||||||||||||
Total | $ | 95,417 | 100.00 | % | $ | 84,887 | 100.00 | % | $ | 82,699 | 100.00 | % | $ | 67,370 | 100.00 | % | ||||||||
Source: Eagle Bancorp Montana, preliminary prospectus.
II-4
FELDMAN FINANCIAL ADVISORS, INC.
Exhibit II-5
Deposit Account Distribution
As of September 30, 2009 and June 30, 2007 to 2009
(Dollars in Thousands)
| At June 30, | ||||||||||||||||||||||||||||||||||||
| At September 30, 2009 | 2009 | 2008 | 2007 | |||||||||||||||||||||||||||||||||
| Amount | Percent of Total | Weighted Average Rate | Amount | Percent of Total | Weighted Average Rate | Amount | Percent of Total | Weighted Average Amount | Amount | Percent of Total | Weighted Average Amount | |||||||||||||||||||||||||
Noninterest checking | $ | 18,902 | 9.69 | % | — | $ | 15,002 | 8.01 | % | — | $ | 14,617 | 8.17 | % | — | $ | 13,694 | 7.62 | % | — | ||||||||||||||||
Passbook savings | 26,979 | 13.83 | % | 0.41 | % | 26,445 | 14.13 | % | 0.41 | % | 23,906 | 13.37 | % | 0.65 | % | 22,521 | 12.54 | % | 0.65 | % | ||||||||||||||||
NOW account/Interest bearing checking | 34,785 | 17.83 | % | 0.25 | % | 32,665 | 17.45 | % | 0.33 | % | 30,721 | 17.18 | % | 0.38 | % | 30,954 | 17.23 | % | 0.21 | % | ||||||||||||||||
Money market accounts | 26,730 | 13.70 | % | 0.30 | % | 26,886 | 14.36 | % | 0.64 | % | 25,275 | 14.12 | % | 1.75 | % | 23,292 | 12.96 | % | 2.12 | % | ||||||||||||||||
Total | 107,395 | 55.05 | % | 0.26 | % | 100,997 | 53.95 | % | 0.38 | % | 94,518 | 52.85 | % | 0.76 | % | 60,460 | 50.35 | % | 0.78 | % | ||||||||||||||||
Certificates of deposit accounts: | ||||||||||||||||||||||||||||||||||||
IRA certificates | 23,447 | 12.02 | % | 2.85 | % | 23,121 | 12.35 | % | 2.96 | % | 22,108 | 12.36 | % | 3.15 | % | 21,534 | 11.99 | % | 3.97 | % | ||||||||||||||||
Brokered certificates | — | — | — | — | — | — | — | — | — | 4,411 | 2.46 | % | 5.30 | % | ||||||||||||||||||||||
Other certificates | 64,238 | 32.93 | % | 2.16 | % | 63,081 | 33.70 | % | 2.41 | % | 62,225 | 34.79 | % | 3.31 | % | 63,242 | 35.20 | % | 4.66 | % | ||||||||||||||||
Total certificates of deposit | 87,685 | 44.95 | % | 2.34 | % | 86,202 | 46.05 | % | 2.56 | % | 84,333 | 47.15 | % | 3.27 | % | 49.65 | % | 4.53 | % | |||||||||||||||||
Total deposits | $ | 195,080 | 100.00 | % | 1.19 | % | $ | 187,199 | 100.00 | % | 1.38 | % | $ | 178,851 | 100.00 | % | 1.94 | % | $ | 179,647 | 100.00 | % | 100.00 | % | ||||||||||||
Source: Eagle Bancorp Montana, preliminary prospectus.
II-5
FELDMAN FINANCIAL ADVISORS, INC.
Exhibit III
II-6
FELDMAN FINANCIAL ADVISORS, INC.
Exhibit III
Financial Performance and Market Valuation Data for All Public Thrifts
Based on Closing Market Prices as of December 3, 2009
Company | Ticker | State | Total Assets ($Mil.) | LTM ROA (%) | LTM ROE (%) | Total Equity/ Assets (%) | Tang. Equity/ Assets (%) | Closing Price 12/3/09 ($) | Total Market Value ($Mil.) | Price/ LTM EPS (x) | Price/ Core EPS (x) | Price/ Book Value (%) | Price/ Tang. Book (%) | Price/ Total Assets (%) | Div. Yield (%) | |||||||||||||||||
All Public Thrifts (non-MHCs) | ||||||||||||||||||||||||||||||||
Abington Bancorp, Inc. | ABBC | PA | 1,227 | (0.76 | ) | (3.91 | ) | 18.05 | 18.05 | 6.75 | 145.0 | NM | NM | 66.0 | 66.0 | 11.92 | 2.96 | |||||||||||||||
Anchor BanCorp Wisconsin Inc. | ABCW | WI | 4,638 | (6.82 | ) | (175.97 | ) | 1.75 | 1.65 | 0.65 | 14.1 | NM | NM | 442.0 | NM | 0.31 | — | |||||||||||||||
Astoria Financial Corporation | AF | NY | 20,673 | 0.23 | 4.10 | 5.83 | 4.98 | 10.81 | 1,049.1 | 19.7 | 44.0 | 82.9 | 97.9 | 4.84 | 4.81 | |||||||||||||||||
Bank Mutual Corporation | BKMU | WI | 3,561 | 0.53 | 4.57 | 11.46 | 10.09 | 6.99 | 324.5 | 17.9 | NM | 80.3 | 92.7 | 9.15 | 4.01 | |||||||||||||||||
BankAtlantic Bancorp, Inc. | BBX | FL | 4,941 | (5.16 | ) | (111.50 | ) | 3.83 | 3.52 | 1.30 | 64.0 | NM | NM | 33.8 | 35.7 | 1.29 | — | |||||||||||||||
BankFinancial Corporation | BFIN | IL | 1,574 | 0.57 | 3.28 | 16.91 | 15.45 | 9.67 | 207.1 | 21.5 | 28.9 | 77.8 | 86.7 | 13.16 | 2.90 | |||||||||||||||||
BCSB Bancorp, Inc. | BCSB | MD | 569 | (0.34 | ) | (3.37 | ) | 10.38 | 10.37 | 8.51 | 26.6 | NM | NM | NA | NA | NA | — | |||||||||||||||
Beacon Federal Bancorp, Inc. | BFED | NY | 1,070 | 0.60 | 6.26 | 9.42 | 9.42 | 9.17 | 61.3 | 10.0 | 9.2 | 60.8 | 60.8 | 5.73 | 2.18 | |||||||||||||||||
Berkshire Hills Bancorp, Inc. | BHLB | MA | 2,681 | 0.50 | 3.31 | 15.31 | 9.32 | 19.19 | 267.4 | 24.9 | 34.2 | 65.1 | 114.5 | 9.97 | 3.34 | |||||||||||||||||
BofI Holding, Inc. | BOFI | CA | 1,324 | 1.01 | 14.73 | 7.03 | 7.03 | 8.58 | 70.1 | 6.0 | 4.2 | 84.2 | 84.2 | 5.33 | — | |||||||||||||||||
Broadway Financial Corporation | BYFC | CA | 520 | 0.31 | 4.38 | 6.40 | 6.40 | 4.34 | 7.6 | 9.9 | 10.8 | 33.8 | 33.8 | 1.48 | 4.61 | |||||||||||||||||
Brookline Bancorp, Inc. | BRKL | MA | 2,639 | 0.70 | 3.77 | 18.55 | 17.08 | 9.50 | 560.8 | 30.7 | 29.6 | 115.0 | 127.2 | 21.26 | 3.58 | |||||||||||||||||
Cape Bancorp, Inc. | CBNJ | NJ | 1,067 | (5.56 | ) | (41.69 | ) | 11.68 | 9.72 | 6.69 | 89.1 | NM | NM | 71.4 | 87.8 | 8.34 | — | |||||||||||||||
Carver Bancorp, Inc. | CARV | NY | 809 | (0.85 | ) | (11.31 | ) | 8.08 | 8.05 | 7.56 | 18.7 | NM | 8.2 | 40.4 | 40.6 | 2.37 | 5.29 | |||||||||||||||
Central Bancorp, Inc. | CEBK | MA | 541 | 0.68 | 9.52 | 7.98 | 7.60 | 8.34 | 13.7 | 3.6 | 7.0 | 40.7 | 43.6 | 2.57 | 2.40 | |||||||||||||||||
Central Federal Corporation | CFBK | OH | 280 | (2.66 | ) | (24.61 | ) | 9.06 | 9.06 | 1.38 | 5.7 | NM | NM | 30.7 | 30.7 | 2.07 | — | |||||||||||||||
CFS Bancorp, Inc. | CITZ | IN | 1,078 | (1.11 | ) | (10.68 | ) | 10.15 | 10.15 | 4.07 | 43.8 | NM | NM | 40.1 | 40.1 | 4.07 | 0.98 | |||||||||||||||
Chicopee Bancorp, Inc. | CBNK | MA | 548 | (0.30 | ) | (1.69 | ) | 17.14 | 17.14 | 12.74 | 81.3 | NM | NM | 86.7 | 86.7 | 14.85 | — | |||||||||||||||
Citizens Community Bancorp, Inc. | CZWI | WI | 575 | (0.58 | ) | NA | NA | NA | 3.35 | 18.4 | NA | NA | NA | NA | NA | 5.97 | ||||||||||||||||
Citizens First Bancorp, Inc. | CTZN | MI | 1,933 | (4.30 | ) | (71.65 | ) | 3.08 | 2.99 | 0.57 | 4.7 | NM | NM | 7.4 | 7.6 | 0.23 | — | |||||||||||||||
Citizens South Banking Corporation | CSBC | NC | 821 | 0.09 | 0.75 | 12.67 | 9.33 | 5.20 | 39.1 | NM | NM | 46.9 | 73.7 | 4.90 | 3.08 | |||||||||||||||||
CMS Bancorp, Inc. | CMSB | NY | 243 | (0.20 | ) | (2.06 | ) | 8.60 | 8.60 | 7.50 | 14.0 | NM | NM | NA | NA | NA | — | |||||||||||||||
Community Financial Corporation | CFFC | VA | 541 | 1.07 | 12.37 | 8.84 | 8.84 | 4.75 | 20.7 | 4.2 | 5.7 | 58.0 | 58.0 | 3.92 | — | |||||||||||||||||
Danvers Bancorp, Inc. | DNBK | MA | 1,893 | 0.15 | 1.17 | 11.95 | 11.93 | 13.49 | 295.4 | NM | 48.3 | 104.3 | 104.6 | 12.46 | 0.59 | |||||||||||||||||
Dime Community Bancshares, Inc. | DCOM | NY | 3,908 | 0.59 | 8.34 | 7.41 | 6.07 | 11.16 | 383.9 | 15.7 | 10.7 | 132.5 | 160.1 | 9.82 | 5.02 | |||||||||||||||||
Elmira Savings Bank, FSB | ESBK | NY | 506 | 0.91 | 8.84 | 10.73 | 8.35 | 15.06 | 28.9 | 9.2 | 9.4 | 80.4 | 126.7 | 5.92 | 5.31 | |||||||||||||||||
ESB Financial Corporation | ESBF | PA | 1,979 | 0.60 | 8.04 | 8.48 | 6.45 | 12.25 | 147.7 | 12.8 | 10.4 | 88.3 | 118.9 | 7.46 | 3.27 | |||||||||||||||||
ESSA Bancorp, Inc. | ESSA | PA | 1,042 | 0.64 | 3.42 | 17.80 | 17.80 | 12.41 | 178.8 | 26.4 | 28.1 | 99.5 | 99.5 | 17.72 | 1.61 | |||||||||||||||||
FFD Financial Corporation | FFDF | OH | 192 | 0.48 | 5.01 | 9.34 | 9.34 | 13.00 | 13.2 | 14.8 | 19.1 | 73.1 | 73.1 | 6.82 | 5.23 | |||||||||||||||||
Fidelity Bancorp, Inc. | FSBI | PA | 730 | (0.24 | ) | (3.62 | ) | 6.45 | 6.11 | 5.10 | 15.5 | NM | NM | 38.4 | 41.2 | 2.15 | 1.57 | |||||||||||||||
First Advantage Bancorp | FABK | TN | 353 | 0.30 | 1.44 | 20.06 | 20.06 | 10.50 | 46.1 | 47.7 | NA | 65.2 | 65.2 | 13.08 | 1.90 | |||||||||||||||||
First Bancshares, Inc. | FBSI | MO | 220 | (1.73 | ) | (16.42 | ) | 10.97 | 10.90 | 8.70 | 13.5 | NM | NA | 55.8 | 56.2 | 6.12 | — | |||||||||||||||
First Capital, Inc. | FCAP | IN | 457 | 0.31 | 2.96 | 10.23 | 9.12 | 14.00 | 38.6 | 28.6 | NM | 82.8 | 94.1 | 8.46 | 5.14 | |||||||||||||||||
First Clover Leaf Financial Corp. | FCLF | IL | 603 | (1.07 | ) | (7.50 | ) | 13.20 | 11.29 | 7.45 | 59.7 | NM | 29.6 | 75.6 | 90.3 | 9.98 | 3.22 | |||||||||||||||
First Community Bank Corporation of America | FCFL | FL | 561 | (1.33 | ) | (16.29 | ) | 7.46 | 7.46 | 2.55 | 10.6 | NM | NM | 34.0 | 34.0 | 1.92 | — | |||||||||||||||
First Defiance Financial Corp. | FDEF | OH | 2,019 | 0.38 | 3.35 | 11.62 | 8.73 | 10.80 | 87.7 | 15.0 | 68.6 | 44.2 | 65.2 | 4.42 | 1.48 | |||||||||||||||||
First Federal Bancshares of Arkansas, Inc. | FFBH | AR | 739 | (3.23 | ) | (31.18 | ) | 8.58 | 8.58 | 2.80 | 13.6 | NM | NM | 28.8 | 28.8 | 1.88 | 1.43 | |||||||||||||||
First Federal of Northern Michigan Bancorp, Inc. | FFNM | MI | 239 | (2.44 | ) | (20.48 | ) | 10.84 | 10.47 | 1.35 | 3.9 | NM | NM | 15.0 | 15.6 | 1.63 | — | |||||||||||||||
First Financial Holdings, Inc. | FFCH | SC | 3,510 | 0.88 | 11.18 | 10.02 | 9.03 | 12.82 | 211.8 | 5.7 | NM | 71.1 | 82.0 | 5.92 | 1.56 |
III-1
FELDMAN FINANCIAL ADVISORS, INC.
Exhibit III
Financial Performance and Market Valuation Data for All Public Thrifts
Based on Closing Market Prices as of December 3, 2009
Company | Ticker | State | Total Assets ($Mil.) | LTM ROA (%) | LTM ROE (%) | Total Equity/ Assets (%) | Tang. Equity/ Assets (%) | Closing Price 12/3/09 ($) | Total Market Value ($Mil.) | Price/ LTM EPS (x) | Price/ Core EPS (x) | Price/ Book Value (%) | Price/ Tang. Book (%) | Price/ Total Assets (%) | Div. Yield (%) | |||||||||||||||||
First Financial Northwest, Inc. | FFNW | WA | 1,319 | (2.48 | ) | (11.38 | ) | 19.01 | 19.01 | 6.89 | 134.0 | NM | NM | 55.0 | 55.0 | 10.46 | 4.93 | |||||||||||||||
First Franklin Corporation | FFHS | OH | 304 | (0.39 | ) | (5.18 | ) | 7.65 | 7.65 | 7.00 | 11.8 | NM | NM | 50.5 | 50.5 | 3.87 | — | |||||||||||||||
First Niagara Financial Group, Inc. | FNFG | NY | 14,138 | 0.71 | 4.03 | 16.86 | 10.95 | 13.08 | 2,461.7 | 27.3 | NA | 101.4 | 167.3 | NA | 4.28 | |||||||||||||||||
First PacTrust Bancorp, Inc. | FPTB | CA | 894 | (0.20 | ) | (1.84 | ) | 10.85 | 10.85 | 5.80 | 24.6 | NM | 4.6 | 31.6 | 31.6 | 2.81 | 3.45 | |||||||||||||||
First Place Financial Corp. | FPFC | OH | 3,245 | (3.32 | ) | (39.81 | ) | 8.57 | 8.27 | 2.90 | 49.2 | NM | NM | 23.6 | 24.8 | 1.55 | — | |||||||||||||||
First Savings Financial Group, Inc. | FSFG | IN | 481 | 0.01 | 0.07 | 11.00 | 9.37 | 10.40 | 26.4 | NM | 35.4 | NA | NA | NA | — | |||||||||||||||||
Flagstar Bancorp, Inc. | FBC | MI | 14,821 | (4.14 | ) | (77.51 | ) | 4.50 | 4.50 | 0.67 | 313.9 | NM | NM | 77.9 | 77.9 | 2.15 | — | |||||||||||||||
Flushing Financial Corporation | FFIC | NY | 4,177 | 0.66 | 8.93 | 9.98 | 9.58 | 10.33 | 321.5 | 9.4 | 8.7 | 89.4 | 94.3 | 7.57 | 5.03 | |||||||||||||||||
GS Financial Corp. | GSLA | LA | 271 | 0.33 | 2.91 | 10.45 | 10.45 | 15.80 | 19.8 | 24.3 | 51.9 | 70.1 | 70.1 | 7.33 | 2.53 | |||||||||||||||||
Hampden Bancorp, Inc. | HBNK | MA | 566 | 0.01 | 0.08 | 17.00 | 17.00 | 10.93 | 80.0 | NM | NM | 83.3 | 83.3 | 14.15 | 1.10 | |||||||||||||||||
Harleysville Savings Financial Corporation | HARL | PA | 830 | 0.57 | 9.67 | 6.04 | 6.04 | 13.71 | 49.7 | 10.5 | 9.7 | 99.2 | 99.2 | 5.99 | 5.54 | |||||||||||||||||
Harrington West Financial Group, Inc. | HWFG | CA | 1,058 | (2.25 | ) | (60.84 | ) | 2.49 | 1.94 | 0.35 | 2.6 | NM | NM | 10.3 | 13.5 | 0.24 | — | |||||||||||||||
HF Financial Corp. | HFFC | SD | 1,168 | 0.58 | 8.31 | 6.03 | 5.63 | 8.90 | 61.6 | 6.7 | 5.3 | 51.1 | 54.9 | 3.08 | 5.06 | |||||||||||||||||
Hingham Institution for Savings | HIFS | MA | 914 | 0.90 | 12.33 | 7.03 | 7.03 | 29.51 | 62.7 | 8.3 | 7.2 | 97.6 | 97.6 | 6.86 | 2.98 | |||||||||||||||||
HMN Financial, Inc. | HMNF | MN | 1,033 | (1.22 | ) | (13.24 | ) | 9.73 | 9.73 | 4.00 | 17.0 | NM | 8.3 | 22.1 | 22.1 | 1.68 | — | |||||||||||||||
Home Bancorp, Inc. | HBCP | LA | 533 | 0.74 | 3.11 | 24.86 | 24.86 | 12.27 | 108.0 | 26.7 | 18.0 | 82.6 | 82.6 | 20.53 | — | |||||||||||||||||
Home Federal Bancorp, Inc. | HOME | ID | 828 | 1.14 | 3.99 | 25.32 | 25.32 | 12.37 | 206.6 | 23.8 | NA | 98.5 | 98.5 | 24.94 | 1.78 | |||||||||||||||||
HopFed Bancorp, Inc. | HFBC | KY | 1,022 | 0.05 | 0.61 | 7.89 | 7.78 | 9.61 | 34.5 | NM | NM | 55.0 | 56.2 | 3.44 | 4.99 | |||||||||||||||||
Hudson City Bancorp, Inc. | HCBK | NJ | 58,885 | 0.93 | 10.19 | 8.95 | 8.70 | 13.03 | 6,844.8 | 12.5 | 12.1 | 121.2 | 124.9 | 10.85 | 4.60 | |||||||||||||||||
Independence Federal Savings Bank | IFSB | DC | 167 | (0.06 | ) | (1.17 | ) | 5.96 | 5.96 | 1.44 | 2.2 | NM | 1.4 | 22.4 | 22.4 | 1.33 | — | |||||||||||||||
Jefferson Bancshares, Inc. | JFBI | TN | 654 | 0.42 | 3.29 | 12.33 | 8.89 | 5.00 | 33.5 | 11.9 | 15.8 | 41.5 | 59.7 | 5.11 | 2.40 | |||||||||||||||||
Legacy Bancorp, Inc. | LEGC | MA | 954 | (0.47 | ) | (3.53 | ) | 13.04 | 11.92 | 9.54 | 83.3 | NM | 35.3 | 67.1 | 74.7 | 8.75 | 2.10 | |||||||||||||||
Liberty Bancorp, Inc. | LBCP | MO | 384 | 0.57 | 4.73 | 11.26 | 10.77 | 7.75 | 28.0 | 14.6 | 10.7 | 64.9 | 68.2 | 7.31 | 1.29 | |||||||||||||||||
Louisiana Bancorp, Inc. | LABC | LA | 332 | 0.82 | 3.16 | 23.82 | 23.82 | 14.35 | 72.6 | 27.1 | 29.9 | 94.3 | 94.3 | 22.46 | — | |||||||||||||||||
LSB Corporation | LSBX | MA | 807 | 0.94 | 10.54 | 9.46 | 9.46 | 11.50 | 51.8 | 7.7 | 13.2 | 83.7 | 83.7 | 6.53 | 1.74 | |||||||||||||||||
LSB Financial Corp. | LSBI | IN | 364 | 0.25 | 2.78 | 9.43 | 9.43 | 10.26 | 15.9 | 16.6 | 128.3 | 46.5 | 46.5 | 4.38 | 4.87 | |||||||||||||||||
Mayflower Bancorp, Inc. | MFLR | MA | 249 | 0.50 | 6.34 | 8.09 | 8.08 | 7.18 | 15.0 | 12.0 | NA | 74.3 | 74.3 | 6.01 | 3.34 | |||||||||||||||||
Meta Financial Group, Inc. | CASH | IA | 820 | (0.31 | ) | (5.45 | ) | 5.38 | 5.09 | 22.00 | 57.4 | NM | NM | 130.1 | 137.9 | 7.00 | 2.36 | |||||||||||||||
MutualFirst Financial, Inc. | MFSF | IN | 1,397 | (1.46 | ) | (15.81 | ) | 9.37 | 8.97 | 6.05 | 42.3 | NM | 12.4 | 42.5 | 45.4 | 3.09 | 3.97 | |||||||||||||||
NASB Financial, Inc. | NASB | MO | 1,615 | 0.88 | 8.78 | 10.03 | 9.88 | 22.75 | 179.0 | 13.2 | 10.1 | 110.5 | 112.4 | 11.08 | 3.96 | |||||||||||||||||
New Hampshire Thrift Bancshares, Inc. | NHTB | NH | 903 | 0.76 | 8.15 | 9.81 | 6.77 | 9.49 | 54.8 | 8.7 | 9.8 | 69.8 | 111.6 | 6.14 | 5.48 | |||||||||||||||||
New York Community Bancorp, Inc. | NYB | NY | 32,884 | 1.07 | 8.26 | 13.20 | 6.03 | 11.71 | 4,195.2 | 11.7 | 9.6 | 95.9 | 226.9 | 12.66 | 8.54 | |||||||||||||||||
NewAlliance Bancshares, Inc. | NAL | CT | 8,541 | 0.52 | 3.14 | 16.71 | 10.82 | 11.70 | 1,240.9 | 26.0 | 25.1 | 87.4 | 144.6 | 14.60 | 2.39 | |||||||||||||||||
Newport Bancorp, Inc. | NFSB | RI | 452 | (0.07 | ) | (0.56 | ) | 11.63 | 11.63 | 12.10 | 48.1 | NM | 51.8 | 90.7 | 90.7 | 10.55 | — | |||||||||||||||
North Central Bancshares, Inc. | FFFD | IA | 453 | (0.15 | ) | (1.58 | ) | 10.61 | 10.61 | 15.30 | 20.6 | NM | 5.9 | 54.2 | 54.2 | 4.65 | 0.26 | |||||||||||||||
OceanFirst Financial Corp. | OCFC | NJ | 1,873 | 0.83 | 10.52 | 8.87 | 8.87 | 10.22 | 192.4 | 8.5 | 7.0 | 98.7 | 98.7 | 6.92 | 7.83 | |||||||||||||||||
Osage Bancshares, Inc. | OSBK | OK | 160 | (0.32 | ) | (1.90 | ) | 15.72 | 15.11 | 7.79 | 21.5 | NM | 17.7 | 86.1 | 90.2 | 13.53 | 4.36 | |||||||||||||||
Park Bancorp, Inc. | PFED | IL | 222 | (1.26 | ) | (10.68 | ) | 11.55 | 11.55 | 3.21 | 3.8 | NM | NM | 15.0 | 15.0 | 1.73 | — | |||||||||||||||
Parkvale Financial Corporation | PVSA | PA | 1,903 | (0.52 | ) | (6.47 | ) | 7.94 | 6.51 | 7.36 | 40.0 | NM | 6.6 | 33.5 | 44.3 | 2.13 | 2.72 | |||||||||||||||
People's United Financial, Inc. | PBCT | CT | 20,810 | 0.54 | 2.13 | 24.58 | 18.64 | 16.00 | 5,573.0 | 48.5 | 56.4 | 105.0 | 149.4 | 25.81 | 3.81 |
III-2
FELDMAN FINANCIAL ADVISORS, INC.
Exhibit III
Financial Performance and Market Valuation Data for All Public Thrifts
Based on Closing Market Prices as of December 3, 2009
Company | Ticker | State | Total Assets ($Mil.) | LTM ROA (%) | LTM ROE (%) | Total Equity/ Assets (%) | Tang. Equity/ Assets (%) | Closing Price 12/3/09 ($) | Total Market Value ($Mil.) | Price/ LTM EPS (x) | Price/ Core EPS (x) | Price/ Book Value (%) | Price/ Tang. Book (%) | Price/ Total Assets (%) | Div. Yield (%) | |||||||||||||||||
Provident Financial Holdings, Inc. | PROV | CA | 1,480 | (0.82 | ) | (10.89 | ) | 7.36 | 7.36 | 3.37 | 21.0 | NM | NM | 19.3 | 19.3 | 1.42 | 1.19 | |||||||||||||||
Provident Financial Services, Inc. | PFS | NJ | 6,816 | (1.84 | ) | (12.80 | ) | 12.95 | NA | 10.65 | 637.2 | NM | 17.1 | 72.2 | 121.7 | 9.35 | 4.13 | |||||||||||||||
Provident New York Bancorp | PBNY | NY | 3,022 | 0.89 | 6.22 | 14.15 | 9.14 | 8.26 | 326.7 | 12.3 | 22.8 | 76.4 | 125.2 | 10.81 | 2.91 | |||||||||||||||||
Pulaski Financial Corp. | PULB | MO | 1,406 | 0.36 | 4.64 | 8.32 | 8.04 | 6.99 | 72.5 | 18.9 | 106.8 | NA | NA | NA | 5.44 | |||||||||||||||||
PVF Capital Corp. | PVFC | OH | 887 | (1.67 | ) | (25.75 | ) | 6.19 | 6.19 | 1.87 | 14.9 | NM | 0.9 | 27.2 | 27.2 | 1.68 | — | |||||||||||||||
Rainier Pacific Financial Group, Inc. | RPFG | WA | 764 | (6.86 | ) | (142.64 | ) | 1.68 | 1.31 | 0.23 | 1.5 | NM | NM | 10.8 | 13.9 | 0.18 | — | |||||||||||||||
River Valley Bancorp | RIVR | IN | 385 | 0.41 | 6.36 | 6.62 | 6.61 | 13.99 | 21.1 | 13.6 | 7.0 | 82.6 | 82.7 | 5.46 | 6.00 | |||||||||||||||||
Riverview Bancorp, Inc. | RVSB | WA | 864 | 0.14 | 1.43 | 10.42 | 7.64 | 2.87 | 31.4 | 23.9 | 21.8 | 35.0 | 49.7 | 3.63 | — | |||||||||||||||||
Rome Bancorp, Inc. | ROME | NY | 338 | 0.86 | 4.82 | 17.81 | 17.81 | 8.20 | 56.4 | 18.6 | 14.9 | 93.7 | 93.7 | 16.69 | 4.15 | |||||||||||||||||
Severn Bancorp, Inc. | SVBI | MD | 996 | (1.30 | ) | (11.05 | ) | 10.97 | 10.94 | 2.75 | 27.7 | NM | NM | 33.5 | 33.7 | 2.86 | 4.36 | |||||||||||||||
Superior Bancorp | SUPR | AL | 3,227 | (5.32 | ) | (61.08 | ) | 7.58 | 7.07 | 1.94 | 22.6 | NM | NM | 12.5 | 13.8 | 0.71 | — | |||||||||||||||
Teche Holding Company | TSH | LA | 765 | 0.91 | 9.98 | 9.34 | 8.90 | 32.38 | 67.9 | 9.7 | 8.1 | 95.0 | 100.1 | 8.87 | 4.39 | |||||||||||||||||
Territorial Bancorp Inc. | TBNK | HI | 1,357 | 0.49 | 4.97 | 15.91 | 15.91 | 16.97 | 207.6 | NA | NA | 96.2 | 96.2 | 15.30 | — | |||||||||||||||||
TF Financial Corporation | THRD | PA | 712 | 0.53 | 5.60 | 10.05 | 9.47 | 18.36 | 48.9 | 12.0 | 10.4 | 64.8 | 69.0 | 6.51 | 4.36 | |||||||||||||||||
TierOne Corporation | TONE | NE | 3,161 | (0.84 | ) | (10.18 | ) | 7.73 | 7.61 | 0.80 | 14.4 | NM | NM | 5.9 | 6.0 | 0.46 | — | |||||||||||||||
Timberland Bancorp, Inc. | TSBK | WA | 703 | 0.01 | 0.08 | 12.54 | 11.73 | 4.54 | 32.0 | NM | 61.3 | 44.1 | 48.4 | 4.66 | 2.64 | |||||||||||||||||
TrustCo Bank Corp NY | TRST | NY | 3,650 | 0.76 | 11.25 | 6.70 | 6.69 | 6.11 | 468.3 | 18.0 | 16.5 | 191.1 | 191.5 | 12.81 | 4.09 | |||||||||||||||||
United Community Financial Corp. | UCFC | OH | 2,462 | (0.16 | ) | (1.64 | ) | 9.58 | 9.56 | 1.46 | 45.1 | NM | NM | 19.1 | 19.2 | 1.83 | — | |||||||||||||||
United Financial Bancorp, Inc. | UBNK | MA | 1,247 | 0.45 | 2.53 | 17.35 | 17.34 | 12.72 | 214.9 | 34.4 | 22.4 | 95.0 | 95.1 | 16.48 | 2.20 | |||||||||||||||||
United Western Bancorp, Inc. | UWBK | CO | 2,628 | 0.03 | 0.53 | 7.43 | 7.43 | 2.91 | 85.3 | 8.8 | NM | 40.8 | 40.8 | 3.03 | — | |||||||||||||||||
Washington Federal, Inc. | WFSL | WA | 12,582 | 0.39 | 3.40 | 13.87 | 12.10 | 19.36 | 2,173.6 | 42.1 | 44.3 | 124.5 | 146.0 | 17.27 | 1.03 | |||||||||||||||||
Wayne Savings Bancshares, Inc. | WAYN | OH | 400 | 0.47 | 5.52 | 9.12 | 8.64 | 5.76 | 17.3 | 8.7 | 6.2 | 47.3 | 50.3 | 4.32 | 3.48 | |||||||||||||||||
Westfield Financial, Inc. | WFD | MA | 1,262 | 0.37 | 1.60 | 20.38 | 20.38 | 8.18 | 249.5 | 54.5 | 34.0 | 97.4 | 97.4 | 19.85 | 2.44 | |||||||||||||||||
WSB Holdings, Inc. | WSB | MD | 447 | (1.23 | ) | (10.33 | ) | 11.90 | 11.90 | 2.51 | 19.7 | NM | NM | 37.0 | 37.0 | 4.41 | 3.18 | |||||||||||||||
WSFS Financial Corporation | WSFS | DE | 3,574 | (0.08 | ) | (1.03 | ) | 8.48 | NA | 26.10 | 184.7 | NM | NM | 73.6 | NA | 5.24 | 1.84 | |||||||||||||||
WVS Financial Corp. | WVFC | PA | 370 | 0.54 | 7.33 | 8.37 | 8.37 | 14.50 | 30.0 | 13.4 | 45.3 | 96.9 | 96.9 | 8.11 | 4.41 | |||||||||||||||||
Average | 2,959 | (0.41 | ) | (7.36 | ) | 10.90 | 10.08 | 310.4 | 14.8 | 12.9 | 69.8 | 75.0 | 7.42 | 2.41 | ||||||||||||||||||
Median | 914 | 0.23 | 1.52 | 10.00 | 9.13 | 48.9 | 13.0 | 10.4 | 70.0 | 74.0 | 5.99 | 2.39 | ||||||||||||||||||||
Note: Includes all public thrifts listed on NYSE, AMEX, and NASDAQ National Market.
Source: SNL Financial.
III-3
FELDMAN FINANCIAL ADVISORS, INC.
Exhibit IV-1
Pro Forma Assumptions for Full Conversion Valuation
| 1. | The total amount of the net offering proceeds from the sale of the 60.4% MHC owned interest to the public was fully invested at the beginning of the applicable period. |
| 2. | The net offering proceeds are invested to yield a return of 1.34%, which assumed that 25% of the net proceeds are placed into residential mortgage loans (half in 30-year fixed rate loans and half in 15-year fixed rate loans) with the remaining 75% of the net proceeds invested in one-year U.S. Treasury securities, all based on market interest rates prevailing as of September 30, 2009. The effective income tax rate was assumed to be 39.0%, resulting in a net after-tax yield of 0.82%. |
| 3. | It is assumed that 8.0% of the of the shares of common stock sold in the offering will be acquired by the Company’s employee stock ownership plan (“ESOP”). Pro forma adjustments have been made to earnings and equity to reflect the impact of the ESOP purchase. The annual expense is estimated based on a twelve-year period. No reinvestment is assumed on proceeds used to fund the ESOP. |
| 4. | Assumed that the stock-based incentive plans will acquire for restricted stock awards a number of shares of common stock equal to 4% of the shares of common stock sold in the stock offering at the same price for which they were sold in the stock offering. The annual expense is estimated based on a five-year vesting period. No reinvestment is assumed on proceeds used to fund the RSP. |
| 5. | The adjustment to pro forma net income for stock options reflects the compensation expense associated with the stock options that may be granted, if the plan is approved by stockholders. A number of shares equal to 10% of the shares sold in the offering. We assumed that the options would vest at a rate of 20% per year and that compensation expense would be recognized on a straight-line basis over the 5-year vesting period. |
| 6. | Fixed offering expenses are estimated at $775,000. |
| 7. | Marketing fees for the stock offering are estimated at 1.25% of the amount of stock sold in the subscription offering, excluding sales to directors, officers, employees, and stock-benefit plans. One-third of the stock was assumed to be sold in subscription, with the remaining two-thirds sold in a syndicated offering, whereby fees are equal to 6.0% of the stock sold. |
| 8. | No effect has been given to withdrawals from deposit accounts for the purpose of purchasing common stock in the offering. |
| 9. | No effect has been given in the pro forma equity calculation for the assumed earnings on the net proceeds. |
IV-1
FELDMAN FINANCIAL ADVISORS, INC.
Exhibit IV-2
Pro Forma Second-Stage Stock Offering Range
Eagle Bancorp Montana
Historical Financial Data as of September 30, 2009
(Dollars in Thousands, Except Per Share Data)
| Minimum | Midpoint | Maximum | Adj. Max. | ||||||||||||||||
Shares issued | 100.0 | % | 3,380,136 | 3,976,630 | 4,573,125 | 5,259,093 | |||||||||||||
Exchange ratio | 3.1458 | 3.7009 | 4.2560 | 4.8944 | |||||||||||||||
Shares exchanged | 39.6 | % | 1,340,136 | 1,576,630 | 1,813,125 | 2,085,093 | |||||||||||||
Shares sold | 60.4 | % | 2,040,000 | 2,400,000 | 2,760,000 | 3,174,000 | |||||||||||||
Offering price | $ | 10.00 | $ | 10.00 | $ | 10.00 | $ | 10.00 | |||||||||||
Pro forma market value | $ | 33,801 | $ | 39,766 | $ | 45,731 | $ | 52,591 | |||||||||||
Gross proceeds | $ | 20,400 | $ | 24,000 | $ | 27,600 | $ | 31,740 | |||||||||||
Less: estimated expenses | (1,646 | ) | (1,802 | ) | (1,957 | ) | (2,136 | ) | |||||||||||
Net offering proceeds | 18,754 | 22,198 | 25,643 | 29,604 | |||||||||||||||
Plus: MHC capital addition | 10 | 10 | 10 | 10 | |||||||||||||||
Less: ESOP purchase | (1,632 | ) | (1,920 | ) | (2,208 | ) | (2,539 | ) | |||||||||||
Less: RSP purchase | (816 | ) | (960 | ) | (1,104 | ) | (1,270 | ) | |||||||||||
Net investable proceeds | $ | 16,316 | $ | 19,328 | $ | 22,341 | $ | 25,805 | |||||||||||
Net Income: (LTM period) | |||||||||||||||||||
LTM ended 09/30/09 | $ | 3,332 | $ | 3,332 | $ | 3,332 | $ | 3,332 | |||||||||||
Pro forma income on net proceeds | 134 | 158 | 183 | 212 | |||||||||||||||
Pro forma ESOP adjustment | (83 | ) | (98 | ) | (112 | ) | (129 | ) | |||||||||||
Pro forma RSP adjustment | (100 | ) | (117 | ) | (135 | ) | (155 | ) | |||||||||||
Pro forma option adjustment | (81 | ) | (96 | ) | (110 | ) | (126 | ) | |||||||||||
Pro forma net income | $ | 3,202 | $ | 3,179 | $ | 3,158 | $ | 3,134 | |||||||||||
Pro forma earnings per share | $ | 0.99 | $ | 0.84 | $ | 0.72 | $ | 0.62 | |||||||||||
Core Earnings: (LTM period) | |||||||||||||||||||
LTM ended 09/30/09 | $ | 3,420 | $ | 3,420 | $ | 3,420 | $ | 3,420 | |||||||||||
Pro forma income on net proceeds | 134 | 158 | 183 | 212 | |||||||||||||||
Pro forma ESOP adjustment | (83 | ) | (98 | ) | (112 | ) | (129 | ) | |||||||||||
Pro forma RSP adjustment | (100 | ) | (117 | ) | (135 | ) | (155 | ) | |||||||||||
Pro forma option adjustment | (81 | ) | (96 | ) | (110 | ) | (126 | ) | |||||||||||
Pro forma core earnings | $ | 3,290 | $ | 3,267 | $ | 3,246 | $ | 3,222 | |||||||||||
Pro forma core earnings per share | $ | 1.02 | $ | 0.86 | $ | 0.74 | $ | 0.64 | |||||||||||
Total Equity | $ | 30,427 | $ | 30,427 | $ | 30,427 | $ | 30,427 | |||||||||||
Net offering proceeds | 18,754 | 22,198 | 25,643 | 29,604 | |||||||||||||||
Plus: MHC capital addition | 10 | 10 | 10 | 10 | |||||||||||||||
Less: ESOP purchase | (1,632 | ) | (1,920 | ) | (2,208 | ) | (2,539 | ) | |||||||||||
Less: RSP purchase | (816 | ) | (960 | ) | (1,104 | ) | (1,270 | ) | |||||||||||
Pro forma total equity | $ | 46,743 | $ | 49,755 | $ | 52,768 | $ | 56,232 | |||||||||||
Pro forma book value | $ | 13.83 | $ | 12.51 | $ | 11.54 | $ | 10.69 | |||||||||||
Tangible Equity | $ | 30,427 | $ | 30,427 | $ | 30,427 | $ | 30,427 | |||||||||||
Net offering proceeds | 18,754 | 22,198 | 25,643 | 29,604 | |||||||||||||||
Plus: MHC capital addition | 10 | 10 | 10 | 10 | |||||||||||||||
Less: ESOP purchase | (1,632 | ) | (1,920 | ) | (2,208 | ) | (2,539 | ) | |||||||||||
Less: RSP purchase | (816 | ) | (960 | ) | (1,104 | ) | (1,270 | ) | |||||||||||
Pro forma tangible equity | $ | 46,743 | $ | 49,755 | $ | 52,768 | $ | 56,232 | |||||||||||
Pro forma tangible book value | $ | 13.83 | $ | 12.51 | $ | 11.54 | $ | 10.69 | |||||||||||
Total Assets | $ | 300,680 | $ | 300,680 | $ | 300,680 | $ | 300,680 | |||||||||||
Net offering proceeds | 18,754 | 22,198 | 25,643 | 29,604 | |||||||||||||||
Plus: MHC capital addition | 10 | 10 | 10 | 10 | |||||||||||||||
Less: ESOP purchase | (1,632 | ) | (1,920 | ) | (2,208 | ) | (2,539 | ) | |||||||||||
Less: RSP purchase | (816 | ) | (960 | ) | (1,104 | ) | (1,270 | ) | |||||||||||
Pro forma total assets | $ | 316,996 | $ | 320,008 | $ | 323,021 | $ | 326,485 | |||||||||||
Pro Forma Ratios: | |||||||||||||||||||
Price / EPS - 09/30/09 LTM | 10.1 | 11.9 | 13.9 | 16.1 | |||||||||||||||
Price / EPS - 09/30/09 Core | 9.8 | 11.6 | 13.5 | 15.6 | |||||||||||||||
Price / Book Value | 72.3 | % | 79.9 | % | 86.7 | % | 93.5 | % | |||||||||||
Price / Tangible Book Value | 72.3 | % | 79.9 | % | 86.7 | % | 93.5 | % | |||||||||||
Price / Total Assets | 10.66 | % | 12.43 | % | 14.16 | % | 16.11 | % | |||||||||||
Equity / Assets | 14.75 | % | 15.55 | % | 16.34 | % | 17.22 | % | |||||||||||
Tangible Equity / Assets | 14.75 | % | 15.55 | % | 16.34 | % | 17.22 | % | |||||||||||
IV-2
FELDMAN FINANCIAL ADVISORS, INC.
Exhibit IV-3
Pro Forma Fully Converted Analysis at Midpoint
Eagle Bancorp Montana
Historical Financial Data as of September 30, 2009
Valuation Parameters | Symbol | Data | |||||||
Net income — LTM as tax-effected | Y | $ 3,332,000 | |||||||
Core earnings — LTM as tax-effected | Y | 3,420,000 | |||||||
Net worth | B | 30,427,000 | |||||||
Tangible net worth | B | 30,427,000 | |||||||
Total assets | A | 300,680,000 | |||||||
Expenses in conversion | X | 1,802,000 | |||||||
Other proceeds not reinvested | O | 2,880,000 | |||||||
ESOP purchase | E | 1,920,000 | |||||||
ESOP expense (pre-tax) | F | 39,344 | |||||||
RSP purchase | M | 960,000 | |||||||
RSP expense (pre-tax) | N | 47,541 | |||||||
Stock option expense (pre-tax) | Q | 24,000 | |||||||
Option expense tax-deductible | D | 0.00 | % | ||||||
Re-investment rate (after-tax) | R | 0.82 | % | ||||||
Tax rate | T | 39.00 | % | ||||||
Shares for EPS | S | 95.57 | % | ||||||
Pro Forma Valuation Ratios at | |||||||||
Price / EPS — LTM | P/E | 11.90 x | |||||||
Price / Core EPS — LTM | P/E | 11.90 x | |||||||
Price / Book Value | P/B | 79.94 | % | ||||||
Price / Tangible Book | P/TB | 79.94 | % | ||||||
Price / Assets | P/A | 12.43 | % | ||||||
Pro Forma Calculation at Midpoint Value | Based on | ||||||||
V = | (P/E / S)*((Y-R*(O+X)-(F+N)*(1-T)-(Q-Q*D*T))) | = | $39,766,300 | [LTM earnings] | |||||
| 1 - (P/E / S) * R | |||||||||
V = | (P/E/ S)*((Y-R*(O+X)-(F+N)*(1-T))) | = | $39,766,300 | [Core earnings] | |||||
| 1 - (P/E/ S) * R | |||||||||
V = | P/B* (B - X - E - M) | = | $39,766,300 | [Book value] | |||||
| 1 -P/B | |||||||||
V = | P/TB* (B - X - E - M) | = | $39,766,300 | [Tangible book] | |||||
| 1 -P/TB | |||||||||
V = | P/A* (B - X - E - M) | = | $39,766,300 | [Total assets] | |||||
| 1 -P/A | |||||||||
Pro Forma Valuation Range | |||||||||||||
Minimum | = | $39,766,300 | x | 0.85 | = | $ | 33,801,355 | ||||||
Midpoint | = | $39,766,300 | x | 1.00 | = | $ | 39,766,300 | ||||||
Maximum | = | $39,766,300 | x | 1.15 | = | $ | 45,731,245 | ||||||
Adj. Max. | $45,731,245 | x | 1.15 | = | $ | 52,590,932 | |||||||
IV-3
FELDMAN FINANCIAL ADVISORS, INC.
Exhibit IV-4
Comparative Valuation Ratio Differential
Pro Forma Stock Offering Valuation
Computed from Market Price Data as of December 3, 2009
Valuation Ratio | Symbol | Eagle Bancorp Montana | Comparative Group | All Public | |||||||||||||
| Average | Median | Average | Median | ||||||||||||||
Price / LTM EPS | P/E | 16.3 | 14.0 | 14.8 | 13.0 | ||||||||||||
Minimum | (X | ) | 10.1 | -38.0 | % | -28.0 | % | -31.8 | % | -22.0 | % | ||||||
Midpoint | 11.9 | -26.9 | % | -15.1 | % | -19.6 | % | -8.1 | % | ||||||||
Maximum | 13.9 | -14.7 | % | -1.0 | % | -6.2 | % | 7.2 | % | ||||||||
Adj. Maximum | 16.1 | -1.0 | % | 15.0 | % | 8.9 | % | 24.5 | % | ||||||||
Price / Core EPS | P/E | 14.4 | 13.3 | 12.9 | 10.4 | ||||||||||||
Minimum | (X | ) | 9.8 | -32.06 | % | -26.40 | % | -24.25 | % | -5.46 | % | ||||||
Midpoint | 11.6 | -19.42 | % | -12.70 | % | -10.15 | % | 12.13 | % | ||||||||
Maximum | 13.5 | -6.36 | % | 1.45 | % | 4.41 | % | 30.31 | % | ||||||||
Adj. Maximum | 15.6 | 8.27 | % | 17.30 | % | 20.73 | % | 50.68 | % | ||||||||
Price / Book Value | P/B | 85.5 | 88.7 | 69.8 | 70.0 | ||||||||||||
Minimum | (%) | 72.3 | -15.4 | % | -18.5 | % | 3.6 | % | 3.4 | % | |||||||
Midpoint | 79.9 | -6.5 | % | -9.9 | % | 14.5 | % | 14.3 | % | ||||||||
Maximum | 86.7 | 1.4 | % | -2.3 | % | 24.2 | % | 23.9 | % | ||||||||
Adj. Maximum | 93.5 | 9.4 | % | 5.5 | % | 34.0 | % | 33.7 | % | ||||||||
Price / Tangible Book | P/TB | 91.4 | 94.0 | 75.0 | 74.0 | ||||||||||||
Minimum | (%) | 72.3 | -20.9 | % | -23.1 | % | -3.6 | % | -2.3 | % | |||||||
Midpoint | 79.9 | -12.5 | % | -15.0 | % | 6.6 | % | 8.1 | % | ||||||||
Maximum | 86.7 | -5.2 | % | -7.8 | % | 15.6 | % | 17.1 | % | ||||||||
Adj. Maximum | 93.5 | 2.4 | % | -0.5 | % | 24.8 | % | 26.4 | % | ||||||||
Price / Total Assets | P/A | 12.79 | 8.49 | 7.42 | 5.99 | ||||||||||||
Minimum | (%) | 10.66 | -16.6 | % | 25.6 | % | 43.7 | % | 78.0 | % | |||||||
Midpoint | 12.43 | -2.8 | % | 46.4 | % | 67.4 | % | 107.5 | % | ||||||||
Maximum | 14.16 | 10.7 | % | 66.8 | % | 90.8 | % | 136.3 | % | ||||||||
Adj. Maximum | 16.11 | 26.0 | % | 89.7 | % | 117.0 | % | 168.9 | % | ||||||||
IV-4