Exhibit 4.7
MANAGEMENT’S DISCUSSION AND ANALYSIS OF RESULTS OF OPERATIONS AND FINANCIAL POSITION
| TABLE OF CONTENTS |
| 1 | ||||
| 2 | ||||
| 3 | ||||
| 7 | ||||
| 8 | ||||
| 9 | ||||
| 26 | ||||
| 37 | ||||
Commitments, Contractual Obligations, Contingencies and Off-Balance Sheet Arrangements | 46 | |||
| 46 | ||||
| 49 | ||||
| 51 | ||||
| 51 | ||||
| 51 | ||||
| 52 | ||||
| 53 | ||||
| BASIS OF PRESENTATION |
Management’s Discussion and Analysis of Results of Operations and Financial Position (“MD&A”) of Granite Real Estate Investment Trust (“Granite REIT”) and Granite REIT Inc. (“Granite GP”) summarizes the significant factors affecting the combined operating results, financial condition, liquidity and cash flows of Granite REIT, Granite GP and their subsidiaries (collectively “Granite” or the “Trust”) for the three and six months ended June 30, 2021. Unless otherwise noted, all amounts are in millions of Canadian dollars. This MD&A should be read in conjunction with the accompanying unaudited condensed combined financial statements for the three and six months ended June 30, 2021 prepared in accordance with International Financial Reporting Standards (“IFRS”) as issued by the International Accounting Standards Board. The MD&A was prepared as at August 4, 2021 and its contents were approved by the Board of Trustees of Granite REIT and Board of Directors of Granite GP on this date. Additional information relating to Granite, including the Annual Report and Annual Information Form (“AIF”) for fiscal 2020 and dated March 3, 2021, can be obtained from the Trust’s website at www.granitereit.com, on SEDAR at www.sedar.com and on EDGAR at www.sec.gov.
In addition to using financial measures determined in accordance with IFRS, Granite also uses certain non-IFRS measures in managing its business to measure financial and operating performance as well as for capital allocation decisions and valuation purposes. Granite believes that providing these measures on a supplemental basis to the IFRS amounts is helpful to investors in assessing the overall performance of Granite’s business. These non-IFRS measures include net operating income before lease termination and close-out fees, straight-line rent and tenant incentive amortization (“NOI — cash basis”), same property NOI — cash basis, constant currency same property NOI, funds from operations (“FFO”), adjusted funds from operations (“AFFO”), FFO payout ratio, AFFO payout ratio, leverage ratio, interest coverage ratio, net leverage ratio,
Granite REIT 2021 Second Quarter Report 1
indebtedness ratio, adjusted earnings before interest, income taxes, depreciation and amortization (“Adjusted EBITDA”), unencumbered asset coverage ratio and any related per unit amounts. Readers are cautioned that these measures do not have standardized meanings prescribed under IFRS and, therefore, should not be construed as alternatives to net income, cash provided by operating activities or any other measure calculated in accordance with IFRS. Additionally, because these terms do not have standardized meanings prescribed by IFRS, they may not be comparable to similarly titled measures presented by other reporting issuers. Refer to “NON-IFRS PERFORMANCE MEASURES” for definitions and reconciliations of non-IFRS measures to IFRS financial measures.
| FINANCIAL AND OPERATING HIGHLIGHTS |
| Three Months Ended June 30, | Six Months Ended June 30, | |||||||||||||||
| (in millions, except as noted) | 2021 | 2020 | 2021 | 2020 | ||||||||||||
Operating highlights | ||||||||||||||||
Revenue | $ 94.0 | $81.0 | $189.9 | $159.1 | ||||||||||||
NOI | 80.3 | 71.2 | 161.9 | 139.1 | ||||||||||||
NOI — cash basis(1) | 79.9 | 71.0 | 159.7 | 138.8 | ||||||||||||
Net income attributable to stapled unitholders | 316.9 | 75.7 | 547.1 | 157.0 | ||||||||||||
FFO(1) | 62.2 | 53.5 | 119.4 | 110.3 | ||||||||||||
AFFO(1) | 60.1 | 51.3 | 114.9 | 106.9 | ||||||||||||
Cash flows provided from operating activities | 64.7 | 65.2 | 129.0 | 120.0 | ||||||||||||
Monthly distributions paid | 46.3 | 38.9 | 92.6 | 78.1 | ||||||||||||
FFO payout ratio(1)(2) | 76% | 75% | 75% | 72% | ||||||||||||
AFFO payout ratio(1)(2) | 79% | 78% | 78% | 74% | ||||||||||||
Per unit amounts | ||||||||||||||||
Diluted FFO(1) | $0.99 | $0.97 | $1.92 | $2.02 | ||||||||||||
Diluted AFFO(1) | $0.96 | $0.93 | $1.85 | �� | $1.96 | |||||||||||
Monthly distributions paid | $0.75 | $0.73 | $1.50 | $1.45 | ||||||||||||
Diluted weighted average number of units | 62.8 | 54.9 | 62.2 | 54.5 | ||||||||||||
2 Granite REIT 2021 Second Quarter Report
| As at June 30, 2021 and December 31, 2020 | 2021 | 2020 | ||||||
Financial highlights | ||||||||
Investment properties — fair value | $6,396.6 | $5,855.6 | ||||||
Cash and cash equivalents | 678.1 | 831.3 | ||||||
Total debt(3) | 1,936.0 | 2,297.5 | ||||||
Trading price per unit (TSX: GRT.UN) | $ 82.16 | $ 77.90 | ||||||
Debt metrics, ratings and outlook | ||||||||
Net leverage ratio(1) | 20% | 25% | ||||||
Interest coverage ratio(1) | 6.0x | 7.9x | ||||||
Indebtedness ratio (total debt to adjusted EBITDA)(1) | 6.7x | 8.7x | ||||||
Weighted average cost of debt(4) | 1.74% | 1.91% | ||||||
Weighted average debt term-to-maturity, in years(4) | 5.7 | 5.6 | ||||||
DBRS rating and outlook | | BBB (high) stable | | BBB stable | ||||
Moody’s rating and outlook | Baa2 stable | Baa2 stable | ||||||
Property metrics | ||||||||
Number of investment properties | 118 | 115 | ||||||
Income-producing properties | 110 | 108 | ||||||
Properties under development | 5 | 3 | ||||||
Land held for development | 3 | 4 | ||||||
Gross leasable area (“GLA”), square feet | 51.3 | 49.5 | ||||||
Occupancy, by GLA | 99.3% | 99.6% | ||||||
Magna as a percentage of annualized revenue(5)(7) | 34% | 36% | ||||||
Magna as a percentage of GLA(7) | 26% | 27% | ||||||
Weighted average lease term in years, by GLA | 6.0 | 6.3 | ||||||
Overall capitalization rate(6) | 5.1% | 5.6% | ||||||
| (1) | For definitions of Granite’s non-IFRS measures, refer to the section “NON-IFRS PERFORMANCE MEASURES”. |
| (2) | The FFO and AFFO payout ratios are calculated as monthly distributions, divided by FFO and AFFO, respectively, in a period. |
| (3) | Total debt includes lease obligations recognized under IFRS 16, Leases. |
| (4) | Excludes lease obligations recognized under IFRS 16, Leases noted above. |
| (5) | Annualized revenue for each period presented is calculated as rental revenue excluding tenant recoveries, recognized in accordance with IFRS, in the reported month multiplied by 12 months. |
| (6) | Refer to “Valuation Metrics by Investment Property Asset Category” in the “Investment Properties” section. |
| (7) | Subsequent to quarter end, the sale of Magna’s business operations in Obertshausen, Germany to Mutares SE & Co. KGaA was finalized. As a result of this change in tenant, Granite’s exposure to Magna is further reduced to 32% of Granite’s annualized revenue and 25% of Granite’s GLA. |
| SIGNIFICANT MATTERS |
COVID-19 Pandemic
Granite’s portfolio is well positioned to deliver both cash flow stability and growth as well as long-term value for unitholders. Throughout 2020 and 2021 thus far, amidst the novel coronavirus (“COVID-19”) pandemic, Granite has continued to achieve net asset value appreciation and stable net operating income growth, while executing on its strategic initiatives. Although the full impact of the COVID-19 pandemic continues to be difficult to predict, Granite believes that its portfolio and strong liquidity position will allow it to weather the on-going impact of COVID-19.
Granite REIT 2021 Second Quarter Report 3
Granite’s tenant base is comprised of generally high-quality credit companies with 57% of total annualized revenue represented by Granite’s top ten tenants (see “INVESTMENT PROPERTIES — Leasing Profile-Other Tenants” for a summary of Granite’s top ten tenants). COVID-19 has had, and will continue to have, a varied impact on Granite’s tenants depending on their specific businesses. Certain tenants have seen increased activity during this COVID-19 period while other tenants slowed down or shut down operations temporarily in the earlier months of the COVID-19 pandemic. It is difficult to predict at this time what continued impact COVID-19, including further waves of new infections, targeted public health restrictions and reinstated emergency measures in the markets where Granite operates, will have on the businesses of Granite’s tenants and the resulting direct impact on Granite’s operations.
During the three and six months ended June 30, 2021, there has not been a significant impact on Granite’s operations, assets or liabilities as a result of COVID-19. Throughout the pandemic thus far, Granite has collected 100% of rents due and therefore has not recognized any provisions for uncollected rent at this time. Granite reviewed its future cash flow projections and the valuation of its properties considering the impacts of the COVID-19 pandemic during the six months ended June 30, 2021 and Granite does not expect, at this time, that COVID-19 will have a significant negative impact to the fair value of its investment property portfolio. In addition, there have not been any significant fair value losses on investment properties recorded in the three and six months ended June 30, 2021.
From a liquidity perspective, as at the date of this MD&A, August 4, 2021, Granite has total liquidity of approximately $1.7 billion, including its fully undrawn operating facility which is sufficient to meet its current commitments, development and construction projects. During the first quarter of 2021, Granite amended its existing unsecured revolving credit facility agreement to extend the maturity date for a new five-year term to March 31, 2026 and increase the facility’s limit from $0.5 billion to $1.0 billion. Granite’s nearest debt maturity of $400.0 million does not occur until November 2023, and Granite’s investment property portfolio of approximately $6.4 billion remains fully unencumbered. Granite believes it is well-positioned to weather any short-term negative impacts on its business; however, Granite will continue to evaluate and monitor its liquidity as the situation prolongs.
From a leasing perspective, as at the date of this MD&A, August 4, 2021, Granite has renewed 95% of its 2021 lease maturities and has 0.1 million square feet outstanding representing less than 1% of its total portfolio. Granite does not believe that the impacts of COVID-19 will materially affect overall leasing activity for 2021 and beyond, including its impact on market rents, tenant demand for space, tenant allowances or incentives and lease terms.
With respect to Granite’s outstanding development projects, progress has not been materially impacted by COVID-19. For more information on Granite’s development projects, please see “SIGNIFICANT MATTERS — Construction, Development and Property Commitments” and “INVESTMENT PROPERTIES — Development and Expansion Projects”.
Consistent with its usual practice, Granite continues to review the value of its investment properties. The COVID-19 pandemic has not had a significant negative impact on the valuation of Granite’s investment properties. The duration of the COVID-19 pandemic, including further waves of new infections in the markets where Granite operates that may lead to further targeted public health restrictions and additional emergency measures, cannot be predicted. As such, the length and full scope of the economic impact of COVID-19 and other consequential changes it will have on Granite’s business and operations in the long-term cannot be forecasted with certainty at this time. Certain aspects of Granite’s business and operations that could potentially be impacted include rental income, occupancy, capital expenditures, future demand for space and market rents, all of which ultimately impact the underlying valuation of investment properties.
4 Granite REIT 2021 Second Quarter Report
Property Acquisitions
As at the date of this MD&A, August 4, 2021, during 2021, Granite has acquired four income-producing industrial properties and one property under development in the United States.
Acquisitions (in millions, except as noted)
Property Address | Location | Sq ft(1) | Weighted Average Lease Term, in years by sq ft(1) | Date Acquired | Property Purchase Price(2) | Stabilized Yield(1) | ||||||||||||||||||
Acquired during the six months ended June 30, 2021: |
| |||||||||||||||||||||||
Income-producing properties: | ||||||||||||||||||||||||
3090 Highway 42 (3) |
| Locust Grove, GA |
|
| 1.0 |
|
| 7.6 | (4) |
| March 12, 2021 |
| $ | 85.5 |
|
| 5.0 | % | ||||||
3801 Rock Creek Blvd. |
| Joliet, IL |
|
| 0.3 |
|
| 5.9 |
|
| June 25, 2021 |
|
| 30.2 |
|
| 4.6 | % | ||||||
3900 Rock Creek Blvd. |
| Joliet, IL |
|
| 0.3 |
|
| 4.1 |
|
| June 25, 2021 |
|
| 34.7 |
|
| 5.2 | % | ||||||
1695-1701 Crossroads Dr. |
| Joliet, IL |
|
| 0.5 |
|
| 2.9 |
|
| June 25, 2021 |
|
| 50.7 |
|
| 4.6 | % | ||||||
Property under development: | ||||||||||||||||||||||||
2120 Logistics Way |
| Murfreesboro, TN |
|
| N/A |
|
| N/A |
|
| June 30, 2021 |
|
| 17.3 |
|
| 5.3 | % | ||||||
| 2.1 | $ | 218.4 |
|
| 4.9 | % | |||||||||||||||||
| (1) | As at the date of acquisition except as noted in note 3 and 4 below. |
| (2) | Purchase price does not include transaction costs associated with property acquisitions. |
| (3) | To provide for a real estate tax abatement, the Trust acquired a leasehold interest in this property which resulted in the recognition of a right-of-use asset, including transaction costs of $85.9 million. The Trust will acquire freehold title to the property on December 1, 2028. |
| (4) | Weighted average lease term applicable to the occupied space. |
Second Quarter 2021 Acquisitions
On June 25, 2021, Granite acquired three distribution warehouses located in the Chicago submarket of Joliet, Illinois totaling 1.1 million square feet and were acquired at an in-going yield of 4.8% for $115.6 million (US $94.0 million). The properties are 100% leased to five tenants for a weighted average remaining lease term of 4.1 years. These highly-functional assets have 30’ clear heights, flexible design and distribution characteristics, and are strategically located adjacent to the principal intersection of the I-55 and I-80. Chicago is a critical transportation and distribution hub in the United States, being the only metropolitan area in North America where six Class I railroads converge. In addition, the assets are located less than six miles from the CenterPoint Intermodal Center and the Union Pacific IV facility.
On June 30, 2021, Granite acquired on a forward-funding basis a 0.8 million square foot modern distribution facility to be constructed on 50.8 acres in Murfreesboro, Tennessee. Currently in early-stage development, the property is expected to be completed in the third quarter of 2022 at a total fixed cost (including land) of approximately $82.1 million (US $66.2 million). The state-of-the-art facility will have modern features including cross-dock configuration, 40’ clear height, LED lighting and other sustainable design features. The property has direct access to the I-24, is 26 miles from Nashville International Airport and 31 miles from downtown Nashville. The property is expected to achieve a stabilized development yield of 5.26%.
Granite REIT 2021 Second Quarter Report 5
Property Dispositions
During the six months ended June 30, 2021, Granite disposed of two properties for total proceeds of $23.8 million.
Dispositions (in millions, except as noted)
Property Address | Location | Sq ft | Date Disposed | Sale Price(1) | Annualized Revenue(2) | |||||||||||||||
Disposed during the six months ended June 30, 2021: |
| |||||||||||||||||||
Hedera Road, Ravensbank Business Park |
| Redditch, United Kingdom |
|
| 0.1 |
|
| January 28, 2021 |
| $ | 10.6 |
| $ | 0.8 |
| |||||
Puchberger Straße 267 | Weikersdorf, Austria | 0.2 | June 30, 2021 | $ | 13.2 | $ | 0.7 | |||||||||||||
| 0.3 | $ | 23.8 |
| $ | 1.5 |
| |||||||||||||
| (1) | Sale price does not include transaction costs associated with disposition. |
| (2) | As at the date of disposition. The property in Weikersdorf, Austria was 53% occupied on the disposition date. |
Construction, Development and Property Commitments
Granite had the following property purchase and construction and development commitments as at June 30, 2021:
Commitments (in millions, except as noted)
Property Location | Additional sq ft | Accruals/ Payments/ Deposits Made | Future Commitments(1) | Total Cost | Year-One Stabilized Yield(2) | |||||||||||||||
As at June 30, 2021: | ||||||||||||||||||||
Development, construction or expansion: | ||||||||||||||||||||
Redevelopment in Altbach, Germany |
| 0.3 | $ | 11.0 |
| $ | 21.4 |
| $ | 32.4 |
|
| 6.6 | % | ||||||
Property under development in Houston, Texas |
| 0.7 |
| 7.3 |
| 32.9 |
| 40.2 |
| 6.9 | % | |||||||||
Property under development in Fort Worth, Texas |
| 0.6 |
| 1.9 |
| 41.2 |
| 43.1 |
| 5.8 | % | |||||||||
Property under development in Murfreesboro, TN |
| 0.8 |
| — |
|
| 64.7 |
| 64.7 |
| 5.3 | % | ||||||||
Expansion of 2095 Logistics Drive, Mississauga, ON |
| 0.1 |
| 2.6 |
| 8.4 |
| 11.0 |
| 7.7 | % | |||||||||
Expansion of 555 Beck Cres., Ajax, ON |
| — |
|
| 0.2 |
| 8.3 |
| 8.5 |
| 5.8 | % | ||||||||
Tenant improvement commitment at developed property in Plainfield, Indiana |
| — |
|
| — |
|
| 2.6 |
| 2.6 |
| — | % | |||||||
Other construction commitments |
| — |
|
| 1.0 |
| 2.6 |
| 3.6 |
| — | % | ||||||||
| 2.5 | $ | 24.0 |
| $ | 182.1 |
| $ | 206.1 |
|
| 6.1 | % | |||||||
| (1) | Includes signed contracts and future budgeted expenditures not yet contracted. |
| (2) | Yield based on total cost including land. |
On June 30, 2021, Granite acquired on a forward-funding basis, a 844,480 square foot modern distribution facility to be constructed on a 50.8 acre greenfield site in Murfreesboro, Tennessee, a suburb of Nashville. (see “SIGNIFICANT MATTERS — Property Acquisitions” above).
During the second quarter of 2021, Granite advanced site planning for the speculative expansion of 555 Beck Crescent in Ajax, Ontario. The property has direct access and frontage to highway 401 and the modern expansion will feature, 32’ clear height, LED lighting and other sustainable features. Vertical construction of the 48,911 square foot expansion is expected to commence later this year with completion anticipated by the end of 2022.
Equity Offering
On June 9, 2021, Granite completed an offering of 3,979,000 stapled units at a price of $79.50 per unit for total gross proceeds of $316.3 million, including 519,000 stapled units issued
6 Granite REIT 2021 Second Quarter Report
pursuant to the exercise of the over-allotment option granted to the underwriters. The net proceeds received by Granite after deducting the total costs related to the offering were $303.1 million.
| BUSINESS OVERVIEW AND STRATEGIC OUTLOOK |
Business Overview
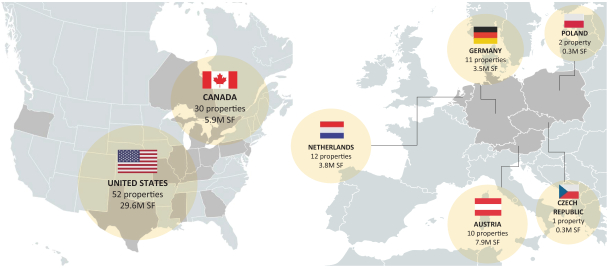
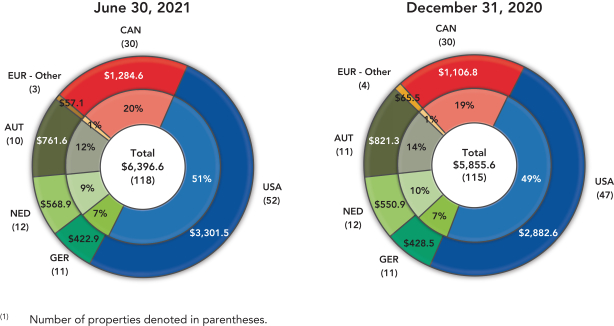
Granite is a Canadian-based real estate investment trust (“REIT”) engaged in the acquisition, development, ownership and management of logistics, warehouse and industrial properties in North America and Europe. As at August 4, 2021, Granite owns 118 investment properties in seven countries having approximately 51.3 million square feet of gross leasable area. Granite has a highly-integrated team of real estate professionals with extensive experience in operations, leasing, development, investment and asset management located at its head office in Toronto, Canada and regional offices in Dallas, U.S.A; Vienna, Austria; and Amsterdam, Netherlands.
Granite’s investment properties consist of income-producing properties, properties under development and land held for development (see “INVESTMENT PROPERTIES”). The income-producing properties consist primarily of logistics, e-commerce and distribution warehouse, light industrial and heavy industrial manufacturing properties. Lease payments are primarily denominated in three currencies: the Canadian dollar (“$”), the Euro (“€”) and the US dollar (“US$”). Granite’s investment properties by geographic location, property count and square footage as at August 4, 2021 are summarized below:
Investment Properties Summary
Seven countries/118 properties/51.3 million square feet
|
Strategic Outlook
Management continues to identify and pursue value creation and investment opportunities that management believes will generate superior long-term total returns for unitholders.
Granite’s long-term strategy is to continue to build an institutional quality and globally diversified industrial real estate business; to grow and diversify its asset base through acquisitions, development, re-development and dispositions; to maintain a conservative balance sheet; and to
Granite REIT 2021 Second Quarter Report 7
reduce its exposure to its largest tenant, Magna International Inc. and its operating subsidiaries (collectively, “Magna”) and the special purpose properties (see “INVESTMENT PROPERTIES”).
Granite has positioned itself financially to execute on its strategic plan including to capitalize on a strong pipeline of acquisition and development opportunities within its targeted geographic footprint.
As Granite looks to the remainder of 2021, its priorities are set out below:
| • | Continue to grow in its target markets in North America and Europe primarily through property and portfolio acquisitions as well as through the development of modern logistics and e-commerce assets and selective joint venture arrangements; |
| • | Grow net asset value as well as FFO and AFFO per unit through active asset management; |
| • | Pursue development and expansion opportunities within the existing portfolio; |
| • | Maintain conservative capital ratios providing balance sheet flexibility and liquidity; |
| • | Continue to expand and enhance Granite’s global platform; |
| • | Further integrate Granite’s Environmental, Social, Governance and Resilience (ESG+R) principles into investment and management processes and continue to implement strategic initiatives to enhance its ESG+R Program; and |
| • | Implement a safe return-to-workplace protocol for employees in accordance with local public health guidelines of our office jurisdictions. |
| ENVIRONMENTAL, SOCIAL, GOVERNANCE, AND RESILIENCE (ESG+R) |
Granite recognizes the important role building owners can play in fostering the efficient use of resources and respecting our environment. As a good steward for investors, Granite seeks to practically incorporate sustainability in its actions and decision-making process, while generating returns for unitholders.
Consistent with this principle, Granite applies the following long-term ESG+R objectives in its business:
| Environmental | Social | Governance | Resilience | |||
| Promote efficiency and sustainable practices at both our properties and our corporate offices | Engage with our investors, employees, tenants, property managers, and community | Disclose our ESG+R performance as a commitment to transparency and accountability | Identify and mitigate potential climate-related risks within our portfolio |
Granite’s ESG+R program is aligned with INREV1, GRESB2, GRI3 and UNPRI4.
GRESB
GRESB assesses and scores the Environmental, Social, and Governance (ESG) performance of real estate portfolios around the world. Granite completed its first annual GRESB Real Estate Assessment in 2020.
Granite continues to implement strategic initiatives to enhance its ESG+R Program. The REIT completed its second GRESB submission in June 2021. Results will be released in October 2021.
CDP
Granite’s inaugural CDP report is underway. CDP (formerly the “Carbon Disclosure Project”) is a global disclosure system that measures and scores companies’ environmental impacts.
8 Granite REIT 2021 Second Quarter Report
2020 ESG+R Report
For greater detail on Granite’s actions and performance under its ESG+R program, please refer to Granite’s 2020 ESG+R report, issued August 4, 2021, and found on Granite’s website at https://granitereit.com/2020-global-esgr-report/ .
| 1 | European Association for Investors in Non-Listed Real Estate Vehicles |
| 2 | Global Real Estate Sustainability Benchmarking |
| 3 | Global Reporting Initiative |
| 4 | United Nations’ Principles for Responsible Investing |
| RESULTS OF OPERATIONS |
Net Income
The following is a summary of financial information from the unaudited condensed combined statements of net income for the three and six months ended June 30, 2021 and 2020, respectively:
Net Income
| ||||||||||||
Three Months Ended | Six Months Ended June 30, | |||||||||||||||||||||||
| (in millions, except as noted) | 2021 | 2020 | $ change | 2021 | 2020 | $ change | ||||||||||||||||||
Rental revenue | $ | 94.0 | $ | 81.0 | 13.0 | $ | 189.9 | $ | 159.1 | 30.8 | ||||||||||||||
Revenue | 94.0 | 81.0 | 13.0 | 189.9 | 159.1 | 30.8 | ||||||||||||||||||
Property operating costs | 13.7 | 9.8 | 3.9 | 28.0 | 20.0 | 8.0 | ||||||||||||||||||
Net operating income | 80.3 | 71.2 | 9.1 | 161.9 | 139.1 | 22.8 | ||||||||||||||||||
General and administrative expenses | 8.3 | 9.0 | (0.7 | ) | 17.2 | 14.7 | 2.5 | |||||||||||||||||
Depreciation and amortization | 0.4 | 0.2 | 0.2 | 0.6 | 0.5 | 0.1 | ||||||||||||||||||
Interest income | (0.6 | ) | (0.4 | ) | (0.2 | ) | (1.4 | ) | (1.3 | ) | (0.1 | ) | ||||||||||||
Interest expense and other financing costs | 9.6 | 7.8 | 1.8 | 24.4 | 14.4 | 10.0 | ||||||||||||||||||
Foreign exchange gains, net | (1.1 | ) | — | (1.1 | ) | (1.8 | ) | (2.7 | ) | 0.9 | ||||||||||||||
Fair value gains on investment properties, net | (308.0 | ) | (34.5 | ) | (273.5 | ) | (517.5 | ) | (70.5 | ) | (447.0 | ) | ||||||||||||
Fair value losses on financial instruments, net | 0.2 | 3.9 | (3.7 | ) | 0.5 | 5.8 | (5.3 | ) | ||||||||||||||||
Loss on sale of investment properties, net | 0.4 | — | 0.4 | 0.6 | — | 0.6 | ||||||||||||||||||
Income before income taxes | 371.1 | 85.2 | 285.9 | 639.3 | 178.2 | 461.1 | ||||||||||||||||||
Income tax expense | 54.1 | 9.5 | 44.6 | 92.0 | 21.1 | 70.9 | ||||||||||||||||||
Net income | $ | 317.0 | $ | 75.7 | 241.3 | $ | 547.3 | $ | 157.1 | 390.2 | ||||||||||||||
Net income attributable to: | ||||||||||||||||||||||||
Stapled unitholders | 316.9 | 75.7 | 241.2 | 547.1 | 157.0 | 390.1 | ||||||||||||||||||
Non-controlling interests | 0.1 | — | 0.1 | 0.2 | 0.1 | 0.1 | ||||||||||||||||||
| $ | 317.0 | $ | 75.7 | 241.3 | $ | 547.3 | $ | 157.1 | 390.2 | |||||||||||||||
Granite REIT 2021 Second Quarter Report 9
Foreign Currency Translation
The majority of Granite’s investment properties are located in Europe and the United States and the cash flows derived from such properties are primarily denominated in Euros and US dollars. Accordingly, fluctuations in the Canadian dollar, Granite’s reporting currency, relative to the Euro and US dollar will result in fluctuations in the reported values of revenues, expenses, cash flows, assets and liabilities. The most significant foreign currency exchange rates that impact Granite’s business are summarized in the following table:
| Average Exchange Rates | Period End Exchange Rates | |||||||||||||||||||||||||||||||||||||||
| Three Months Ended June 30, | Six Months Ended June 30, | June 30, | December 31, | |||||||||||||||||||||||||||||||||||||
| 2021 | 2020 | Change | 2021 | 2020 | Change | 2021 | 2020 | Change | ||||||||||||||||||||||||||||||||
$ per €1.00 | 1.480 | 1.526 | (3%) | 1.502 | 1.503 | —% | 1.470 | 1.560 | (6%) | |||||||||||||||||||||||||||||||
$ per US$1.00 | 1.228 | 1.386 | (11%) | 1.247 | 1.365 | (9%) | 1.240 | 1.275 | (3%) | |||||||||||||||||||||||||||||||
For the three and six months ended June 30, 2021 compared to the prior year periods, the average exchange rates of the Euro and US dollar relative to the Canadian dollar were lower, which on a comparative basis, decreased the Canadian dollar equivalent of revenue and expenses from Granite’s European and US operations.
The period end exchange rates of the Euro and the US dollar relative to the Canadian dollar on June 30, 2021 were lower when compared to the December 31, 2020 exchange rates. As a result, the Canadian dollar equivalent of assets and liabilities from Granite’s European and US operations were lower when compared to December 31, 2020.
On a net basis, the effect of the changes in exchange rates on Granite’s operating results for the three and six months ended June 30, 2021 was as follows:
Effects of Changes in Exchange Rates on Operating Results |
| Three Months Ended June 30, | Six Months Ended June 30, | |||||||
(in millions, except per unit information) | 2021 vs 2020 | 2021 vs 2020 | ||||||
Decrease in revenue |
| $(6.8) |
|
| $(8.9) |
| ||
Decrease in NOI — cash basis |
| (8.1) |
|
| (10.9) |
| ||
Decrease in net income |
| (22.2) |
|
| (27.9) |
| ||
Decrease in FFO |
| (5.1) |
|
| (6.7) |
| ||
Decrease in AFFO |
| (4.9) |
|
| (6.3) |
| ||
Decrease in FFO per unit | $ | (0.08) |
| $ | (0.11) |
| ||
Decrease in AFFO per unit | $ | (0.08) |
| $ | (0.10) |
| ||
10 Granite REIT 2021 Second Quarter Report
Operating Results
Revenue
Revenue |
| Three Months Ended June 30, | Six Months Ended June 30, | |||||||||||||||||||||||||||
| 2021 | 2020 | $ change | 2021 | 2020 | $ change | |||||||||||||||||||||||
Rental revenue and amortization(1) | $ | 80.4 | $ | 71.5 | 8.9 | $ | 162.5 | $ | 140.0 | 22.5 | ||||||||||||||||||
Tenant recoveries | 13.6 | 9.5 | 4.1 | 27.4 | 19.0 | 8.4 | ||||||||||||||||||||||
Revenue | $ | 94.0 | $ | 81.0 | 13.0 | $ | 189.9 | $ | 159.1 | 30.8 | ||||||||||||||||||
| (1) | Rental revenue and amortization include base rent, straight-line rent amortization and tenant incentive amortization. |
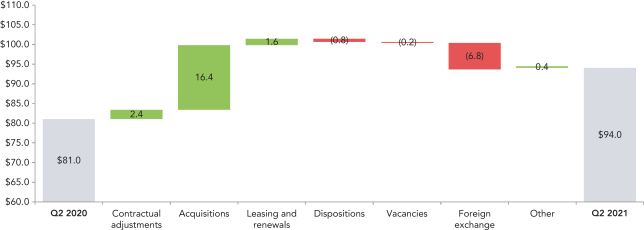
Revenue for the three month period ended June 30, 2021 increased by $13.0 million to $94.0 million from $81.0 million in the prior year period. The components contributing to the change in revenue are detailed below:
Q2 2021 vs Q2 2020 Change in Revenue |
Additional details pertaining to the components of the change in revenue are as follows:
| • | contractual rent adjustments included $0.4 million from consumer price index based increases and $2.0 million from fixed contractual adjustments related to rent escalations; |
| • | the acquisitions of properties located in the United States, Canada and the Netherlands beginning in the second quarter of 2020 increased revenue by $16.4 million, which included $2.6 million of tenant recoveries; |
| • | revenue increased by $1.6 million due to various renewal and re-leasing activities for properties primarily in Canada and the United States; |
| • | the sale of properties located in Canada, Spain and the United Kingdom during 2020 and 2021 decreased revenue by $0.8 million; and |
| • | foreign exchange had a net $6.8 million negative impact as the relative strengthening of the Canadian dollar against the Euro and US dollar decreased revenue by $0.9 million and $5.9 million, respectively. |
Granite REIT 2021 Second Quarter Report 11
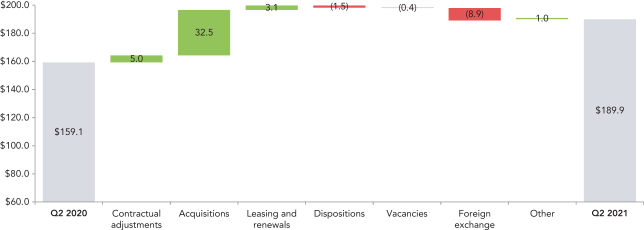
Revenue for the six month period ended June 30, 2021 increased by $30.8 million to $189.9 million from $159.1 million in the prior year period. The components contributing to the change in revenue are detailed below:
Q2 2021 YTD vs Q2 2020 YTD Change in Revenue
|
Additional details pertaining to the components of the change in revenue are as follows:
| • | contractual rent adjustments included $0.6 million from consumer price index based increases and $4.4 million from fixed contractual adjustments related to rent escalations; |
| • | the acquisitions of properties located in the United States, Canada and the Netherlands during 2020 and 2021 increased revenue by $32.5 million, which included $5.5 million of tenant recoveries; |
| • | revenue increased by $3.1 million due to various renewal and re-leasing activities for properties primarily in Canada and the United States; |
| • | the sale of properties located in Canada, Spain and the United Kingdom during 2020 and 2021 decreased revenue by $1.5 million; and |
| • | foreign exchange had a net $8.9 million negative impact as the relative strengthening of the Canadian dollar against the Euro and US dollar decreased revenue by $0.1 million and $8.8 million, respectively. |
12 Granite REIT 2021 Second Quarter Report
Revenue by major currency for the three and six month periods ended June 30, 2021 and 2020 was as follows:
Revenue by Currency |
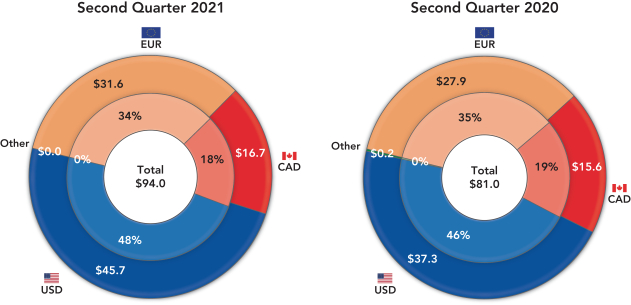

As a majority of the Trust’s revenue is denominated in currencies other than the Canadian dollar, Granite uses derivative financial instruments, including cross currency interest rate swaps, forward currency contracts and foreign exchange collars, to partially hedge its exposure to foreign currencies and reduce the potential impact that foreign currency rate changes may have on Granite’s operating results, cash flows and distributions (see “LIQUIDITY AND CAPITAL RESOURCES — Debt Structure”).
Granite REIT 2021 Second Quarter Report 13
Net Operating Income
Net operating income (“NOI”) in the three months ended June 30, 2021 was $80.3 million compared to $71.2 million during the three months ended June 30, 2020. NOI in the six months ended June 30, 2021 was $161.9 million compared to $139.1 million in the six months ended June 30, 2020. NOI — cash basis excludes the impact of lease termination, close-out fees, straight-line rent and tenant incentive amortization and reflects the cash generated by the income-producing properties excluding lease termination and close-out fees on a period-over-period basis. NOI — cash basis was $79.9 million in the three months ended June 30, 2021 compared with $71.0 million in the prior year period, an increase of 12.5%. NOI — cash basis was $159.7 million in the six months ended June 30, 2021 compared with $138.8 million in the prior year period, an increase of 15.1%.
Same property NOI — cash basis refers to the NOI — cash basis for those properties owned by Granite throughout the entire current and prior year periods under comparison. Same property NOI — cash basis excludes the impact of properties that were acquired, disposed of, classified as properties under or held for development or assets held for sale during the periods under comparison. Same property NOI — cash basis in the three months ended June 30, 2021 was $66.6 million, compared with $69.0 million in the prior year period. The changes in same property are detailed below:
Same Property NOI
|
Sq ft(1) (in millions) | Three Months Ended | Sq ft(1) (in millions) | Six Months Ended | |||||||||||||||||||||||||||||||||||||
| 2021 | 2020 | $ change | % change | 2021 | 2020 | $ change | % change | |||||||||||||||||||||||||||||||||
Revenue | $ | 94.0 | $ | 81.0 | 13.0 | $ | 189.9 | $ | 159.1 | 30.8 | ||||||||||||||||||||||||||||||
Less: Property operating costs |
| 13.7 |
|
| 9.8 |
|
| 3.9 |
| 28.0 |
|
| 20.0 |
|
| 8.0 | ||||||||||||||||||||||||
NOI | $ | 80.3 |
| $ | 71.2 |
|
| 9.1 |
| 12.8% |
| $ | 161.9 |
| $ | 139.1 |
|
| 22.8 |
| 16.4% |
| ||||||||||||||||||
Add (deduct): | ||||||||||||||||||||||||||||||||||||||||
Straight-line rent amortization |
| (1.7 | ) |
| (1.5 | ) |
| (0.2 | ) |
| (4.8 | ) |
| (2.9 | ) |
| (1.9 | ) | ||||||||||||||||||||||
Tenant incentive amortization |
| 1.3 |
|
| 1.3 |
|
| — |
|
| 2.6 |
|
| 2.6 |
|
| — |
| ||||||||||||||||||||||
NOI — cash basis |
| 51.3 | $ | 79.9 |
| $ | 71.0 |
|
| 8.9 |
| 12.5% |
|
| 51.3 | $ | 159.7 |
| $ | 138.8 |
|
| 20.9 |
| 15.1% |
| ||||||||||||||
Less NOI — cash basis for: | ||||||||||||||||||||||||||||||||||||||||
Acquisitions |
| 11.5 |
|
| (12.6 | ) |
| (0.9 | ) |
| (11.7 | ) |
| 11.5 |
|
| (23.8 | ) |
| (0.9 | ) |
| (22.9 | ) | ||||||||||||||||
Dispositions, assets held for sale and developments | 1.3 | (0.7 | ) | (1.1 | ) | 0.4 | 1.3 | (1.6 | ) | (2.2 | ) | 0.6 | ||||||||||||||||||||||||||||
Same property NOI — cash basis |
| 39.3 |
| $ | 66.6 |
| $ | 69.0 |
|
| (2.4 | ) |
| (3.5)% |
|
| 39.3 |
| $ | 134.3 |
| $ | 135.7 |
|
| (1.4 | ) |
| (1.0)% |
| ||||||||||
Constant currency same property NOI — cash basis(2) |
| 39.3 |
| $ | 66.6 |
| $ | 64.7 |
|
| 1.9 |
| 2.9% |
|
| 39.3 |
| $ | 134.3 |
| $ | 130.6 |
|
| 3.7 |
| 2.9% |
| ||||||||||||
| (1) | The square footage relating to the NOI — cash basis represents GLA of 51.3 million square feet as at June 30, 2021. The square footage relating to the same property NOI — cash basis represents the aforementioned GLA excluding the impact from the acquisitions, dispositions and developments during the relevant period. |
| (2) | Constant currency same property NOI — cash basis is calculated by converting the comparative same property NOI — cash basis at current foreign exchange rates. |
14 Granite REIT 2021 Second Quarter Report
Property operating costs include recoverable and non-recoverable costs from tenants and consist of property taxes, utilities, insurance, repairs and maintenance, legal and other property-related expenses. Granite’s employee compensation expenses are excluded in property operating costs.
Straight-line rent amortization represents the scheduled fixed rent changes or rent-free periods in leases that are recognized in revenue evenly on a straight-line basis over the term of the lease. Tenant incentive amortization mainly represents allowances provided to tenants that are recognized in revenue evenly on a straight-line basis over the term of the lease and primarily comprises the amortization associated with the cash allowance incentives paid to Magna in respect of the 10-year lease extensions exercised during the 2014 year at the Thondorf and Eurostar properties in Graz, Austria.
NOI — cash basis for the three months ended June 30, 2021 increased $8.9 million to $79.9 million from $71.0 million in the prior year period, representing an increase of 12.5%. NOI — cash basis for the six months ended June 30, 2021 increased $20.9 million to $159.7 million from $138.8 million in the prior year period, representing an increase of 15.1%. The increase in NOI — cash basis was largely a result of the increase in rental revenue as noted previously, partially offset by an increase in property operating costs primarily relating to the properties acquired in 2020 and 2021 to date.
Same property NOI — cash basis for the three months ended June 30, 2021 decreased $2.4 million (3.5%) to $66.6 million from $69.0 million primarily due to the unfavourable foreign exchange impact from the strengthening of the Canadian dollar against the Euro and US dollar. Excluding the impact of foreign exchange, same property NOI — cash basis for the three month period ended June 30, 2021 increased $1.9 million (2.9%) from the prior year period primarily due to the increase in contractual rents arising from both consumer price index and fixed rent increases, re-leasing and renewals of various leases for properties primarily located in the United States, Canada and the Netherlands.
Same property NOI — cash basis for the six months ended June 30, 2021 decreased $1.4 million (1.0%) to $134.3 million from $135.7 million primarily due to the unfavourable foreign exchange impact from the strengthening of the Canadian dollar against the Euro and US dollar. Excluding the impact of foreign exchange, same property NOI — cash basis for the six month period ended June 30, 2021 increased $3.7 million (2.9%) from the prior year period primarily due to the increase in contractual rents arising from both consumer price index and fixed rent increases, re-leasing and renewals of various leases for properties primarily located in the United States, Canada and the Netherlands.
Granite REIT 2021 Second Quarter Report 15
NOI — cash basis for the three and six month periods ended June 30, 2021 and 2020 by geography was as follows:
NOI — Cash Basis by Geography
|
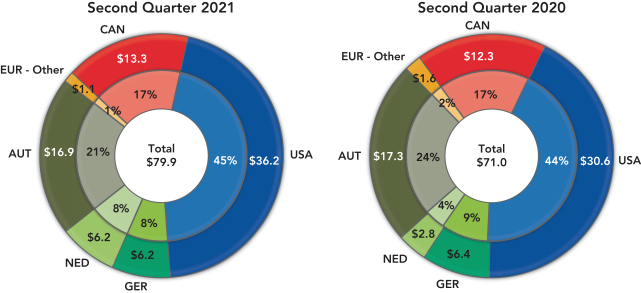
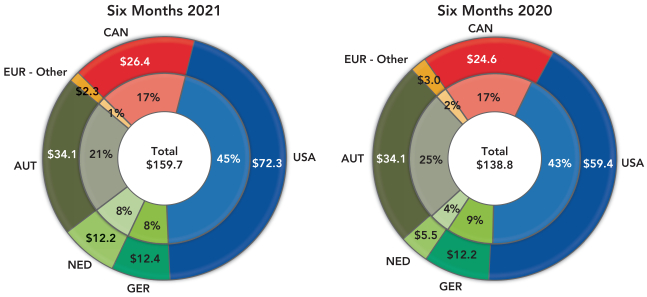
Granite’s property portfolio and NOI — cash basis are geographically diversified, which reduces the risk to Granite’s operating results from any particular country’s economic downturn.
16 Granite REIT 2021 Second Quarter Report
Same property NOI — cash basis for the three and six month periods ended June 30, 2021 and 2020 by geography was as follows:
Same Property NOI — Cash Basis by Geography
|
Three Months Ended June 30, | Six Months Ended June 30, | |||||||||||||||||||||||||||
| 2021 | 2020 | % change | 2021 | 2020 | % change | |||||||||||||||||||||||
Canada | $ | 12.5 | $ | 11.9 | 5.6% | $ | 25.1 | $ | 23.6 | 6.2% | ||||||||||||||||||
United States | 27.5 | 29.9 | (8.6)% | 55.4 | 58.9 | (5.9)% | ||||||||||||||||||||||
Austria | 16.7 | 17.0 | (1.7)% | 33.7 | 33.4 | 0.9% | ||||||||||||||||||||||
Germany | 6.2 | 6.4 | (1.7)% | 12.4 | 12.3 | 1.7% | ||||||||||||||||||||||
Netherlands | 2.6 | 2.6 | 0.6% | 5.5 | 5.2 | 4.4% | ||||||||||||||||||||||
Europe — Other | 1.1 | 1.2 | (6.8)% | 2.2 | 2.3 | (3.5)% | ||||||||||||||||||||||
Same Property NOI — cash basis | $ | 66.6 | $ | 69.0 | (3.5)% | $ | 134.3 | $ | 135.7 | (1.0)% | ||||||||||||||||||
Constant currency same property NOI — cash basis for the three and six month periods ended June 30, 2021 and 2020 by geography was as follows, which is calculated by converting the comparative same property NOI — cash basis at current foreign exchange rates:
Constant Currency Same Property NOI — Cash Basis by Geography
|
Three Months Ended June 30, | Six Months Ended June 30, | |||||||||||||||||||||||||||
| 2021 | 2020 | % change | 2021 | 2020 | % change | |||||||||||||||||||||||
Canada | $ | 12.5 | $ | 11.9 | 5.6% | $ | 25.1 | $ | 23.6 | 6.2% | ||||||||||||||||||
United States | 27.5 | 26.5 | 3.1% | 55.4 | 53.8 | 3.0% | ||||||||||||||||||||||
Austria | 16.7 | 16.5 | 1.4% | 33.7 | 33.4 | 0.9% | ||||||||||||||||||||||
Germany | 6.2 | 6.2 | 1.3% | 12.4 | 12.2 | 1.8% | ||||||||||||||||||||||
Netherlands | 2.6 | 2.5 | 3.7% | 5.5 | 5.3 | 4.4% | ||||||||||||||||||||||
Europe — Other | 1.1 | 1.1 | (4.0)% | 2.2 | 2.3 | (4.1)% | ||||||||||||||||||||||
Constant Currency Same Property NOI — cash basis(1) | $ | 66.6 | $ | 64.7 | 2.9% | $ | 134.3 | $ | 130.6 | 2.9% | ||||||||||||||||||
| (1) | Constant currency same property NOI — cash basis is calculated by converting the comparative same property NOI — cash basis at current foreign exchange rates. |
Granite REIT 2021 Second Quarter Report 17
General and Administrative Expenses
General and administrative expenses consisted of the following:
General and Administrative Expenses |
Three Months Ended June 30, | Six Months Ended June 30, | |||||||||||||||||||||||||||
| 2021 | 2020 | $ change | 2021 | 2020 | $ change | |||||||||||||||||||||||
Salaries and benefits | $ | 3.6 | $ | 3.2 | 0.4 | $ | 8.6 | $ | 7.0 | 1.6 | ||||||||||||||||||
Audit, legal and consulting | 0.8 | 0.9 | (0.1 | ) | 1.6 | 1.8 | (0.2 | ) | ||||||||||||||||||||
Trustee/director fees and related expenses | 0.4 | 0.3 | 0.1 | 0.8 | 0.6 | 0.2 | ||||||||||||||||||||||
Trustee/director and executive unit-based compensation expense including distributions | 1.1 | 1.1 | — | 2.6 | 2.2 | 0.4 | ||||||||||||||||||||||
Fair value remeasurement of trustee/director and executive unit-based compensation plans | 1.0 | 1.9 | (0.9 | ) | 0.9 | 0.4 | 0.5 | |||||||||||||||||||||
Other public entity costs | 0.7 | 0.6 | 0.1 | 1.1 | 0.9 | 0.2 | ||||||||||||||||||||||
Office rents including property taxes and common area maintenance costs | 0.1 | 0.1 | — | 0.2 | 0.2 | — | ||||||||||||||||||||||
Capital tax | 0.1 | 0.3 | (0.2 | ) | 0.3 | 0.3 | — | |||||||||||||||||||||
Information technology | 0.5 | 0.2 | 0.3 | 0.9 | 0.5 | 0.4 | ||||||||||||||||||||||
Other | 0.2 | 0.4 | (0.2 | ) | 0.4 | 0.8 | (0.4 | ) | ||||||||||||||||||||
| $ | 8.5 | $ | 9.0 | (0.5 | ) | $ | 17.4 | $ | 14.7 | 2.7 | ||||||||||||||||||
Less: capitalized general administrative expenses | (0.2 | ) | — | (0.2 | ) | (0.2 | ) | — | (0.2 | ) | ||||||||||||||||||
General and administrative expenses | $ | 8.3 | $ | 9.0 | (0.7 | ) | $ | 17.2 | $ | 14.7 | 2.5 | |||||||||||||||||
General and administrative expenses were $8.3 million for the three month period ended June 30, 2021 and decreased $0.7 million in comparison to the prior year period primarily as a result of the following:
| • | a decrease in the fair value remeasurement expense associated with the trustee/director and executive unit-based compensation plans resulting from a smaller increase in the market price of the Trust’s stapled units in the second quarter of 2021 relative to the second quarter of 2020; |
| • | an increase in capitalized general administrative expenses resulting from salaries and wages related to an increase in development activity in the current period; and |
| • | a decrease in capital tax expense due to a year-to-date adjustment made in the second quarter of 2020, partially offset by; |
| • | an increase in salaries and benefits expense primarily due to additional employees in North America and Europe. |
General and administrative expenses were $17.2 million for the six month period ended June 30, 2021 and increased $2.5 million in comparison to the prior year period primarily as a result of the following:
| • | an increase in salaries and benefits expense primarily due to additional employees as previously mentioned and an increase to incentive compensation paid in the current year period relating to the 2020 fiscal year; |
18 Granite REIT 2021 Second Quarter Report
| • | an increase in the fair value remeasurement associated with the trustee/director and executive unit-based compensation plans resulting from an increase in the market price of the Trust’s stapled units in the current year period relative to the prior year; and |
| • | an increase in executive unit-based compensation expense due to a greater number of awards outstanding under the plan, partially offset by; |
| • | a decrease in audit, legal and consulting expenses due to costs incurred in the prior year period associated with corporate advisory matters including internal reorganizations; and |
| • | an increase in capitalized general administrative expenses resulting from salaries and wages related to an increase in development activity in the current year period. |
Interest Income
Interest income for the three month period ended June 30, 2021 increased $0.2 million to $0.6 million from $0.4 million in the prior year period. Interest income for the six month period ended June 30, 2021 increased $0.1 million to $1.4 million from $1.3 million in the prior year period. Both increases were due to the increase of invested cash balances on hand.
Interest Expense and Other Financing Costs
Interest expense and other financing costs for the three month period ended June 30, 2021 increased $1.8 million to $9.6 million from $7.8 million in the prior year period. The increase was related to increased interest costs resulting from the issuance of the 2027 Debentures in June 2020 and the 2030 Debentures in December 2020, partially offset by lower interest costs resulting from the redemption of the 2021 Debentures on January 4, 2021.
Interest expense and other financing costs for the six month periods ended June 30, 2021 and 2020 were $24.4 million and $14.4 million, respectively. The $10.0 million increase is primarily due to increased interest costs related to the 2027 Debentures and 2030 Debentures previously mentioned and the $4.0 million of early redemption premium incurred for the 2021 Debentures and $0.5 million of accelerated amortization of original financing costs related to the financing of Granite’s credit facility during the first quarter of 2021.
As at June 30, 2021, Granite’s weighted average cost of interest-bearing debt was 1.74% (June 30, 2020 — 2.16%) and the weighted average debt term-to-maturity was 5.7 years (June 30, 2020 — 4.8 years).
Foreign Exchange Gains and Losses, Net
Granite recognized net foreign exchange gains of $1.1 million and net foreign exchange losses of less than $0.1 million in the three months ended June 30, 2021 and 2020, respectively. The $1.1 million increase in net foreign exchange gains is primarily due to foreign exchange gains from the settlement of foreign exchange collar contracts in the current year period, offset partially by the remeasurement of certain monetary assets and liabilities of the Trust that are denominated in US dollars and Euros as a result of the strengthening of the Canadian dollar against the US dollar and Euro.
Granite recognized net foreign exchange gains of $1.8 million and $2.7 million in the six months ended June 30, 2021 and 2020, respectively. The $0.9 million decrease in net foreign exchange gains is primarily due to the remeasurement of certain monetary assets and liabilities of the Trust that are denominated in US dollars and Euros as a result of the strengthening of the Canadian dollar against the US dollar and Euro, offset partially by foreign exchange gains realized on the settlement of foreign exchange collar contracts.
Granite REIT 2021 Second Quarter Report 19
Fair Value Gains and Losses on Investment Properties, Net
Net fair value gains on investment properties were $308.0 million and $34.5 million in the three months ended June 30, 2021 and 2020, respectively. In the three months ended June 30, 2021, net fair value gains of $308.0 million were primarily attributable to favourable changes in fair market rent assumptions as well as compression in discount and terminal capitalization rates for properties located in the Greater Toronto Area in Ontario, Canada (the “GTA”) and across the United States as well as for certain of the Trust’s modern warehouse properties in Europe.
Net fair value gains on investment properties in the three months ended June 30, 2020 of $34.5 million were attributable to i) the favourable changes in leasing assumptions associated with fair market rent increases for properties located in Canada and ii) the increase in fair value of the recently developed property in Plainfield, Indiana as a result of executing a full building 10-year lease with a new tenant, marginally offset by an increase in discount rates for certain properties located in Austria due to market conditions and the nature of the tenants and properties in this jurisdiction.
Net fair value gains on investment properties were $517.5 million and $70.5 million in the six months ended June 30, 2021 and 2020, respectively. In the six months ended June 30, 2021, net fair value gains of $517.5 million were primarily attributable to various factors including i) favourable changes in leasing assumptions associated with fair market rent increases for properties located in Canada and the United States ii) compression in discount and terminal capitalization rates for properties located in the Greater Toronto Area in Ontario, Canada (the “GTA”) and across the United States as well as for certain of the Trust’s modern warehouse properties in Europe resulting from the continued market demand for industrial real estate properties.
Net fair value gains on investment properties in the six months ended June 30, 2020 of $70.5 million were attributable to various factors including i) an increase in fair value of an acquired property in Dallas, Texas as a result of market confirmation of capitalization rates favourable to initial acquisition metrics of the forward purchase for this modern e-commerce facility, ii) the favourable changes in leasing assumptions associated with fair market rent increases for properties located in Canada and iii) the increase in fair value of Granite’s developed property in Plainfield, Indiana as a result of executing a full building 10-year lease with a new tenant, partially offset by an increase in discount rates for properties located in Austria and Germany due to market conditions and the nature of the tenants and properties across these jurisdictions.
Fair Value Gains and Losses on Financial Instruments, Net
Fair value losses on financial instruments for the three month periods ended June 30, 2021 and 2020 were $0.2 million and $3.9 million, respectively. The fair value losses on financial instruments for the six month periods ended June 30, 2021 and 2020 were $0.5 million and $5.8 million, respectively. The fair value losses on financial instruments for the three month period ended June 30, 2021 are related to the fair value movements of the 2024 Cross Currency Interest Rate Swap, partially offset by fair value losses on foreign exchange collar contracts. The fair value losses on financial instruments for the six months ended June 30, 2021 are related to the net fair value gains of $0.2 million associated with the fair value movements of the 2021 Cross Currency Interest Rate Swap and the 2024 Cross Currency Interest Rate Swap, offset by fair value losses on foreign exchange collar contracts. The fair value losses on financial instruments for the three and six months ended June 30, 2020 include (i) the fair value change associated with interest and other movements of a cross currency interest rate swap that matures in 2024 and (ii) unrealized losses on foreign exchange forward contracts, partially offset by fair value gains on foreign
20 Granite REIT 2021 Second Quarter Report
exchange collar contracts. These derivatives have not been designated in a hedging relationship and fair value changes are therefore recorded in the unaudited condensed statements of net income.
Loss on Sale of Investment Properties, Net
The loss on sale of investment properties for the three month period ended June 30, 2021 was $0.4 million and is primarily related to broker commissions and legal advisory costs associated with the disposition of the property in Weikersdorf, Austria on June 30, 2021. The loss on sale of investment properties for the six month period ended June 30, 2021 was $0.6 million related to the disposition of the property in Weikersodrf, Austria previously mentioned and the property in Redditch, United Kingdom disposed on January 28, 2021 . No properties were disposed of during the three and six month periods ended June 30, 2020.
Income Tax Expense
Income tax expense is comprised of the following:
Income Tax Expense |
Three Months Ended June 30, | Six Months Ended June 30, | |||||||||||||||||||||||||||
| 2021 | 2020 | $ change | 2021 | 2020 | $ change | |||||||||||||||||||||||
Foreign operations | $ | 1.7 | $ | 1.6 | 0.1 | $ | 3.5 | $ | 3.3 | 0.2 | ||||||||||||||||||
Related to sale of investment properties | 2.3 | — | 2.3 | 2.3 | — | 2.3 | ||||||||||||||||||||||
Other | 0.3 | 0.5 | (0.2 | ) | 0.5 | 0.1 | 0.4 | |||||||||||||||||||||
Current tax expense | 4.3 | 2.1 | 2.2 | 6.3 | 3.4 | 2.9 | ||||||||||||||||||||||
Deferred tax expense | 49.8 | 7.4 | 42.4 | 85.7 | 17.7 | 68.0 | ||||||||||||||||||||||
Income tax expense | $ | 54.1 | $ | 9.5 | 44.6 | $ | 92.0 | $ | 21.1 | 70.9 | ||||||||||||||||||
For the three months ended June 30, 2021, current tax expense increased compared to the prior year period primarily due to the sale of an asset in Austria and higher taxes in foreign jurisdictions for recent acquisitions; partially offset by the effect of the strengthening of the Canada dollar as compared to the prior year period.
For the six months ended June 30, 2021, current tax expense increased compared to the prior year period primarily due to the sale of an asset in Austria and higher taxes in foreign jurisdictions for recent acquisitions, as well as the recognition of tax assets in Canada for taxation years that have gone statute barred during 2020; partially offset by the recognition of tax assets in Germany for taxation years that have gone statute barred during 2021 and the strengthening of the Canadian dollar as compared to prior year.
The increase in deferred tax expense for the three and six months ended June 30, 2021 compared to the prior year periods was primarily due to an increase in fair value gains in jurisdictions in which deferred taxes are recorded.
Granite REIT 2021 Second Quarter Report 21
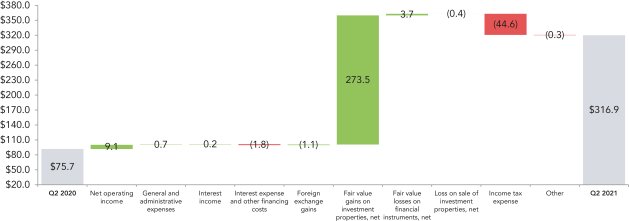
Net Income Attributable to Stapled Unitholders
For the three month period ended June 30, 2021, net income attributable to stapled unitholders was $316.9 million compared to $75.7 million in the prior year period. The increase in net income attributable to stapled unitholders was primarily due to a $273.5 million increase in fair value gains on investment properties and a $9.1 million increase in net operating income, partially offset by a $44.6 million increase in income tax expense and a $1.8 million increase in interest expense and other financing costs. The period-over-period variance is further summarized below:
Q2 2021 vs Q2 2020 Change in Net Income Attributable to Stapled Unitholders |
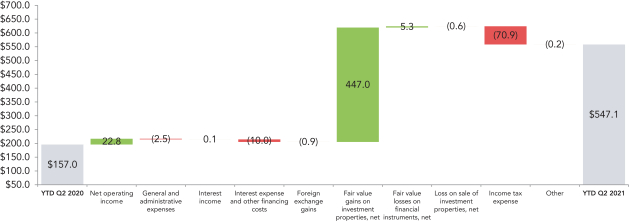
For the six month period ended June 30, 2021, net income attributable to stapled unitholders was $547.1 million compared to $157.0 million in the prior year period. The increase in net income attributable to stapled unitholders was primarily due to a $447.0 million increase in fair value gains on investment properties and a $22.8 million increase in net operating income, partially offset by a $70.9 million increase in income tax expense and a $10.0 million increase in interest expense and other financing costs. The period-over-period variance is further summarized below:
Q2 2021 YTD vs Q2 2020 YTD Change in Net Income Attributable to Stapled Unitholders |
22 Granite REIT 2021 Second Quarter Report
Funds From Operations and Adjusted Funds From Operations
The reconciliation of net income attributable to stapled unitholders to FFO and AFFO for the three and six months ended June 30, 2021 and 2020, respectively is presented below:
FFO AND AFFO RECONCILIATION |
| Three Months Ended June 30, | Six Months Ended June 30, | |||||||||||||||||||||
| (in millions, except per unit information) | 2021 | 2020 | 2021 | 2020 | ||||||||||||||||||
Net income attributable to stapled unitholders | $ | 316.9 | $ | 75.7 | $ | 547.1 | $ | 157.0 | ||||||||||||||
Add (deduct): | ||||||||||||||||||||||
Fair value gains on investment properties, net | (308.0 | ) | (34.5 | ) | (517.5 | ) | (70.5 | ) | ||||||||||||||
Fair value losses on financial instruments | 0.2 | 3.9 | 0.5 | 5.8 | ||||||||||||||||||
Loss on sale of investment properties | 0.4 | — | 0.6 | — | ||||||||||||||||||
Current income tax expense associated with the sale of investment properties | 2.3 | — | 2.3 | — | ||||||||||||||||||
Deferred income tax expense | 49.8 | 7.4 | 85.7 | 17.7 | ||||||||||||||||||
Fair value remeasurement expense relating to the Executive Deferred Stapled Unit Plan | 0.6 | 1.0 | 0.6 | 0.2 | ||||||||||||||||||
Non-controlling interests relating to the above | — | — | 0.1 | 0.1 | ||||||||||||||||||
FFO | [A] | $ | 62.2 | $ | 53.5 | $ | 119.4 | $ | 110.3 | |||||||||||||
Add (deduct): | ||||||||||||||||||||||
Maintenance or improvement capital expenditures incurred | (1.4 | ) | (1.9 | ) | (1.9 | ) | (3.0 | ) | ||||||||||||||
Leasing commissions incurred | (0.2 | ) | (0.1 | ) | (0.2 | ) | (0.1 | ) | ||||||||||||||
Tenant allowances incurred | (0.1 | ) | — | (0.2 | ) | — | ||||||||||||||||
Tenant incentive amortization | 1.3 | 1.3 | 2.6 | 2.6 | ||||||||||||||||||
Straight-line rent amortization | (1.7 | ) | (1.5 | ) | (4.8 | ) | (2.9 | ) | ||||||||||||||
AFFO | [B] | $ | 60.1 | $ | 51.3 | $ | 114.9 | $ | 106.9 | |||||||||||||
Per unit amounts: | ||||||||||||||||||||||
Basic and diluted FFO per stapled unit | [A]/[C] and [A]/[D] | $ | 0.99 | $ | 0.97 | $ | 1.92 | $ | 2.02 | |||||||||||||
Basic and diluted AFFO per stapled unit | [B]/[C] and [B]/[D] | $ | 0.96 | $ | 0.93 | $ | 1.85 | $ | 1.96 | |||||||||||||
Basic weighted average number of stapled units | [C] | 62.7 | 54.9 | 62.2 | 54.5 | |||||||||||||||||
Diluted weighted average number of stapled units | [D] | 62.8 | 54.9 | 62.2 | 54.5 | |||||||||||||||||
Granite REIT 2021 Second Quarter Report 23
Funds From Operations
FFO for the three month period ended June 30, 2021 was $62.2 million ($0.99 per unit) compared to $53.5 million ($0.97 per unit) in the prior year period. The changes in the FFO components is summarized below:
Q2 2021 vs Q2 2020 Change in FFO |
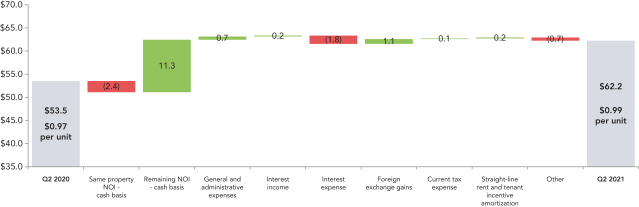
FFO for the six month period ended June 30, 2021 was $119.4 million ($1.92 per unit) compared to $110.3 million ($2.02 per unit) in the prior year period. The changes in the FFO components is summarized below:
Q2 2021 YTD vs Q2 2020 YTD Change in FFO |
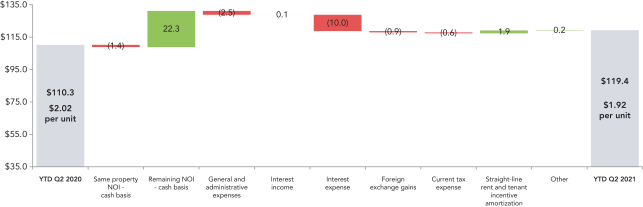
Included in FFO for the six months ended June 30, 2021 are $4.0 million of early redemption premium related to the 2021 Debentures and $0.5 million of accelerated amortization of original financing costs related to the refinancing of Granite’s credit facility. Excluding these refinancing costs, FFO would be $123.9 million ($1.99 per unit).
24 Granite REIT 2021 Second Quarter Report
AFFO for the three month period ended June 30, 2021 was $60.1 million ($0.96 per unit) compared to $51.3 million ($0.93 per unit) in the prior year period. The $8.8 million ($0.03 per unit) increase in AFFO is summarized below:
Q2 2021 vs Q2 2020 Change in AFFO |
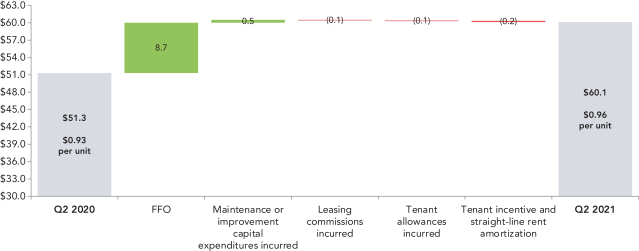
Additional details pertaining to the components of the change in AFFO are as follows:
| • | the $8.7 million increase in FFO, as noted previously; and |
| • | a $0.5 million increase in AFFO from lower maintenance or improvement capital expenditures incurred in the current year period relative to the prior year. |
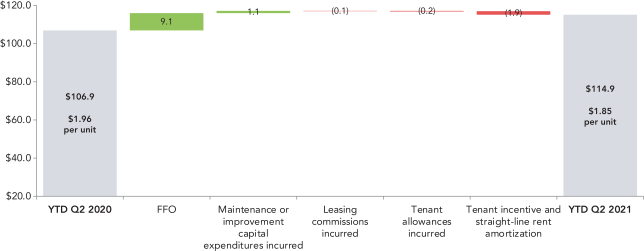
AFFO for the six month period ended June 30, 2021 was $114.9 million ($1.85 per unit) compared to $106.9 million ($1.96 per unit) in the prior year period. The $8.0 million increase and $0.11 per unit decrease in AFFO is summarized below:
Q2 2021 YTD vs Q2 2020 YTD Change in AFFO |
Granite REIT 2021 Second Quarter Report 25
Additional details pertaining to the components of the change in AFFO are as follows:
| • | the $9.1 million increase in FFO, as noted previously; partially offset by |
| • | a $1.9 million decrease in AFFO from straight-line rent amortization primarily due to acquisition activity. |
Excluding the aforementioned refinancing costs of $4.5 million recognized in the six month period ended June 30, 2021, AFFO would be $119.4 million ($1.92 per unit).
| INVESTMENT PROPERTIES |
Granite’s investment properties consist of income-producing properties, properties under development and land held for development. Substantially all of the income-producing properties are for industrial use and can be categorized as (i) distribution/e-commerce (ii) industrial/warehouse (iii) flex/office or (iv) special purpose properties designed and built with specialized features and leased to Magna. Granite’s categorization of income-producing properties has been updated in 2021 to reflect how management characterizes its properties in light of Granite’s recent growth and transformation of its portfolio towards logistics, e-commerce and distribution/warehouse facilities.
The attributes of the income-producing properties are versatile and are based on the needs of the tenant such that an industrial property used by a certain tenant for light or heavy manufacturing can be used by another tenant for other industrial uses after some retrofitting if necessary. Accordingly, the investment property portfolio is substantially for industrial use and, as such, Granite determined that its asset class comprises industrial properties for purposes of financial reporting. The fair value of the industrial properties, as noted below, is based upon the current tenanting, existing use and attributes of such properties.
Properties under development are comprised of (i) 50.0 acre greenfield site in Houston, Texas for which speculative construction of the initial phase, consisting of two buildings totaling 0.7 million square feet, has begun and is expected to be completed in the second quarter of 2022, (ii) a 13.0 acre site in Altbach, Germany where construction of a distribution/light industrial facility is underway and is expected to be completed in the first quarter of 2022, (iii) 36.0 acre site in Fort Worth, Texas where vertical construction of a 0.6 million square foot, 36’ clear, state-of-the-art distribution/e-commerce facility commenced during the second quarter of 2021 with completion expected in the second quarter of 2022, and (iv) a 50.8 acre greenfield site acquired by Granite on June 30, 2021 in Murfreesboro, Tennessee, where vertical construction of a 0.8 square foot modern distribution facility will commence in the third quarter of 2021 with an expected completion date in the third quarter of 2022.
Land held for development comprises the remaining 141.0 acres of land in Houston, Texas held for the future development of up to a 2.5 million square foot multi-phased business park capable of accommodating buildings ranging from 0.3 million to 1.2 million square feet (of which 0.7 million square feet is planned in the initial phase of construction, as noted above), 12.9 acres of development land in West Jefferson, Ohio and a 16.0 acre parcel of land located in Wroclaw, Poland that could provide for approximately 0.3 million square feet of distribution-warehouse space.
26 Granite REIT 2021 Second Quarter Report
Summary attributes of the investment properties as at June 30, 2021 and December 31, 2020 are as follows:
Investment Properties Summary |
| As at June 30, 2021 and December 31, 2020 | 2021 | 2020 | ||||||
(in millions, except as noted) | ||||||||
Investment properties — fair value | $ | 6,396.6 | $ | 5,855.6 | ||||
Income-producing properties | 6,307.7 | 5,786.3 | ||||||
Properties under development | 61.0 | 31.5 | ||||||
Land held for development | 27.9 | 37.8 | ||||||
Overall capitalization rate(1) | 5.09% | 5.61% | ||||||
Number of investment properties | 118 | 115 | ||||||
Income-producing properties | 110 | 108 | ||||||
Properties under development | 5 | 3 | ||||||
Land held for development | 3 | 4 | ||||||
Property metrics | ||||||||
GLA, square feet | 51.3 | 49.5 | ||||||
Occupancy, by GLA | 99.3% | 99.6% | ||||||
Weighted average lease term in years, by square footage | 6.0 | 6.3 | ||||||
Total number of tenants | 89 | 86 | ||||||
Magna as a percentage of annualized revenue(2)(3) | 34% | 36% | ||||||
Magna as a percentage of GLA(3) | 26% | 27% | ||||||
| (1) | Overall capitalization rate pertains only to income-producing properties. |
| (2) | Annualized revenue for each period presented is calculated as rental revenue excluding tenant recoveries, recognized in accordance with IFRS, in the reported month multiplied by 12 months. |
| (3) | Subsequent to quarter end, the sale of Magna’s business operations in Obertshausen, Germany to Mutares SE & Co. KGaA was finalized. As a result of this change in tenant, Granite’s exposure to Magna is further reduced to 32% of Granite’s annualized revenue and 25% of Granite’s GLA. |
Granite REIT 2021 Second Quarter Report 27
Granite has a high-quality global portfolio of large-scale properties strategically located in Canada, the United States and Europe. The fair value of the investment properties by country as at June 30, 2021 and December 31, 2020 was as follows:
Fair Value of Investment Properties by Geography(1) |
The change in the fair value of investment properties by geography during the six months ended June 30, 2021 was as follows:
Change in Fair Value of Investment Properties by Geography
|
| January 1, 2021 | Acquisitions | Dispositions | Capital and leasing expenditures | Developments and expansion | Transfers(1) | Other | Fair value gains | Foreign Exchange | June 30, 2021 | |||||||||||||||||||||||||||||||
Income-Producing Properties | ||||||||||||||||||||||||||||||||||||||||
Canada | $ | 1,106.7 | $ | — | $ | — | $ | 0.4 | $ | 2.4 | $ | — | $ | 0.5 | $ | 174.6 | $ | — | $ | 1,284.6 | ||||||||||||||||||||
USA | 2,833.0 | 201.8 | — | (0.1 | ) | — | — | 4.2 | 270.8 | (76.0 | ) | 3,233.7 | ||||||||||||||||||||||||||||
Austria | 821.0 | — | (13.2 | ) | 0.2 | — | — | (2.5 | ) | 2.9 | (46.8 | ) | 761.6 | |||||||||||||||||||||||||||
Germany | 412.6 | — | — | 1.5 | — | — | (0.2 | ) | 14.9 | (23.4 | ) | 405.4 | ||||||||||||||||||||||||||||
Netherlands | 551.0 | — | — | 0.1 | (0.3 | ) | — | 0.5 | 49.7 | (32.1 | ) | 568.9 | ||||||||||||||||||||||||||||
Other Europe | 62.0 | — | (10.6 | ) | — | — | — | (0.1 | ) | 4.6 | (2.4 | ) | 53.5 | |||||||||||||||||||||||||||
| 5,786.3 | 201.8 | (23.8 | ) | 2.1 | 2.1 | — | 2.4 | 517.5 | (180.7 | ) | 6,307.7 | |||||||||||||||||||||||||||||
Properties Under Development | ||||||||||||||||||||||||||||||||||||||||
USA | 15.6 | 17.5 | — | — | 2.1 | 9.0 | — | — | (0.7 | ) | 43.5 | |||||||||||||||||||||||||||||
Germany | 15.9 | — | — | — | 2.7 | — | — | — | (1.1 | ) | 17.5 | |||||||||||||||||||||||||||||
| 31.5 | 17.5 | — | — | 4.8 | 9.0 | — | — | (1.8 | ) | 61.0 | ||||||||||||||||||||||||||||||
Land Held for Development | ||||||||||||||||||||||||||||||||||||||||
USA | 34.0 | — | — | — | — | (9.0 | ) | — | — | (0.7 | ) | 24.3 | ||||||||||||||||||||||||||||
Other Europe | 3.8 | — | — | — | — | — | — | — | (0.2 | ) | 3.6 | |||||||||||||||||||||||||||||
| 37.8 | — | — | — | — | (9.0 | ) | — | — | (0.9 | ) | 27.9 | |||||||||||||||||||||||||||||
Total | $ | 5,855.6 | $ | 219.3 | $ | (23.8 | ) | $ | 2.1 | $ | 6.9 | $ | — | $ | 2.4 | $ | 517.5 | $ | (183.4 | ) | $ | 6,396.6 | ||||||||||||||||||
| (1) | The transfer is related to the reclassification of a land held for development property in Fort Worth, Texas to property under development during the first quarter of 2021. |
28 Granite REIT 2021 Second Quarter Report
During the six months ended June 30, 2021, the fair value of investment properties increased by $541.0 million primarily due to:
| • | net fair value gains of $517.5 million which were attributable to various factors including fair market rent increases as well as compression in discount and terminal capitalization rates for properties located in the GTA and across the United States as well as for certain of the Trust’s modern warehouse properties in Europe; and |
| • | the acquisitions of four income-producing properties and a property under development in the United States for $218.4 million (see “SIGNIFICANT MATTERS — Property Acquisitions”); partially offset by |
| • | foreign exchange losses of $183.4 million resulting from the relative strengthening of the Canadian dollar against the US dollar and the Euro; and |
| • | the dispositions of two income-producing properties in the United Kingdom and Austria for $23.8 million (see “SIGNIFICANT MATTERS — Dispositions”). |
Fair values were primarily determined by discounting the expected future cash flows, generally over a term of 10 years, plus a terminal value based on the application of a capitalization rate to estimated year 11 cash flows. Granite measures its investment properties using valuations prepared by management. Granite does not measure its investment properties based on valuations prepared by external appraisers but uses such external appraisals as data points, together with other external market information accumulated by management, in arriving at its own conclusions on values. Management uses valuation assumptions such as discount rates, terminal capitalization rates and market rental rates applied in external appraisals or sourced from valuation experts; however, the Trust also uses its historical renewal experience with tenants, its direct knowledge of the specialized nature of Granite’s portfolio and tenant profile and its knowledge of the actual condition of the properties in making business judgments about lease renewal probabilities, renewal rents and capital expenditures. There has been no change in the valuation methodology used during the three and six months ended June 30, 2021. The key valuation metrics for Granite’s investment properties including the discount and terminal capitalization rates by jurisdiction are summarized in note 4 to the unaudited condensed combined financial statements for the three and six months ended June 30, 2021. In addition, valuation metrics for Granite’s income-producing properties by asset category and region as at June 30, 2021 and December 31, 2020 were as follows:
| Valuation Metrics by Asset Category | ||||||||||||||||||||
| As at June 30, 2021 and December 31, 2020 | Distribution/ E-Commerce | Industrial/ Warehouse | Special purpose properties | Flex/ Office | Total | |||||||||||||||||||||||||||||||||||
|
|
|
|
|
|
|
|
|
| |||||||||||||||||||||||||||||||
| 2021 | 2020 | 2021 | 2020 | 2021 | 2020 | 2021 | 2020 | 2021 | 2020 | |||||||||||||||||||||||||||||||
Overall capitalization rate(1)(2) | 4.54% | 4.97% | 5.15% | 5.79% | 7.25% | 7.71% | 5.63% | 6.02% | 5.09% | 5.61% | ||||||||||||||||||||||||||||||
Terminal capitalization rate(1) | 5.10% | 5.44% | 5.49% | 5.96% | 6.66% | 6.87% | 6.50% | 6.93% | 5.45% | 5.82% | ||||||||||||||||||||||||||||||
Discount rate(1) | 5.60% | 5.89% | 6.23% | 6.69% | 7.59% | 7.77% | 7.12% | 7.30% | 6.05% | 6.38% | ||||||||||||||||||||||||||||||
| (1) | Weighted based on income-producing property fair value. |
| (2) | Overall capitalization rate is calculated as stabilized net operating income (property revenue less property expenses) divided by the fair value of the property. |
Granite REIT 2021 Second Quarter Report 29
| Valuation Metrics by Region | ||||||||||||||||||||
| As at June 30, 2021 | Canada | USA | Austria | Germany | Nether- lands | Other Europe | Total | |||||||||||||||||||||
Income-producing property fair value | $ | 1,284.6 | $ | 3,233.7 | $ | 761.6 | $ | 405.4 | $ | 568.9 | $ | 53.5 | $ | 6,307.7 | ||||||||||||||
Weighted average capitalization rate(1) | 4.06% | 4.78% | 8.40% | 5.57% | 4.21% | 7.56% | 5.09% | |||||||||||||||||||||
| As at December 31, 2020 | Canada | USA | Austria | Germany | Nether- lands | Other Europe | Total | |||||||||||||||||||||
Income-producing property fair value | $ | 1,106.7 | $ | 2,833.0 | $ | 821.0 | $ | 412.6 | $ | 551.0 | $ | 62.0 | $ | 5,786.3 | ||||||||||||||
Weighted average capitalization rate(1) | 4.64% | 5.24% | 8.56% | 5.87% | 4.57% | 8.15% | 5.61% | |||||||||||||||||||||
| (1) | Weighted based on income-producing property fair value. |
A sensitivity analysis of the fair value of income-producing properties to changes in the overall capitalization rate, terminal capitalization rate and discount rate at June 30, 2021 is presented below:
Sensitivity Analysis of Fair Value of Income-Producing Properties | ||||||
| Rate sensitivity | Overall capitalization rate | Terminal capitalization rate | Discount rate | |||||||||
+50 bps | 5,703.3 | 5,961.3 | 6,068.5 | |||||||||
+25 bps | 5,989.4 | 6,126.5 | 6,186.8 | |||||||||
Base rate | $ | 6,307.7 | $ | 6,307.7 | $ | 6,307.7 | ||||||
-25 bps | 6,665.1 | 6,508.3 | 6,432.1 | |||||||||
-50 bps | 7,069.0 | 6,730.9 | 6,559.2 | |||||||||
Capital Expenditures and Leasing Costs
Capital expenditures relate to sustaining the existing earnings capacity of the property portfolio. Capital expenditures can include expansion or development expenditures and maintenance or improvement expenditures. Expansion or development capital expenditures are discretionary in nature and are incurred to generate new revenue streams and/or increase the productivity of a property. Maintenance or improvement capital expenditures relate to sustaining the existing earnings capacity of a property. Leasing costs include direct leasing costs and lease incentives. Direct leasing costs include broker commissions incurred in negotiating and arranging tenant leases. Lease incentives include the cost of leasehold improvements to tenant spaces and/or cash allowances provided to tenants for leasehold improvement costs.
30 Granite REIT 2021 Second Quarter Report
Included in total capital expenditure and leasing cost additions to investment properties are items which relate to the completion or lease up of recently acquired or developed properties. Such items are excluded from Granite’s calculation of AFFO. A reconciliation of total capital and leasing cost additions to investment properties to those included in AFFO for the three and six months ended June 30, 2021 and 2020 is below:
Maintenance Capital Expenditures and Leasing Costs | ||||
| Three Months Ended June 30, | Six Months Ended June 30, | |||||||||||||||||||
| 2021 | 2020 | 2021 | 2020 | |||||||||||||||||
Additions to investment properties: | ||||||||||||||||||||
Leasing costs | $ | 0.2 | $ | 2.0 | $ | 0.2 | $ | 2.0 | ||||||||||||
Tenant improvements(1) | 0.1 | — | 0.3 | — | ||||||||||||||||
Maintenance capital expenditures | 1.5 | 1.9 | 1.6 | 3.0 | ||||||||||||||||
Other capital expenditures | 1.7 | 4.3 | 2.1 | 6.6 | ||||||||||||||||
| $ | 3.5 | $ | 8.2 | $ | 4.2 | $ | 11.6 | |||||||||||||
Less: | ||||||||||||||||||||
Leasing costs related to acquisition activities | — | — | (0.1 | ) | — | |||||||||||||||
Leasing costs related to development activities | — | (2.0 | ) | — | (2.0 | ) | ||||||||||||||
Capital expenditures related to expansions | (2.3 | ) | — | (2.4 | ) | — | ||||||||||||||
Capital expenditures related to property acquisitions | 0.5 | (4.2 | ) | 0.6 | (6.5 | ) | ||||||||||||||
Capital expenditures and leasing costs included in AFFO | $ | 1.7 | $ | 2.0 | $ | 2.3 | $ | 3.1 | ||||||||||||
| (1) | Tenant improvements include tenant allowances and landlord’s work. |
The capital expenditures and leasing costs incurred by quarter for the trailing eight quarters were as follows:
Capital Expenditures and Leasing Costs — Trailing Eight Quarters |
| Q2’21 | Q1’21 | Q4’20 | Q3’20 | Q2’20 | Q1’20 | Q4’19 | Q3’19 | |||||||||||||||||||||||||||
Total capital expenditures incurred | $ | 3.2 | $ | 0.7 | $ | 13.3 | $ | 2.2 | $ | 6.2 | $ | 3.4 | $ | 1.0 | $ | 1.5 | ||||||||||||||||||
Total leasing costs incurred | 0.3 | — | 2.1 | 1.2 | 2.0 | — | 0.8 | 0.2 | ||||||||||||||||||||||||||
Total incurred | [A] | $ | 3.5 | $ | 0.7 | $ | 15.4 | $ | 3.4 | $ | 8.2 | $ | 3.4 | $ | 1.8 | $ | 1.7 | |||||||||||||||||
Less: Capital expenditures and leasing costs related to acquisitions and developments | (1.8 | ) | (0.1 | ) | (13.1 | ) | (2.6 | ) | (6.1 | ) | (2.4 | ) | (0.2 | ) | (0.1 | ) | ||||||||||||||||||
Capital expenditures and leasing costs included in AFFO | [B] | $ | 1.7 | $ | 0.6 | $ | 2.3 | $ | 0.8 | $ | 2.1 | $ | 1.0 | $ | 1.6 | $ | 1.6 | |||||||||||||||||
GLA, square feet | [C] | 51.3 | 50.4 | 49.5 | 45.4 | 44.3 | 40.0 | 40.0 | 34.9 | |||||||||||||||||||||||||
$ total incurred per square feet | [A]/[C] | $ | 0.07 | $ | 0.01 | $ | 0.31 | $ | 0.07 | $ | 0.19 | $ | 0.09 | $ | 0.05 | $ | 0.05 | |||||||||||||||||
$ capital expenditures and leasing costs included in AFFO per square feet | [B]/[C] | $ | 0.03 | $ | 0.01 | $ | 0.05 | $ | 0.02 | $ | 0.05 | $ | 0.03 | $ | 0.04 | $ | 0.05 | |||||||||||||||||
Granite REIT 2021 Second Quarter Report 31
Development and Expansion Projects
The attributes of Granite’s properties under development and expansion projects as at June 30, 2021 were as follows:
Development and Expansion Projects |
Land (in acres) | Expected sq (in millions) | Target/ actual start date of construction | Target completion date | Actual construction | Expected total construction cost(1) | |||||||||||||||||||
As at June 30, 2021 | ||||||||||||||||||||||||
Properties under development | ||||||||||||||||||||||||
Houston, Texas (Phase 1 only) | 50.0 | 0.7 | Q4 2019 | Q2 2022 | $ | 7.4 | $ | 40.2 | ||||||||||||||||
Fort Worth, Texas | 36.0 | 0.6 | Q2 2021 | Q2 2022 | 2.0 | 43.1 | ||||||||||||||||||
Altbach, Germany | 13.0 | 0.3 | Q1 2021 | Q1 2022 | 6.7 | 32.4 | ||||||||||||||||||
Murfreesboro, Tennessee | 50.8 | 0.8 | Q3 2021 | Q3 2022 | — | 64.7 | ||||||||||||||||||
Expansion project | ||||||||||||||||||||||||
2095 Logistics Drive, Mississauga, Ontario | 9.0 | 0.1 | Q4 2019 | Q1 2022 | 2.6 | 11.0 | ||||||||||||||||||
555 Beck Cres., Ajax, Ontario | 7.6 | — | Q2 2021 | Q4 2022 | 0.2 | 8.5 | ||||||||||||||||||
| 166.4 | 2.5 | $ | 18.9 | $ | 199.9 | |||||||||||||||||||
| (1) | Construction cost excludes cost of land. |
At Granite’s greenfield site in Houston, Texas, speculative construction of the initial phase, consisting of two state-of-the-art distribution/e-commerce buildings totaling 668,740 square feet is underway. Granite anticipates commencement of vertical construction in the third quarter of 2021, with completion expected in the second quarter of 2022.
At Granite’s site in Fort Worth Texas, vertical construction commenced during the second quarter of 2021. This speculative 605,498 square foot, 36’ clear, state-of-the-art distribution/e-commerce facility is expected to be completed in the second quarter of 2022.
Vertical construction and pre-leasing activities continued during the second quarter of 2021 for the construction of a distribution/light industrial facility in Altbach, Germany. The property will be situated on approximately 13 acres and comprises a total leasable area of approximately 290,000 square feet. This project is scheduled to be completed in the first quarter of 2022.
On June 30, 2021, Granite acquired on a forward-funding basis, a 844,480 square foot modern distribution facility to be constructed on a 50.8 acre greenfield site in Murfreesboro, Tennessee. The building will include cross-dock configuration, 40’ clear height, LED lighting and other sustainable design features. Vertical construction is expected to commence in the third quarter 2021 and with an estimated completion date in the third quarter of 2022.
Vertical construction of the temperature controlled building expansion of approximately 60,000 square feet at its property at 2095 Logistics Drive in Mississauga, Ontario, has commenced and is expected to be completed by the first quarter of 2022.
In the second quarter, Granite advanced site planning for the speculative expansion of 555 Beck Crescent in Ajax, Ontario. The property has direct access and frontage to highway 401 and the modern expansion will feature, 32’ clear height, LED lighting and other sustainable design features. Vertical construction of the 48,911 square foot expansion is expected to commence later this year with completion anticipated by the end of 2022.
32 Granite REIT 2021 Second Quarter Report
Leasing Profile
Magna, Granite’s Largest Tenant
At June 30, 2021, Magna International Inc. or one of its operating subsidiaries was the tenant at 31 (December 31, 2020 — 32) of Granite’s income-producing properties and comprised 34% (December 31, 2020 — 36%) of Granite’s annualized revenue and 26% (December 31, 2020 — 27%) of Granite’s GLA. Subsequent to quarter end, the sale of Magna’s business operations in Obertshausen, Germany to Mutares SE & Co. KGaA was finalized. As a result of this change in tenant, Granite’s exposure to Magna is further reduced to 32% of Granite’s annualized revenue and 25% of Granite’s GLA.
On June 18, 2021, Moody’s Investor Service, Inc. (“Moody’s”) confirmed Magna International Inc.’s credit rating of A3 and changed the trend to “Stable Outlook” from “Negative Outlook”. On July 6, 2021, DBRS confirmed the A(low) credit rating and changed the trend to “Stable Outlook” from “Negative Outlook”. On July 21, 2021, Standard & Poor’s confirmed the A- credit rating and changed the trend to “Stable Outlook” from “Negative Outlook”. Magna is a global mobility technology company with complete vehicle engineering and contract manufacturing expertise. Magna’s product capabilities include body, chassis, exteriors, seating, powertrain, active driver assistance, electronics, mechatronics, mirrors, lighting and roof systems.
Granite’s relationship with Magna is an arm’s length landlord and tenant relationship governed by the terms of Granite’s leases. Granite’s properties are generally leased to operating subsidiaries of Magna International Inc. and are not guaranteed by the parent company; however, Magna International Inc. is the tenant under certain of Granite’s leases. The terms of the lease arrangements with Magna generally provide for the following:
| • | the obligation of Magna to pay for costs of occupancy, including operating costs, property taxes and maintenance and repair costs; |
| • | rent escalations based on either fixed-rate steps or inflation; |
| • | renewal options tied to market rental rates or inflation; |
| • | environmental indemnities from the tenant; and |
| • | a right of first refusal in favour of Magna on the sale of a property. |
Renewal terms, rates and conditions are typically set out in Granite’s leases with Magna and form the basis for tenancies that continue beyond the expiries of the initial lease terms.
According to its public disclosure, Magna’s success is primarily dependent upon the levels of North American, European and Chinese car and light truck production by Magna’s customers. Granite expects Magna to continuously seek to optimize its global manufacturing footprint and consequently, Magna may or may not renew leases for facilities currently under lease at their expiries.
Granite REIT 2021 Second Quarter Report 33
Other Tenants
In addition to Magna, at June 30, 2021, Granite had 88 other tenants from various industries that in aggregate comprised 66% of the Trust’s annualized revenue. Each of these tenants accounted for less than 7% of the Trust’s annualized revenue as at June 30, 2021.
Granite’s top 10 tenants by annualized revenue at June 30, 2021 are summarized in the table below:
Top 10 Tenants Summary |
| Tenant | Annualized Revenue % | GLA% | WALT (years) | Credit Rating(1)(2) | ||||||||||
Magna | 34% | 26% | 4.3 | A- | ||||||||||
Amazon | 6% | 5% | 17.7 | AA | ||||||||||
True Value Company | 3% | 3% | 19.7 | NR | ||||||||||
ADESA | 2% | —% | 8.1 | NR | ||||||||||
Restoration Hardware | 2% | 2% | 6.8 | NR | ||||||||||
Hanon Systems | 2% | 1% | 8.2 | BBB | ||||||||||
Spreetail FTP | 2% | 2% | 5.3 | NR | ||||||||||
Ingram Micro | 2% | 2% | 3.5 | BB- | ||||||||||
Wayfair | 2% | 2% | 4.3 | NR | ||||||||||
Cornerstone Brands | 2% | 2% | 3.3 | B+ | ||||||||||
Top 10 Tenants | 57% | 45% | 6.8 | |||||||||||
| (1) | Credit rating is quoted on the Standard & Poor’s equivalent rating scale where publicly available. NR refers to Not Rated. |
| (2) | The credit rating indicated may, in some instances, apply to an affiliated company of Granite’s tenant which may not be the guarantor of the lease. |
34 Granite REIT 2021 Second Quarter Report
Lease Expiration
As at June 30, 2021, Granite’s portfolio had a weighted average lease term by square footage of 6.0 years (December 31, 2020 — 6.3 years) with lease expiries by GLA (in thousands of square feet) and any lease renewals committed adjusted accordingly, lease count and annualized revenue (calculated as rental revenue excluding tenant recoveries, recognized in accordance with IFRS, in June 2021 multiplied by 12 months, in millions) as set out in the table below:
Lease Maturity Summary |
Total | Total | Total | Vacancies | 2021 | 2022 | 2023 | 2024 | 2025 | 2026 | 2027 and Beyond | ||||||||||||||||||||||||||||||||||||||||||||||||||||||||||||||||||||||||||||||||||||||||||
| Country | Sq Ft | Sq Ft | Annualized Revenue $ | Sq Ft | Annualized Revenue $ | Sq Ft | Annualized Revenue $ | Sq Ft | Annualized Revenue $ | Sq Ft | Annualized Revenue $ | Sq Ft | Annualized Revenue $ | Sq Ft | Annualized Revenue $ | |||||||||||||||||||||||||||||||||||||||||||||||||||||||||||||||||||||||||||||||||||||
Canada | 5,891 | 30 | 53.0 | — | 316 | 2.6 | 347 | 2.9 | 380 | 2.3 | 642 | 5.4 | 1,449 | 11.5 | 258 | 2.3 | 2,499 | 26.0 | ||||||||||||||||||||||||||||||||||||||||||||||||||||||||||||||||||||||||||||||||||
Canada-committed | — | — | 0.3 | — | (316 | ) | (2.6 | ) | — | — | — | — | — | — | — | — | 316 | 2.9 | — | — | ||||||||||||||||||||||||||||||||||||||||||||||||||||||||||||||||||||||||||||||||
Canada — net | 5,891 | 30 | 53.3 | — | — | — | 347 | 2.9 | 380 | 2.3 | 642 | 5.4 | 1,449 | 11.5 | 574 | 5.2 | 2,499 | 26.0 | ||||||||||||||||||||||||||||||||||||||||||||||||||||||||||||||||||||||||||||||||||
United States | 29,624 | 64 | 160.1 | 341 | 679 | 11.5 | 4,036 | 19.1 | 4,689 | 21.3 | 2,822 | 13.9 | 1,309 | 6.4 | 2,562 | 13.1 | 13,186 | 74.8 | ||||||||||||||||||||||||||||||||||||||||||||||||||||||||||||||||||||||||||||||||||
United States-committed | — | — | — | — | (679 | ) | (11.5 | ) | (647 | ) | (2.9 | ) | — | — | 346 | 1.7 | — | — | 87 | 0.7 | 893 | 12.0 | ||||||||||||||||||||||||||||||||||||||||||||||||||||||||||||||||||||||||||||||
United States — net | 29,624 | 64 | 160.1 | 341 | — | — | 3,389 | 16.2 | 4,689 | 21.3 | 3,168 | 15.6 | 1,309 | 6.4 | 2,649 | 13.8 | 14,079 | 86.8 | ||||||||||||||||||||||||||||||||||||||||||||||||||||||||||||||||||||||||||||||||||
Austria | 7,889 | 10 | 61.9 | — | 389 | 3.0 | 802 | 9.9 | 125 | 1.2 | 5,349 | 37.5 | — | — | — | — | 1,224 | 10.3 | ||||||||||||||||||||||||||||||||||||||||||||||||||||||||||||||||||||||||||||||||||
Austria-committed | — | — | — | — | (389 | ) | (3.0 | ) | — | — | — | — | — | — | — | — | 389 | 3.0 | — | — | ||||||||||||||||||||||||||||||||||||||||||||||||||||||||||||||||||||||||||||||||
Austria-net | 7,889 | 10 | 61.9 | — | — | — | 802 | 9.9 | 125 | 1.2 | 5,349 | 37.5 | — | — | 389 | 3.0 | 1,224 | 10.3 | ||||||||||||||||||||||||||||||||||||||||||||||||||||||||||||||||||||||||||||||||||
Germany | 3,504 | 11 | 24.2 | — | 548 | 3.5 | 283 | 2.2 | 1,947 | 13.7 | — | — | 195 | 1.5 | 303 | 1.6 | 228 | 1.7 | ||||||||||||||||||||||||||||||||||||||||||||||||||||||||||||||||||||||||||||||||||
Germany-committed | — | — | — | — | (428 | ) | (2.8 | ) | (283 | ) | (2.2 | ) | 120 | 0.7 | 308 | 2.1 | — | — | — | — | 283 | 2.2 | ||||||||||||||||||||||||||||||||||||||||||||||||||||||||||||||||||||||||||||||
Germany-net | 3,504 | 11 | 24.2 | — | 120 | 0.7 | — | — | 2,067 | 14.4 | 308 | 2.1 | 195 | 1.5 | 303 | 1.6 | 511 | 3.9 | ||||||||||||||||||||||||||||||||||||||||||||||||||||||||||||||||||||||||||||||||||
Netherlands | 3,810 | 12 | 26.0 | — | — | — | — | — | 314 | 2.2 | — | — | 630 | 4.9 | 355 | 1.6 | 2,511 | 17.3 | ||||||||||||||||||||||||||||||||||||||||||||||||||||||||||||||||||||||||||||||||||
Europe Other | 571 | 5 | 4.2 | 30 | 336 | 3.1 | 101 | 0.6 | 104 | 0.5 | — | — | — | — | �� | — | — | — | — | |||||||||||||||||||||||||||||||||||||||||||||||||||||||||||||||||||||||||||||||||
Europe Other committed | — | — | — | — | (336 | ) | (3.1 | ) | — | — | 37 | 0.3 | — | — | — | — | 299 | 2.8 | — | — | ||||||||||||||||||||||||||||||||||||||||||||||||||||||||||||||||||||||||||||||||
Europe Other- net | 571 | 5 | 4.2 | 30 | — | — | 101 | 0.6 | 141 | 0.8 | — | — | — | — | 299 | 2.8 | — | — | ||||||||||||||||||||||||||||||||||||||||||||||||||||||||||||||||||||||||||||||||||
Total | 51,289 | 132 | 329.4 | 371 | 2,268 | 23.7 | 5,569 | 34.7 | 7,559 | 41.2 | 8,813 | 56.8 | 3,583 | 24.3 | 3,478 | 18.6 | 19,648 | 130.1 | ||||||||||||||||||||||||||||||||||||||||||||||||||||||||||||||||||||||||||||||||||
Total-committed | — | — | 0.3 | — | (2,148 | ) | (23.0 | ) | (930 | ) | (5.1 | ) | 157 | 1.0 | 654 | 3.8 | — | — | 1,091 | 9.4 | 1,176 | 14.2 | ||||||||||||||||||||||||||||||||||||||||||||||||||||||||||||||||||||||||||||||
As at June 30, 2021 | 51,289 | 132 | 329.7 | 371 | 120 | 0.7 | 4,639 | 29.6 | 7,716 | 42.2 | 9,467 | 60.6 | 3,583 | 24.3 | 4,569 | 28.0 | 20,824 | 144.3 | ||||||||||||||||||||||||||||||||||||||||||||||||||||||||||||||||||||||||||||||||||
% of portfolio as at June 30, 2021: |
| |||||||||||||||||||||||||||||||||||||||||||||||||||||||||||||||||||||||||||||||||||||||||||||||||||
* by sq ft | 100% | 0.7% | 0.3% | 9.0% | 15.0% | 18.5% | 7.0% | 8.9% | 40.6% | |||||||||||||||||||||||||||||||||||||||||||||||||||||||||||||||||||||||||||||||||||||||||||
* by Annualized Revenue | 100% | 0.2% | 9.0% | 12.8% | 18.4% | 7.4% | 8.5% | 43.7% | ||||||||||||||||||||||||||||||||||||||||||||||||||||||||||||||||||||||||||||||||||||||||||||
Granite REIT 2021 Second Quarter Report 35
Occupancy Roll Forward
The table below provides a summary of occupancy changes during the three and six months ended June 30, 2021.
Occupancy Roll Forward for Q2 2021 |
| Three Months Ended June 30, 2021 | ||||||||||||||||||||||||||||
| (in thousands, sq ft, except as noted) | Canada | USA | Austria | Germany | Netherlands | Europe - Other | Total | |||||||||||||||||||||
Total portfolio size, April 1, 2021 | 5,891 | 28,533 | 8,101 | 3,504 | 3,808 | 572 | 50,409 | |||||||||||||||||||||
Vacancy, April 1, 2021 | — | (341 | ) | — | — | — | (29) | (370 | ) | |||||||||||||||||||
Occupancy, April 1, 2021 | 5,891 | 28,192 | 8,101 | 3,504 | 3,808 | 543 | 50,039 | |||||||||||||||||||||
Occupancy %, April 1, 2021 | 100.0% | 98.8% | 100.0% | 100.0% | 100.0% | 94.9% | 99.3% | |||||||||||||||||||||
Acquired occupancy, net | — | 1,093 | — | — | — | — | 1,093 | |||||||||||||||||||||
Dispositions | — | — | (212) | — | — | — | (212) | |||||||||||||||||||||
Expiries | (201) | (450) | (88) | (428) | — | (37) | (1,204) | |||||||||||||||||||||
Renewals | 201 | 87 | 88 | 428 | — | 37 | 841 | |||||||||||||||||||||
New Leases | — | 363 | — | — | — | — | 363 | |||||||||||||||||||||
Occupancy, June 30, 2021 | 5,891 | 29,285 | 7,889 | 3,504 | 3,808 | 543 | 50,920 | |||||||||||||||||||||
Total portfolio size, June 30, 2021 | 5,891 | 29,626 | 7,889 | 3,504 | 3,808 | 571 | 51,289 | |||||||||||||||||||||
Occupancy %, June 30, 2021 | 100.0% | 98.8% | 100.0% | 100.0% | 100.0% | 95.1% | 99.3% | |||||||||||||||||||||
Occupancy Roll Forward for Q2 2021 YTD |
| Six Months Ended June 30, 2021 | ||||||||||||||||||||||||||||
| (in thousands, sq ft, except as noted) | Canada | USA | Austria | Germany | Netherlands | Europe - Other | Total | |||||||||||||||||||||
Total portfolio size, January 1, 2021 | 5,891 | 27,521 | 8,101 | 3,504 | 3,808 | 662 | 49,487 | |||||||||||||||||||||
Vacancy, January 1, 2021 | — | (90 | ) | — | — | — | (29) | (119 | ) | |||||||||||||||||||
Occupancy, January 1, 2021 | 5,891 | 27,431 | 8,101 | 3,504 | 3,808 | 633 | 49,368 | |||||||||||||||||||||
Occupancy %, January 1, 2021 | 100.0% | 99.7% | 100.0% | 100.0% | 100.0% | 95.6% | 99.8% | |||||||||||||||||||||
Acquired occupancy | — | 1,854 | — | — | — | — | 1,854 | |||||||||||||||||||||
Dispositions | — | — | (212) | — | — | (90) | (302) | |||||||||||||||||||||
Expiries | (201) | (679) | (389) | (428) | — | (37) | (1,734) | |||||||||||||||||||||
Renewals | 201 | 316 | 389 | 428 | — | 37 | 1,371 | |||||||||||||||||||||
New Leases | — | 363 | — | — | — | — | 363 | |||||||||||||||||||||
Occupancy, June 30, 2021 | 5,891 | 29,285 | 7,889 | 3,504 | 3,808 | 543 | 50,920 | |||||||||||||||||||||
Total portfolio size, June 30, 2021 | 5,891 | 29,626 | 7,889 | 3,504 | 3,808 | 571 | 51,289 | |||||||||||||||||||||
Occupancy %, June 30, 2021 | 100.0% | 98.8% | 100.0% | 100.0% | 100.0% | 95.1% | 99.3% | |||||||||||||||||||||
36 Granite REIT 2021 Second Quarter Report
| LIQUIDITY AND CAPITAL RESOURCES |
Liquidity
Granite has various sources of available liquidity including cash, cash equivalents and the unused portion of its unsecured credit facility that aggregated to $1,676.1 million as at June 30, 2021 compared to $1,330.3 million at December 31, 2020, as summarized below:
Sources of Available Liquidity
| ||||
| As at June 30, 2021 and December 31, 2020 | 2021 | 2020 | ||||||
Cash and cash equivalents | $ | 678.1 |
| $ | 831.3 |
| ||
Unused portion of credit facility |
| 998.0 |
| 499.0 | ||||
Available liquidity | $ | 1,676.1 |
| $ | 1,330.3 |
| ||
Additional sources of liquidity: | ||||||||
Unencumbered assets(1) | $ | 6,396.6 |
| $ | 5,855.6 |
| ||
| (1) | Unencumbered assets represent the carrying value of investment properties (excluding any assets held for sale) that are not encumbered by secured debt. Granite can seek to obtain secured financing against its unencumbered assets subject to certain restrictions and financial covenant limitations in its credit facility, term loan agreements and trust indentures. |
The increase in liquidity is primarily due to the amendment made to the existing unsecured credit facility on March 31, 2021 resulting in an additional borrowing capacity of $500 million and the net proceeds of $303.1 million from the equity offering completed on June 9, 2021, partially offset by the redemption of the 2021 Debentures of $254.0 million on January 4, 2021 as well as the settlement of the related 2021 Cross-Currency Interest Rate Swap of $18.8 million and $133.4 million relating to the acquisitions of four income-producing properties and a parcel of development land in the United States. Granite intends to use and has partially used the net proceeds of debenture and equity offerings completed in 2020 and 2021 to fund completed and potential acquisitions of properties, to repay debt and to finance or refinance expenditures associated with Eligible Green Projects (as describ
ed in the Granite Green Bond Framework, which is available on Granite’s website), for commitments under existing development projects and for general trust purposes.
Management believes that the Trust’s cash resources, cash flow from operations and available third-party borrowings will be sufficient to finance its operations and capital expenditures program over the next year as well as to pay distributions. Granite expects to fund its ongoing operations and future growth through the use of (i) existing cash and cash equivalents, (ii) cash flows from operating activities, (iii) cash flows from asset sales, (iv) short-term financing available from the credit facility, (v) the issuance of unsecured debentures or equity, subject to market conditions and/or, if necessary, (vi) financing that may be obtained on its unencumbered assets. For information about the impact of COVID-19 on Granite’s liquidity, please see “SIGNIFICANT MATTERS — COVID-19 Pandemic”.
Granite REIT 2021 Second Quarter Report 37
Cash Flow Components
Components of the Trust’s cash flows were as follows:
Cash Flow Components Summary
|
Three Months Ended June 30, | Six Months Ended June 30, | |||||||||||||||||||||||
| 2021 | 2020 | $ change | 2021 | 2020 | $ change | |||||||||||||||||||
Cash and cash equivalents, beginning of period | $ | 480.7 | $ | 242.1 | 238.6 | $ | 831.3 | $ | 298.7 | 532.6 | ||||||||||||||
Cash provided by operating activities | 64.7 | 65.2 | (0.5 | ) | 129.0 | 120.0 | 9.0 | |||||||||||||||||
Cash (used in) provided by investing activities | (128.1 | ) | (427.4 | ) | 299.3 | (216.7 | ) | (480.5 | ) | 263.8 | ||||||||||||||
Cash provided by (used in) financing activities | 256.5 | 736.0 | (479.5 | ) | (65.6 | ) | 671.6 | (737.2 | ) | |||||||||||||||
Effect of exchange rate changes on cash and cash equivalents | 4.3 | 1.3 | 3.0 | 0.1 | 7.4 | (7.3 | ) | |||||||||||||||||
Cash and cash equivalents, end of period | $ | 678.1 | $ | 617.2 | 60.9 | $ | 678.1 | $ | 617.2 | 60.9 | ||||||||||||||
Operating Activities
During the three month period ended June 30, 2021, operating activities generated cash of $64.7 million compared to $65.2 million in the prior year period. The decrease of $0.5 million was due to various factors as noted in the “RESULTS OF OPERATIONS” section including, among others, the following:
| • | an increase in net operating income of $9.1 million; and |
| • | an increase in foreign exchange gains of $1.1 million; partially offset by |
| • | a decrease of $8.7 million from cash provided by working capital changes primarily due to a decrease in accounts payable and increase in accounts receivable due to timing of payments and receipts; |
| • | an increase of $1.6 million of interest paid; and |
| • | an increase of $0.4 million in income taxes paid. |
During the six month period ended June 30, 2021, operating activities generated cash of $129.0 million compared to $120.0 million in the prior year period. The increase of $9.0 million was due to various factors as noted in the “RESULTS OF OPERATIONS” section including, among others, the following:
| • | an increase in net operating income of $22.8 million; partially offset by |
| • | a decrease of $6.7 million from cash provided by working capital changes primarily due to a decrease in accounts payable and increase in accounts receivable due to timing of payments and receipts; |
| • | an increase in general and administrative expenses of $2.5 million; |
| • | an increase of $2.1 million of interest paid; and |
| • | an increase of $1.8 million in income taxes paid. |
38 Granite REIT 2021 Second Quarter Report
Investing Activities
Investing activities for the three month period ended June 30, 2021 used cash of $128.1 million and primarily related to the following:
| • | the acquisitions of three income-producing properties and a parcel of development land in the United States for $133.4 million including acquisition costs of $0.5 million (see “SIGNIFICANT MATTERS — Property Acquisitions”); and |
| • | additions to properties under development of $4.9 million, primarily attributable to Granite’s development in Altbach, Germany; partially offset by |
| • | net proceeds of $12.8 million received from the disposition of an income-producing property in Austria. |
Investing activities for the three month period ended June 30, 2020 used cash of $427.4 million and primarily related to the following:
| • | the acquisitions of eight income-producing properties in the United States and the Netherlands and a parcel of development land in the United States for $331.8 million; |
| • | acquisition deposits of $72.5 million consisting of advance payments to acquire an income-producing property located in the state of Ohio and two state-of-the-art facilities in the Netherlands; and |
| • | investment property expansion capital expenditures paid of $21.8 million relating to four properties under construction in Indiana and Texas, United States and as well as Bleiswijk, Netherlands and Altbach, Germany and maintenance and improvement capital expenditures of $1.1 million largely relating to capital expenditure at properties in Canada and the United States. |
Investing activities for the six month period ended June 30, 2021 used cash of $216.7 million and primarily related to the following:
| • | the acquisitions of four income-producing properties and a parcel of development land in the United States for $219.3 million including acquisition costs of $0.9 million (see “SIGNIFICANT MATTERS — Property Acquisitions”); and |
| • | additions to properties under development of $17.3 million, primarily attributable to Granite’s development in Altbach, Germany and Fort Worth, Texas; partially offset by |
| • | net proceeds of $23.2 million received from the disposition of two income-producing properties in the United Kingdom and Austria. |
Investing activities for the six months ended June 30, 2020 used cash of $480.5 million and primarily related to the following:
| • | the acquisitions of eight income-producing properties in the United States and the Netherlands, a property under development in Bleiswijk, Netherlands and a parcel of development land in the United States for $360.8 million and the associated transaction cost of $1.9 million; |
| • | acquisition deposits of $89.9 million consisting of advance payments to acquire an income-producing property located in Ohio, United States and two properties in the Netherlands as noted above; and |
Granite REIT 2021 Second Quarter Report 39
| • | investment property expansion capital expenditures paid of $25.6 million substantially relating to four properties under construction in Indiana and Texas, United States and as well as Bleiswijk, Netherlands and Altbach, Germany and maintenance and improvement capital expenditures paid of $3.3 million largely relating to improvement projects at properties located in Canada and the United States. |
Financing Activities
Cash provided by financing activities for the three month period ended June 30, 2021 of $256.5 million largely comprised $303.1 million of proceeds from the stapled unit offering completed on June 9, 2021, net of issuance costs, partially offset by $46.3 million of monthly distribution payments.
Cash provided by financing activities for the three month period ended June 20, 2020 of $736.0 million largely comprised $497.9 million of proceeds from the senior unsecured debentures issued on June 4, 2020, net of issuance costs and $277.5 million of proceeds from the stapled unit offering completed on June 2, 2020, net of issuance costs, partially offset by $38.9 million of distribution payments.
Cash used by financing activities for the six month period ended June 30, 2021 of $65.6 million largely comprised $254.0 million relating to the redemption of the 2021 Debentures, including early prepayment premium and settlement of the related 2021 Cross Currency Interest Rate Swap of $18.8 million, financing fees paid for the renewal of Granite’s credit facility of $2.9 million and $92.6 million of monthly distribution payments, partially offset by $303.1 million of net proceeds from the stapled unit offering completed on June 9, 2021.
Cash provided by financing activities for the six months ended June 30, 2020 of $671.6 million largely comprised $497.9 million of proceeds from the recent debenture offering, net of issuance costs and $277.5 million of proceeds from the stapled unit offering, net of issuance costs, partially offset by $78.1 million of distribution payments and $25.0 million relating to the repurchase of stapled units under the normal course issuer bid.
40 Granite REIT 2021 Second Quarter Report
Debt Structure
Granite’s debt structure and key debt metrics as at June 30, 2021 and December 31, 2020 were as follows:
Summary Debt Structure and Debt Metrics |
| As at June 30, 2021 and December 31, 2020 | 2021 | 2020 | ||||||||
Unsecured debt, net | $1,922.4 | $2,178.1 | ||||||||
Cross currency interest rate swaps, net(3) | (19.3 | ) | 85.6 | |||||||
Lease obligations | 32.9 | 33.8 | ||||||||
Total debt | [A] | $1,936.0 | $2,297.5 | |||||||
Less: cash and cash equivalents | 678.1 | 831.3 | ||||||||
Net debt | [B] | $1,257.9 | $1,466.2 | |||||||
Investment properties, all unencumbered by secured debt | [C] | $6,396.6 | $5,855.6 | |||||||
Trailing 12-month adjusted EBITDA(1) | [D] | $ 288.9 | $ 264.5 | |||||||
Interest expense | $ 50.8 | $ 35.8 | ||||||||
Interest income | (2.5 | ) | (2.4 | ) | ||||||
Trailing 12-month interest expense, net | [E] | $ 48.3 | $ 33.4 | |||||||
Debt metrics | ||||||||||
Leverage ratio(1) | [A]/[C] | 30% | 39% | |||||||
Net leverage ratio(1) | [B]/[C] | 20% | 25% | |||||||
Interest coverage ratio(1) | [D]/[E] | 6.0x | 7.9x | |||||||
Unencumbered asset coverage ratio(1) | [C]/[A] | 3.3x | 2.5x | |||||||
Indebtedness ratio(1) | [A]/[D] | 6.7x | 8.7x | |||||||
Weighted average cost of debt(2) | 1.74% | 1.91% | ||||||||
Weighted average debt term-to-maturity, in years(2) | 5.7 | 5.6 | ||||||||
Ratings and outlook | ||||||||||
DBRS | BBB (high) stable | BBB stable | ||||||||
Moody’s | Baa2 stable | Baa2 stable | ||||||||
| (1) | Represents a non-IFRS measure. For definitions of Granite’s non-IFRS measures, refer to the section “NON-IFRS PERFORMANCE MEASURES”. |
| (2) | Excludes lease obligations noted above. |
| (3) | Balance is net of the cross currency interest rate swap asset. |
Unsecured Debt and Cross Currency Interest Rate Swaps
2030 Debentures and Cross Currency Interest Rate Swap
On December 18, 2020, Granite LP issued $500.0 million aggregate principal amount of 2.378% Series 5 senior debentures due December 18, 2030 (the “2030 Debentures”). Interest on the 2030 Debentures is payable semi-annually in arrears on June 18 and December 18 of each year. At June 30, 2021, all of the 2030 Debentures remained outstanding and the balance, net of deferred financing costs, was $497.2 million.
On December 18, 2020, Granite entered into a cross currency interest rate swap (the “2030 Cross Currency Interest Rate Swap”) to exchange the 2.378% semi-annual interest payments from the 2030 Debentures for Euro denominated interest payments at a 1.045% fixed interest rate. In addition, under the terms of the 2030 Cross Currency Interest Rate Swap, the Trust will pay principal proceeds of €319.4 million in exchange for which it will receive $500.0 million on December 18, 2030. As at June 30, 2021, the fair value of the 2030 Cross Currency Interest Rate Swap was a net financial asset of $10.5 million.
Granite REIT 2021 Second Quarter Report 41
2027 Debentures and Cross Currency Interest Rate Swap
On June 4, 2020, Granite LP issued $500.0 million aggregate principal amount of 3.062% Series 4 senior debentures due June 4, 2027 (the “2027 Debentures”). Interest on the 2027 Debentures is payable semi-annually in arrears on June 4 and December 4 of each year. At June 30, 2021, all of the 2027 Debentures remained outstanding and the balance, net of deferred financing costs, was $497.4 million.
On June 4, 2020, Granite entered into a cross currency interest rate swap (the “2027 Cross Currency Interest Rate Swap”) to exchange the $500.0 million proceeds and the 3.062% semi-annual interest payments from the 2027 Debentures for US$370.3 million and US dollar denominated interest payments at a 2.964% fixed interest rate. In addition, under the terms of the 2030 Cross Currency Interest Rate Swap, the Trust will pay principal proceeds of US$370.3 million in exchange for which it will receive $500.0 million on June 4, 2027. As at June 30, 2021, the fair value of the 2027 Cross Currency Interest Rate Swap was a net financial asset of $38.3 million.
2026 Term Loan and Cross Currency Interest Rate Swap
On December 12, 2018, Granite LP entered into and fully drew down a $300.0 million senior unsecured non-revolving term facility that originally matured on December 12, 2025. On November 27, 2019, Granite refinanced the $300.0 million term facility and extended the maturity date one year to December 11, 2026 (the “2026 Term Loan”). The 2026 Term Loan is fully prepayable without penalty. Any amount repaid may not be re-borrowed. Interest on drawn amounts is calculated based on the Canadian Dollar Offered Rate (“CDOR”) plus an applicable margin determined by reference to the external credit rating of Granite LP and is payable monthly in advance. At June 30, 2021, the full $300.0 million remained outstanding and the balance, net of deferred financing costs and debt modification losses, was $299.6 million.
On December 12, 2018, Granite entered into a cross currency interest rate swap (the “2026 Cross Currency Interest Rate Swap”) to exchange the CDOR plus margin interest payments from the term loan that originally matured in 2025 for Euro denominated payments at a 2.202% fixed interest rate. As a result of the term loan extension on November 27, 2019, the previously existing cross currency interest rate swap was settled for $6.8 million and a new cross currency interest rate swap was entered into. The 2026 Cross Currency Interest Rate Swap exchanges the CDOR plus margin monthly interest payments from the 2026 Term Loan for Euro denominated payments at a 1.355% fixed interest rate. In addition, under the terms of the swap, the Trust will pay principal proceeds of €205.5 million in exchange for which it will receive $300.0 million on December 11, 2026. As at June 30, 2021, the fair value of the 2026 Cross Currency Interest Rate Swap was a net financial liability of $0.8 million.
2024 Term Loan and Cross Currency Interest Rate Swap
On December 19, 2018, Granite LP entered into and fully drew down a US$185.0 million senior unsecured non-revolving term facility that originally matured on December 19, 2022. On October 10, 2019, Granite refinanced the US$185.0 million term facility and extended the maturity date two years to December 19, 2024 (the “2024 Term Loan”). The 2024 Term Loan is fully prepayable without penalty. Any amount repaid may not be re-borrowed. Interest on drawn amounts is calculated based on LIBOR plus an applicable margin determined by reference to the external credit rating of Granite LP and is payable monthly in arrears. At June 30, 2021, the full US$185.0 million remained outstanding and the balance, net of deferred financing costs and debt modification losses, was $229.0 million.
42 Granite REIT 2021 Second Quarter Report
On December 19, 2018, Granite entered into a cross currency interest rate swap (the “2024 Cross Currency Interest Rate Swap”) to exchange the LIBOR plus margin interest payments from the term loan that originally matured in 2022 for Euro denominated payments at a 1.225% fixed interest rate. On September 24, 2019, in conjunction with the term loan refinancing, the Trust entered into a new cross currency interest rate swap (the “2024 Cross Currency Interest Rate Swap”). The 2024 Cross Currency Interest Rate Swap exchanges the LIBOR plus margin monthly interest payments from the 2024 Term Loan for Euro denominated payments at a 0.522% fixed interest rate. In addition, under the terms of the 2024 Cross Currency Interest Rate Swap, Granite will pay principal proceeds of €168.2 million in exchange for which it will receive US$185.0 million on December 19, 2024. As at June 30, 2021, the fair value of the 2024 Cross Currency Interest Rate Swap was a net financial liability of $16.3 million.
2023 Debentures and Cross Currency Interest Rate Swap
On December 20, 2016, Granite LP issued $400.0 million aggregate principal amount of 3.873% Series 3 senior debentures due November 30, 2023 (the “2023 Debentures”). Interest on the 2023 Debentures is payable semi-annually in arrears on May 30 and November 30 of each year. At June 30, 2021, all of the 2023 Debentures remained outstanding and the balance, net of deferred financing costs, was $399.2 million.
On December 20, 2016, Granite entered into a cross currency interest rate swap (the “2023 Cross Currency Interest Rate Swap”) to exchange the 3.873% interest payments from the 2023 Debentures for Euro denominated payments at a 2.43% fixed interest rate. Under the terms of the 2023 Cross Currency Interest Rate Swap, the Trust will pay principal proceeds of €281.1 million in exchange for which it will receive $400.0 million on November 30, 2023. As at June 30, 2021, the fair value of the 2023 Cross Currency Interest Rate Swap was a net financial liability of $12.4 million.
2021 Debentures and Cross Currency Interest Rate Swap
On January 4, 2021, Granite LP redeemed in full the outstanding $250.0 million aggregate principal amount of the 2021 Debentures for a total redemption price of $254.0 million, including early redemption premium. In conjunction with the redemption, the 2021 Cross Currency Interest Rate Swap was terminated on January 4, 2021 and the related mark to market liability of $18.8 million was settled.
The 2023 Debentures, the 2027 Debentures, the 2030 Debentures, the 2024 Term Loan and the 2026 Term Loan rank pari passu with all of the Trust’s other existing and future senior unsecured indebtedness and are guaranteed by Granite REIT and Granite GP. The fair values of the cross currency interest rate swaps are dependent upon a number of assumptions including the Euro exchange rate against the Canadian or US dollars, the US dollar exchange rate against the Canadian dollar and the Euro, and Canadian and US government benchmark interest rates.
Credit Facility
On March 31, 2021, the Trust amended its existing unsecured revolving credit facility agreement to extend the existing maturity date of February 1, 2023 to March 31, 2026. In addition, the credit facility’s limit increased from $0.5 billion to $1.0 billion. Draws on the credit facility are available by way of Canadian dollar, US dollar or Euro denominated loans or Canadian dollar or US dollar denominated letters of credit. Interest on drawn amounts is calculated based on an applicable margin determined by reference to the external credit rating of Granite REIT and Granite GP, as is a commitment fee in respect of undrawn amounts. As at June 30, 2021, the Trust had no amounts drawn from the credit facility and $1.7 million in letters of credit issued against the facility.
Granite REIT 2021 Second Quarter Report 43
Debt Metrics and Financial Covenants
Granite uses the debt metrics noted above to assess its borrowing capacity and the ability to meet its current and future financing obligations. At June 30, 2021, there were no significant changes in the debt ratios other than the decrease in the leverage and indebtedness ratios as a result of the full redemption of the 2021 Debentures and termination of the 2021 Cross Currency Interest Rate Swap on January 4, 2021. The debt ratios remain relatively favourable and provide financial flexibility for future growth.
Granite’s unsecured debentures, term loans and credit facility agreements contain financial and non-financial covenants that include maintaining certain leverage and debt service ratios. As at June 30, 2021, Granite was in compliance with all of these covenants.
Credit Ratings
On March 22, 2021, DBRS upgraded Granite LP’s Issuer Rating and credit rating on the 2023 Debentures, 2027 Debentures and 2030 Debentures to BBB(high) from BBB with stable trends. On March 12, 2021, Moody’s confirmed the Baa2 rating on the 2023 Debentures, 2027 Debentures and 2030 Debentures with a stable outlook. Credit ratings are intended to provide investors with an independent measure of credit quality of an issue of securities. A rating accorded to any security is not a recommendation to buy, sell or hold such securities and may be subject to revision or withdrawal at any time by the rating organization which granted such rating.
Unitholders’ Equity
Outstanding Stapled Units
As at August 4, 2021, the Trust had 65,684,484 stapled units issued and outstanding.
As at August 4, 2021, the Trust had 70,027 restricted stapled units (representing the right to receive 70,027 stapled units) and 77,060 performance stapled units (representing the right to receive a maximum of 154,120 stapled units) outstanding under the Trust’s Executive Deferred Stapled Unit Plan. The Executive Deferred Stapled Unit Plan is designed to provide equity-based compensation to employees of Granite who are, by the nature of their position or job, in a position to contribute to the success of Granite.
Distributions
Granite REIT’s monthly distribution to unitholders is currently 25.0 cents per stapled unit. For 2021, based on its current monthly rate, Granite expects to make total annual distributions of $3.00 per stapled unit. Monthly distributions declared to stapled unitholders in the three month periods ended June 30, 2021 and 2020 were $47.3 million or 75.0 cents per stapled unit and $39.9 million or 72.6 cents per stapled unit, respectively. Total distributions declared to stapled unitholders in the six month periods ended June 30, 2021 and 2020 were $93.5 million or $1.50 per stapled unit and $79.1 million or $1.45 per stapled unit, respectively.
Distributions declared in July 2021 in the amount of $16.4 million or 25.0 cents per stapled unit will be paid on August 16, 2021.
44 Granite REIT 2021 Second Quarter Report
Pursuant to the requirement of National Policy 41-201, Income Trusts and Other Indirect Offerings (“NP 41-201”), the following table outlines the differences between cash flow from operating activities and cash distributions as well as the differences between net income and cash distributions, in accordance with the guidelines under NP 41-201.
Cash Flows from Operating Activities in Excess of Distributions Paid and Payable |
| Three Months Ended June 30, | Six Months Ended June 30, | |||||||||||||||||
| 2021 | 2020 | 2021 | 2020 | |||||||||||||||
Net income | $ | 317.0 | $ | 75.6 | $ | 547.3 | $ | 157.1 | ||||||||||
Cash flows provided by operating activities | 64.7 | 65.2 | 129.0 | 120.0 | ||||||||||||||
Monthly cash distributions paid and payable | (47.3 | ) | (39.9 | ) | (93.5 | ) | (79.1 | ) | ||||||||||
Cash flows from operating activities in excess of distributions paid and payable | $ | 17.4 | $ | 25.3 | $ | 35.5 | $ | 40.9 | ||||||||||
Monthly distributions for the three and six month periods ended June 30, 2021 and 2020 were funded with cash flows from operating activities.
Net income prepared in accordance with IFRS recognizes revenue and expenses at time intervals that do not necessarily match the receipt or payment of cash. Therefore, when establishing cash distributions to unitholders, consideration is given to factors such as FFO, AFFO, cash generated from and required for operating activities and forward-looking cash flow information, including forecasts and budgets. Management does not expect current or potential future commitments to replace or maintain its investment properties to adversely affect cash distributions.
Normal Course Issuer Bid
On May 19, 2021, Granite announced the acceptance by the Toronto Stock Exchange (“TSX”) of Granite’s Notice of Intention to Make a Normal Course Issuer Bid (“NCIB”). Pursuant to the NCIB, Granite proposes to purchase through the facilities of the TSX and any alternative trading system in Canada, from time to time and if considered advisable, up to an aggregate of 6,154,057 of Granite’s issued and outstanding stapled units. The NCIB commenced on May 21, 2021 and will conclude on the earlier of the date on which purchases under the bid have been completed and May 20, 2022. Pursuant to the policies of the TSX, daily purchases made by Granite through the TSX may not exceed 46,074 stapled units, subject to certain exceptions. Granite had entered into an automatic securities purchase plan with a broker in order to facilitate repurchases of the stapled units under the NCIB during specified blackout periods. Pursuant to a previous notice of intention to conduct a NCIB, Granite received approval from the TSX to purchase stapled units for the period May 21, 2020 to May 20, 2021.
During the six months ended June 30, 2021, there were no stapled unit repurchases under the NCIB. During the six months ended June 30, 2020, Granite repurchased 490,952 stapled units at an average stapled unit cost of $50.95 for total consideration of $25.0 million.
Granite REIT 2021 Second Quarter Report 45
| COMMITMENTS, CONTRACTUAL OBLIGATIONS, CONTINGENCIES AND OFF-BALANCE SHEET ARRANGEMENTS |
The Trust is subject to various legal proceedings and claims that arise in the ordinary course of business. Management believes that the final outcome of such matters will not have a material adverse effect on the financial position, results of operations or liquidity of the Trust. However, actual outcomes may differ from management’s expectations.
Off-balance sheet arrangements consist of outstanding letters of credit to support certain contractual obligations, property purchase commitments, construction and development project commitments and certain operating agreements. As at June 30, 2021, the Trust had $1.7 million in letters of credit outstanding. Additionally, at June 30, 2021, the Trust’s contractual commitments totaled $182.1 million comprised of construction and development projects of $117.4 million and the construction costs associated with a property under development in Murfreesboro, Tennessee of $64.7 million (US$52.2 million). Granite expects to fund these commitments over the next year through the use of cash on hand, cash from operations and/or Granite’s credit facility.
For further discussion of commitments, contractual obligations, contingencies and off-balance sheet arrangements, refer to notes 7, 9 and 17 to the unaudited condensed combined financial statements for the three and six months ended June 30, 2021.
| NON-IFRS PERFORMANCE MEASURES |
Funds from operations
FFO is a non-IFRS performance measure that is widely used by the real estate industry in evaluating the operating performance of real estate entities. Granite calculates FFO as net income attributable to stapled unitholders excluding fair value gains (losses) on investment properties and financial instruments, gains (losses) on sale of investment properties including the associated current income tax, deferred income taxes and certain other items, net of non-controlling interests in such items. The Trust’s determination of FFO follows the definition prescribed by the Real Estate Property Association of Canada (“REALPAC”) White Paper on Funds From Operations & Adjusted Funds From Operations for IFRS dated February 2019 and as subsequently amended (“White Paper”). Granite considers FFO to be a meaningful supplemental measure that can be used to determine the Trust’s ability to service debt, fund capital expenditures and provide distributions to stapled unitholders. FFO is reconciled to net income, which is the most directly comparable IFRS measure (see “RESULTS OF OPERATIONS — Funds From Operations and Adjusted Funds From Operations”). FFO should not be construed as an alternative to net income or cash flow generated from operating activities determined in accordance with IFRS.
Adjusted funds from operations
AFFO is a non-IFRS performance measure that is widely used by the real estate industry in evaluating the recurring economic earnings performance of real estate entities after considering certain costs associated with sustaining such earnings. Granite calculates AFFO as net income attributable to stapled unitholders including all adjustments used to calculate FFO and further adjusts for actual maintenance capital expenditures that are required to sustain Granite’s productive capacity, leasing costs such as leasing commissions and tenant allowances incurred and non-cash straight-line rent and tenant incentive amortization, net of non-controlling interests in such items. The Trust’s determination of AFFO follows the definition prescribed by REALPAC’s
46 Granite REIT 2021 Second Quarter Report
White Paper. Granite considers AFFO to be a meaningful supplemental measure that can be used to determine the Trust’s ability to service debt, fund expansion capital expenditures, fund property development and provide distributions to stapled unitholders after considering costs associated with sustaining operating earnings. AFFO is also reconciled to net income, which is the most directly comparable IFRS measure (see “RESULTS OF OPERATIONS — Funds From Operations and Adjusted Funds From Operations”). AFFO should not be construed as an alternative to net income or cash flow generated from operating activities determined in accordance with IFRS.
FFO and AFFO payout ratios
The FFO and AFFO payout ratios are calculated as monthly distributions, which exclude the special distribution, declared to unitholders divided by FFO and AFFO, respectively, in a period. FFO payout ratio and AFFO payout ratio may exclude revenue or expenses incurred during a period that can be a source of variance between periods. The FFO payout ratio and AFFO payout ratio are supplemental measures widely used by analysts and investors in evaluating the sustainability of the Trust’s monthly distributions to stapled unitholders.
FFO and AFFO Payout Ratios |
| Three Months Ended June 30, | Six Months Ended June 30, | |||||||||||||||||
| 2021 | 2020 | 2021 | 2020 | |||||||||||||||
(in millions, except as noted) | ||||||||||||||||||
Monthly distributions declared to unitholders | [A] | $ | 47.3 | $ | 39.9 | $ | 93.5 | $ | 79.1 | |||||||||
FFO | 62.2 | 53.5 | 119.4 | 110.3 | ||||||||||||||
Add (deduct): | ||||||||||||||||||
Early redemption premium related to 2021 Debentures | — | — | 4.0 | — | ||||||||||||||
Accelerated amortization of credit facility deferred finance fees | — | — | 0.5 | — | ||||||||||||||
FFO adjusted for the above | [B] | $ | 62.2 | $ | 53.5 | $ | 123.9 | $ | 110.3 | |||||||||
AFFO | 60.1 | 51.3 | 114.9 | 106.9 | ||||||||||||||
Add (deduct): | ||||||||||||||||||
Early redemption premium related to 2021 Debentures | — | — | 4.0 | — | ||||||||||||||
Accelerated amortization of credit facility | — | — | 0.5 | — | ||||||||||||||
AFFO adjusted for the above | [C] | $ | 60.1 | $ | 51.3 | $ | 119.4 | $ | 106.9 | |||||||||
FFO payout ratio | [A]/[B] | 76% | 75% | 75% | 72% | |||||||||||||
AFFO payout ratio | [A]/[C] | 79% | 78% | 78% | 74% | |||||||||||||
Granite REIT 2021 Second Quarter Report 47
Net operating income — cash basis
Granite uses NOI on a cash basis, which adjusts NOI to exclude lease termination and close-out fees, and the non-cash impact from straight-line rent and tenant incentive amortization recognized during the period (see “RESULTS OF OPERATIONS — Net Operating Income”). NOI — cash basis is a commonly used measure by the real estate industry and Granite believes it is a useful supplementary measure of the income generated by and operating performance of income-producing properties in addition to the most comparable IFRS measure, which Granite believes is NOI. NOI — cash basis is also a key input in Granite’s determination of the fair value of its investment property portfolio.
Same property net operating income — cash basis
Same property NOI — cash basis refers to the NOI — cash basis for those properties owned by Granite throughout the entire current and prior year periods under comparison. Same property NOI — cash basis excludes properties that were acquired, disposed of, classified as properties under or held for development or assets held for sale during the periods under comparison (see “RESULTS OF OPERATIONS — Net Operating Income”). Granite believes that same property NOI — cash basis is a useful supplementary measure in understanding period-over-period organic changes in NOI — cash basis from the same stock of properties owned.
Constant currency same property NOI
Constant currency same property NOI is a non-GAAP measure used by management in evaluating the performance of properties owned by Granite throughout the entire current and prior year periods on a constant currency basis. It is calculated by taking same property NOI as defined above and excluding the impact of foreign currency translation by converting the same property NOI denominated in foreign currency in the respective periods at the current period average exchange rates (see “RESULTS OF OPERATIONS — Net Operating Income”).
Adjusted earnings before interest, income taxes, depreciation and amortization (“Adjusted EBITDA”)
Adjusted EBITDA is calculated as net income before lease termination and close-out fees, interest expense, interest income, income tax expense, depreciation and amortization expense, fair value gains (losses) on investment properties and financial instruments, other expense relating to real estate transfer tax and loss on the sale of investment properties. Adjusted EBITDA, calculated on a 12-month trailing basis (“trailing 12-month adjusted EBITDA”), represents an operating cash flow measure that Granite uses in calculating the interest coverage ratio and indebtedness ratio noted below. Adjusted EBITDA is also defined in Granite’s debt agreements and used in calculating the Trust’s debt covenants.
48 Granite REIT 2021 Second Quarter Report
Adjusted EBITDA Reconciliation |
| For the 12-months ended June 30, 2021 and December 31, 2020 | 2021 | 2020 | ||||||
Net income | $ | 820.1 | $ | 429.9 | ||||
Add (deduct): | ||||||||
Interest expense and other financing costs | 50.8 | 35.8 | ||||||
Interest income | (2.5 | ) | (2.4 | ) | ||||
Income tax expense | 140.0 | 69.1 | ||||||
Depreciation and amortization | 1.3 | 1.2 | ||||||
Fair value gains on investment properties, net | (720.4 | ) | (273.4 | ) | ||||
Fair value (gains) losses on financial instruments | (1.9 | ) | 3.4 | |||||
Loss on sale of investment properties | 1.5 | 0.9 | ||||||
Adjusted EBITDA | $ | 288.9 | $ | 264.5 | ||||
Interest coverage ratio
The interest coverage ratio is calculated on a 12-month trailing basis using Adjusted EBITDA divided by net interest expense. Granite believes the interest coverage ratio is useful in evaluating the Trust’s ability to meet its interest expense obligations (see “LIQUIDITY AND CAPITAL RESOURCES — Debt Structure”).
Indebtedness ratio
The indebtedness ratio is calculated as total debt divided by Adjusted EBITDA and Granite believes it is useful in evaluating the Trust’s ability to repay outstanding debt using its operating cash flows (see “LIQUIDITY AND CAPITAL RESOURCES — Debt Structure”).
Leverage and net leverage ratios
The leverage ratio is calculated as the carrying value of total debt divided by the fair value of investment properties while the net leverage ratio subtracts cash and cash equivalents from total debt. The leverage ratio and net leverage ratio are supplemental measures that Granite believes are useful in evaluating the Trust’s degree of financial leverage, borrowing capacity and the relative strength of its balance sheet (see “LIQUIDITY AND CAPITAL RESOURCES — Debt Structure”).
Unencumbered asset coverage ratio
The unencumbered asset coverage ratio is calculated as the carrying value of investment properties (excluding assets held for sale) that are not encumbered by secured debt divided by the carrying value of total unsecured debt and is a supplemental measure that Granite believes is useful in evaluating the Trust’s degree of asset coverage provided by its unencumbered investment properties to total unsecured debt (see “LIQUIDITY AND CAPITAL RESOURCES — Debt Structure”).
| SIGNIFICANT ACCOUNTING ESTIMATES |
The preparation of financial statements in conformity with IFRS requires management to apply judgment and make estimates that affect the amounts reported and disclosed in the combined financial statements. Management bases estimates on historical experience and various other assumptions that are believed to be reasonable in the circumstances, the results of which form the basis for making judgments about the values of assets and liabilities. On an ongoing basis, management evaluates its estimates. However, actual results could differ from those estimates.
Granite REIT 2021 Second Quarter Report 49
The Trust’s significant accounting policies that involve the most judgment and estimates are as follows:
Judgments
Leases
The Trust’s policy for revenue recognition is described in note 2(l) of the audited combined financial statements for the year ended December 31, 2020. The Trust makes judgments in determining whether certain leases are operating or finance leases, in particular tenant leases with long contractual terms or leases where the property is a large square-footage and/or architecturally specialized. The Trust also makes judgments in determining the lease term for some lease contracts in which it is a lessee that include renewal or termination options. The assessment of whether the Trust is reasonably certain to exercise such options impacts the lease term which, in turn, significantly affects the amount of lease obligations and right-of-use assets recognized.
Investment properties
The Trust’s policy relating to investment properties is described in note 2(d) of the audited combined financial statements for the year ended December 31, 2020. In applying this policy, judgment is used in determining whether certain costs incurred for tenant improvements are additions to the carrying amount of the property or represent incentives, identifying the point at which practical completion of properties under development occurs and determining borrowing costs to be capitalized to the carrying value of properties under development. Judgment is also applied in determining the use, extent and frequency of independent appraisals.
Income taxes
The Trust applies judgment in determining whether it will continue to qualify as a REIT for both Canadian and United States tax purposes for the foreseeable future. However, should it at some point no longer qualify, the Trust would be subject to income tax which could materially affect future distributions to unitholders and would also be required to recognize additional current and/or deferred income taxes.
Estimates and Assumptions
Valuation of investment properties
The fair value of investment properties is determined by management using primarily the discounted cash flow method in which the income and expenses are projected over the anticipated term of the investment plus a terminal value discounted using an appropriate discount rate. The Trust obtains, from time to time, appraisals from independent qualified real estate valuation experts. However, the Trust does not measure its investment properties based on these appraisals but uses them as data points, together with other external market information accumulated by management, in arriving at its own conclusions on values. Management uses valuation assumptions such as discount rates, terminal capitalization rates and market rental rates applied in external appraisals or sourced from valuation experts; however, the Trust also uses its historical renewal experience with tenants, its direct knowledge of the specialized nature of certain of Granite’s portfolio and tenant profile and its knowledge of the actual condition of the properties in making business judgments about lease renewal probabilities, renewal rents and capital expenditures. There has been no change in the valuation methodology used during the three and six months ended June 30, 2021. The critical assumptions relating to the Trust’s estimates of fair values of investment properties include the receipt of contractual rents,
50 Granite REIT 2021 Second Quarter Report
contractual renewal terms, expected future market rental rates, discount rates that reflect current market uncertainties, capitalization rates and recent investment property prices. If there is any change in these assumptions or regional, national or international economic conditions, the fair value of investment properties may change materially. Refer to the “Investment Properties” section and note 4 of the unaudited condensed combined financial statements for the three and six months ended June 30, 2021 for further information on the estimates and assumptions made by management in connection with the fair values of investment properties.
Fair value of financial instruments
Where the fair value of financial assets or liabilities recorded on the balance sheet or disclosed in the notes cannot be derived from active markets, it is determined using valuation techniques including the discounted cash flow model. The inputs to these models are taken from observable markets where possible but, where this is not feasible, a degree of judgment is required in establishing fair values. The judgments include considerations of inputs such as credit risk and volatility. Changes in assumptions about these factors could materially affect the reported fair value of financial instruments.
Income taxes
The Trust operates in a number of countries and is subject to the income tax laws and related tax treaties in each of its operating jurisdictions. These laws and treaties can be subject to different interpretations by relevant taxation authorities. Significant judgment is required in the estimation of Granite’s income tax expense, interpretation and application of the relevant tax laws and treaties and the provision for any exposure that may arise from tax positions that are under audit by relevant taxation authorities.
The recognition and measurement of deferred tax assets or liabilities is dependent on management’s estimate of future taxable profits and income tax rates that are expected to be in effect in the period the asset is realized or the liability is settled. Any changes in management’s estimates can result in changes in deferred tax assets or liabilities as reported in the combined balance sheets and also the deferred income tax expense in the combined statements of net income.
| NEW ACCOUNTING PRONOUNCEMENTS AND DEVELOPMENTS |
Future Accounting Policy Changes
As at June 30, 2021, there are no new accounting standards issued but not yet applicable to the unaudited condensed combined financial statements.
| INTERNAL CONTROLS OVER FINANCIAL REPORTING |
During the second quarter of 2021, there were no changes in the Trust’s internal controls over financial reporting that had materially affected or are reasonably likely to materially affect the internal controls over financial reporting.
| RISKS AND UNCERTAINTIES |
Investing in the Trust’s stapled units involves a high degree of risk. There are a number of risk factors that could have a material adverse effect on Granite’s business, financial condition, operating results and prospects. These risks and uncertainties are discussed in Granite’s AIF filed
Granite REIT 2021 Second Quarter Report 51
with securities regulators in Canada and available online at www.sedar.com and Annual Report on Form 40-F filed with the SEC and available online on EDGAR at www.sec.gov, each in respect of the year ended December 31, 2020 and remain substantially unchanged in respect of the three and six month periods ended June 30, 2021.
| QUARTERLY FINANCIAL DATA (UNAUDITED) |
| (in millions, except as noted) | Q2’21 | Q1’21 | Q4’20 | Q3’20 | Q2’20 | Q1’20 | Q4’19 | Q3’19 | ||||||||||||||||||||||||
Operating highlights(1)(2) | ||||||||||||||||||||||||||||||||
Revenue | $ | 94.0 | $ | 95.9 | $ | 93.2 | $ | 87.9 | $ | 81.0 | $ | 78.1 | $ | 73.6 | $ | 68.8 | ||||||||||||||||
NOI — cash basis(1) | $ | 79.9 | $ | 79.8 | $ | 76.3 | $ | 74.5 | $ | 71.0 | $ | 67.8 | $ | 63.8 | $ | 60.3 | ||||||||||||||||
Fair value gain on investment properties, net | $ | 308.0 | $ | 209.5 | $ | 140.8 | $ | 62.1 | $ | 34.5 | $ | 36.0 | $ | 47.5 | $ | 78.2 | ||||||||||||||||
Net income attributable to stapled unitholders | $ | 317.0 | $ | 230.2 | $ | 167.6 | $ | 105.2 | $ | 75.7 | $ | 81.3 | $ | 90.6 | $ | 114.5 | ||||||||||||||||
Cash provided by operating activities | $ | 64.7 | $ | 64.3 | $ | 60.3 | $ | 69.0 | $ | 65.2 | $ | 54.9 | $ | 50.9 | $ | 43.4 | ||||||||||||||||
FFO(1) | $ | 62.2 | $ | 57.1 | $ | 59.6 | $ | 55.5 | $ | 53.5 | $ | 56.8 | $ | 47.9 | $ | 45.8 | ||||||||||||||||
AFFO(1) | $ | 60.1 | $ | 54.7 | $ | 56.1 | $ | 52.7 | $ | 51.3 | $ | 55.6 | $ | 46.2 | $ | 44.4 | ||||||||||||||||
FFO payout ratio(1) | 76% | 75% | 74% | 76% | 75% | 69% | 80% | 76% | ||||||||||||||||||||||||
AFFO payout ratio(1) | 79% | 78% | 79% | 80% | 78% | 70% | 83% | 78% | ||||||||||||||||||||||||
Per unit amounts | ||||||||||||||||||||||||||||||||
Diluted FFO(1) | $ | 0.99 | $ | 0.93 | $ | 1.00 | $ | 0.96 | $ | 0.97 | $ | 1.05 | $ | 0.91 | $ | 0.93 | ||||||||||||||||
Diluted AFFO(1) | $ | 0.96 | $ | 0.89 | $ | 0.94 | $ | 0.91 | $ | 0.93 | $ | 1.03 | $ | 0.88 | $ | 0.90 | ||||||||||||||||
Monthly distributions paid | $ | 0.75 | $ | 0.75 | $ | 0.73 | $ | 0.73 | $ | 0.73 | $ | 0.73 | $ | 0.70 | $ | 0.70 | ||||||||||||||||
Diluted weighted average number of units | 62.8 | 61.7 | 59.5 | 57.9 | 54.9 | 54.1 | 52.6 | 49.5 | ||||||||||||||||||||||||
Financial highlights | ||||||||||||||||||||||||||||||||
Investment properties(3) | $ | 6,396.6 | $ | 6,003.7 | $ | 5,855.6 | $ | 5,338.9 | $ | 5,097.3 | $ | 4,810.0 | $ | 4,457.9 | $ | 3,938.3 | ||||||||||||||||
Assets held for sale | — | — | — | — | — | — | — | $ | 48.3 | |||||||||||||||||||||||
Cash and cash equivalents | $ | 678.1 | $ | 480.7 | $ | 831.3 | $ | 539.7 | $ | 617.2 | $ | 242.1 | $ | 298.7 | $ | 455.4 | ||||||||||||||||
Total debt(4) | $ | 1,936.0 | $ | 1,959.5 | $ | 2,297.5 | $ | 1,814.8 | $ | 1,800.5 | $ | 1,309.8 | $ | 1,250.3 | $ | 1,253.2 | ||||||||||||||||
Total capital expenditures incurred | $ | 3.2 | $ | 0.7 | $ | 13.3 | $ | 2.2 | $ | 6.2 | $ | 3.4 | $ | 1.0 | $ | 1.5 | ||||||||||||||||
Total leasing costs incurred | $ | 0.3 | — | $ | 2.1 | $ | 1.2 | $ | 2.0 | — | $ | 0.8 | $ | 0.2 | ||||||||||||||||||
Property metrics(3) | ||||||||||||||||||||||||||||||||
Number of income-producing properties | 110 | 108 | 108 | 102 | 94 | 85 | 85 | 80 | ||||||||||||||||||||||||
GLA, square feet | 51.3 | 50.4 | 49.5 | 45.4 | 44.3 | 40.0 | 40.0 | 34.9 | ||||||||||||||||||||||||
Occupancy, by GLA | 99.3% | 99.1% | 99.6% | 98.9% | 99.1% | 99.0% | 99.0% | 99.7% | ||||||||||||||||||||||||
Weighted average lease term, years | 6.0 | 6.1 | 6.3 | 5.9 | 6.1 | 6.3 | 6.5 | 6.0 | ||||||||||||||||||||||||
| (1) | For definitions of Granite’s non-IFRS measures, refer to the section “NON-IFRS PERFORMANCE MEASURES”. |
| (2) | The quarterly financial data reflects fluctuations in revenue, FFO, AFFO, investment properties and total debt primarily from the timing of leasing and development activities, property sales, acquisitions and foreign exchange. Investment properties also fluctuate from the effect of measuring properties at fair value under IFRS. Net income attributable to unitholders primarily fluctuates from fair value gains/losses on investment properties. Explanations for specific changes in the quarterly financial data table above are as follows: |
| • | Q2’21 — Fair value gains on investment properties of $308.0 million were largely attributable to favourable changes in fair market rent assumptions as well as compression in discount and terminal capitalization rates for properties located in the GTA and across the United States as well as for certain of the Trust’s modern warehouse properties in Europe. |
52 Granite REIT 2021 Second Quarter Report
| • | Q1’21 — Fair value gains on investment properties of $209.5 million were largely attributable to favourable changes fair market rent assumptions as well as compression in discount and terminal capitalization rates for properties located in the GTA and across the United States as well as for certain of the Trust’s modern warehouse properties in Europe. |
| • | Q4’20 — Fair value gains on investment properties of $140.8 million were largely attributable to (i) favourable changes in leasing assumptions associated with fair market rent increases as well as compression in discount and terminal capitalization rates for properties across the United States and certain warehouse properties in Germany and the Netherlands resulted from a greater market demand for industrial real estate. |
| • | Q3’20 — Fair value gains on investment properties of $62.1 million were largely attributable to favourable changes in leasing assumptions associated with fair market rent increases as well as compression in discount and terminal capitalization rates for properties located in the GTA and across the United States as well as compression in discount and terminal capitalization rates for certain of the Trust’s modern warehouse properties in Germany and the Netherlands. |
| • | Q2’20 — Fair value gains on investment properties of $34.5 million were largely attributable to (i) the favourable changes in leasing assumptions associated with fair market rent increases for properties located in Canada and (ii) the increase in fair value of the recently developed property in Plainfield, Indiana as a result of executing a full building 10-year lease with a new tenant, marginally offset by an increase in discount rates for certain properties located in Austria due to market conditions and the nature of the tenants and properties in this jurisdiction. |
| • | Q1’20 — Fair value gains on investment properties of $36.0 million were attributable to various factors including an increase in fair value for the recently acquired property in Dallas, Texas as a result of market confirmation of capitalization rates favourable to initial acquisition metrics of the forward purchase for this modern e-commerce facility, partially offset by an increase in discount rates for properties located in Austria and Germany due to market conditions and the nature of the properties across these jurisdictions. |
| • | Q4’19 — Net income attributable to unitholders, cash provided by operating activities and FFO included a net $2.0 million ($0.04 per unit) real estate transfer tax ($2.7 million) and related tax recovery ($0.7 million) which resulted from an internal reorganization. |
| • | Q3’19 — Fair value gains on investment properties of $78.2 million were largely attributable to (i) a compression in discount or terminal capitalization rates for certain properties primarily located in Canada and the United States and, to a lesser extent, in Europe, which resulted from the continued market demand for industrial real estate and (ii) the favourable changes in leasing assumptions associated with fair market rent increases for certain properties located in North America. |
| (3) | Excludes properties held for sale which are classified as assets held for sale on the combined balance sheet as at the respective quarter-end. |
| (4) | Total debt includes lease obligations recognized under IFRS 16, Leases. |
| FORWARD-LOOKING STATEMENTS |
This MD&A may contain statements that, to the extent they are not recitations of historical fact, constitute “forward-looking statements” or “forward-looking information” within the meaning of applicable securities legislation, including the United States Securities Act of 1933, as amended, the United States Securities Exchange Act of 1934, as amended, and applicable Canadian securities legislation. Forward-looking statements and forward-looking information may include, among others, statements regarding Granite’s future plans, goals, strategies, intentions, beliefs, estimates, costs, objectives, capital structure, cost of capital, tenant base, tax consequences, economic performance or expectations, or the assumptions underlying any of the foregoing. Words such as “outlook”, “may”, “would”, “could”, “should”, “will”, “likely”, “expect”, “anticipate”, “believe”, “intend”, “plan”, “forecast”, “project”, “estimate”, “seek” and similar expressions are used to identify forward-looking statements and forward-looking information. Forward-looking statements and forward-looking information should not be read as guarantees of future events, performance or results and will not necessarily be accurate indications of whether or the times at or by which such future performance will be achieved. Undue reliance should not be placed on such statements. There can also be no assurance that: Granite’s expectations regarding the impact of the COVID-19 pandemic and government measures to contain it, including with respect to Granite’s ability to weather the impact of COVID-19, the effectiveness of
Granite REIT 2021 Second Quarter Report 53
measures intended to mitigate such impact, and Granite’s ability to deliver cash flow stability and growth and create long-term value for unitholders; Granite’s ability to implement its ESG+R program and related targets and goals; the expansion and diversification of Granite’s real estate portfolio and the reduction in Granite’s exposure to Magna and the special purpose properties; the ability of Granite to accelerate growth and to grow its net asset value and FFO and AFFO per unit; the ability of Granite to find and integrate satisfactory acquisition, joint venture and development opportunities and to strategically deploy the proceeds from recently sold properties and financing initiatives; Granite’s intended use of the net proceeds of its equity and debenture offerings to fund potential acquisitions and for the other purposes described previously; the potential for expansion and rental growth at the properties in Mississauga and Ajax, Ontario and the expected enhancement to the yields of such properties from such potential expansion and rental growth; the expected construction on and development yield of the site in Houston, Texas; the expected development and construction of an e-commerce and logistics warehouse on land in Fort Worth, Texas; the expected construction of the distribution/light industrial facility on the 13-acre site in Altbach, Germany; the expected construction of a modern distribution facility on the 50.8 acre site in Murfreesboro, Tennessee; the expected development of a multi-phased business park on the 9.2 acre site in Brantford, Ontario, and the potential yield from the project; the timing of payment of associated unpaid construction costs and holdbacks; Granite’s ability to dispose of any non-core assets on satisfactory terms; Granite’s ability to meet its target occupancy goals; Granite’s ability to secure sustainability or other certifications for any of its properties; the expected impact of the refinancing of the term loans on Granite’s returns and cash flow; and the expected amount of any distributions and distribution increase, can be achieved in a timely manner, with the expected impact or at all. Forward-looking statements and forward-looking information are based on information available at the time and/or management’s good faith assumptions and analyses made in light of Granite’s perception of historical trends, current conditions and expected future developments, as well as other factors Granite believes are appropriate in the circumstances. Given the impact of the COVID-19 pandemic and government measures to contain it, there is inherently more uncertainty associated with our assumptions as compared to prior periods. Forward-looking statements and forward-looking information are subject to known and unknown risks, uncertainties and other unpredictable factors, many of which are beyond Granite’s control, that could cause actual events or results to differ materially from such forward-looking statements and forward-looking information. Important factors that could cause such differences include, but are not limited to, the impact of the COVID-19 pandemic and government measures to contain it, and the resulting economic downturn, on Granite’s business, operations and financial condition; the risk that the pandemic or such measures intensify; the duration of the pandemic and related impacts; the risk of changes to tax or other laws and treaties that may adversely affect Granite REIT’s mutual fund trust status under the Income Tax Act (Canada) or the effective tax rate in other jurisdictions in which Granite operates; economic, market and competitive conditions and other risks that may adversely affect Granite’s ability to expand and diversify its real estate portfolio and dispose of any non-core assets on satisfactory terms; and the risks set forth in the “Risk Factors” section in Granite’s AIF for 2020 dated March 3, 2021, filed on SEDAR at www.sedar.com and attached as Exhibit 1 to the Trust’s Annual Report on Form 40-F for the year ended December 31, 2020 filed with the SEC and available online on EDGAR at www.sec.gov, all of which investors are strongly advised to review. The “Risk Factors” section also contains information about the material factors or assumptions underlying such forward-looking statements and forward-looking information. Forward-looking statements and forward-looking information speak only as of the date the statements and information were made and unless otherwise required by applicable securities laws, Granite expressly disclaims any intention and undertakes no obligation to update or revise any forward-looking statements or forward-looking information contained in this MD&A to reflect subsequent information, events or circumstances or otherwise.
54 Granite REIT 2021 Second Quarter Report