UNITED STATES
SECURITIES AND EXCHANGE COMMISSION
Washington, D.C. 20549
FORM N-CSR
CERTIFIED SHAREHOLDER REPORT OF REGISTERED MANAGEMENT INVESTMENT COMPANIES
Investment Company Act file number 811-23199
First Trust Senior Floating Rate 2022 Target Term Fund
(Exact name of registrant as specified in charter)
120 East Liberty Drive, Suite 400
Wheaton, IL 60187
(Address of principal executive offices) (Zip code)
W. Scott Jardine, Esq.
First Trust Portfolios L.P.
120 East Liberty Drive, Suite 400
Wheaton, IL 60187
(Name and address of agent for service)
Registrant’s telephone number, including area code: 630-765-8000
Date of fiscal year end: May 31
Date of reporting period: May 31, 2020
Form N-CSR is to be used by management investment companies to file reports with the Commission not later than 10 days after the transmission to stockholders of any report that is required to be transmitted to stockholders under Rule 30e-1 under the Investment Company Act of 1940 (17 CFR 270.30e-1). The Commission may use the information provided on Form N-CSR in its regulatory, disclosure review, inspection, and policymaking roles.
A registrant is required to disclose the information specified by Form N-CSR, and the Commission will make this information public. A registrant is not required to respond to the collection of information contained in Form N-CSR unless the Form displays a currently valid Office of Management and Budget (“OMB”) control number. Please direct comments concerning the accuracy of the information collection burden estimate and any suggestions for reducing the burden to Secretary, Securities and Exchange Commission, 450 Fifth Street, NW, Washington, DC 20549-0609. The OMB has reviewed this collection of information under the clearance requirements of 44 U.S.C. § 3507.
Item 1. Reports to Stockholders.
The Report to Shareholders is attached herewith.
.

Target Term Fund (FIV)

| 1 | |
| 2 | |
| 4 | |
| 6 | |
| 14 | |
| 15 | |
| 16 | |
| 17 | |
| 18 | |
| 19 | |
| 25 | |
| 26 | |
| 31 | |
| 33 |

| Fund Statistics | |
| Symbol on New York Stock Exchange | FIV |
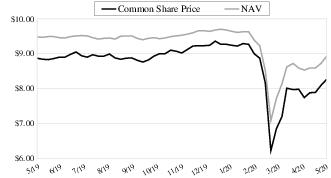
| Common Share Price | $8.26 |
| Common Share Net Asset Value (“NAV”) | $8.92 |
| Premium (Discount) to NAV | (7.40)% |
| Net Assets Applicable to Common Shares | $319,729,664 |
| Current Monthly Distribution per Common Share(1) | $0.0203 |
| Current Annualized Distribution per Common Share | $0.2436 |
| Current Distribution Rate on Common Share Price(2) | 2.95% |
| Current Distribution Rate on NAV(2) | 2.73% |
| Performance | |||
| Average Annual Total Returns | Cumulative Total Returns | ||
| 1 Year Ended 5/31/20 | Inception (12/21/16) to 5/31/20 | Inception (12/21/16) to 5/31/20 | |
| Fund Performance(3) | |||
| NAV | -2.30% | 1.66% | 5.82% |
| Market Value | -3.30% | -1.03% | -3.49% |
| Index Performance | |||
| S&P/LSTA Leveraged Loan Index | -2.86% | 2.09% | 7.37% |
| (1) | Most recent distribution paid or declared through 5/31/2020. Subject to change in the future. |
| (2) | Distribution rates are calculated by annualizing the most recent distribution paid or declared through the report date and then dividing by Common Share Price or NAV, as applicable, as of 5/31/2020. Subject to change in the future. |
| (3) | Total return is based on the combination of reinvested dividend, capital gain, and return of capital distributions, if any, at prices obtained by the Dividend Reinvestment Plan and changes in NAV per share for NAV returns and changes in Common Share Price for market value returns. Total returns do not reflect sales load and are not annualized for periods of less than one year. Past performance is not indicative of future results. |
| Credit Quality (S&P Ratings)(4) | % of Senior Loans and Other Debt Securities(5) |
| BBB- | 10.1% |
| BB+ | 5.9 |
| BB | 10.7 |
| BB- | 16.3 |
| B+ | 29.2 |
| B | 16.3 |
| B- | 7.6 |
| CCC+ | 2.8 |
| CCC | 0.6 |
| D | 0.5 |
| Total | 100.0% |
| Top 10 Issuers | % of Senior Loans and other Securities(5) |
| Micro Focus International (MA Financeco, LLC) | 4.4% |
| Nexstar Broadcasting, Inc. | 3.6 |
| Pharmaceutical Product Development, Inc. (PPDI/Jaguar) | 3.5 |
| Multiplan, Inc. (MPH) | 3.4 |
| Reynolds Group Holdings, Inc. | 3.2 |
| CityCenter Holdings, LLC | 3.0 |
| Bausch Health Companies, Inc. (Valeant) | 3.0 |
| Change Healthcare Holdings, LLC | 2.7 |
| Hostess Brands, LLC (HB Holdings) | 2.5 |
| Endo, LLC | 2.2 |
| Total | 31.5% |
| Industry Classification | % of Senior Loans and Other Securities(5) |
| Software | 15.1% |
| Hotels, Restaurants & Leisure | 14.5 |
| Health Care Providers & Services | 14.4 |
| Pharmaceuticals | 11.9 |
| Media | 8.2 |
| Insurance | 4.7 |
| Containers & Packaging | 4.6 |
| Diversified Telecommunication Services | 3.1 |
| Health Care Technology | 2.8 |
| Diversified Financial Services | 2.8 |
| Food Products | 2.5 |
| Food & Staples Retailing | 2.5 |
| Auto Components | 2.1 |
| Entertainment | 1.9 |
| Diversified Consumer Services | 1.5 |
| Building Products | 0.8 |
| Oil, Gas & Consumable Fuels | 0.8 |
| Aerospace & Defense | 0.8 |
| Chemicals | 0.7 |
| Semiconductors & Semiconductor Equipment | 0.7 |
| Professional Services | 0.7 |
| Wireless Telecommunication Services | 0.7 |
| Commercial Services & Supplies | 0.7 |
| Independent Power & Renewable Electricity Producers | 0.4 |
| Technology Hardware, Storage & Peripherals | 0.4 |
| Household Durables | 0.2 |
| Communications Equipment | 0.2 |
| Capital Markets | 0.2 |
| Specialty Retail | 0.1 |
| Construction & Engineering | 0.0* |
| Total | 100.0% |
| * | Amount is less than 0.1%. |
| (4) | The ratings are by Standard & Poor’s except where otherwise indicated. A credit rating is an assessment provided by a nationally recognized statistical rating organization (NRSRO) of the creditworthiness of an issuer with respect to debt obligations except for those debt obligations that are only privately rated. Ratings are measured on a scale that generally ranges from AAA (highest) to D (lowest). Investment grade is defined as those issuers that have a long-term credit rating of BBB- or higher. The credit ratings shown relate to the creditworthiness of the issuers of the underlying securities in the Fund, and not to the Fund or its shares. Credit ratings are subject to change. |
| (5) | Percentages are based on long-term positions. Money market funds are excluded. |
| 1 | Bloomberg: High-Yield Bonds are represented by the ICE BofA US High Yield Constrained Index, Investment Grade Bonds are represented by the ICE BofA US Corporate Index, and the US Aggregate Index is represented by the Bloomberg Barclays US Aggregate Bond Index. |
| 2 | JP Morgan Leverage Loan Market Monitor. |
| Principal Value | Description | Rate (a) | Stated Maturity (b) | Value | ||||
| SENIOR FLOATING-RATE LOAN INTERESTS (c) – 136.7% | ||||||||
| Aerospace & Defense – 1.1% | ||||||||
| $3,721,871 | Transdigm, Inc., Tranche G Refinancing Term Loan, 1 Mo. LIBOR + 2.25%, 0.00% Floor | 2.42% | 08/22/24 | $3,396,207 | ||||
| Alternative Carriers – 2.1% | ||||||||
| 6,851,611 | Level 3 Financing, Inc., Tranche B 2027 Term Loan, 1 Mo. LIBOR + 1.75%, 0.00% Floor | 1.92% | 03/01/27 | 6,636,264 | ||||
| Apparel Retail – 0.1% | ||||||||
| 300,110 | Burlington Coat Factory Warehouse Corp., Term Loan B-5, 1 Mo. LIBOR + 1.75%, 0.00% Floor | 1.94% | 11/17/24 | 285,606 | ||||
| Application Software – 14.0% | ||||||||
| 1,517,652 | CCC Information Services, Inc. (Cypress), Term Loan B, 1 Mo. LIBOR + 3.00%, 1.00% Floor | 4.00% | 04/26/24 | 1,459,799 | ||||
| 7,541,709 | Hyland Software, Inc., Term Loans, 1 Mo. LIBOR + 3.25%, 0.75% Floor | 4.00% | 07/01/24 | 7,322,547 | ||||
| 740,156 | Internet Brands, Inc. (MH Sub I, LLC), Initial Term Loans, 6 Mo. LIBOR + 3.75%, 0.00% Floor | 4.82% | 09/13/24 | 715,057 | ||||
| 1,248,044 | Micro Focus International (MA Financeco, LLC), Miami Escrow TL B3, 1 Mo. LIBOR + 2.50%, 0.00% Floor | 2.67% | 06/21/24 | 1,177,318 | ||||
| 8,427,782 | Micro Focus International (MA Financeco, LLC), Seattle Spinco TLB, 1 Mo. LIBOR + 2.50%, 0.00% Floor | 2.67% | 06/21/24 | 7,950,180 | ||||
| 10,050,910 | Micro Focus International (MA Financeco, LLC), Term Loan B2, 1 Mo. LIBOR + 2.25%, 0.00% Floor | 2.42% | 11/19/21 | 10,000,655 | ||||
| 1,286,135 | Mitchell International, Inc., 1st Lien Term Loan, 1 Mo. LIBOR + 3.25%, 0.00% Floor | 3.42% | 11/30/24 | 1,208,324 | ||||
| 698,481 | Qlik Technologies (Project Alpha Intermediate Holding, Inc.), 2019 Incremental Term Loan, 6 Mo. LIBOR + 4.25%, 0.00% Floor | 6.13% | 04/26/24 | 668,796 | ||||
| 6,210,194 | Qlik Technologies (Project Alpha Intermediate Holding, Inc.), Term Loan B, 6 Mo. LIBOR + 3.50%, 1.00% Floor | 5.38% | 04/26/24 | 5,884,159 | ||||
| 1,086 | RP Crown Parent (JDA Software Group), Term Loan B, 1 Mo. LIBOR + 2.75%, 1.00% Floor | 3.75% | 10/12/23 | 1,059 | ||||
| 8,199,896 | SolarWinds Holdings, Inc., Initial Term Loans, 1 Mo. LIBOR + 2.75%, 0.00% Floor | 2.92% | 02/05/24 | 8,013,021 | ||||
| 380,858 | Veeam Software Holdings Limited (VS Buyer, LLC), Term Loan B, 1 Mo. LIBOR + 3.25%, 0.00% Floor | 3.42% | 02/28/27 | 370,384 | ||||
| 44,771,299 | ||||||||
| Auto Parts & Equipment – 2.9% | ||||||||
| 3,032,851 | American Axle & Manufacturing Holdings, Inc., Term Loan B, 1 Mo. LIBOR + 2.25%, 0.75% Floor | 3.00% | 04/06/24 | 2,891,308 | ||||
| 5,831,673 | Gates Global, LLC, Initial B-2 Dollar Term Loans, 1 Mo. LIBOR + 2.75%, 1.00% Floor | 3.75% | 03/31/24 | 5,576,538 | ||||
| 6,395 | Lumileds (Bright Bidco B.V.), Term Loan B, 3 Mo. LIBOR + 3.50%, 1.00% Floor | 4.95% | 06/30/24 | 2,006 | ||||
| 2,484,825 | Lumileds (Bright Bidco B.V.), Term Loan B, 6 Mo. LIBOR + 3.50%, 1.00% Floor | 4.57% | 06/30/24 | 779,614 | ||||
| 9,249,466 | ||||||||
| Broadcasting – 7.6% | ||||||||
| 1,119,132 | Cumulus Media Holdings, Inc., Term Loan B, 6 Mo. LIBOR + 3.75%, 1.00% Floor | 4.82% | 03/31/26 | 954,060 | ||||
| 1,600,664 | Diamond Sports Group, LLC, Term Loan B, 1 Mo. LIBOR + 3.25%, 0.00% Floor | 3.42% | 08/23/26 | 1,370,568 | ||||
| 1,085,669 | E.W. Scripps Company, Term Loan B-2, 1 Mo. LIBOR + 2.50%, 0.00% Floor | 2.67% | 05/01/26 | 1,026,858 | ||||
| Principal Value | Description | Rate (a) | Stated Maturity (b) | Value | ||||
| SENIOR FLOATING-RATE LOAN INTERESTS (c) (Continued) | ||||||||
| Broadcasting (Continued) | ||||||||
| $244,723 | Entercom Media Corp. (CBS Radio), Term Loan B, 1 Mo. LIBOR + 2.50%, 0.00% Floor | 2.67% | 11/17/24 | $220,801 | ||||
| 1,378,466 | Gray Television, Inc., Term C Loan, 1 Mo. LIBOR + 2.50%, 0.00% Floor | 2.83% | 01/02/26 | 1,342,033 | ||||
| 3,854,271 | iHeartCommunications, Inc., Term Loan B, 1 Mo. LIBOR + 3.00%, 0.00% Floor | 3.17% | 04/29/26 | 3,594,108 | ||||
| 1,990,146 | Nexstar Broadcasting, Inc., Mission Term Loan B-3, 1 Mo. LIBOR + 2.25%, 0.00% Floor | 2.62% | 01/17/24 | 1,912,610 | ||||
| 7,735,971 | Nexstar Broadcasting, Inc., Nexstar Term Loan B-3, 1 Mo. LIBOR + 2.25%, 0.00% Floor | 2.42% | 01/17/24 | 7,434,578 | ||||
| 6,682,609 | Nexstar Broadcasting, Inc., Term B-4 Loan, 1 Mo. LIBOR + 2.75%, 0.00% Floor | 3.12% | 09/19/26 | 6,427,868 | ||||
| 24,283,484 | ||||||||
| Building Products – 1.2% | ||||||||
| 3,917,804 | Quikrete Holdings, Inc., Term Loan B, 1 Mo. LIBOR + 2.50%, 0.00% Floor | 2.67% | 01/31/27 | 3,716,546 | ||||
| Cable & Satellite – 3.6% | ||||||||
| 2,248,415 | Cablevision (aka CSC Holdings, LLC), March 2017 Term Loan B-1, 1 Mo. LIBOR + 2.25%, 0.00% Floor | 2.43% | 07/17/25 | 2,160,165 | ||||
| 3,160,070 | Cablevision (aka CSC Holdings, LLC), Sept. 2019 Term Loan B-5, 1 Mo. LIBOR + 2.50%, 0.00% Floor | 2.68% | 04/15/27 | 3,043,558 | ||||
| 4,784,965 | Charter Communications Operating, LLC, Term Loan B1, 1 Mo. LIBOR + 1.75%, 0.00% Floor | 1.93% | 04/30/25 | 4,691,515 | ||||
| 1,735,743 | Virgin Media Investment Holdings Limited, Term Loan N, 1 Mo. LIBOR + 2.50%, 0.00% Floor | 2.68% | 01/31/28 | 1,680,772 | ||||
| 11,576,010 | ||||||||
| Casinos & Gaming – 15.9% | ||||||||
| 6,981,400 | Aristocrat Technologies, Inc., Term B-3 Loan, 3 Mo. LIBOR + 1.75%, 0.00% Floor | 2.86% | 10/19/24 | 6,693,417 | ||||
| 3,000,000 | Boyd Gaming Corporation, Term Loan B, 1 Mo. LIBOR + 2.25%, 0.00% Floor | 2.34% | 09/15/23 | 2,872,500 | ||||
| 3,286,472 | Caesars Entertainment Operating Company, Inc. (CEOC), Term B Loans, 1 Mo. LIBOR + 2.00%, 0.00% Floor | 2.17% | 10/07/24 | 3,189,521 | ||||
| 10,734,042 | Caesars Resort Collection, LLC, Term Loan B, 1 Mo. LIBOR + 2.75%, 0.00% Floor | 2.92% | 12/22/24 | 9,676,739 | ||||
| 14,148,946 | CityCenter Holdings, LLC, Term Loan B, 1 Mo. LIBOR + 2.25%, 0.75% Floor | 3.00% | 04/18/24 | 13,236,905 | ||||
| 2,300,747 | Golden Nugget, Inc., Term Loan B, 2 Mo. LIBOR + 2.50%, 0.75% Floor | 3.25% | 10/04/23 | 1,971,096 | ||||
| 1,963,903 | Golden Nugget, Inc., Term Loan B, 3 Mo. LIBOR + 2.50%, 0.75% Floor | 3.70% | 10/04/23 | 1,682,515 | ||||
| 735,357 | Scientific Games International, Inc., Term Loan B5, 1 Mo. LIBOR + 2.75%, 0.00% Floor | 2.92% | 08/14/24 | 656,674 | ||||
| 19,186 | Scientific Games International, Inc., Term Loan B5, 2 Mo. LIBOR + 2.75%, 0.00% Floor | 3.45% | 08/14/24 | 17,133 | ||||
| 3,005,957 | Scientific Games International, Inc., Term Loan B5, 6 Mo. LIBOR + 2.75%, 0.00% Floor | 3.61% | 08/14/24 | 2,684,319 | ||||
| 6,633,267 | Stars Group Holdings B.V. (Amaya), Term Loan B, 3 Mo. LIBOR + 3.50%, 0.00% Floor | 4.95% | 07/10/25 | 6,540,004 | ||||
| 1,023,639 | Station Casinos, Inc. (Red Rocks), Term Loan B, 1 Mo. LIBOR + 2.25%, 0.25% Floor | 2.50% | 01/31/27 | 959,662 | ||||
| Principal Value | Description | Rate (a) | Stated Maturity (b) | Value | ||||
| SENIOR FLOATING-RATE LOAN INTERESTS (c) (Continued) | ||||||||
| Casinos & Gaming (Continued) | ||||||||
| $658,623 | Twin River Worldwide Holdings, Inc., Term Loan B, 1 Mo. LIBOR + 2.75%, 0.00% Floor | 2.92% | 05/10/26 | $578,146 | ||||
| 50,758,631 | ||||||||
| Coal & Consumable Fuels – 1.1% | ||||||||
| 3,924,918 | Arch Coal, Inc., Term Loan, 1 Mo. LIBOR + 2.75%, 1.00% Floor | 3.75% | 03/07/24 | 3,277,306 | ||||
| 282,956 | Peabody Energy Corp., Term Loan B, 1 Mo. LIBOR + 2.75%, 0.00% Floor | 2.92% | 03/31/25 | 152,089 | ||||
| 3,429,395 | ||||||||
| Communications Equipment – 0.3% | ||||||||
| 857,690 | Commscope, Inc., Term Loan B, 1 Mo. LIBOR + 3.25%, 0.00% Floor | 3.42% | 04/06/26 | 822,310 | ||||
| Construction & Engineering – 0.0% | ||||||||
| 162,662 | Pike Corp., 2019 New Term Loans, 1 Mo. LIBOR + 3.25%, 1.00% Floor | 4.25% | 07/24/26 | 159,171 | ||||
| Environmental & Facilities Services – 0.9% | ||||||||
| 3,019,692 | Packers Holdings, LLC, Term Loan B, 1 Mo. LIBOR + 3.25%, 1.00% Floor | 4.25% | 12/04/24 | 2,867,197 | ||||
| Food Distributors – 1.3% | ||||||||
| 1,318,370 | US Foods, Inc., Incremental B-2019 Term Loan, 6 Mo. LIBOR + 2.00%, 0.00% Floor | 3.07% | 08/31/26 | 1,241,469 | ||||
| 2,981,932 | US Foods, Inc., Term Loan B, 1 Mo. LIBOR + 1.75%, 0.00% Floor | 1.92% | 06/27/23 | 2,808,235 | ||||
| 4,049,704 | ||||||||
| Health Care Facilities – 2.3% | ||||||||
| 1,798,615 | Acadia Healthcare Company, Inc., Term Loan B4, 1 Mo. LIBOR + 2.50%, 0.00% Floor | 2.67% | 02/16/23 | 1,750,430 | ||||
| 1,081,996 | Gentiva Health Services, Inc. (Kindred at Home), Term Loan B, 1 Mo. LIBOR + 3.25%, 0.00% Floor | 3.44% | 07/02/25 | 1,049,536 | ||||
| 4,697,055 | Select Medical Corporation, Term Loan B, 1 Mo. LIBOR + 2.50%, 0.00% Floor | 2.67% | 03/06/25 | 4,520,915 | ||||
| 7,320,881 | ||||||||
| Health Care Services – 11.8% | ||||||||
| 8,745,846 | Air Medical Group Holdings, Inc. (Global Medical Response), 2018 Term Loan, 6 Mo. LIBOR + 3.25%, 1.00% Floor | 4.25% | 04/28/22 | 8,472,538 | ||||
| 2,498,135 | Air Methods Corp. (a/k/a ASP AMC Intermediate Holdings, Inc.), Term Loan B, 3 Mo. LIBOR + 3.50%, 1.00% Floor | 4.95% | 04/21/24 | 1,973,277 | ||||
| 396,045 | athenahealth, Inc. (VVC Holding Corp.), Term Loan B, 3 Mo. LIBOR + 4.50%, 0.00% Floor | 5.28% | 02/15/26 | 381,193 | ||||
| 24,032 | CHG Healthcare Services, Inc., Term Loan, 3 Mo. LIBOR + 3.00%, 1.00% Floor | 4.45% | 06/07/23 | 23,447 | ||||
| 9,326,393 | CHG Healthcare Services, Inc., Term Loan, 6 Mo. LIBOR + 3.00%, 1.00% Floor | 4.07% | 06/07/23 | 9,099,108 | ||||
| 3,050,982 | DaVita, Inc., Term Loan B, 1 Mo. LIBOR + 1.75%, 0.00% Floor | 1.92% | 08/12/26 | 2,975,470 | ||||
| 3,341,342 | DuPage Medical Group (Midwest Physician Admin. Services, LLC), Repricing Term Loan, 1 Mo. LIBOR + 2.75%, 0.75% Floor | 3.50% | 08/15/24 | 3,070,693 | ||||
| 3,921,100 | Envision Healthcare Corporation, Initial Term Loan, 1 Mo. LIBOR + 3.75%, 0.00% Floor | 3.92% | 10/10/25 | 2,550,480 | ||||
| 6,739 | Exam Works (Gold Merger Co., Inc.), Term B-1 Loan, 3 Mo. LIBOR + 3.25%, 1.00% Floor | 4.70% | 07/27/23 | 6,575 | ||||
| Principal Value | Description | Rate (a) | Stated Maturity (b) | Value | ||||
| SENIOR FLOATING-RATE LOAN INTERESTS (c) (Continued) | ||||||||
| Health Care Services (Continued) | ||||||||
| $2,601,418 | Exam Works (Gold Merger Co., Inc.), Term B-1 Loan, 6 Mo. LIBOR + 3.25%, 1.00% Floor | 4.32% | 07/27/23 | $2,538,021 | ||||
| 4,239,104 | Surgery Centers Holdings, Inc., Term Loan B, 1 Mo. LIBOR + 3.25%, 1.00% Floor | 4.25% | 08/31/24 | 3,869,497 | ||||
| 2,575,673 | Team Health, Inc., Term Loan B, 1 Mo. LIBOR + 2.75%, 1.00% Floor | 3.75% | 02/06/24 | 1,868,290 | ||||
| 783,271 | Verscend Technologies, Inc., Term Loan B, 1 Mo. LIBOR + 4.50%, 0.00% Floor | 4.67% | 08/27/25 | 756,350 | ||||
| 37,584,939 | ||||||||
| Health Care Technology – 3.8% | ||||||||
| 11,983,342 | Change Healthcare Holdings, LLC, Closing Date Term Loan, 3 Mo. LIBOR + 2.50%, 1.00% Floor | 3.50% | 03/01/24 | 11,643,853 | ||||
| 676,928 | Press Ganey (Azalea TopCo, Inc.), Term Loan B, 3 Mo. LIBOR + 3.50%, 0.00% Floor | 4.26% | 07/25/26 | 648,836 | ||||
| 12,292,689 | ||||||||
| Hotels, Resorts & Cruise Lines – 1.8% | ||||||||
| 6,174,332 | Four Seasons Holdings, Inc., Term Loan B, 1 Mo. LIBOR + 2.00%, 0.00% Floor | 2.17% | 11/30/23 | 5,874,445 | ||||
| Household Appliances – 0.3% | ||||||||
| 1,151,965 | Traeger Grills (TGP Holdings III, LLC), 2018 Refinancing Term Loans, 3 Mo. LIBOR + 4.25%, 1.00% Floor | 5.25% | 09/25/24 | 1,025,249 | ||||
| Human Resource & Employment Services – 0.9% | ||||||||
| 2,978,247 | Alight, Inc. (fka Tempo Acq.), Term Loan B, 1 Mo. LIBOR + 2.75%, 0.00% Floor | 2.92% | 05/01/24 | 2,854,144 | ||||
| Hypermarkets & Super Centers – 2.1% | ||||||||
| 6,971,279 | BJ’s Wholesale Club, Inc., Term Loan B, 1 Mo. LIBOR + 2.25%, 0.00% Floor | 2.44% | 02/05/24 | 6,831,854 | ||||
| Independent Power Producers & Energy Traders – 0.6% | ||||||||
| 1,974,093 | Calpine Corporation, Term Loan B5, 1 Mo. LIBOR + 2.25%, 0.00% Floor | 2.43% | 01/15/24 | 1,932,144 | ||||
| Insurance Brokers – 6.5% | ||||||||
| 2,088,689 | Alliant Holdings I, LLC, 2019 New Term Loan, 1 Mo. LIBOR + 3.25%, 0.00% Floor | 3.42% | 05/10/25 | 1,995,742 | ||||
| 3,290,528 | Alliant Holdings I, LLC, Initial Term Loan, 1 Mo. LIBOR + 2.75%, 0.00% Floor | 2.92% | 05/09/25 | 3,134,590 | ||||
| 5,923,932 | Amwins Group, Inc., Term Loan B (First Lien), 1 Mo. LIBOR + 2.75%, 1.00% Floor | 3.75% | 01/25/24 | 5,815,346 | ||||
| 4,257 | HUB International Limited, 2019 Incremental Term Loan, 1 Mo. LIBOR + 4.00%, 1.00% Floor | 5.00% | 04/25/25 | 4,162 | ||||
| 1,694,384 | HUB International Limited, 2019 Incremental Term Loan, 3 Mo. LIBOR + 4.00%, 1.00% Floor | 5.00% | 04/25/25 | 1,656,311 | ||||
| 17,247 | HUB International Limited, Term Loan B, 2 Mo. LIBOR + 3.00%, 0.00% Floor | 3.87% | 04/25/25 | 16,581 | ||||
| 6,760,907 | HUB International Limited, Term Loan B, 3 Mo. LIBOR + 3.00%, 0.00% Floor | 4.02% | 04/25/25 | 6,499,800 | ||||
| 1,749,481 | USI, Inc. (fka Compass Investors, Inc.), Term Loan B, 1 Mo. LIBOR + 3.00%, 0.00% Floor | 3.17% | 05/15/24 | 1,678,190 | ||||
| 20,800,722 | ||||||||
| Principal Value | Description | Rate (a) | Stated Maturity (b) | Value | ||||
| SENIOR FLOATING-RATE LOAN INTERESTS (c) (Continued) | ||||||||
| Integrated Telecommunication Services – 2.2% | ||||||||
| $6,604,756 | CenturyLink, Inc. (Qwest), Term Loan B, 1 Mo. LIBOR + 2.25%, 0.00% Floor | 2.42% | 03/15/27 | $6,329,205 | ||||
| 725,403 | Numericable (Altice France SA or SFR), Term Loan B-11, 1 Mo. LIBOR + 2.75%, 0.00% Floor | 2.92% | 07/31/25 | 683,243 | ||||
| 7,012,448 | ||||||||
| Interactive Home Entertainment – 0.4% | ||||||||
| 1,422,544 | Playtika Holding Corp., Term Loan B, 6 Mo. LIBOR + 6.00%, 1.00% Floor | 7.07% | 11/30/24 | 1,421,022 | ||||
| Investment Banking & Brokerage – 0.3% | ||||||||
| 835,855 | Citadel Securities LP, Term Loan B, 1 Mo. LIBOR + 2.75%, 0.00% Floor | 2.92% | 02/27/26 | 817,399 | ||||
| Leisure Facilities – 1.0% | ||||||||
| 3,507,689 | ClubCorp Holdings, Inc., Term Loan B, 3 Mo. LIBOR + 2.75%, 0.00% Floor | 4.20% | 09/18/24 | 3,057,161 | ||||
| Managed Health Care – 5.7% | ||||||||
| 15,580,031 | Multiplan, Inc. (MPH), Term Loan B, 3 Mo. LIBOR + 2.75%, 1.00% Floor | 4.20% | 06/07/23 | 14,934,083 | ||||
| 3,396,553 | Versant Health (Wink Holdco, Inc.), Initial Term Loan, 3 Mo. LIBOR + 3.00%, 1.00% Floor | 4.45% | 12/02/24 | 3,242,009 | ||||
| 18,176,092 | ||||||||
| Metal & Glass Containers – 1.5% | ||||||||
| 5,012,125 | Berry Global, Inc., Term Loan Y, 1 Mo. LIBOR + 2.00%, 0.00% Floor | 2.22% | 07/01/26 | 4,886,822 | ||||
| Movies & Entertainment – 2.2% | ||||||||
| 2,510,640 | AMC Entertainment, Inc., Term Loan B, 6 Mo. LIBOR + 3.00%, 0.00% Floor | 4.08% | 04/22/26 | 1,911,224 | ||||
| 6,778,654 | Cineworld Group PLC (Crown), Term Loan B, 6 Mo. LIBOR + 2.25%, 0.00% Floor | 3.32% | 02/05/25 | 4,987,937 | ||||
| 162,231 | Live Nation Entertainment, Inc., Term Loan B, 1 Mo. LIBOR + 1.75%, 0.00% Floor | 1.94% | 10/17/26 | 151,767 | ||||
| 7,050,928 | ||||||||
| Other Diversified Financial Services – 3.8% | ||||||||
| 9,831,345 | AlixPartners, LLP, Term Loan B, 1 Mo. LIBOR + 2.50%, 0.00% Floor | 2.67% | 04/04/24 | 9,537,683 | ||||
| 2,692,531 | Refinitiv US Holdings, Inc., Term Loan B, 1 Mo. LIBOR + 3.25%, 0.00% Floor | 3.42% | 10/01/25 | 2,650,231 | ||||
| 12,187,914 | ||||||||
| Packaged Foods & Meats – 3.5% | ||||||||
| 3,005,216 | Hostess Brands, LLC (HB Holdings), Term Loan B, 1 Mo. LIBOR + 2.25%, 0.75% Floor | 3.00% | 08/03/25 | 2,912,234 | ||||
| 27,967 | Hostess Brands, LLC (HB Holdings), Term Loan B, 2 Mo. LIBOR + 2.25%, 0.75% Floor | 3.00% | 08/03/25 | 27,101 | ||||
| 8,097,524 | Hostess Brands, LLC (HB Holdings), Term Loan B, 3 Mo. LIBOR + 2.25%, 0.75% Floor | 3.01% | 08/03/25 | 7,846,987 | ||||
| 326,977 | Simply Good Foods (Atkins Nutritionals, Inc.), Term Loan B, 1 Mo. LIBOR + 3.75%, 1.00% Floor | 4.75% | 07/07/24 | 321,255 | ||||
| 11,107,577 | ||||||||
| Principal Value | Description | Rate (a) | Stated Maturity (b) | Value | ||||
| SENIOR FLOATING-RATE LOAN INTERESTS (c) (Continued) | ||||||||
| Paper Packaging – 4.4% | ||||||||
| $1,477,298 | Reynolds Consumer Products, LLC, Initial Term Loans, 1 Mo. LIBOR + 1.75%, 0.00% Floor | 1.92% | 01/31/27 | $1,448,683 | ||||
| 12,987,541 | Reynolds Group Holdings, Inc., U.S. Term Loan, 1 Mo. LIBOR + 2.75%, 0.00% Floor | 2.92% | 02/05/23 | 12,568,173 | ||||
| 14,016,856 | ||||||||
| Pharmaceuticals – 16.3% | ||||||||
| 2,759,011 | Akorn, Inc., Loan, 1 Mo. LIBOR + 14.50%, 1.00% Floor | 15.50% | 04/16/21 | 2,356,002 | ||||
| 5,826,840 | Bausch Health Companies, Inc. (Valeant), First Incremental Term Loan, 1 Mo. LIBOR + 2.75%, 0.00% Floor | 2.92% | 06/01/25 | 5,684,082 | ||||
| 7,636,228 | Bausch Health Companies, Inc. (Valeant), Term Loan B, 1 Mo. LIBOR + 3.00%, 0.00% Floor | 3.17% | 06/01/25 | 7,475,333 | ||||
| 10,407,485 | Endo, LLC, Term Loan B, 1 Mo. LIBOR + 4.25%, 0.75% Floor | 5.00% | 04/29/24 | 9,712,161 | ||||
| 2,461,635 | GoodRX, Inc., Term Loan B, 1 Mo. LIBOR + 2.75%, 0.00% Floor | 3.15% | 10/15/25 | 2,386,555 | ||||
| 3,373,828 | IQVIA, Inc. (Quintiles), Term Loan B3, 3 Mo. LIBOR + 1.75%, 0.00% Floor | 3.20% | 06/11/25 | 3,272,613 | ||||
| 3,022,533 | Mallinckrodt International Finance S.A., 2017 Term Loan B, 3 Mo. LIBOR + 2.75%, 0.75% Floor | 4.20% | 09/24/24 | 2,059,101 | ||||
| 568,520 | Mallinckrodt International Finance S.A., 2018 Incremental Term Loan, 3 Mo. LIBOR + 3.00%, 0.75% Floor | 3.75% | 02/24/25 | 385,263 | ||||
| 3,425,795 | Parexel International Corp., Term Loan B, 1 Mo. LIBOR + 2.75%, 0.00% Floor | 2.92% | 09/27/24 | 3,232,478 | ||||
| 15,534,639 | Pharmaceutical Product Development, Inc. (PPDI/Jaguar), Initial Term Loan, 1 Mo. LIBOR + 2.50%, 1.00% Floor | 3.50% | 08/18/22 | 15,455,102 | ||||
| 52,018,690 | ||||||||
| Research & Consulting Services – 0.1% | ||||||||
| 175,307 | Nielsen Finance, LLC (VNU, Inc.), Term Loan B5, 1 Mo. LIBOR + 3.75%, 1.00% Floor | 4.75% | 06/30/25 | 174,357 | ||||
| Restaurants – 1.2% | ||||||||
| 3,858,019 | 1011778 B.C. Unlimited Liability Company (Restaurant Brands) (aka Burger King/Tim Horton’s), Term Loan B-4, 1 Mo. LIBOR + 1.75%, 0.00% Floor | 1.92% | 11/14/26 | 3,698,875 | ||||
| Semiconductors – 0.9% | ||||||||
| 584,275 | ON Semiconductor Corp., Term Loan B, 1 Mo. LIBOR + 2.00%, 0.00% Floor | 2.17% | 09/19/26 | 567,600 | ||||
| 2,521,590 | Western Digital Corporation, U.S. Term B-4 Loan, 1 Mo. LIBOR + 1.75%, 0.00% Floor | 1.92% | 04/29/23 | 2,466,947 | ||||
| 3,034,547 | ||||||||
| Specialized Consumer Services – 2.0% | ||||||||
| 331,559 | Aramark Services, Inc., Term Loan B-4, 1 Mo. LIBOR + 1.75%, 0.00% Floor | 1.92% | 12/31/26 | 314,878 | ||||
| 160,000 | Asurion, LLC, Second Lien Replacement B-2 Term Loan, 1 Mo. LIBOR + 6.50%, 0.00% Floor | 6.67% | 08/04/25 | 159,101 | ||||
| 6,256,168 | Asurion, LLC, Term Loan B6, 1 Mo. LIBOR + 3.00%, 0.00% Floor | 3.17% | 11/03/23 | 6,088,065 | ||||
| 6,562,044 | ||||||||
| Specialty Chemicals – 1.0% | ||||||||
| 3,381,819 | H.B. Fuller Company, Term Loan B, 1 Mo. LIBOR + 2.00%, 0.00% Floor | 2.17% | 10/20/24 | 3,293,046 | ||||
| Principal Value | Description | Rate (a) | Stated Maturity (b) | Value | ||||
| SENIOR FLOATING-RATE LOAN INTERESTS (c) (Continued) | ||||||||
| Systems Software – 6.6% | ||||||||
| $856,170 | Applied Systems, Inc., 1st Lien Term Loan, 3 Mo. LIBOR + 3.25%, 1.00% Floor | 4.70% | 09/19/24 | $829,594 | ||||
| 4,119,501 | McAfee, LLC, Term Loan B, 1 Mo. LIBOR + 3.75%, 0.00% Floor | 3.92% | 09/30/24 | 4,047,410 | ||||
| 1,257,193 | Misys Financial Software Ltd. (Almonde, Inc.)(Finastra), Term Loan B, 6 Mo. LIBOR + 3.50%, 1.00% Floor | 4.50% | 06/13/24 | 1,139,859 | ||||
| 10,019 | Riverbed Technology, Inc., Term Loan B, 2 Mo. LIBOR + 3.25%, 1.00% Floor | 4.25% | 04/24/22 | 8,647 | ||||
| 3,797,312 | Riverbed Technology, Inc., Term Loan B, 3 Mo. LIBOR + 3.25%, 1.00% Floor | 4.25% | 04/24/22 | 3,277,232 | ||||
| 3,832,400 | SS&C European Holdings, S.a.r.l, Term Loan B-3, 1 Mo. LIBOR + 1.75%, 0.00% Floor | 1.92% | 04/16/25 | 3,705,471 | ||||
| 2,629,401 | SS&C European Holdings, S.a.r.l, Term Loan B-4, 1 Mo. LIBOR + 1.75%, 0.00% Floor | 1.92% | 04/16/25 | 2,542,315 | ||||
| 2,100,861 | SS&C European Holdings, S.a.r.l, Term Loan B-5, 1 Mo. LIBOR + 1.75%, 0.00% Floor | 1.92% | 04/16/25 | 2,032,331 | ||||
| 1,273,961 | SUSE (Marcel Lux IV SARL), Facility B1 USD, 1 Mo. LIBOR + 3.25%, 0.00% Floor | 3.42% | 03/15/26 | 1,210,263 | ||||
| 2,598,876 | Vertafore, Inc., Term Loan B, 1 Mo. LIBOR + 3.25%, 0.00% Floor | 3.42% | 07/02/25 | 2,459,187 | ||||
| 21,252,309 | ||||||||
| Technology Hardware, Storage & Peripherals – 0.5% | ||||||||
| 1,800,496 | Dell International, LLC, Refinancing Term B-1 Loan, 1 Mo. LIBOR + 2.00%, 0.75% Floor | 2.75% | 09/16/25 | 1,766,214 | ||||
| Wireless Telecommunication Services – 0.9% | ||||||||
| 2,913,512 | T-Mobile USA, Inc., Term Loan B, 1 Mo. LIBOR + 3.00%, 0.00% Floor | 3.17% | 04/01/27 | 2,912,842 | ||||
Total Senior Floating-Rate Loan Interests | 436,965,500 | |||||||
| (Cost $459,596,251) | ||||||||
| Principal Value | Description | Stated Coupon | Stated Maturity | Value | ||||
| CORPORATE BONDS AND NOTES (c) – 0.4% | ||||||||
| Paper Packaging – 0.4% | ||||||||
| 1,377,000 | Reynolds Group Issuer, Inc./Reynolds Group Issuer, LLC/Reynolds Group Issuer Lu. (d) | 7.00% | 07/15/24 | 1,387,541 | ||||
| (Cost $1,404,045) | ||||||||
| Shares | Description | Value | ||
| MONEY MARKET FUNDS (c) – 2.0% | ||||
| 6,332,108 | Morgan Stanley Institutional Liquidity Funds - Treasury Portfolio - Institutional Class - 0.05% (e) | 6,332,108 | ||
| (Cost $6,332,108) | ||||
Total Investments – 139.1% | 444,685,149 | |||
| (Cost $467,332,404) (f) | ||||
Outstanding Loans – (36.3)% | (116,000,000) | |||
Net Other Assets and Liabilities – (2.8)% | (8,955,485) | |||
Net Assets – 100.0% | $319,729,664 | |||
| (a) | Senior Floating-Rate Loan Interests (“Senior Loans”) in which the Fund invests pay interest at rates which are periodically predetermined by reference to a base lending rate plus a premium. These base lending rates are generally (i) the lending rate offered by one or more major European banks, such as the LIBOR, (ii) the prime rate offered by one or more United States banks or (iii) the certificate of deposit rate. Certain Senior Loans are subject to a LIBOR floor that establishes a minimum LIBOR rate. When a range of rates is disclosed, the Fund holds more than one contract within the same tranche with identical LIBOR period, spread and floor, but different LIBOR reset dates. |
| (b) | Senior Loans generally are subject to mandatory and/or optional prepayment. As a result, the actual remaining maturity of Senior Loans may be substantially less than the stated maturities shown. |
| (c) | All of these securities are available to serve as collateral for the outstanding loans. |
| (d) | This security, sold within the terms of a private placement memorandum, is exempt from registration upon resale under Rule 144A under the Securities Act of 1933, as amended, and may be resold in transactions exempt from registration, normally to qualified institutional buyers. Pursuant to procedures adopted by the Fund’s Board of Trustees, this security has been determined to be liquid by First Trust Advisors L.P. (the “Advisor”). Although market instability can result in periods of increased overall market illiquidity, liquidity for each security is determined based on security specific factors and assumptions, which require subjective judgment. At May 31, 2020, securities noted as such amounted to $1,387,541 or 0.4% of net assets. |
| (e) | Rate shown reflects yield as of May 31, 2020. |
| (f) | Aggregate cost for federal income tax purposes was $467,917,706. As of May 31, 2020, the aggregate gross unrealized appreciation for all investments in which there was an excess of value over tax cost was $613,791 and the aggregate gross unrealized depreciation for all investments in which there was an excess of tax cost over value was $23,846,348. The net unrealized depreciation was $23,232,557. |
| LIBOR | London Interbank Offered Rate |
| Total Value at 5/31/2020 | Level 1 Quoted Prices | Level 2 Significant Observable Inputs | Level 3 Significant Unobservable Inputs | |
Senior Floating-Rate Loan Interests* | $ 436,965,500 | $ — | $ 436,965,500 | $ — |
Corporate Bonds and Notes* | 1,387,541 | — | 1,387,541 | — |
Money Market Funds | 6,332,108 | 6,332,108 | — | — |
Total Investments | $ 444,685,149 | $ 6,332,108 | $ 438,353,041 | $— |
| * | See Portfolio of Investments for industry breakout. |
| ASSETS: | |
Investments, at value (Cost $467,332,404) | $ 444,685,149 |
Cash | 52,594 |
| Receivables: | |
Investment securities sold | 7,039,197 |
Interest | 892,793 |
Prepaid expenses | 22,426 |
Total Assets | 452,692,159 |
| LIABILITIES: | |
Outstanding loans | 116,000,000 |
| Payables: | |
Investment securities purchased | 16,223,325 |
Investment advisory fees | 301,442 |
Interest and fees on loans | 166,201 |
Excise tax | 123,268 |
Audit and tax fees | 59,755 |
Administrative fees | 29,256 |
Custodian fees | 21,116 |
Shareholder reporting fees | 18,253 |
Legal fees | 7,564 |
Transfer agent fees | 5,107 |
Trustees’ fees and expenses | 2,736 |
Financial reporting fees | 771 |
Other liabilities | 3,701 |
Total Liabilities | 132,962,495 |
NET ASSETS | $319,729,664 |
| NET ASSETS consist of: | |
Paid-in capital | $ 351,752,183 |
Par value | 358,316 |
Accumulated distributable earnings (loss) | (32,380,835) |
NET ASSETS | $319,729,664 |
NET ASSET VALUE, per Common Share (par value $0.01 per Common Share) | $8.92 |
Number of Common Shares outstanding (unlimited number of Common Shares has been authorized) | 35,831,569 |
| INVESTMENT INCOME: | ||
Interest | $ 22,138,763 | |
Other | 222,227 | |
Total investment income | 22,360,990 | |
| EXPENSES: | ||
Investment advisory fees | 3,863,373 | |
Interest and fees on loans | 3,292,491 | |
Administrative fees | 287,942 | |
Excise tax expense | 194,270 | |
Shareholder reporting fees | 63,366 | |
Custodian fees | 63,271 | |
Audit and tax fees | 61,237 | |
Legal fees | 45,374 | |
Listing expense | 35,757 | |
Transfer agent fees | 19,997 | |
Trustees’ fees and expenses | 16,684 | |
Financial reporting fees | 9,250 | |
Other | 29,260 | |
Total expenses | 7,982,272 | |
NET INVESTMENT INCOME (LOSS) | 14,378,718 | |
| NET REALIZED AND UNREALIZED GAIN (LOSS): | ||
Net realized gain (loss) on investments | (7,431,479) | |
Net change in unrealized appreciation (depreciation) on investments | (15,085,573) | |
NET REALIZED AND UNREALIZED GAIN (LOSS) | (22,517,052) | |
NET INCREASE (DECREASE) IN NET ASSETS RESULTING FROM OPERATIONS | $(8,138,334) | |
| Year Ended 5/31/2020 | Year Ended 5/31/2019 | ||
| OPERATIONS: | |||
Net investment income (loss) | $ 14,378,718 | $ 17,056,900 | |
Net realized gain (loss) | (7,431,479) | (1,907,106) | |
Net change in unrealized appreciation (depreciation) | (15,085,573) | (3,932,731) | |
Net increase (decrease) in net assets resulting from operations | (8,138,334) | 11,217,063 | |
| DISTRIBUTIONS TO SHAREHOLDERS FROM: | |||
Investment operations | (11,774,254) | (17,152,572) | |
Total increase (decrease) in net assets | (19,912,588) | (5,935,509) | |
| NET ASSETS: | |||
Beginning of period | 339,642,252 | 345,577,761 | |
End of period | $ 319,729,664 | $ 339,642,252 | |
| COMMON SHARES: | |||
Common Shares at end of period | 35,831,569 | 35,831,569 |
| Cash flows from operating activities: | ||
Net increase (decrease) in net assets resulting from operations | $(8,138,334) | |
| Adjustments to reconcile net increase (decrease) in net assets resulting from operations to net cash provided by operating activities: | ||
Purchases of investments | (455,201,584) | |
Sales, maturities and paydown of investments | 483,911,731 | |
Net amortization/accretion of premiums/discounts on investments | (363,548) | |
Net realized gain/loss on investments | 7,431,479 | |
Net change in unrealized appreciation/depreciation on investments | 15,085,573 | |
| Changes in assets and liabilities: | ||
Decrease in interest receivable | 587,468 | |
Decrease in prepaid expenses | 553 | |
Decrease in interest and fees payable on loans | (80,181) | |
Decrease in investment advisory fees payable | (49,609) | |
Decrease in audit and tax fees payable | (3,189) | |
Increase in legal fees payable | 3,567 | |
Decrease in shareholder reporting fees payable | (7,792) | |
Increase in administrative fees payable | 1,654 | |
Increase in custodian fees payable | 5,020 | |
Increase in transfer agent fees payable | 1,255 | |
Increase in Trustees’ fees and expenses payable | 191 | |
Increase in excise tax payable | 123,268 | |
Decrease in other liabilities payable | (1,081) | |
Cash provided by operating activities | $43,306,441 | |
| Cash flows from financing activities: | ||
Distributions to Common Shareholders from investment operations | (11,774,254) | |
Repayment of borrowings | (126,000,000) | |
Proceeds from borrowings | 94,000,000 | |
Cash used in financing activities | (43,774,254) | |
Decrease in cash | (467,813) | |
Cash at beginning of period | 520,407 | |
Cash at end of period | $52,594 | |
| Supplemental disclosure of cash flow information: | ||
Cash paid during the period for interest and fees | $3,372,672 | |
Cash paid during the year for excise taxes | $71,002 |
| Year Ended | Period Ended 5/31/2017 (a) | ||||||
| 5/31/2020 | 5/31/2019 | 5/31/2018 | |||||
Net asset value, beginning of period | $ 9.48 | $ 9.64 | $ 9.88 | $ 9.85 | |||
| Income from investment operations: | |||||||
Net investment income (loss) | 0.40 | 0.48 | 0.47 | 0.17 | |||
Net realized and unrealized gain (loss) | (0.63) | (0.16) | (0.21) | 0.00 (b) | |||
Total from investment operations | (0.23) | 0.32 | 0.26 | 0.17 | |||
| Distributions paid to shareholders from: | |||||||
Net investment income | (0.33) | (0.48) | (0.50) | (0.13) | |||
Common Shares offering costs charged to paid-in capital | — | — | — | (0.02) | |||
Premiums from shares sold in at the market offering | — | — | — | 0.01 | |||
Net asset value, end of period | $8.92 | $9.48 | $9.64 | $9.88 | |||
Market value, end of period | $8.26 | $8.87 | $9.37 | $10.00 | |||
Total return based on net asset value (c) | (2.30)% | 3.67% | 2.83% | 1.59% | |||
Total return based on market value (c) | (3.30)% | (0.21)% | (1.24)% | 1.28% | |||
| Ratios to average net assets/supplemental data: | |||||||
Net assets, end of period (in 000’s) | $ 319,730 | $ 339,642 | $ 345,578 | $ 353,941 | |||
Ratio of total expenses to average net assets | 2.41% | 2.66% | 2.10% | 1.69% (d) | |||
Ratio of total expenses to average net assets excluding interest expense | 1.41% | 1.38% | 1.33% | 1.28% (d) | |||
Ratio of net investment income (loss) to average net assets | 4.34% | 5.01% | 4.84% | 3.86% (d) | |||
Portfolio turnover rate | 68% | 61% | 95% | 61% | |||
| Indebtedness: | |||||||
Total loans outstanding (in 000’s) | $ 116,000 | $ 148,000 | $ 119,000 | $ 128,000 | |||
Asset coverage per $1,000 of indebtedness (e) | $ 3,756 | $ 3,295 | $ 3,904 | $ 3,765 | |||
| (a) | The Fund was seeded on November 15, 2016 and commenced operations on December 21, 2016. |
| (b) | Amount represents less than $0.01 per share. |
| (c) | Total return is based on the combination of reinvested dividend, capital gain and return of capital distributions, if any, at prices obtained by the Dividend Reinvestment Plan, and changes in net asset value per share for net asset value returns and changes in Common Share Price for market value returns. Total returns do not reflect sales load and are not annualized for periods of less than one year. Past performance is not indicative of future results. |
| (d) | Annualized. |
| (e) | Calculated by subtracting the Fund’s total liabilities (not including the loans outstanding) from the Fund’s total assets, and dividing by the outstanding loans balance in 000’s. |
| 1) | the fundamental business data relating to the borrower; |
| 2) | an evaluation of the forces which influence the market in which these securities are purchased and sold; |
| (1) | The terms “security” and “securities” used throughout the Notes to Financial Statements include Senior Loans. |
| 3) | the type, size and cost of the security; |
| 4) | the financial statements of the borrower; |
| 5) | the credit quality and cash flow of the borrower, based on the Advisor’s or external analysis; |
| 6) | the information as to any transactions in or offers for the security; |
| 7) | the price and extent of public trading in similar securities (or equity securities) of the borrower, or comparable companies; |
| 8) | the coupon payments; |
| 9) | the quality, value and salability of collateral, if any, securing the security; |
| 10) | the business prospects of the borrower, including any ability to obtain money or resources from a parent or affiliate and an assessment of the borrower’s management; |
| 11) | the prospects for the borrower’s industry, and multiples (of earnings and/or cash flows) being paid for similar businesses in that industry; |
| 12) | the borrower’s competitive position within the industry; |
| 13) | the borrower’s ability to access additional liquidity through public and/or private markets; and |
| 14) | other relevant factors. |
| 1) | benchmark yields; |
| 2) | reported trades; |
| 3) | broker/dealer quotes; |
| 4) | issuer spreads; |
| 5) | benchmark securities; |
| 6) | bids and offers; and |
| 7) | reference data including market research publications. |
| 1) | the type of security; |
| 2) | the size of the holding; |
| 3) | the initial cost of the security; |
| 4) | transactions in comparable securities; |
| 5) | price quotes from dealers and/or third-party pricing services; |
| 6) | relationships among various securities; |
| 7) | information obtained by contacting the issuer, analysts, or the appropriate stock exchange; |
| 8) | an analysis of the issuer’s financial statements; and |
| 9) | the existence of merger proposals or tender offers that might affect the value of the security. |
| • | Level 1 – Level 1 inputs are quoted prices in active markets for identical investments. An active market is a market in which transactions for the investment occur with sufficient frequency and volume to provide pricing information on an ongoing basis. |
| • | Level 2 – Level 2 inputs are observable inputs, either directly or indirectly, and include the following: |
| o | Quoted prices for similar investments in active markets. |
| o | Quoted prices for identical or similar investments in markets that are non-active. A non-active market is a market where there are few transactions for the investment, the prices are not current, or price quotations vary substantially either over time or among market makers, or in which little information is released publicly. |
| o | Inputs other than quoted prices that are observable for the investment (for example, interest rates and yield curves observable at commonly quoted intervals, volatilities, prepayment speeds, loss severities, credit risks, and default rates). |
| o | Inputs that are derived principally from or corroborated by observable market data by correlation or other means. |
| • | Level 3 – Level 3 inputs are unobservable inputs. Unobservable inputs may reflect the reporting entity’s own assumptions about the assumptions that market participants would use in pricing the investment. |
| Distributions paid from: | 2020 | 2019 |
Ordinary income | $11,774,254 | $17,152,572 |
Capital gains | — | — |
Return of capital | — | — |
Undistributed ordinary income | $4,262,569 |
Undistributed capital gains | — |
Total undistributed earnings | 4,262,569 |
Accumulated capital and other losses | (13,410,847) |
Net unrealized appreciation (depreciation) | (23,232,557) |
Total accumulated earnings (losses) | (32,380,835) |
Other | — |
Paid-in capital | 352,110,499 |
Total net assets | $319,729,664 |

| (1) | If Common Shares are trading at or above net asset value (“NAV”) at the time of valuation, the Fund will issue new shares at a price equal to the greater of (i) NAV per Common Share on that date or (ii) 95% of the market price on that date. |
| (2) | If Common Shares are trading below NAV at the time of valuation, the Plan Agent will receive the dividend or distribution in cash and will purchase Common Shares in the open market, on the NYSE or elsewhere, for the participants’ accounts. It is possible that the market price for the Common Shares may increase before the Plan Agent has completed its purchases. Therefore, the average purchase price per share paid by the Plan Agent may exceed the market price at the time of valuation, resulting in the purchase of fewer shares than if the dividend or distribution had been paid in Common Shares issued by the Fund. The Plan Agent will use all dividends and distributions received in cash to purchase Common Shares in the open market within 30 days of the valuation date except where temporary curtailment or suspension of purchases is necessary to comply with federal securities laws. Interest will not be paid on any uninvested cash payments. |
| Name, Year of Birth and Position with the Fund | Term of Office and Year First Elected or Appointed(1) | Principal Occupations During Past 5 Years | Number of Portfolios in the First Trust Fund Complex Overseen by Trustee | Other Trusteeships or Directorships Held by Trustee During Past 5 Years |
| INDEPENDENT TRUSTEES | ||||
| Richard E. Erickson, Trustee (1951) | • Three Year Term • Since Fund Inception | Physician; Officer, Wheaton Orthopedics; Limited Partner, Gundersen Real Estate Limited Partnership (June 1992 to December 2016); Member, Sportsmed LLC (April 2007 to November 2015) | 179 | None |
| Thomas R. Kadlec, Trustee (1957) | • Three Year Term • Since Fund Inception | President, ADM Investor Services, Inc. (Futures Commission Merchant) | 179 | Director of ADM Investor Services, Inc., ADM Investor Services International, Futures Industry Association, and National Futures Association |
| Robert F. Keith, Trustee (1956) | • Three Year Term • Since Fund Inception | President, Hibs Enterprises (Financial and Management Consulting) | 179 | Director of Trust Company of Illinois |
| Niel B. Nielson, Trustee (1954) | • Three Year Term • Since Fund Inception | Senior Advisor (August 2018 to Present), Managing Director and Chief Operating Officer (January 2015 to August 2018), Pelita Harapan Educational Foundation (Educational Products and Services); President and Chief Executive Officer (June 2012 to September 2014), Servant Interactive LLC (Educational Products and Services); President and Chief Executive Officer (June 2012 to September 2014), Dew Learning LLC (Educational Products and Services) | 179 | None |
| INTERESTED TRUSTEE | ||||
| James A. Bowen(2), Trustee and Chairman of the Board (1955) | • Three Year Term • Since Fund Inception | Chief Executive Officer, First Trust Advisors L.P. and First Trust Portfolios L.P.; Chairman of the Board of Directors, BondWave LLC (Software Development Company) and Stonebridge Advisors LLC (Investment Advisor) | 179 | None |
| (1) | Currently, James A. Bowen and Robert F. Keith, as Class III Trustees, are serving as trustees until the Fund’s 2020 annual meeting of shareholders. Richard E. Erickson and Thomas R. Kadlec, as Class I Trustees, are serving as trustees until the Fund’s 2021 annual meeting of shareholders. Niel B. Nielson, as a Class II Trustee, is serving as a trustee until the Fund’s 2022 annual meeting of shareholders. |
| (2) | Mr. Bowen is deemed an “interested person” of the Fund due to his position as CEO of First Trust Advisors L.P., investment advisor of the Fund. |
| Name and Year of Birth | Position and Offices with Fund | Term of Office and Length of Service | Principal Occupations During Past 5 Years |
| OFFICERS(3) | |||
| James M. Dykas (1966) | President and Chief Executive Officer | • Indefinite Term • Since Fund Inception | Managing Director and Chief Financial Officer (January 2016 to Present), Controller (January 2011 to January 2016), Senior Vice President (April 2007 to January 2016), First Trust Advisors L.P. and First Trust Portfolios L.P.; Chief Financial Officer (January 2016 to Present), BondWave LLC (Software Development Company) and Stonebridge Advisors LLC (Investment Advisor) |
| Donald P. Swade (1972) | Treasurer, Chief Financial Officer and Chief Accounting Officer | • Indefinite Term • Since Fund Inception | Senior Vice President (July 2016 to Present), Vice President (April 2012 to July 2016), First Trust Advisors L.P. and First Trust Portfolios L.P. |
| W. Scott Jardine (1960) | Secretary and Chief Legal Officer | • Indefinite Term • Since Fund Inception | General Counsel, First Trust Advisors L.P. and First Trust Portfolios L.P.; Secretary and General Counsel, BondWave LLC; Secretary, Stonebridge Advisors LLC |
| Daniel J. Lindquist (1970) | Vice President | • Indefinite Term • Since Fund Inception | Managing Director, First Trust Advisors L.P. and First Trust Portfolios L.P. |
| Kristi A. Maher (1966) | Chief Compliance Officer and Assistant Secretary | • Indefinite Term • Since Fund Inception | Deputy General Counsel, First Trust Advisors L.P. and First Trust Portfolios L.P. |
| (3) | The term “officer” means the president, vice president, secretary, treasurer, controller or any other officer who performs a policy making function. |
| • | Information we receive from you and your broker-dealer, investment advisor or financial representative through interviews, applications, agreements or other forms; |
| • | Information about your transactions with us, our affiliates or others; |
| • | Information we receive from your inquiries by mail, e-mail or telephone; and |
| • | Information we collect on our website through the use of “cookies”. For example, we may identify the pages on our website that your browser requests or visits. |
| • | In order to provide you with products and services and to effect transactions that you request or authorize, we may disclose your personal information as described above to unaffiliated financial service providers and other companies that perform administrative or other services on our behalf, such as transfer agents, custodians and trustees, or that assist us in the distribution of investor materials such as trustees, banks, financial representatives, proxy services, solicitors and printers. |
| • | We may release information we have about you if you direct us to do so, if we are compelled by law to do so, or in other legally limited circumstances (for example to protect your account from fraud). |
FUND ACCOUNTANT, AND
CUSTODIAN
PUBLIC ACCOUNTING FIRM
Item 2. Code of Ethics.
| (a) | The registrant, as of the end of the period covered by this report, has adopted a code of ethics that applies to the registrant’s principal executive officer, principal financial officer, principal accounting officer or controller, or persons performing similar functions, regardless of whether these individuals are employed by the registrant or a third party. |
| (c) | There have been no amendments, during the period covered by this report, to a provision of the code of ethics that applies to the registrant’s principal executive officer, principal financial officer, principal accounting officer or controller, or persons performing similar functions, regardless of whether these individuals are employed by the registrant or a third party, and that relates to any element of the code of ethics description. |
| (d) | The registrant has not granted any waivers, including an implicit waiver, from a provision of the code of ethics that applies to the registrant’s principal executive officer, principal financial officer, principal accounting officer or controller, or persons performing similar functions, regardless of whether these individuals are employed by the registrant or a third party, that relates to one or more of the items set forth in paragraph (b) of this item’s instructions. |
| (e) | Not applicable. |
Item 3. Audit Committee Financial Expert.
As of the end of the period covered by the report, the registrant’s Board of Trustees has determined that Thomas R. Kadlec and Robert F. Keith are qualified to serve as audit committee financial experts serving on its audit committee and that each of them is “independent,” as defined by Item 3 of Form N-CSR.
Item 4. Principal Accountant Fees and Services.
(a) AUDIT FEES (REGISTRANT) -- The aggregate fees billed for each of the last two fiscal years for professional services rendered by the principal accountant for the audit of the registrant’s annual financial statements or services that are normally provided by the accountant in connection with statutory and regulatory filings or engagements were $57,000 for 2019 and $57,000 for 2020.
(b) AUDIT-RELATED FEES (REGISTRANT) -- The aggregate fees billed in each of the last two fiscal years, for assurance and related services by the principal accountant that are reasonably related to the performance of the audit of the registrant’s financial statements and are not reported under paragraph (a) of this Item were $0 for 2019 and $0 for 2020.
AUDIT-RELATED FEES (INVESTMENT ADVISER) -- The aggregate fees billed in each of the last two fiscal years of the registrant for assurance and related services by the principal accountant that are reasonably related to the performance of the audit of the Registrant’s financial statements and are not reported under paragraph (a) of this Item were $0 for 2019 and $0 for 2020.
(c) TAX FEES (REGISTRANT) -- The aggregate fees billed in each of the last two fiscal years for professional services rendered by the principal accountant for tax compliance, tax advice, and tax planning to the registrant were $5,200 for 2019 and $5,288 for 2020.
TAX FEES (INVESTMENT ADVISER) -- The aggregate fees billed in each of the last two fiscal years of the registrant for professional services rendered by the principal accountant for tax compliance, tax advice, and tax planning to the registrant’s adviser were $0 for 2019 and $0 for 2020.
(d) ALL OTHER FEES (REGISTRANT) -- The aggregate fees billed in each of the last two fiscal years for products and services provided by the principal accountant to the registrant, other than the services reported in paragraphs (a) through (c) of this Item were $0 for 2019 and $0 for 2020.
ALL OTHER FEES (INVESTMENT ADVISER) -- The aggregate fees billed in each of the last two fiscal years for products and services provided by the principal accountant to the Registrant’s investment adviser, other than services reported in paragraphs (a) through (c) of this Item were $0 for 2019 and $0 for 2020.
| (e)(1) | Disclose the audit committee’s pre-approval policies and procedures described in paragraph (c)(7) of Rule 2-01 of Regulation S-X. |
Pursuant to its charter and its Audit and Non-Audit Services Pre-Approval Policy, the Audit Committee (the “Committee”) is responsible for the pre-approval of all audit services and permitted non-audit services (including the fees and terms thereof) to be performed for the Registrant by its independent auditors. The Chairman of the Committee is authorized to give such pre-approvals on behalf of the Committee up to $25,000 and report any such pre-approval to the full Committee.
The Committee is also responsible for the pre-approval of the independent auditor’s engagements for non-audit services with the Registrant’s adviser (not including a sub-adviser whose role is primarily portfolio management and is sub-contracted or overseen by another investment adviser) and any entity controlling, controlled by or under common control with the investment adviser that provides ongoing services to the Registrant, if the engagement relates directly to the operations and financial reporting of the Registrant, subject to the de minimis exceptions for non-audit services described in Rule 2-01 of Regulation S-X. If the independent auditor has provided non-audit services to the Registrant’s adviser (other than any sub-adviser whose role is primarily portfolio management and is sub-contracted with or overseen by another investment adviser) and any entity controlling, controlled by or under common control with the investment adviser that provides ongoing services to the Registrant that were not pre-approved pursuant to its policies, the Committee will consider whether the provision of such non-audit services is compatible with the auditor’s independence.
| (e)(2) | The percentage of services described in each of paragraphs (b) through (d) for the Registrant and the Registrant’s investment adviser of this Item that were approved by the audit committee pursuant to the pre-approval exceptions included in paragraph (c)(7)(i)(c) or paragraph (c)(7)(ii) of Rule 2-01 of Regulation S-X are as follows: |
(b) 0%
(c) 0%
(d) 0%
| (f) | The percentage of hours expended on the principal accountant’s engagement to audit the registrant’s financial statements for the most recent fiscal year that were attributed to work performed by persons other than the principal accountant’s full-time, permanent employees was less than fifty percent. |
| (g) | The aggregate non-audit fees billed by the registrant’s accountant for services rendered to the registrant, and rendered to the registrant’s investment adviser (not including any sub-adviser whose role is primarily portfolio management and is subcontracted with or overseen by another investment adviser), and any entity controlling, controlled by, or under common control with the adviser that provides ongoing services to the Registrant for the fiscal year ended May 31, 2019 were $5,200 for the Registrant and $19,800 for the Registrant’s investment adviser and for the fiscal year ended May 31, 2020 were $5,288 for the Registrant and $60,670 for the Registrant’s investment adviser. |
| (h) | The Registrant’s audit committee of its Board of Trustees determined that the provision of non-audit services that were rendered to the Registrant’s investment adviser (not including any sub-adviser whose role is primarily portfolio management and is subcontracted with or overseen by another investment adviser), and any entity controlling, controlled by, or under common control with the investment adviser that provides ongoing services to the Registrant that were not pre-approved pursuant to paragraph (c)(7)(ii) of Rule 2-01 of Regulation S-X is compatible with maintaining the principal accountant’s independence. |
Item 5. Audit Committee of Listed Registrants.
| (a) | The registrant has a separately designated standing audit committee consisting of all the independent trustees of the registrant. The members of the audit committee are: Thomas R. Kadlec, Niel B. Nielson, Richard E. Erickson and Robert F. Keith. |
Item 6. Investments.
| (a) | Schedule of Investments in securities of unaffiliated issuers as of the close of the reporting period is included as part of the report to shareholders filed under Item 1 of this form. |
| (b) | Not applicable. |
Item 7. Disclosure of Proxy Voting Policies and Procedures for Closed-End Management Investment Companies.
The Proxy Voting Policies are attached herewith.
Item 8. Portfolio Managers of Closed-End Management Investment Companies.
(a)(1) Identification of Portfolio Manager(s) or Management Team Members and Description of Role of Portfolio Manager(s) or Management Team Members
Information provided as of May 31, 2020
The First Trust Advisors Leveraged Finance Investment team manages a portfolio comprised primarily of U.S. dollar denominated, senior secured floating-rate loans. The Portfolio Managers are responsible for directing the investment activities within the Fund. William Housey is the Senior Portfolio Manager and has primary responsibility for investment decisions. Scott Fries assists Mr. Housey and there are also Senior Credit Analysts assigned to certain industries. The Portfolio Managers are supported in their portfolio management activities by the First Trust Advisors Leveraged Finance investment team, including a team of credit analysts, a designated trader and operations personnel. Senior Credit Analysts are assigned industries and Associate Credit Analysts support the Senior Credit Analysts. All credit analysts, operations personnel and portfolio managers report to Mr. Housey.
William Housey, CFA
Managing Director of Fixed Income, Senior Portfolio Manager
Mr. Housey joined First Trust in June 2010 as the Senior Portfolio Manager for the Leveraged Finance
Investment Team and has 23 years of investment experience. Mr. Housey is a Senior Vice President of First Trust. Prior to joining First Trust, Mr. Housey was at Morgan Stanley/Van Kampen Funds, Inc. for 11 years and served as Executive Director and Co-Portfolio Manager. Mr. Housey has extensive experience in portfolio management of both leveraged and unleveraged credit products, including bank loans, high yield bonds, credit derivatives and corporate restructurings. Mr. Housey received a BS in Finance from Eastern Illinois University and an MBA in Finance and Management and Strategy from Northwestern University’s Kellogg School of Business. He holds the FINRA Series 7, Series 52 and Series 63 licenses and the Chartered Financial Analyst designation. He is a member of the CFA Institute and the CFA Society of Chicago.
Jeffrey Scott, CFA
Senior-Vice President, Deputy Credit Officer, Portfolio Manager
Mr. Scott, CFA, joined First Trust in June 2010 as a Portfolio Manager in the Leveraged Finance Investment Team and has 30 years of investment management industry experience and has extensive experience in credit analysis, product development and product management. Prior to joining First Trust, Mr. Scott served as an Assistant Portfolio Manager and as a Senior Credit Analyst for Morgan Stanley/Van Kampen from October 2008 to June 2010. As Assistant Portfolio Manager, Mr. Scott served on a team that managed over $4.0 billion of Senior Loan assets in three separate funds: Van Kampen Senior Loan Fund; Van Kampen Senior Income Trust; and Van Kampen Dynamic Credit Opportunities Fund. His responsibilities included assisting with portfolio construction, buy and sell decision making, and monitoring fund liquidity and leverage. Mr. Scott earned a B.S. in Finance and Economics from Elmhurst College and an M.B.A. with specialization in Analytical Finance and Econometrics and Statistics from the University of Chicago. He also holds the Chartered Financial Analyst designation and is a member of the CFA Institute and the CFA Society of Chicago.
Orlando Purpura,CFA
Senior Vice President, Chief Credit Officer, Portfolio Manage
Mr. Purpura joined First Trust in May 2013 as Chief Credit Officer of the Leveraged Finance Investment Team and has 30 years of investment industry experience. Prior to joining FTA, Mr. Purpura was at Allstate Investments LLC where he served as Portfolio Manager in the Equity Special Situations Group that invested in the public equity of companies in various stages of distress. Additionally, he also was a Portfolio Manager in the Private Placement Group where he completed corporate restructurings and workouts for troubled credits held in the investment portfolio. Prior to Allstate Investments, Mr. Purpura was a founding partner at Tall Tree Investment Management LLC, an institutional money manager that focuses on Senior Secured Bank Loans in structured finance vehicles. Before moving to Tall Tree, Mr. Purpura was a Senior Distressed Debt Analyst and Workout Specialist at Van Kampen Investments where he specialized in leading the credit oversight and trading strategy for workouts and restructurings across various industries. In the early 1990s, Mr. Purpura began his credit career at Sanwa Business Credit Corporation, a company that specialized in below investment grade non-traditional lending and leasing. Mr. Purpura received a B.S. in Finance from Elmhurst College and an M.B.A. in Finance from DePaul University. Mr. Purpura holds the Chartered Financial Analyst designation and is a member of the CFA Institute and the CFA Society of Chicago. He also holds the Chartered Market Technician designation and is a member of the Market Technicians Association, Chicago Chapter.
(a)(2) Other Accounts Managed by Portfolio Manager(s) or Management Team Member and Potential Conflicts of Interest
Information provided as of May 31, 2020
| Name of Portfolio Manager or Team Member | Type of Accounts | Total # of Accounts | Total Assets | # of Accounts Managed for which Advisory Fee is Based on Performance | Total Assets for which Advisory Fee is Based on Performance |
| 1. William Housey, CFA | Registered Investment Companies: | 5 | $3.664B | 0 | $0 |
| Other Pooled Investment Vehicles: | 0 | $0 | 0 | $0 | |
| Other Accounts: | 0 | $0 | 0 | $0 | |
| 2. Scott Fries, CFA | Registered Investment Companies: | 5 | $3.664B | 0 | $0 |
| Other Pooled Investment Vehicles: | 0 | $0 | 0 | $0 | |
| Other Accounts: | 0 | $0 | 0 | $0 | |
| 3. Orlando Purpura, CFA | Registered Investment Companies: | 5 | $3.664B | 0 | $0 |
| Other Pooled Investment Vehicles: | 0 | $0 | 0 | $0 | |
| Other Accounts: | 0 | $0 | 0 | $0 |
* Information excludes the registrant.
Potential Conflicts of Interests
Potential conflicts of interest may arise when a portfolio manager of the Registrant has day-to-day management responsibilities with respect to one or more other funds or other accounts. The First Trust Advisors Leveraged Finance Investment Team adheres to its trade allocation policy utilizing a pro-rata methodology to address this conflict.
First Trust and its affiliate, First Trust Portfolios L.P. (“FTP”), have in place a joint Code of Ethics and Insider Trading Policies and Procedures that are designed to (a) prevent First Trust personnel from trading securities based upon material inside information in the possession of such personnel and (b) ensure that First Trust personnel avoid actual or potential conflicts of interest or abuse of their positions of trust and responsibility that could occur through such activities as front running securities trades for the Registrant. Personnel are required to have duplicate confirmations and account statements delivered to First Trust and FTP compliance personnel who then compare such trades to trading activity to detect any potential conflict situations. In addition to the personal trading restrictions specified in the Code of Ethics and Insider Trading Policies and Procedures, employees in the First Trust Advisors Leveraged Finance Investment Team are prohibited from buying or selling equity securities (including derivative instruments such as options, warrants and futures) and corporate bonds for their personal account and in any accounts over which they exercise control. Employees in the First Trust Advisors Leveraged Finance Investment Team are also prohibited from engaging in any personal transaction while in possession of material non-public information regarding the security or the issuer of the security. First Trust and FTP also maintain a restricted list of all issuers for which the First Trust Advisors Leveraged Finance Investment Team has material non-public information in its possession and all transactions executed for a product advised or supervised by First Trust or FTP are compared daily against the restricted list.
| (a)(3) | Compensation Structure of Portfolio Manager(s) or Management Team Members |
Information provided as of May 31, 2020
The compensation structure for the First Trust Advisors Leveraged Finance Investment Team is based upon a fixed salary as well as a discretionary bonus determined by the management of First Trust.
Salaries are determined by management and are based upon an individual’s position and overall value to the firm. The compensation structure for internal portfolio managers is based upon a fixed salary as well as a discretionary bonus determined by the management of FTA. Bonuses are also determined by management and are based upon an individual’s overall contribution to the success of the firm and the profitability of the firm; however, assets under management may be a factor in determining bonus size for certain portfolio manager groups. Salaries and bonuses are not based on fund performance.
| (a)(4) | Disclosure of Securities Ownership as of May 31, 2020 |
Name of Portfolio Manager or Team Member | Dollar ($) Range of Fund Shares Beneficially Owned |
William Housey |
$1 - $10,000 |
Jeffrey Scott |
$10,001 - $50,000 |
| Orlando Purpura | $1 - $10,000 |
| (b) | Not applicable. |
Item 9. Purchases of Equity Securities by Closed-End Management Investment Company and Affiliated Purchasers.
Not applicable.
Item 10. Submission of Matters to a Vote of Security Holders.
There have been no material changes to the procedures by which the shareholders may recommend nominees to the registrant’s Board of Trustees, where those changes were implemented after the registrant last provided disclosure in response to the requirements of Item 407(c)(2)(iv) of Regulation S-K (17 CFR 229.407) (as required by Item 22(b)(15) of Schedule 14A (17 CFR 240.14a-101)), or this Item.
Item 11. Controls and Procedures.
| (a) | The registrant’s principal executive and principal financial officers, or persons performing similar functions, have concluded that the registrant’s disclosure controls and procedures (as defined in Rule 30a-3(c) under the Investment Company Act of 1940, as amended (the “1940 Act”) (17 CFR 270.30a-3(c))) are effective, as of a date within 90 days of the filing date of the report that includes the disclosure required by this paragraph, based on their evaluation of these controls and procedures required by Rule 30a-3(b) under the 1940 Act (17 CFR 270.30a-3(b)) and Rules 13a-15(b) or 15d-15(b) under the Securities Exchange Act of 1934, as amended (17 CFR 240.13a-15(b) or 240.15d-15(b)). |
| (b) | There were no changes in the registrant’s internal control over financial reporting (as defined in Rule 30a-3(d) under the 1940 Act (17 CFR 270.30a-3(d)) that occurred during the period covered by this report that has materially affected, or is reasonably likely to materially affect, the registrant’s internal control over financial reporting. |
Item 12. Disclosure of Securities Lending Activities for Closed-End Management Investment Companies.
Not applicable.
Item 13. Exhibits.
| (a)(1) | Not applicable. |
| (a)(2) | Certifications pursuant to Rule 30a-2(a) under the 1940 Act and Section 302 of the Sarbanes-Oxley Act of 2002 are attached hereto. |
| (a)(3) | Not applicable. |
| (a)(4) | Not applicable. |
| (b) | Certifications pursuant to Rule 30a-2(b) under the 1940 Act and Section 906 of the Sarbanes- Oxley Act of 2002 are attached hereto. |
SIGNATURES
Pursuant to the requirements of the Securities Exchange Act of 1934 and the Investment Company Act of 1940, the registrant has duly caused this report to be signed on its behalf by the undersigned, thereunto duly authorized.
| (registrant) | First Trust Senior Floating Rate 2022 Target Term Fund |
| By (Signature and Title)* | /s/ James M. Dykas | |
| James M. Dykas, President and Chief Executive Officer (principal executive officer) |
| Date: | August 7, 2020 |
Pursuant to the requirements of the Securities Exchange Act of 1934 and the Investment Company Act of 1940, this report has been signed below by the following persons on behalf of the registrant and in the capacities and on the dates indicated.
| By (Signature and Title)* | /s/ James M. Dykas | |
| James M. Dykas, President and Chief Executive Officer (principal executive officer) |
| Date: | August 7, 2020 |
| By (Signature and Title)* | /s/ Donald P. Swade | |
| Donald P. Swade, Treasurer, Chief Financial Officer and Chief Accounting Officer (principal financial officer) |
| Date: | August 7, 2020 |
* Print the name and title of each signing officer under his or her signature.