Exhibit 99.2

DEAR SHAREHOLDERS,
I’d first like to sincerely thank our Offerpad teams who delivered strong execution amidst a tough macro environment, enabling us to achieve both our top and bottom-line guidance in the third quarter. We are gratified by their contribution, resiliency, and their willingness to join us on our journey back to growth.
While we are pleased with our third quarter financial performance, we are even more excited about the measurable progress we made in executing against our three strategic imperatives of: removing the friction from real estate transactions; focusing on our asset light product lines to offer a software enabled end-to-end real estate platform; and expanding our partner ecosystem to enhance our scope and scale. Let me give you some examples of how we supported these imperatives within the third quarter.
We introduced a 4.99% mortgage rate buy-down program, allowing more buyers to purchase an Offerpad home while saving hundreds of dollars per month in mortgage costs. This powerful tool substantially increases the affordability of our homes and, in early days, is already motivating our buyers. This program is a great example of how we are proactively and nimbly navigating the market, despite burgeoning interest rates.
Over the last two quarters, almost 50 percent of transactions came from our new asset light services including Direct Plus, Renovate, and Flex Listing Service. These transactions also drove one third of our contribution margin after interest – which grew nearly three-fold from ($10M) in the third quarter of 2022 to $19M this quarter. Our Renovation solution is leading the way in our platform and revenue diversification.
We are already one of the largest renovation companies in the United States and just expanded our reach to enable third-party businesses to leverage Offerpad’s renovation expertise and efficiency. Less than a year in, we already have nearly 50 B2B renovation clients in our active markets. In the third quarter, we saw an over 125 percent increase in closed renovations versus the prior quarter, and anticipate that this offering will increasingly become a key driver of our business.
We have built long-standing relationships with 15 of the top 20 home builders in the U.S., national real estate companies, and third-party real estate agents through our Agent Partnership Program. On top of those existing partnerships, in October, we announced a national program in collaboration with Anywhere Real Estate to extend Offerpad’s reach outside of our normal coverage areas, allowing us to serve customers through coordination with agents affiliated with the Anywhere Leads Network.
These are just a few of the many recent initiatives that support our strategic imperatives as we move to a true software-enabled, end-to-end real estate platform. Foundational to the success of our strategy are the efforts we took in the quarter – under the leadership of Jawad Ahsan, our new CFO – to optimize and align Offerpad’s organization and business model for the long-term. To this end, we have sharpened our operational focus on ensuring that the business is on a path to be profitable and self-sustaining; future proofed against another downturn in housing or rate shock; and have complete alignment between our marketing strategy and our customer behavior.
With these clear mandates, I’m excited to share our progress along the journey, as we disrupt the way real estate works.

Brian Bair | Chairman and CEO
1 | Q3 2023

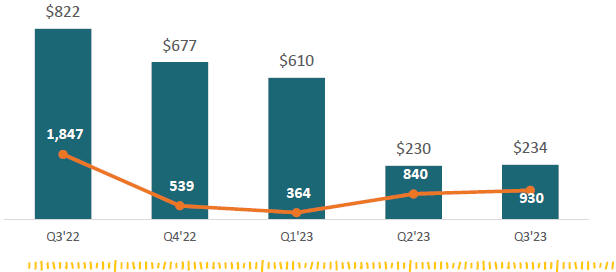
TOTAL REVENUE ($M) & Homes Acquired
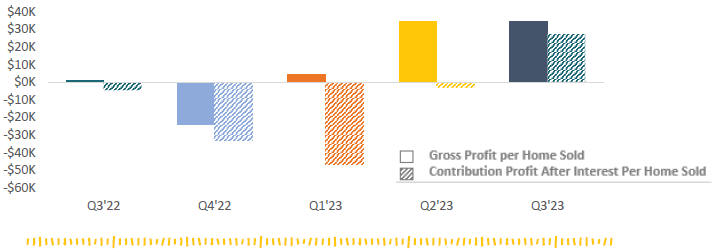
RETURNS PER HOME SOLD
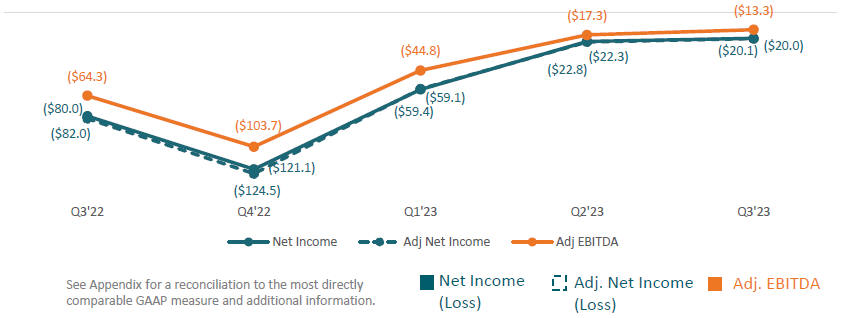
NET INCOME (LOSS), ADJ. NET INCOME (LOSS) & ADJ. EBITDA ($M)
2 | Q3 2023
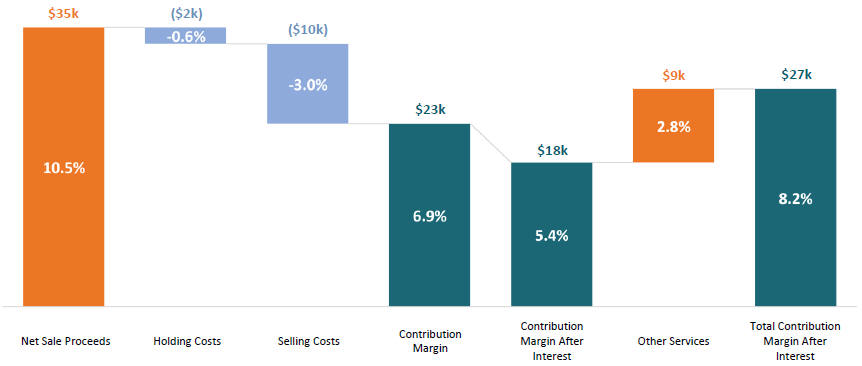
Q3’23 Total Contribution Margin After Interest Per Home Sold
See Appendix for a reconciliation to the most directly comparable GAAP measure and additional information.
3 | Q3 2023
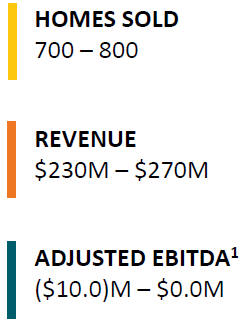
FOURTH QUARTER 2023 OUTLOOK

| 1 | See Non-GAAP financial measures in Appendix for an explanation of why a reconciliation of this guidance cannot be provided. |
4 | Q3 2023
APPENDIX

Certain statements in this shareholder letter may be considered forward-looking statements within the meaning of the Private Securities Litigation Reform Act of 1995. Forward-looking statements generally relate to future events or Offerpad’s future financial or operating performance. For example, statements regarding Offerpad’s financial outlook, expectations regarding profitability, and anticipated market conditions in the industry in which Offerpad operates are forward-looking statements. In some cases, you can identify forward-looking statements by terminology such as “may,” “should,” “could,” “might,” “plan,” “possible,” “project,” “strive,” “budget,” “forecast,” “expect,” “intend,” “will,” “estimate,” “anticipate,” “believe,” “predict,” “potential” or “continue,” or the negatives of these terms or variations of them or similar terminology. Such forward-looking statements are subject to risks, uncertainties, and other important factors that could cause actual results to differ materially from those expressed or implied by such forward-looking statements. Factors that may impact such forward-looking statements include, but are not limited to, Offerpad’s ability to respond to general economic conditions; the health of the U.S. residential real estate industry; Offerpad’s ability to grow market share in its existing markets or any new markets it may enter; Offerpad’s ability to manage its growth effectively; Offerpad’s ability to accurately value and manage inventory, and to maintain an adequate and desirable supply of inventory; Offerpad’s ability to successfully launch new product and service offerings, and to manage, develop and refine its technology platform; Offerpad’s ability to maintain and enhance its products and brand, and to attract customers; Offerpad’s ability to achieve and maintain profitability in the future; the success of strategic relationships with third parties; and Offerpad’s failure to meet the New York Stock Exchange’s continued listing standards. These and other important factors discussed under the caption “Risk Factors” in our Annual Report on Form 10-K for the year ended December 31, 2022 filed with the Securities and Exchange Commission on February 28, 2023, and our other reports filed with the Securities and Exchange Commission could cause actual results to differ materially from those indicated by the forward-looking statements made in this shareholder letter. These forward-looking statements are based upon estimates and assumptions that, while considered reasonable by Offerpad and its management, are inherently uncertain. Nothing in this shareholder letter should be regarded as a representation by any person that the forward-looking statements set forth herein will be achieved or that any of the contemplated results of such forward-looking statements will be achieved. You should not place undue reliance on forward-looking statements, which speak only as of the date they are made. Offerpad undertakes no obligation to update or revise any forward-looking statements, whether as a result of new information, future events or otherwise, except as may be required under applicable securities laws.
5 | Q3 2023
OFFERPAD SOLUTIONS INC.
CONDENSED CONSOLIDATED STATEMENTS OF OPERATIONS
| Three Months Ended September 30, | Nine Months Ended September 30, | |||||||||||||||
| (in thousands, except per share data) (Unaudited) | 2023 | 2022 | 2023 | 2022 | ||||||||||||
Revenue | $ | 234,228 | $ | 821,732 | $ | 1,073,954 | $ | 3,275,100 | ||||||||
Cost of revenue | 210,255 | 819,573 | 1,020,465 | 3,047,818 | ||||||||||||
|
|
|
|
|
|
|
| |||||||||
Gross profit | 23,973 | 2,159 | 53,489 | 227,282 | ||||||||||||
|
|
|
|
|
|
|
| |||||||||
Operating expenses: | ||||||||||||||||
Sales, marketing and operating | 27,235 | 55,043 | 98,626 | 190,170 | ||||||||||||
General and administrative | 14,124 | 14,640 | 41,316 | 45,418 | ||||||||||||
Technology and development | 2,156 | 2,687 | 6,709 | 9,112 | ||||||||||||
|
|
|
|
|
|
|
| |||||||||
Total operating expenses | 43,515 | 72,370 | 146,651 | 244,700 | ||||||||||||
|
|
|
|
|
|
|
| |||||||||
Loss from operations | (19,542 | ) | (70,211 | ) | (93,162 | ) | (17,418 | ) | ||||||||
Other income (expense): | ||||||||||||||||
Change in fair value of warrant liabilities | 131 | 1,961 | 177 | 20,162 | ||||||||||||
Interest expense | (4,406 | ) | (15,889 | ) | (13,705 | ) | (30,856 | ) | ||||||||
Other income, net | 3,837 | 643 | 5,084 | 671 | ||||||||||||
|
|
|
|
|
|
|
| |||||||||
Total other expense | (438 | ) | (13,285 | ) | (8,444 | ) | (10,023 | ) | ||||||||
|
|
|
|
|
|
|
| |||||||||
Loss before income taxes | (19,980 | ) | (83,496 | ) | (101,606 | ) | (27,441 | ) | ||||||||
Income tax (expense) benefit | (6 | ) | 3,474 | (171 | ) | (35 | ) | |||||||||
|
|
|
|
|
|
|
| |||||||||
Net loss | $ | (19,986 | ) | $ | (80,022 | ) | $ | (101,777 | ) | $ | (27,476 | ) | ||||
|
|
|
|
|
|
|
| |||||||||
Net loss per share, basic | $ | (0.73 | ) | $ | (4.86 | ) | $ | (3.90 | ) | $ | (1.69 | ) | ||||
|
|
|
|
|
|
|
| |||||||||
Net loss per share, diluted | $ | (0.73 | ) | $ | (4.86 | ) | $ | (3.90 | ) | $ | (1.69 | ) | ||||
|
|
|
|
|
|
|
| |||||||||
Weighted average common shares outstanding, basic | 27,276 | 16,477 | 26,079 | 16,293 | ||||||||||||
|
|
|
|
|
|
|
| |||||||||
Weighted average common shares outstanding, diluted | 27,276 | 16,477 | 26,079 | 16,293 | ||||||||||||
|
|
|
|
|
|
|
| |||||||||
6 | Q3 2023
OFFERPAD SOLUTIONS INC.
CONDENSED CONSOLIDATED BALANCE SHEETS
| September 30, | December 31, | |||||||
| (in thousands, except par value per share) (Unaudited) | 2023 | 2022 | ||||||
ASSETS | ||||||||
Current assets: | ||||||||
Cash and cash equivalents | $ | 105,999 | $ | 97,241 | ||||
Restricted cash | 7,409 | 43,058 | ||||||
Accounts receivable | 3,874 | 2,350 | ||||||
Real estate inventory | 289,597 | 664,697 | ||||||
Prepaid expenses and other current assets | 6,464 | 6,833 | ||||||
|
|
|
| |||||
Total current assets | 413,343 | 814,179 | ||||||
Property and equipment, net | 4,698 | 5,194 | ||||||
Other non-current assets | 4,106 | 5,696 | ||||||
|
|
|
| |||||
TOTAL ASSETS | $ | 422,147 | $ | 825,069 | ||||
|
|
|
| |||||
LIABILITIES AND STOCKHOLDERS’ EQUITY | ||||||||
Current liabilities: | ||||||||
Accounts payable | $ | 6,359 | $ | 4,647 | ||||
Accrued and other current liabilities | 22,465 | 28,252 | ||||||
Secured credit facilities and other debt, net | 237,921 | 605,889 | ||||||
Secured credit facilities and other debt - related party | 37,854 | 60,176 | ||||||
|
|
|
| |||||
Total current liabilities | 304,599 | 698,964 | ||||||
Warrant liabilities | 362 | 539 | ||||||
Other long-term liabilities | 1,969 | 3,689 | ||||||
|
|
|
| |||||
Total liabilities | 306,930 | 703,192 | ||||||
|
|
|
| |||||
Commitments and contingencies | ||||||||
Stockholders’ equity: | ||||||||
Class A common stock, $0.0001 par value; 2,000,000 shares authorized; 27,233 and 15,491 shares issued and outstanding as of September 30, 2023 and December 31, 2022, respectively | 3 | 2 | ||||||
Class B common stock, zero shares authorized, issued and outstanding as of September 30, 2023; and $0.0001 par value, 20,000 shares authorized; 988 shares issued and outstanding as of December 31, 2022 | — | — | ||||||
Additional paid in capital | 497,660 | 402,544 | ||||||
Accumulated deficit | (382,446 | ) | (280,669 | ) | ||||
|
|
|
| |||||
Total stockholders’ equity | 115,217 | 121,877 | ||||||
|
|
|
| |||||
TOTAL LIABILITIES AND STOCKHOLDERS’ EQUITY | $ | 422,147 | $ | 825,069 | ||||
|
|
|
| |||||
7 | Q3 2023
OFFERPAD SOLUTIONS INC.
CONDENSED CONSOLIDATED STATEMENTS OF CASH FLOWS
| Nine Months Ended | ||||||||
| September 30, | ||||||||
| ($ in thousands) (Unaudited) | 2023 | 2022 | ||||||
Cash flows from operating activities: | ||||||||
Net loss | $ | (101,777 | ) | $ | (27,476 | ) | ||
Adjustments to reconcile net loss to net cash provided by (used in) operating activities: | ||||||||
Depreciation | 556 | 764 | ||||||
Amortization of debt financing costs | 3,080 | 2,160 | ||||||
Real estate inventory valuation adjustment | 8,372 | 49,734 | ||||||
Stock-based compensation | 5,915 | 6,293 | ||||||
Change in fair value of warrant liabilities | (177 | ) | (20,162 | ) | ||||
Change in fair value of derivative instruments | (1,994 | ) | — | |||||
Loss on disposal of property and equipment | 30 | — | ||||||
Changes in operating assets and liabilities: | ||||||||
Accounts receivable | (1,524 | ) | (2,956 | ) | ||||
Real estate inventory | 366,728 | (101,208 | ) | |||||
Prepaid expenses and other assets | 3,541 | (2,988 | ) | |||||
Accounts payable | 1,712 | 1,444 | ||||||
Accrued and other liabilities | (7,507 | ) | 2,471 | |||||
|
|
|
| |||||
Net cash provided by (used in) operating activities | 276,955 | (91,924 | ) | |||||
|
|
|
| |||||
Cash flows from investing activities: | ||||||||
Purchases of property and equipment | (90 | ) | (917 | ) | ||||
Purchases of derivative instruments | (2,569 | ) | — | |||||
Proceeds from sale of derivative instruments | 2,981 | — | ||||||
|
|
|
| |||||
Net cash provided by (used in) investing activities | 322 | (917 | ) | |||||
|
|
|
| |||||
Cash flows from financing activities: | ||||||||
Borrowings from credit facilities and other debt | 687,715 | 2,889,790 | ||||||
Repayments of credit facilities and other debt | (1,080,821 | ) | (2,771,861 | ) | ||||
Payment of debt financing costs | (264 | ) | (466 | ) | ||||
Borrowings from warehouse lending facility | 21,951 | — | ||||||
Repayments of warehouse lending facility | (21,951 | ) | — | |||||
Proceeds from issuance of pre-funded warrants | 90,000 | — | ||||||
Proceeds from exercise of pre-funded warrants | 11 | — | ||||||
Issuance cost of pre-funded warrants | (784 | ) | — | |||||
Proceeds from exercise of stock options | 53 | 4,898 | ||||||
Payments for taxes related to stock-based awards | (78 | ) | (285 | ) | ||||
|
|
|
| |||||
Net cash (used in) provided by financing activities | (304,168 | ) | 122,076 | |||||
|
|
|
| |||||
Net change in cash, cash equivalents and restricted cash | (26,891 | ) | 29,235 | |||||
Cash, cash equivalents and restricted cash, beginning of period | 140,299 | 194,433 | ||||||
|
|
|
| |||||
Cash, cash equivalents and restricted cash, end of period | $ | 113,408 | $ | 223,668 | ||||
|
|
|
| |||||
Reconciliation of cash, cash equivalents and restricted cash to the condensed consolidated balance sheet: | ||||||||
Cash and cash equivalents | $ | 105,999 | $ | 196,838 | ||||
Restricted cash | 7,409 | 26,830 | ||||||
|
|
|
| |||||
Total cash, cash equivalents and restricted cash | $ | 113,408 | $ | 223,668 | ||||
|
|
|
| |||||
Supplemental disclosure of cash flow information: | ||||||||
Cash payments for interest | $ | 23,406 | $ | 36,536 | ||||
8 | Q3 2023
Non-GAAP Financial Measures
In addition to our results of operations above, we report certain financial measures that are not required by, or presented in accordance with, U.S. generally accepted accounting principles (“GAAP”). These measures have limitations as analytical tools when assessing our operating performance and should not be considered in isolation or as a substitute for GAAP measures, including gross profit and net income.
We may calculate or present our non-GAAP financial measures differently than other companies who report measures with similar titles and, as a result, the non-GAAP financial measures we report may not be comparable with those of companies in our industry or in other industries. We have not provided a quantitative reconciliation of forecasted Adjusted EBITDA to forecasted net income (loss) or Contribution Profit After Interest to Gross profit within this shareholder letter because we are unable to calculate certain reconciling items without making unreasonable efforts. With respect to Adjusted EBITDA, these items include, but are not limited to, stock-based compensation with respect to future grants and forfeitures, and with respect to Contribution Profit After Interest, these items include, but are not limited to, inventory valuation adjustments, inventory sales timing or product mix, which could materially affect the computation of forward-looking net income (loss) and Gross Profit, respectively, and are inherently uncertain and depend on various factors, some of which are outside of our control.
Adjusted Gross Profit, Contribution Profit, and Contribution Profit After Interest (and related margins)
To provide investors with additional information regarding our margins, we have included Adjusted Gross Profit, Contribution Profit, and Contribution Profit After Interest (and related margins), which are non-GAAP financial measures. We believe that Adjusted Gross Profit, Contribution Profit, and Contribution Profit After Interest are useful financial measures for investors as they are used by management in evaluating unit level economics and operating performance across our markets. Each of these measures is intended to present the economics related to homes sold during a given period. We do so by including revenue generated from homes sold (and ancillary services) in the period and only the expenses that are directly attributable to such home sales, even if such expenses were recognized in prior periods, and excluding expenses related to homes that remain in real estate inventory as of the end of the period presented. Contribution Profit provides investors a measure to assess Offerpad’s ability to generate returns on homes sold during a reporting period after considering home acquisition costs, renovation and repair costs, and adjusting for holding costs and selling costs. Contribution Profit After Interest further impacts gross profit by including interest costs (including senior and mezzanine secured credit facilities) attributable to homes sold during a reporting period. We believe these measures facilitate meaningful period over period comparisons and illustrate our ability to generate returns on assets sold after considering the costs directly related to the assets sold in a presented period.
Adjusted Gross Profit, Contribution Profit and Contribution Profit After Interest (and related margins) are supplemental measures of our operating performance and have limitations as analytical tools. For example, these measures include costs that were recorded in prior periods under GAAP and exclude, in connection with homes held in real estate inventory at the end of the period, costs required to be recorded under GAAP in the same period.
Accordingly, these measures should not be considered in isolation or as a substitute for analysis of our results as reported under GAAP. We include a reconciliation of these measures to the most directly comparable GAAP financial measure, which is gross profit.
9 | Q3 2023
Adjusted Gross Profit / Margin
We calculate Adjusted Gross Profit as gross profit under GAAP adjusted for (1) net real estate inventory valuation adjustment plus (2) interest expense associated with homes sold in the presented period and recorded in cost of revenue. Net real estate inventory valuation adjustment is calculated by adding back the real estate inventory valuation adjustment charges recorded during the period on homes that remain in real estate inventory at period end and subtracting the real estate inventory valuation adjustment charges recorded in prior periods on homes sold in the current period. We define Adjusted Gross Margin as Adjusted Gross Profit as a percentage of revenue.
We view this metric as an important measure of business performance, as it captures gross margin performance isolated to homes sold in a given period and provides comparability across reporting periods. Adjusted Gross Profit helps management assess performance across the key phases of processing a home (acquisitions, renovations, and resale) for a specific resale cohort.
Contribution Profit / Margin
We calculate Contribution Profit as Adjusted Gross Profit, minus (1) direct selling costs incurred on homes sold during the presented period, minus (2) holding costs incurred in the current period on homes sold during the period recorded in sales, marketing, and operating, minus (3) holding costs incurred in prior periods on homes sold in the current period recorded in sales, marketing, and operating, plus (4) other income, net which is primarily comprised of interest income earned on our cash and cash equivalents and fair value adjustments of derivative financial instruments. The composition of our holding costs is described in the footnotes to the reconciliation table below. We define Contribution Margin as Contribution Profit as a percentage of revenue.
We view this metric as an important measure of business performance as it captures the unit level performance isolated to homes sold in a given period and provides comparability across reporting periods. Contribution Profit helps management assess inflows and outflow directly associated with a specific resale cohort.
Contribution Profit / Margin After Interest
We define Contribution Profit After Interest as Contribution Profit, minus (1) interest expense associated with homes sold in the presented period and recorded in cost of revenue, minus (2) interest expense associated with homes sold in the presented period, recorded in costs of sales, and previously excluded from Adjusted Gross Profit, and minus (3) interest expense under our senior and mezzanine secured credit facilities incurred on homes sold during the period. This includes interest expense recorded in prior periods in which the sale occurred. Our senior and mezzanine secured credit facilities are secured by our homes in real estate inventory and drawdowns are made on a per-home basis at the time of purchase and are required to be repaid at the time the homes are sold. We define Contribution Margin After Interest as Contribution Profit After Interest as a percentage of revenue.
We view this metric as an important measure of business performance. Contribution Profit After Interest helps management assess Contribution Margin performance, per above, when fully burdened with costs of financing.
10 | Q3 2023
The following tables present a reconciliation of our Adjusted Gross Profit, Contribution Profit and Contribution Profit After Interest to our Gross (Loss) Profit, which is the most directly comparable GAAP measure, and Contribution (Loss) Profit Per Home Sold and Contribution (Loss) Profit After Interest Per Home Sold to Offerpad’s Gross (Loss) Profit Per Home Sold, which is the most directly comparable GAAP measure, for the periods indicated:
| Three Months Ended | ||||||||||||||||||||
| (in thousands, except percentages and homes sold, unaudited) | September 30, 2023 | June 30, 2023 | March 31, 2023 | December 31, 2022 | September 30, 2022 | |||||||||||||||
Gross (loss) profit | $ | 23,973 | $ | 22,231 | $ | 7,285 | $ | (44,860 | ) | $ | 2,159 | |||||||||
Gross margin | 10.2 | % | 9.7 | % | 1.2 | % | -6.6 | % | 0.3 | % | ||||||||||
Homes sold | 703 | 650 | 1,609 | 1,865 | 2,280 | |||||||||||||||
Gross profit (loss) per home sold | 34.1 | 34.2 | 4.5 | (24.1 | ) | 0.9 | ||||||||||||||
Adjustments: | ||||||||||||||||||||
Inventory valuation adjustment - current period | 918 | 169 | 7,285 | 44,075 | 27,529 | |||||||||||||||
Inventory valuation adjustment - prior period | (318 | ) | (13,679 | ) | (51,515 | ) | (25,469 | ) | (8,955 | ) | ||||||||||
Interest expense capitalized | 235 | 1,358 | 4,677 | 3,081 | 2,508 | |||||||||||||||
|
|
|
|
|
|
|
|
|
| |||||||||||
Adjusted gross profit (loss) | 24,808 | 10,079 | (32,268 | ) | (23,173 | ) | 23,241 | |||||||||||||
Adjusted gross margin | 10.6 | % | 4.4 | % | -5.3 | % | -3.4 | % | 2.8 | % | ||||||||||
Adjustments: | ||||||||||||||||||||
Direct selling costs | (5,593 | ) | (5,743 | ) | (18,061 | ) | (20,584 | ) | (21,419 | ) | ||||||||||
Holding costs on sales - current period | (453 | ) | (269 | ) | (1,248 | ) | (1,251 | ) | (1,765 | ) | ||||||||||
Holding costs on sales - prior period | (72 | ) | (567 | ) | (1,886 | ) | (1,209 | ) | (405 | ) | ||||||||||
Other income, net | 3,837 | 965 | 282 | 861 | 643 | |||||||||||||||
|
|
|
|
|
|
|
|
|
| |||||||||||
Contribution profit (loss) | 22,527 | 4,465 | (53,181 | ) | (45,356 | ) | 295 | |||||||||||||
Contribution margin | 9.6 | % | 1.9 | % | -8.7 | % | -6.7 | % | 0.0 | % | ||||||||||
Homes sold | 703 | 650 | 1,609 | 1,865 | 2,280 | |||||||||||||||
Contribution profit (loss) per home sold | 32.0 | 6.9 | (33.1 | ) | (24.3 | ) | 0.1 | |||||||||||||
Adjustments: | ||||||||||||||||||||
Interest expense capitalized | (235 | ) | (1,358 | ) | (4,677 | ) | (3,081 | ) | (2,508 | ) | ||||||||||
Interest expense on homes sold - current period | (2,622 | ) | (1,292 | ) | (5,498 | ) | (5,858 | ) | (5,707 | ) | ||||||||||
Interest expense on homes sold - prior period | (553 | ) | (3,708 | ) | (12,032 | ) | (6,943 | ) | (2,382 | ) | ||||||||||
|
|
|
|
|
|
|
|
|
| |||||||||||
Contribution profit (loss) after interest | 19,117 | (1,893 | ) | (75,388 | ) | (61,238 | ) | (10,301 | ) | |||||||||||
Contribution margin after interest | 8.2 | % | -0.8 | % | -12.4 | % | -9.0 | % | -1.3 | % | ||||||||||
Homes sold | 703 | 650 | 1,609 | 1,865 | 2,280 | |||||||||||||||
Contribution (loss) profit after interest per home sold | 27.2 | (2.9 | ) | (46.9 | ) | (32.8 | ) | (4.5 | ) | |||||||||||
11 | Q3 2023
Adjusted Net (Loss) Income and Adjusted EBITDA
We also present Adjusted Net Income (Loss) and Adjusted EBITDA, which are non-GAAP financial measures, which our management team uses to assess our underlying financial performance. We believe these measures provide insight into period over period performance, adjusted for non-recurring or non-cash items.
We calculate Adjusted Net Income (Loss) as GAAP Net Income (Loss) adjusted for the change in fair value of warrant liabilities. We define Adjusted Net Income (Loss) Margin as Adjusted Net Income (Loss) as a percentage of revenue.
We calculate Adjusted EBITDA as Adjusted Net Income (Loss) adjusted for interest expense, amortization of capitalized interest, taxes, depreciation and amortization and stock-based compensation expense. We define Adjusted EBITDA Margin as Adjusted EBITDA as a percentage of revenue.
Adjusted Net Income (Loss) and Adjusted EBITDA are supplemental to our operating performance measures calculated in accordance with GAAP and have important limitations. For example, Adjusted Net Income (Loss) and Adjusted EBITDA exclude the impact of certain costs required to be recorded under GAAP and could differ substantially from similarly titled measures presented by other companies in our industry or companies in other industries. Accordingly, these measures should not be considered in isolation or as a substitute for analysis of our results as reported under GAAP.
The following table presents a reconciliation of our Adjusted Net Income (Loss) and Adjusted EBITDA to our GAAP Net Income (Loss), which is the most directly comparable GAAP measure, for the periods indicated:
| Three Months Ended | ||||||||||||||||||||
| (in thousands, except percentages, unaudited) | September 30, 2023 | June 30, 2023 | March 31, 2023 | December 31, 2022 | September 30, 2022 | |||||||||||||||
Net (loss) income (GAAP) | $ | (19,986 | ) | $ | (22,344 | ) | $ | (59,447 | ) | $ | (121,137 | ) | $ | (80,022 | ) | |||||
Change in fair value of warrant liabilities | (131 | ) | (435 | ) | 389 | (3,360 | ) | (1,961 | ) | |||||||||||
|
|
|
|
|
|
|
|
|
| |||||||||||
Adjusted net (loss) income | $ | (20,117 | ) | $ | (22,779 | ) | $ | (59,058 | ) | $ | (124,497 | ) | $ | (81,983 | ) | |||||
Adjusted net (loss) income margin | (8.6 | %) | (9.9 | %) | (9.7 | %) | (18.4 | %) | (10.0 | %) | ||||||||||
Adjustments: | ||||||||||||||||||||
Interest expense | 4,406 | 1,867 | 7,432 | 15,135 | 15,889 | |||||||||||||||
Amortization of capitalized interest (1) | 235 | 1,358 | 4,677 | 3,081 | 2,508 | |||||||||||||||
Income tax expense | 6 | 43 | 122 | 324 | (3,474 | ) | ||||||||||||||
Depreciation and amortization | 175 | 178 | 202 | 258 | 515 | |||||||||||||||
Amortization of stock-based compensation | 2,017 | 2,055 | 1,843 | 2,014 | 2,265 | |||||||||||||||
|
|
|
|
|
|
|
|
|
| |||||||||||
Adjusted EBITDA | (13,277 | ) | (17,278 | ) | (44,782 | ) | (103,685 | ) | (64,280 | ) | ||||||||||
Adjusted EBITDA margin | (5.7 | %) | (7.5 | %) | (7.3 | %) | (15.3 | %) | (7.8 | %) | ||||||||||
| (1) | Amortization of capitalized interest represents all interest related costs, including senior and mezzanine interest related costs, incurred on homes sold in the period presented that were capitalized and expensed in cost of sales at the time of sale. |
12 | Q3 2023

13 | Q3 2023