UNITED STATES
SECURITIES AND EXCHANGE COMMISSION
Washington, D.C. 20549
FORM N-CSR
CERTIFIED SHAREHOLDER REPORT OF REGISTERED
MANAGEMENT INVESTMENT COMPANIES
Investment Company Act file number 811-01796
Fidelity Destiny Portfolios
(Exact name of registrant as specified in charter)
245 Summer St., Boston, MA 02210
(Address of principal executive offices) (Zip code)
Cynthia Lo Bessette, Secretary
245 Summer St.
Boston, Massachusetts 02210
(Name and address of agent for service)
Registrant's telephone number, including area code:
617-563-7000
Date of fiscal year end: | September 30 |
Date of reporting period: | March 31, 2022 |
Item 1.
Reports to Stockholders


Contents
Top Holdings (% of Fund's net assets) | ||
| Alphabet, Inc. Class C | 7.6 | |
| Microsoft Corp. | 6.5 | |
| Apple, Inc. | 5.6 | |
| UnitedHealth Group, Inc. | 3.8 | |
| Amazon.com, Inc. | 3.7 | |
| Marvell Technology, Inc. | 2.6 | |
| MasterCard, Inc. Class A | 2.2 | |
| Eli Lilly & Co. | 2.0 | |
| Wells Fargo & Co. | 1.8 | |
| Freeport-McMoRan, Inc. | 1.7 | |
| 37.5 | ||
| Market Sectors (% of Fund's net assets) | ||
| Information Technology | 25.1 | |
| Health Care | 13.5 | |
| Consumer Discretionary | 11.3 | |
| Communication Services | 9.7 | |
| Energy | 9.3 | |
| Financials | 9.3 | |
| Industrials | 8.0 | |
| Materials | 5.9 | |
| Consumer Staples | 3.1 | |
| Utilities | 1.5 | |
| Real Estate | 1.0 | |
Asset Allocation (% of Fund's net assets) |
 |
Foreign investments - 7.0% |
| Common Stocks - 97.1% | |||
| Shares | Value ($) | ||
| COMMUNICATION SERVICES - 9.7% | |||
| Entertainment - 0.9% | |||
| Electronic Arts, Inc. | 32,567 | 4,120,051 | |
| Endeavor Group Holdings, Inc. (a) | 102,888 | 3,037,254 | |
| Endeavor Group Holdings, Inc. (a)(b) | 268,422 | 7,923,817 | |
| Live Nation Entertainment, Inc. (a) | 54,700 | 6,434,908 | |
| Warner Music Group Corp. Class A | 128,700 | 4,871,295 | |
| 26,387,325 | |||
| Interactive Media & Services - 8.8% | |||
| Alphabet, Inc. Class C (a) | 79,423 | 221,827,646 | |
| Meta Platforms, Inc. Class A (a) | 144,131 | 32,048,969 | |
| Snap, Inc. Class A (a) | 78,900 | 2,839,611 | |
| 256,716,226 | |||
| Media - 0.0% | |||
| Liberty Media Corp. Liberty Formula One Group Series C (a) | 11,400 | 796,176 | |
TOTAL COMMUNICATION SERVICES | 283,899,727 | ||
| CONSUMER DISCRETIONARY - 11.3% | |||
| Automobiles - 0.2% | |||
| Ford Motor Co. | 198,300 | 3,353,253 | |
| Tesla, Inc. (a) | 1,600 | 1,724,160 | |
| 5,077,413 | |||
| Hotels, Restaurants & Leisure - 4.8% | |||
| Airbnb, Inc. Class A (a) | 220,002 | 37,787,544 | |
| Booking Holdings, Inc. (a) | 4,447 | 10,443,557 | |
| Chipotle Mexican Grill, Inc. (a) | 3,300 | 5,220,699 | |
| Compass Group PLC | 614,805 | 13,230,662 | |
| Hilton Worldwide Holdings, Inc. (a) | 236,584 | 35,899,256 | |
| Marriott International, Inc. Class A (a) | 216,521 | 38,053,566 | |
| Penn National Gaming, Inc. (a) | 25,974 | 1,101,817 | |
| 141,737,101 | |||
| Household Durables - 0.2% | |||
| D.R. Horton, Inc. | 10,913 | 813,128 | |
| NVR, Inc. (a) | 750 | 3,350,453 | |
| Toll Brothers, Inc. | 13,994 | 657,998 | |
| 4,821,579 | |||
| Internet & Direct Marketing Retail - 3.7% | |||
| Amazon.com, Inc. (a) | 33,165 | 108,116,242 | |
| Revolve Group, Inc. (a) | 25,900 | 1,390,571 | |
| 109,506,813 | |||
| Multiline Retail - 0.4% | |||
| Dollar General Corp. | 55,900 | 12,445,017 | |
| Specialty Retail - 1.1% | |||
| Aritzia, Inc. (a) | 83,700 | 3,416,559 | |
| Industria de Diseno Textil SA | 273,800 | 5,970,206 | |
| Lowe's Companies, Inc. | 86,982 | 17,586,891 | |
| The Home Depot, Inc. | 2,055 | 615,123 | |
| TJX Companies, Inc. | 105,340 | 6,381,497 | |
| 33,970,276 | |||
| Textiles, Apparel & Luxury Goods - 0.9% | |||
| LVMH Moet Hennessy Louis Vuitton SE | 18,267 | 13,038,971 | |
| Moncler SpA | 58,667 | 3,293,045 | |
| NIKE, Inc. Class B | 56,381 | 7,586,627 | |
| On Holding AG | 6,700 | 169,108 | |
| Tory Burch LLC (a)(c)(d)(e) | 28,846 | 1,576,996 | |
| 25,664,747 | |||
TOTAL CONSUMER DISCRETIONARY | 333,222,946 | ||
| CONSUMER STAPLES - 3.1% | |||
| Beverages - 2.8% | |||
| Diageo PLC | 533,365 | 27,054,715 | |
| Monster Beverage Corp. (a) | 77,640 | 6,203,436 | |
| The Coca-Cola Co. | 811,196 | 50,294,152 | |
| 83,552,303 | |||
| Food & Staples Retailing - 0.1% | |||
| U.S. Foods Holding Corp. (a) | 47,692 | 1,794,650 | |
| Food Products - 0.0% | |||
| Mondelez International, Inc. | 19,149 | 1,202,174 | |
| Household Products - 0.2% | |||
| The Clorox Co. | 34,500 | 4,796,535 | |
TOTAL CONSUMER STAPLES | 91,345,662 | ||
| ENERGY - 9.3% | |||
| Energy Equipment & Services - 1.8% | |||
| Baker Hughes Co. Class A | 593,500 | 21,609,335 | |
| Halliburton Co. | 592,700 | 22,445,549 | |
| NOV, Inc. | 129,800 | 2,545,378 | |
| Schlumberger Ltd. | 159,700 | 6,597,207 | |
| TechnipFMC PLC (a) | 76,200 | 590,550 | |
| 53,788,019 | |||
| Oil, Gas & Consumable Fuels - 7.5% | |||
| Antero Resources Corp. (a) | 331,000 | 10,105,430 | |
| Canadian Natural Resources Ltd. | 528,600 | 32,731,213 | |
| Denbury, Inc. (a) | 22,100 | 1,736,397 | |
| Devon Energy Corp. | 134,333 | 7,943,110 | |
| EOG Resources, Inc. | 279,019 | 33,267,435 | |
| EQT Corp. | 315,400 | 10,852,914 | |
| Exxon Mobil Corp. | 522,334 | 43,139,565 | |
| Hess Corp. | 360,695 | 38,608,793 | |
| Neste OYJ | 28,000 | 1,284,843 | |
| Pioneer Natural Resources Co. | 92,003 | 23,003,510 | |
| Range Resources Corp. (a) | 467,123 | 14,191,197 | |
| Reliance Industries Ltd. | 74,981 | 2,588,197 | |
| 219,452,604 | |||
TOTAL ENERGY | 273,240,623 | ||
| FINANCIALS - 9.3% | |||
| Banks - 3.3% | |||
| Bank of America Corp. | 893,526 | 36,831,142 | |
| M&T Bank Corp. | 2,500 | 423,750 | |
| PNC Financial Services Group, Inc. | 12,936 | 2,386,045 | |
| Starling Bank Ltd. Series D (a)(d)(e) | 785,100 | 2,431,915 | |
| Truist Financial Corp. | 14,056 | 796,975 | |
| Wells Fargo & Co. | 1,119,468 | 54,249,419 | |
| 97,119,246 | |||
| Capital Markets - 2.5% | |||
| BlackRock, Inc. Class A | 6,648 | 5,080,202 | |
| Charles Schwab Corp. | 118,052 | 9,952,964 | |
| Intercontinental Exchange, Inc. | 225,100 | 29,740,212 | |
| Morgan Stanley | 195,835 | 17,115,979 | |
| Morningstar, Inc. | 11,261 | 3,076,167 | |
| Raymond James Financial, Inc. | 75,100 | 8,254,241 | |
| State Street Corp. | 13,600 | 1,184,832 | |
| 74,404,597 | |||
| Consumer Finance - 0.6% | |||
| American Express Co. | 97,844 | 18,296,828 | |
| Diversified Financial Services - 0.6% | |||
| Berkshire Hathaway, Inc. Class B (a) | 39,845 | 14,061,699 | |
| WeWork, Inc. (a) | 355,600 | 2,425,192 | |
| 16,486,891 | |||
| Insurance - 2.3% | |||
| American Financial Group, Inc. | 51,723 | 7,531,903 | |
| Arthur J. Gallagher & Co. | 107,154 | 18,709,088 | |
| Chubb Ltd. | 20,200 | 4,320,780 | |
| Hartford Financial Services Group, Inc. | 52,000 | 3,734,120 | |
| Progressive Corp. | 7,800 | 889,122 | |
| The Travelers Companies, Inc. | 168,042 | 30,706,315 | |
| 65,891,328 | |||
TOTAL FINANCIALS | 272,198,890 | ||
| HEALTH CARE - 13.5% | |||
| Biotechnology - 2.1% | |||
| Argenx SE ADR (a) | 3,000 | 945,930 | |
| Intellia Therapeutics, Inc. (a) | 25,900 | 1,882,153 | |
| Nuvalent, Inc. Class A (a) | 11,100 | 154,179 | |
| Regeneron Pharmaceuticals, Inc. (a) | 38,955 | 27,206,951 | |
| Vertex Pharmaceuticals, Inc. (a) | 120,671 | 31,491,511 | |
| 61,680,724 | |||
| Health Care Equipment & Supplies - 1.5% | |||
| Boston Scientific Corp. (a) | 236,037 | 10,454,079 | |
| Intuitive Surgical, Inc. (a) | 30,700 | 9,261,576 | |
| Stryker Corp. | 93,549 | 25,010,325 | |
| 44,725,980 | |||
| Health Care Providers & Services - 5.3% | |||
| agilon health, Inc. (a) | 64,000 | 1,622,400 | |
| Cardinal Health, Inc. | 10,400 | 589,680 | |
| Centene Corp. (a) | 339,800 | 28,607,762 | |
| Guardant Health, Inc. (a) | 21,800 | 1,444,032 | |
| Humana, Inc. | 17,675 | 7,691,630 | |
| Oak Street Health, Inc. (a) | 81,700 | 2,196,096 | |
| UnitedHealth Group, Inc. | 219,808 | 112,095,486 | |
| 154,247,086 | |||
| Health Care Technology - 0.0% | |||
| Inspire Medical Systems, Inc. (a) | 4,000 | 1,026,760 | |
| Life Sciences Tools & Services - 1.4% | |||
| Danaher Corp. | 49,050 | 14,387,837 | |
| Thermo Fisher Scientific, Inc. | 45,633 | 26,953,131 | |
| 41,340,968 | |||
| Pharmaceuticals - 3.2% | |||
| Eli Lilly & Co. | 206,038 | 59,003,102 | |
| Pfizer, Inc. | 179,900 | 9,313,423 | |
| Zoetis, Inc. Class A | 129,950 | 24,507,271 | |
| 92,823,796 | |||
TOTAL HEALTH CARE | 395,845,314 | ||
| INDUSTRIALS - 8.0% | |||
| Aerospace & Defense - 2.6% | |||
| Airbus Group NV | 42,000 | 5,068,077 | |
| Howmet Aerospace, Inc. | 92,500 | 3,324,450 | |
| Lockheed Martin Corp. | 51,500 | 22,732,100 | |
| Northrop Grumman Corp. | 71,290 | 31,882,314 | |
| The Boeing Co. (a) | 75,803 | 14,516,275 | |
| 77,523,216 | |||
| Air Freight & Logistics - 0.5% | |||
| United Parcel Service, Inc. Class B | 65,661 | 14,081,658 | |
| Airlines - 0.2% | |||
| Copa Holdings SA Class A (a) | 9,300 | 777,852 | |
| Delta Air Lines, Inc. (a) | 87,400 | 3,458,418 | |
| Southwest Airlines Co. (a) | 19,000 | 870,200 | |
| 5,106,470 | |||
| Building Products - 0.5% | |||
| Trane Technologies PLC | 96,049 | 14,666,682 | |
| Construction & Engineering - 1.0% | |||
| Fluor Corp. (a) | 177,600 | 5,095,344 | |
| Quanta Services, Inc. | 187,222 | 24,640,287 | |
| 29,735,631 | |||
| Electrical Equipment - 0.5% | |||
| Acuity Brands, Inc. | 53,400 | 10,108,620 | |
| Fluence Energy, Inc. (f) | 23,800 | 312,018 | |
| Rockwell Automation, Inc. | 13,329 | 3,732,520 | |
| 14,153,158 | |||
| Machinery - 1.6% | |||
| Caterpillar, Inc. | 103,600 | 23,084,152 | |
| Deere & Co. | 45,900 | 19,069,614 | |
| Otis Worldwide Corp. | 67,004 | 5,155,958 | |
| 47,309,724 | |||
| Professional Services - 0.0% | |||
| Experian PLC | 33,747 | 1,300,124 | |
| Road & Rail - 1.1% | |||
| Canadian Pacific Railway Ltd. | 62,000 | 5,117,480 | |
| Lyft, Inc. (a) | 5,000 | 192,000 | |
| Old Dominion Freight Lines, Inc. | 13,798 | 4,121,187 | |
| Uber Technologies, Inc. (a) | 404,472 | 14,431,561 | |
| Union Pacific Corp. | 26,700 | 7,294,707 | |
| 31,156,935 | |||
TOTAL INDUSTRIALS | 235,033,598 | ||
| INFORMATION TECHNOLOGY - 24.5% | |||
| IT Services - 4.8% | |||
| Accenture PLC Class A | 115,723 | 39,025,267 | |
| MasterCard, Inc. Class A | 181,759 | 64,957,031 | |
| Twilio, Inc. Class A (a) | 43,000 | 7,086,830 | |
| Visa, Inc. Class A | 131,800 | 29,229,286 | |
| 140,298,414 | |||
| Semiconductors & Semiconductor Equipment - 5.6% | |||
| Advanced Micro Devices, Inc. (a) | 164,251 | 17,959,204 | |
| GlobalFoundries, Inc. | 70,000 | 4,369,400 | |
| Lam Research Corp. | 7,201 | 3,871,330 | |
| Marvell Technology, Inc. | 1,064,948 | 76,367,421 | |
| NVIDIA Corp. | 170,411 | 46,498,345 | |
| Teradyne, Inc. | 125,100 | 14,790,573 | |
| 163,856,273 | |||
| Software - 8.5% | |||
| Adobe, Inc. (a) | 21,819 | 9,941,173 | |
| Confluent, Inc. (f) | 23,700 | 971,700 | |
| Dynatrace, Inc. (a) | 49,236 | 2,319,016 | |
| Intuit, Inc. | 42,254 | 20,317,413 | |
| Microsoft Corp. | 621,413 | 191,587,842 | |
| Salesforce.com, Inc. (a) | 95,095 | 20,190,570 | |
| ServiceNow, Inc. (a) | 3,600 | 2,004,804 | |
| Synopsys, Inc. (a) | 900 | 299,943 | |
| Tenable Holdings, Inc. (a) | 41,209 | 2,381,468 | |
| 250,013,929 | |||
| Technology Hardware, Storage & Peripherals - 5.6% | |||
| Apple, Inc. | 949,855 | 165,854,182 | |
TOTAL INFORMATION TECHNOLOGY | 720,022,798 | ||
| MATERIALS - 5.9% | |||
| Chemicals - 2.2% | |||
| CF Industries Holdings, Inc. | 121,921 | 12,565,178 | |
| Corteva, Inc. | 16,400 | 942,672 | |
| DuPont de Nemours, Inc. | 246,783 | 18,158,293 | |
| Nutrien Ltd. (f) | 38,500 | 4,003,615 | |
| Sherwin-Williams Co. | 11,266 | 2,812,219 | |
| The Mosaic Co. | 384,100 | 25,542,650 | |
| 64,024,627 | |||
| Metals & Mining - 3.7% | |||
| Alcoa Corp. | 24,600 | 2,214,738 | |
| Barrick Gold Corp. | 239,900 | 5,884,747 | |
| First Quantum Minerals Ltd. | 159,700 | 5,528,789 | |
| Franco-Nevada Corp. | 4,111 | 654,195 | |
| Freeport-McMoRan, Inc. | 1,031,653 | 51,314,420 | |
| Glencore Xstrata PLC | 762,000 | 4,958,113 | |
| Newmont Corp. | 405,400 | 32,209,030 | |
| Nucor Corp. | 35,600 | 5,291,940 | |
| 108,055,972 | |||
TOTAL MATERIALS | 172,080,599 | ||
| REAL ESTATE - 1.0% | |||
| Equity Real Estate Investment Trusts (REITs) - 0.9% | |||
| American Tower Corp. | 22,500 | 5,652,450 | |
| Equity Residential (SBI) | 26,637 | 2,395,199 | |
| Lamar Advertising Co. Class A | 77,398 | 8,992,100 | |
| SL Green Realty Corp. | 110,337 | 8,957,158 | |
| 25,996,907 | |||
| Real Estate Management & Development - 0.1% | |||
| Jones Lang LaSalle, Inc. (a) | 21,044 | 5,039,196 | |
TOTAL REAL ESTATE | 31,036,103 | ||
| UTILITIES - 1.5% | |||
| Electric Utilities - 1.5% | |||
| Exelon Corp. | 5,400 | 257,202 | |
| NextEra Energy, Inc. | 247,300 | 20,948,783 | |
| Southern Co. | 303,685 | 22,020,199 | |
| 43,226,184 | |||
| Independent Power and Renewable Electricity Producers - 0.0% | |||
| NextEra Energy Partners LP | 14,600 | 1,217,056 | |
| Vistra Corp. | 26,000 | 604,500 | |
| 1,821,556 | |||
TOTAL UTILITIES | 45,047,740 | ||
| TOTAL COMMON STOCKS (Cost $1,875,614,791) | 2,852,974,000 | ||
| Convertible Preferred Stocks - 0.6% | |||
| Shares | Value ($) | ||
| COMMUNICATION SERVICES - 0.0% | |||
| Interactive Media & Services - 0.0% | |||
| Reddit, Inc. Series E (d)(e) | 3,500 | 216,280 | |
| INFORMATION TECHNOLOGY - 0.6% | |||
| IT Services - 0.6% | |||
| ByteDance Ltd. Series E1 (a)(d)(e) | 17,226 | 2,536,529 | |
| Yanka Industries, Inc.: | |||
| Series E (a)(d)(e) | 165,574 | 5,277,969 | |
| Series F (d)(e) | 265,105 | 8,450,699 | |
| 16,265,197 | |||
| Software - 0.0% | |||
| Evozyne LLC Series A (d)(e) | 20,000 | 339,600 | |
TOTAL INFORMATION TECHNOLOGY | 16,604,797 | ||
| TOTAL CONVERTIBLE PREFERRED STOCKS (Cost $12,936,285) | 16,821,077 | ||
| Money Market Funds - 2.3% | |||
| Shares | Value ($) | ||
| Fidelity Cash Central Fund 0.31% (g) | 66,021,431 | 66,034,635 | |
| Fidelity Securities Lending Cash Central Fund 0.31% (g)(h) | 2,082,755 | 2,082,964 | |
| TOTAL MONEY MARKET FUNDS (Cost $68,117,599) | 68,117,599 | ||
| TOTAL INVESTMENT IN SECURITIES - 100.0% (Cost $1,956,668,675) | 2,937,912,676 |
NET OTHER ASSETS (LIABILITIES) - 0.0% | (749,652) |
| NET ASSETS - 100.0% | 2,937,163,024 |
| (a) | Non-income producing |
| (b) | Security exempt from registration under Rule 144A of the Securities Act of 1933. These securities may be resold in transactions exempt from registration, normally to qualified institutional buyers. At the end of the period, the value of these securities amounted to $7,923,817 or 0.3% of net assets. |
| (c) | Investment is owned by a wholly-owned subsidiary (Subsidiary) that is treated as a corporation for U.S. tax purposes. |
| (d) | Restricted securities (including private placements) - Investment in securities not registered under the Securities Act of 1933 (excluding 144A issues). At the end of the period, the value of restricted securities (excluding 144A issues) amounted to $20,829,988 or 0.7% of net assets. |
| (e) | Level 3 security |
| (f) | Security or a portion of the security is on loan at period end. |
| (g) | Affiliated fund that is generally available only to investment companies and other accounts managed by Fidelity Investments. The rate quoted is the annualized seven-day yield of the fund at period end. A complete unaudited listing of the fund's holdings as of its most recent quarter end is available upon request. In addition, each Fidelity Central Fund's financial statements are available on the SEC's website or upon request. |
| (h) | Investment made with cash collateral received from securities on loan. |
| Additional information on each restricted holding is as follows: | ||
| Security | Acquisition Date | Acquisition Cost ($) |
| ByteDance Ltd. Series E1 | 11/18/20 | 1,887,525 |
| Evozyne LLC Series A | 4/09/21 | 449,400 |
| Reddit, Inc. Series E | 5/18/21 | 148,660 |
| Starling Bank Ltd. Series D | 6/18/21 | 1,403,669 |
| Tory Burch LLC | 5/14/15 | 2,039,212 |
| Yanka Industries, Inc. Series E | 5/15/20 | 2,000,001 |
| Yanka Industries, Inc. Series F | 4/08/21 | 8,450,699 |
| Affiliate | Value, beginning of period ($) | Purchases ($) | Sales Proceeds ($) | Dividend Income ($) | Realized Gain (loss) ($) | Change in Unrealized appreciation (depreciation) ($) | Value, end of period ($) | %ownership, end of period |
| Fidelity Cash Central Fund 0.31% | 42,645,779 | 246,835,257 | 223,446,401 | 22,428 | - | - | 66,034,635 | 0.1% |
| Fidelity Securities Lending Cash Central Fund 0.31% | 22,610,039 | 195,733,219 | 216,260,294 | 26,036 | - | - | 2,082,964 | 0.0% |
| Total | 65,255,818 | 442,568,476 | 439,706,695 | 48,464 | - | - | 68,117,599 |
| Valuation Inputs at Reporting Date: | ||||
| Description | Total ($) | Level 1 ($) | Level 2 ($) | Level 3 ($) |
Investments in Securities: | ||||
| Equities: | ||||
Communication Services | 284,116,007 | 283,899,727 | - | 216,280 |
Consumer Discretionary | 333,222,946 | 299,406,111 | 32,239,839 | 1,576,996 |
Consumer Staples | 91,345,662 | 64,290,947 | 27,054,715 | - |
Energy | 273,240,623 | 270,652,426 | 2,588,197 | - |
Financials | 272,198,890 | 269,766,975 | - | 2,431,915 |
Health Care | 395,845,314 | 395,845,314 | - | - |
Industrials | 235,033,598 | 228,665,397 | 6,368,201 | - |
Information Technology | 736,627,595 | 720,022,798 | - | 16,604,797 |
Materials | 172,080,599 | 167,122,486 | 4,958,113 | - |
Real Estate | 31,036,103 | 31,036,103 | - | - |
Utilities | 45,047,740 | 45,047,740 | - | - |
| Money Market Funds | 68,117,599 | 68,117,599 | - | - |
| Total Investments in Securities: | 2,937,912,676 | 2,843,873,623 | 73,209,065 | 20,829,988 |
| Statement of Assets and Liabilities | ||||
March 31, 2022 (Unaudited) | ||||
| Assets | ||||
| Investment in securities, at value (including securities loaned of $2,027,035) - See accompanying schedule: | $2,869,795,077 | |||
Unaffiliated issuers (cost $1,888,551,076) | ||||
Fidelity Central Funds (cost $68,117,599) | 68,117,599 | |||
| Total Investments in Securities (cost $1,956,668,675) | $ | 2,937,912,676 | ||
| Cash | 832,526 | |||
| Restricted cash | 260,310 | |||
| Foreign currency held at value (cost $1,132) | 1,132 | |||
| Receivable for investments sold | 18,116,066 | |||
| Receivable for fund shares sold | 628,488 | |||
| Dividends receivable | 1,361,073 | |||
| Distributions receivable from Fidelity Central Funds | 13,459 | |||
| Prepaid expenses | 1,435 | |||
| Other receivables | 15,819 | |||
Total assets | 2,959,142,984 | |||
| Liabilities | ||||
| Payable for investments purchased | $16,979,953 | |||
| Payable for fund shares redeemed | 1,547,057 | |||
| Accrued management fee | 935,215 | |||
| Distribution and service plan fees payable | 132,808 | |||
| Other affiliated payables | 151,895 | |||
| Other payables and accrued expenses | 153,557 | |||
| Collateral on securities loaned | 2,079,475 | |||
| Total Liabilities | 21,979,960 | |||
| Net Assets | $ | 2,937,163,024 | ||
| Net Assets consist of: | ||||
| Paid in capital | $ | 1,808,198,357 | ||
| Total accumulated earnings (loss) | 1,128,964,667 | |||
| Net Assets | $ | 2,937,163,024 | ||
| Net Asset Value and Maximum Offering Price | ||||
| Class O : | ||||
Net Asset Value , offering price and redemption price per share ($2,325,562,970 ÷ 70,057,909 shares) | $ | 33.19 | ||
| Class A : | ||||
Net Asset Value and redemption price per share ($417,102,596 ÷ 13,067,936 shares) (a) | $ | 31.92 | ||
| Maximum offering price per share (100/94.25 of $31.92) | $ | 33.87 | ||
| Class M : | ||||
Net Asset Value and redemption price per share ($56,312,048 ÷ 1,787,291 shares) (a) | $ | 31.51 | ||
| Maximum offering price per share (100/96.50 of $31.51) | $ | 32.65 | ||
| Class C : | ||||
Net Asset Value and offering price per share ($31,674,148 ÷ 1,050,998 shares) (a) | $ | 30.14 | ||
| Class I : | ||||
Net Asset Value , offering price and redemption price per share ($87,745,142 ÷ 2,521,124 shares) | $ | 34.80 | ||
| Class Z : | ||||
Net Asset Value , offering price and redemption price per share ($18,766,120 ÷ 546,460 shares) | $ | 34.34 | ||
(a)Redemption price per share is equal to net asset value less any applicable contingent deferred sales charge. | ||||
| Statement of Operations | ||||
Six months ended March 31, 2022 (Unaudited) | ||||
| Investment Income | ||||
| Dividends | $ | 15,569,188 | ||
| Interest | 12 | |||
| Income from Fidelity Central Funds (including $26,036 from security lending) | 48,464 | |||
| Total Income | 15,617,664 | |||
| Expenses | ||||
| Management fee | $ | 5,910,361 | ||
| Transfer agent fees | 1,814,546 | |||
| Distribution and service plan fees | 835,823 | |||
| Accounting fees | 440,904 | |||
| Custodian fees and expenses | 40,558 | |||
| Independent trustees' fees and expenses | 5,270 | |||
| Registration fees | 44,391 | |||
| Audit | 69,600 | |||
| Legal | 6,796 | |||
| Interest | 535 | |||
| Miscellaneous | 6,643 | |||
| Total expenses before reductions | 9,175,427 | |||
| Expense reductions | (1,350,119) | |||
| Total expenses after reductions | 7,825,308 | |||
| Net Investment income (loss) | 7,792,356 | |||
| Realized and Unrealized Gain (Loss) | ||||
| Net realized gain (loss) on: | ||||
| Investment Securities: | ||||
| Unaffiliated issuers(net of foreign taxes of $243,208) | 183,107,737 | |||
| Foreign currency transactions | (4,305) | |||
| Written options | 193,204 | |||
| Total net realized gain (loss) | 183,296,636 | |||
| Change in net unrealized appreciation (depreciation) on: | ||||
| Investment Securities: | ||||
| Unaffiliated issuers (net of decrease in deferred foreign taxes of $274,616) | (62,973,231) | |||
| Assets and liabilities in foreign currencies | 3,370 | |||
| Total change in net unrealized appreciation (depreciation) | (62,969,861) | |||
| Net gain (loss) | 120,326,775 | |||
| Net increase (decrease) in net assets resulting from operations | $ | 128,119,131 | ||
| Statement of Changes in Net Assets | ||||
Six months ended March 31, 2022 (Unaudited) | Year ended September 30, 2021 | |||
| Increase (Decrease) in Net Assets | ||||
| Operations | ||||
| Net investment income (loss) | $ | 7,792,356 | $ | 10,762,817 |
| Net realized gain (loss) | 183,296,636 | 462,609,108 | ||
| Change in net unrealized appreciation (depreciation) | (62,969,861) | 193,171,668 | ||
| Net increase (decrease) in net assets resulting from operations | 128,119,131 | 666,543,593 | ||
| Distributions to shareholders | (458,516,862) | (129,966,523) | ||
| Share transactions - net increase (decrease) | 357,541,576 | (21,296,837) | ||
| Total increase (decrease) in net assets | 27,143,845 | 515,280,233 | ||
| Net Assets | ||||
| Beginning of period | 2,910,019,179 | 2,394,738,946 | ||
| End of period | $ | 2,937,163,024 | $ | 2,910,019,179 |
| Fidelity Advisor® Diversified Stock Fund Class O |
Six months ended (Unaudited) March 31, 2022 | Years ended September 30, 2021 | 2020 | 2019 | 2018 | 2017 | |||||||
Selected Per-Share Data | ||||||||||||
| Net asset value, beginning of period | $ | 37.32 | $ | 30.57 | $ | 24.95 | $ | 28.95 | $ | 26.07 | $ | 22.27 |
| Income from Investment Operations | ||||||||||||
Net investment income (loss) A,B | .11 | .16 | .20 | .22 | .21 | .39 | ||||||
| Net realized and unrealized gain (loss) | 1.67 | 8.28 | 6.28 | (1.33) | 4.95 | 3.80 | ||||||
| Total from investment operations | 1.78 | 8.44 | 6.48 | (1.11) | 5.16 | 4.19 | ||||||
| Distributions from net investment income | (.21) | (.17) | (.22) | (.17) | (.35) | (.36) C | ||||||
| Distributions from net realized gain | (5.70) | (1.53) | (.64) | (2.71) | (1.93) | (.03) C | ||||||
| Total distributions | (5.91) | (1.69) D | (.86) | (2.89) D | (2.28) | (.39) | ||||||
| Net asset value, end of period | $ | 33.19 | $ | 37.32 | $ | 30.57 | $ | 24.95 | $ | 28.95 | $ | 26.07 |
Total Return E,F | 4.42% | 28.60% | 26.50% | (2.68)% G | 21.08% G | 18.99% G | ||||||
Ratios to Average Net Assets H,I,B | ||||||||||||
| Expenses before reductions | .55% J | .55% | .57% | .57% | .47% | .48% | ||||||
| Expenses net of fee waivers, if any | .44% J | .45% | .46% | .46% | .47% | .48% | ||||||
| Expenses net of all reductions | .44% J | .44% | .45% | .46% | .46% | .48% | ||||||
| Net investment income (loss) | .60% J | .47% | .74% | .88% | .78% | 1.61% | ||||||
| Supplemental Data | ||||||||||||
| Net assets, end of period (000 omitted) | $ | 2,325,563 | $ | 2,335,000 | $ | 1,935,829 | $ | 1,640,484 | $ | 1,855,761 | $ | 1,763,983 |
Portfolio turnover rate K | 86% J | 75% | 78% | 95% | 103% | 77% |
| Fidelity Advisor® Diversified Stock Fund Class A |
Six months ended (Unaudited) March 31, 2022 | Years ended September 30, 2021 | 2020 | 2019 | 2018 | 2017 | |||||||
Selected Per-Share Data | ||||||||||||
| Net asset value, beginning of period | $ | 36.04 | $ | 29.58 | $ | 24.17 | $ | 28.14 | $ | 25.40 | $ | 21.71 |
| Income from Investment Operations | ||||||||||||
Net investment income (loss) A,B | .04 | .04 | .10 | .12 | .11 | .30 | ||||||
| Net realized and unrealized gain (loss) | 1.62 | 8.01 | 6.08 | (1.30) | 4.82 | 3.70 | ||||||
| Total from investment operations | 1.66 | 8.05 | 6.18 | (1.18) | 4.93 | 4.00 | ||||||
| Distributions from net investment income | (.08) | (.07) | (.13) | (.08) | (.26) | (.28) C | ||||||
| Distributions from net realized gain | (5.70) | (1.53) | (.64) | (2.71) | (1.93) | (.03) C | ||||||
| Total distributions | (5.78) | (1.59) D | (.77) | (2.79) | (2.19) | (.31) | ||||||
| Net asset value, end of period | $ | 31.92 | $ | 36.04 | $ | 29.58 | $ | 24.17 | $ | 28.14 | $ | 25.40 |
Total Return E,F,G | 4.26% | 28.17% | 26.05% | (3.05)% H | 20.67% H | 18.58% H | ||||||
Ratios to Average Net Assets I,J,B | ||||||||||||
| Expenses before reductions | .84% K | .85% | .87% | .88% | .82% | .83% | ||||||
| Expenses net of fee waivers, if any | .79% K | .80% | .81% | .82% | .81% | .82% | ||||||
| Expenses net of all reductions | .79% K | .79% | .80% | .81% | .80% | .82% | ||||||
| Net investment income (loss) | .25% K | .12% | .38% | .52% | .43% | 1.27% | ||||||
| Supplemental Data | ||||||||||||
| Net assets, end of period (000 omitted) | $ | 417,103 | $ | 399,876 | $ | 314,622 | $ | 270,441 | $ | 284,276 | $ | 252,202 |
Portfolio turnover rate L | 86% K | 75% | 78% | 95% | 103% | 77% |
| Fidelity Advisor® Diversified Stock Fund Class M |
Six months ended (Unaudited) March 31, 2022 | Years ended September 30, 2021 | 2020 | 2019 | 2018 | 2017 | |||||||
Selected Per-Share Data | ||||||||||||
| Net asset value, beginning of period | $ | 35.60 | $ | 29.27 | $ | 23.91 | $ | 27.86 | $ | 25.17 | $ | 21.53 |
| Income from Investment Operations | ||||||||||||
Net investment income (loss) A,B | (.01) | (.07) | .01 | .04 | .01 | .20 | ||||||
| Net realized and unrealized gain (loss) | 1.60 | 7.93 | 6.02 | (1.29) | 4.78 | 3.68 | ||||||
| Total from investment operations | 1.59 | 7.86 | 6.03 | (1.25) | 4.79 | 3.88 | ||||||
| Distributions from net investment income | - | - | (.03) | - | (.17) | (.21) C | ||||||
| Distributions from net realized gain | (5.68) | (1.53) | (.64) | (2.70) | (1.93) | (.03) C | ||||||
| Total distributions | (5.68) | (1.53) | (.67) | (2.70) | (2.10) | (.24) | ||||||
| Net asset value, end of period | $ | 31.51 | $ | 35.60 | $ | 29.27 | $ | 23.91 | $ | 27.86 | $ | 25.17 |
Total Return D,E,F | 4.08% | 27.74% | 25.64% | (3.42)% | 20.23% | 18.10% | ||||||
Ratios to Average Net Assets G,H,B | ||||||||||||
| Expenses before reductions | 1.11% I | 1.13% | 1.17% | 1.18% | 1.19% | 1.22% | ||||||
| Expenses net of fee waivers, if any | 1.11% I | 1.13% | 1.16% | 1.18% | 1.19% | 1.22% | ||||||
| Expenses net of all reductions | 1.11% I | 1.12% | 1.16% | 1.18% | 1.18% | 1.21% | ||||||
| Net investment income (loss) | (.07)% I | (.21)% | .03% | .16% | .06% | .87% | ||||||
| Supplemental Data | ||||||||||||
| Net assets, end of period (000 omitted) | $ | 56,312 | $ | 53,062 | $ | 42,562 | $ | 38,382 | $ | 41,540 | $ | 36,726 |
Portfolio turnover rate J | 86% I | 75% | 78% | 95% | 103% | 77% |
| Fidelity Advisor® Diversified Stock Fund Class C |
Six months ended (Unaudited) March 31, 2022 | Years ended September 30, 2021 | 2020 | 2019 | 2018 | 2017 | |||||||
Selected Per-Share Data | ||||||||||||
| Net asset value, beginning of period | $ | 34.17 | $ | 28.30 | $ | 23.21 | $ | 27.13 | $ | 24.57 | $ | 21.03 |
| Income from Investment Operations | ||||||||||||
Net investment income (loss) A,B | (.10) | (.25) | (.13) | (.09) | (.12) | .08 | ||||||
| Net realized and unrealized gain (loss) | 1.53 | 7.65 | 5.82 | (1.25) | 4.65 | 3.59 | ||||||
| Total from investment operations | 1.43 | 7.40 | 5.69 | (1.34) | 4.53 | 3.67 | ||||||
| Distributions from net investment income | - | - | - C | - | (.04) | (.10) D | ||||||
| Distributions from net realized gain | (5.46) | (1.53) | (.60) | (2.58) | (1.93) | (.03) D | ||||||
| Total distributions | (5.46) | (1.53) | (.60) | (2.58) | (1.97) | (.13) | ||||||
| Net asset value, end of period | $ | 30.14 | $ | 34.17 | $ | 28.30 | $ | 23.21 | $ | 27.13 | $ | 24.57 |
Total Return E,F,G | 3.79% | 27.03% | 24.87% | (3.92)% | 19.55% | 17.51% | ||||||
Ratios to Average Net Assets H,I,B | ||||||||||||
| Expenses before reductions | 1.68% J | 1.70% | 1.73% | 1.74% | 1.74% | 1.76% | ||||||
| Expenses net of fee waivers, if any | 1.68% J | 1.70% | 1.73% | 1.74% | 1.74% | 1.76% | ||||||
| Expenses net of all reductions | 1.68% J | 1.69% | 1.72% | 1.74% | 1.73% | 1.75% | ||||||
| Net investment income (loss) | (.64)% J | (.78)% | (.54)% | (.40)% | (.49)% | .33% | ||||||
| Supplemental Data | ||||||||||||
| Net assets, end of period (000 omitted) | $ | 31,674 | $ | 32,096 | $ | 30,556 | $ | 29,785 | $ | 34,772 | $ | 29,147 |
Portfolio turnover rate K | 86% J | 75% | 78% | 95% | 103% | 77% |
| Fidelity Advisor® Diversified Stock Fund Class I |
Six months ended (Unaudited) March 31, 2022 | Years ended September 30, 2021 | 2020 | 2019 | 2018 | 2017 | |||||||
Selected Per-Share Data | ||||||||||||
| Net asset value, beginning of period | $ | 38.84 | $ | 31.75 | $ | 25.88 | $ | 29.91 | $ | 26.87 | $ | 22.94 |
| Income from Investment Operations | ||||||||||||
Net investment income (loss) A,B | .09 | .12 | .16 | .18 | .17 | .36 | ||||||
| Net realized and unrealized gain (loss) | 1.73 | 8.62 | 6.52 | (1.36) | 5.11 | 3.92 | ||||||
| Total from investment operations | 1.82 | 8.74 | 6.68 | (1.18) | 5.28 | 4.28 | ||||||
| Distributions from net investment income | (.16) | (.12) | (.18) | (.13) | (.31) | (.32) C | ||||||
| Distributions from net realized gain | (5.70) | (1.53) | (.64) | (2.71) | (1.93) | (.03) C | ||||||
| Total distributions | (5.86) | (1.65) | (.81) D | (2.85) D | (2.24) | (.35) | ||||||
| Net asset value, end of period | $ | 34.80 | $ | 38.84 | $ | 31.75 | $ | 25.88 | $ | 29.91 | $ | 26.87 |
Total Return E,F | 4.35% | 28.43% | 26.32% | (2.85)% | 20.88% | 18.81% | ||||||
Ratios to Average Net Assets G,H,B | ||||||||||||
| Expenses before reductions | .58% I | .59% | .61% | .62% | .62% | .63% | ||||||
| Expenses net of fee waivers, if any | .58% I | .59% | .61% | .62% | .62% | .63% | ||||||
| Expenses net of all reductions | .58% I | .58% | .60% | .62% | .61% | .63% | ||||||
| Net investment income (loss) | .46% I | .33% | .59% | .72% | .62% | 1.46% | ||||||
| Supplemental Data | ||||||||||||
| Net assets, end of period (000 omitted) | $ | 87,745 | $ | 73,345 | $ | 58,886 | $ | 56,150 | $ | 49,619 | $ | 49,107 |
Portfolio turnover rate J | 86% I | 75% | 78% | 95% | 103% | 77% |
| Fidelity Advisor® Diversified Stock Fund Class Z |
Six months ended (Unaudited) March 31, 2022 | Years ended September 30, 2021 | 2020 | 2019 | 2018 | 2017 | |||||||
Selected Per-Share Data | ||||||||||||
| Net asset value, beginning of period | $ | 38.41 | $ | 31.42 | $ | 25.62 | $ | 29.65 | $ | 26.66 | $ | 22.76 |
| Income from Investment Operations | ||||||||||||
Net investment income (loss) A,B | .10 | .16 | .19 | .21 | .21 | .40 | ||||||
| Net realized and unrealized gain (loss) | 1.73 | 8.51 | 6.46 | (1.36) | 5.06 | 3.88 | ||||||
| Total from investment operations | 1.83 | 8.67 | 6.65 | (1.15) | 5.27 | 4.28 | ||||||
| Distributions from net investment income | (.19) | (.16) | (.21) | (.17) | (.35) | (.35) C | ||||||
| Distributions from net realized gain | (5.70) | (1.53) | (.64) | (2.71) | (1.93) | (.03) C | ||||||
| Total distributions | (5.90) D | (1.68) D | (.85) | (2.88) | (2.28) | (.38) | ||||||
| Net asset value, end of period | $ | 34.34 | $ | 38.41 | $ | 31.42 | $ | 25.62 | $ | 29.65 | $ | 26.66 |
Total Return E,F | 4.42% | 28.55% | 26.47% | (2.74)% | 21.02% | 18.98% | ||||||
Ratios to Average Net Assets B,G,H | ||||||||||||
| Expenses before reductions | .48% I | .48% | .49% | .50% | .51% | .51% | ||||||
| Expenses net of fee waivers, if any | .47% I | .48% | .49% | .50% | .50% | .51% | ||||||
| Expenses net of all reductions | .47% I | .47% | .49% | .49% | .49% | .50% | ||||||
| Net investment income (loss) | .57% I | .44% | .70% | .84% | .74% | 1.58% | ||||||
| Supplemental Data | ||||||||||||
| Net assets, end of period (000 omitted) | $ | 18,766 | $ | 16,639 | $ | 12,284 | $ | 10,010 | $ | 6,288 | $ | 934 |
Portfolio turnover rate J | 86% I | 75% | 78% | 95% | 103% | 77% |
| Fidelity Central Fund | Investment Manager | Investment Objective | Investment Practices | Expense Ratio (a) |
| Fidelity Money Market Central Funds | Fidelity Management & Research Company LLC (FMR) | Each fund seeks to obtain a high level of current income consistent with the preservation of capital and liquidity. | Short-term Investments | Less than .005% |
| (a) Expenses expressed as a percentage of average net assets and are as of each underlying Central Fund's most recent annual or semi-annual shareholder report. | ||||
| Amount ($) | |
| Fidelity Advisor® Diversified Stock Fund | 11,614 |
| Amount ($) | ||
| Gross unrealized appreciation | 1,013,245,308 | |
| Gross unrealized depreciation | (35,605,771) | |
| Net unrealized appreciation (depreciation) | 977,639,537 | |
| Tax Cost | 1,960,273,139 |
| Amount ($) | % of Net Assets | |
| Fidelity Advisor® Diversified Stock Fund | 1,837,306 | .06 |
| Purchases ($) | Sales ($) | |
| Fidelity Advisor® Diversified Stock Fund | 1,273,454,053 | 1,388,997,950 |
| Distribution Fee (%) | Service Fee (%) | Total Fees ($) | Retained by FDC ($) | ||||
| Class A | - | .25 | 524,854 | 6,509 | |||
| Class M | .25 | .25 | 142,202 | 141 | |||
| Class C | .75 | .25 | 168,767 | 22,567 | |||
| 835,823 | 29,217 | ||||||
| Retained by FDC ($) | |||
| Class A | 29,633 | ||
| Class M | 2,871 | ||
Class C (a) | 1,044 | ||
| 33,548 | |||
Amount ($) | % of Class-Level Average Net Assets (a) | ||
| Class O | 1,337,219 | .11 | |
| Class A | 320,725 | .15 | |
| Class M | 50,979 | .18 | |
| Class C | 41,529 | .25 | |
| Class I | 60,455 | .15 | |
| Class Z | 3,639 | .04 | |
| 1,814,546 |
| (a) Annualized |
| % of Average Net Assets | |
| Fidelity Advisor® Diversified Stock Fund | .03 |
| Amount ($) | |
| Fidelity Advisor® Diversified Stock Fund | 23,053 |
| Borrower or Lender | Average Loan Balance ($) | Weighted Average Interest Rate (%) | Interest Expense ($) | |
| Fidelity Advisor® Diversified Stock Fund | Borrower | 30,579,000 | .32 | 535 |
| Purchases ($) | Sales ($) | Realized Gain (Loss) ($) | |
| Fidelity Advisor® Diversified Stock Fund | 75,554,503 | 96,240,452 | 11,933,773 |
| Amount ($) | |
| Fidelity Advisor® Diversified Stock Fund | 7,601 |
Amount ($) | |
| Fidelity Advisor® Diversified Stock Fund | 3,651 |
| Total Security Lending Fees Paid to NFS ($) | Security Lending Income From Securities Loaned to NFS ($) | Value of Securities Loaned to NFS at Period End ($) | |||
| Fidelity Advisor® Diversified Stock Fund | 2,755 | 664 | - |
| Transfer Agent Fees Limitation (%) | Waiver ($) | ||
| Class O | .01 | 1,215,670 | |
| Class A | .11 | 87,836 | |
Six months ended March 31, 2022 ($) | Year ended September 30, 2021($) | |||
| Fidelity Advisor® Diversified Stock Fund | ||||
| Distributions to shareholders | ||||
| Class O | 365,744,514 | 105,523,412 | ||
| Class A | 64,804,883 | 16,854,693 | ||
| Class M | 8,769,739 | 2,208,844 | ||
| Class C | 5,288,572 | 1,640,537 | ||
| Class I | 11,364,983 | 3,033,937 | ||
| Class Z | 2,544,171 | 705,100 | ||
| Total | 458,516,862 | 129,966,523 | ||
| Shares Six months ended March 31, 2022 | Shares Year ended September 30, 2021 | Dollars Six months ended March 31, 2022 ($) | Dollars Year ended September 30, 2021 ($) | ||||||
| Fidelity Advisor® Diversified Stock Fund | |||||||||
| Class O | |||||||||
| Shares Sold | 248,291 | 373,788 | 8,895,643 | 12,954,053 | |||||
| Reinvestment of distributions | 9,413,530 | 2,912,153 | 319,306,942 | 92,257,018 | |||||
| Shares redeemed | (2,167,202) | (4,046,204) | (76,544,973) | (139,725,195) | |||||
| Net increase (decrease) | 7,494,619 | (760,263) | 251,657,612 | (34,514,124) | |||||
| Class A | |||||||||
| Shares Sold | 794,704 | 1,393,229 | 27,615,822 | 47,334,439 | |||||
| Reinvestment of distributions | 1,959,101 | 542,144 | 63,964,640 | 16,627,568 | |||||
| Shares redeemed | (780,900) | (1,475,210) | (26,318,439) | (49,929,626) | |||||
| Net increase (decrease) | 1,972,905 | 460,163 | 65,262,023 | 14,032,381 | |||||
| Class M | |||||||||
| Shares Sold | 199,860 | 266,618 | 6,884,511 | 8,894,164 | |||||
| Reinvestment of distributions | 270,089 | 72,071 | 8,713,064 | 2,188,795 | |||||
| Shares redeemed | (173,329) | (302,185) | (5,603,117) | (10,032,169) | |||||
| Net increase (decrease) | 296,620 | 36,504 | 9,994,458 | 1,050,790 | |||||
| Class C | |||||||||
| Shares Sold | 137,552 | 126,334 | 4,663,715 | 4,002,340 | |||||
| Reinvestment of distributions | 167,701 | 55,108 | 5,183,644 | 1,613,562 | |||||
| Shares redeemed | (193,687) | (321,597) | (6,095,277) | (10,528,692) | |||||
| Net increase (decrease) | 111,566 | (140,155) | 3,752,082 | (4,912,790) | |||||
| Class I | |||||||||
| Shares Sold | 627,925 | 594,307 | 22,860,588 | 21,936,286 | |||||
| Reinvestment of distributions | 252,131 | 73,124 | 8,970,838 | 2,413,101 | |||||
| Shares redeemed | (247,381) | (633,517) | (8,886,475) | (22,676,183) | |||||
| Net increase (decrease) | 632,675 | 33,914 | 22,944,951 | 1,673,204 | |||||
| Class Z | |||||||||
| Shares Sold | 102,217 | 139,654 | 3,583,409 | 4,995,565 | |||||
| Reinvestment of distributions | 66,191 | 19,967 | 2,323,303 | 651,128 | |||||
| Shares redeemed | (55,118) | (117,408) | (1,976,262) | (4,272,991) | |||||
| Net increase (decrease) | 113,290 | 42,213 | 3,930,450 | 1,373,702 | |||||
| The Example is based on an investment of $1,000 invested at the beginning of the period and held for the entire period (October 1, 2021 to March 31, 2022). |
Annualized Expense Ratio- A | Beginning Account Value October 1, 2021 | Ending Account Value March 31, 2022 | Expenses Paid During Period- C October 1, 2021 to March 31, 2022 | |||||||
| Fidelity Advisor® Diversified Stock Fund | ||||||||||
| Class O | .44% | |||||||||
| Actual | $ 1,000 | $ 1,044.20 | $ 2.24 | |||||||
Hypothetical- B | $ 1,000 | $ 1,022.74 | $ 2.22 | |||||||
| Class A | .79% | |||||||||
| Actual | $ 1,000 | $ 1,042.60 | $ 4.02 | |||||||
Hypothetical- B | $ 1,000 | $ 1,020.99 | $ 3.98 | |||||||
| Class M | 1.11% | |||||||||
| Actual | $ 1,000 | $ 1,040.80 | $ 5.65 | |||||||
Hypothetical- B | $ 1,000 | $ 1,019.40 | $ 5.59 | |||||||
| Class C | 1.68% | |||||||||
| Actual | $ 1,000 | $ 1,037.90 | $ 8.54 | |||||||
Hypothetical- B | $ 1,000 | $ 1,016.55 | $ 8.45 | |||||||
| Class I | .58% | |||||||||
| Actual | $ 1,000 | $ 1,043.50 | $ 2.95 | |||||||
Hypothetical- B | $ 1,000 | $ 1,022.04 | $ 2.92 | |||||||
| Class Z | .47% | |||||||||
| Actual | $ 1,000 | $ 1,044.20 | $ 2.40 | |||||||
Hypothetical- B | $ 1,000 | $ 1,022.59 | $ 2.37 | |||||||
- Highly liquid investments - cash or convertible to cash within three business days or less
- Moderately liquid investments - convertible to cash in three to seven calendar days
- Less liquid investments - can be sold or disposed of, but not settled, within seven calendar days
- Illiquid investments - cannot be sold or disposed of within seven calendar days
|


Contents
Top Holdings (% of Fund's net assets) | ||
| Microsoft Corp. | 6.7 | |
| General Electric Co. | 6.1 | |
| Exxon Mobil Corp. | 5.8 | |
| Wells Fargo & Co. | 5.0 | |
| Apple, Inc. | 3.5 | |
| Bank of America Corp. | 3.1 | |
| Comcast Corp. Class A | 2.4 | |
| Altria Group, Inc. | 2.2 | |
| Bristol-Myers Squibb Co. | 2.0 | |
| Hess Corp. | 2.0 | |
| 38.8 | ||
| Market Sectors (% of Fund's net assets) | ||
| Information Technology | 19.6 | |
| Financials | 16.8 | |
| Industrials | 14.3 | |
| Health Care | 14.0 | |
| Energy | 11.2 | |
| Communication Services | 9.0 | |
| Consumer Staples | 5.8 | |
| Consumer Discretionary | 4.3 | |
| Materials | 3.2 | |
| Real Estate | 0.8 | |
| Utilities | 0.4 | |
Asset Allocation (% of Fund's net assets) |
 |
Foreign investments - 10.7% |
Geographic Diversification (% of Fund's net assets) |
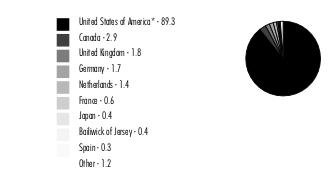 |
* Includes Short-Term investments and Net Other Assets (Liabilities). Percentages are based on country or territory of incorporation and are adjusted for the effect of futures contracts, if applicable. |
| Common Stocks - 99.3% | |||
| Shares | Value ($) | ||
| COMMUNICATION SERVICES - 9.0% | |||
| Diversified Telecommunication Services - 0.4% | |||
| Cellnex Telecom SA (a) | 91,400 | 4,398,571 | |
| Verizon Communications, Inc. | 197,006 | 10,035,486 | |
| 14,434,057 | |||
| Entertainment - 1.8% | |||
| Activision Blizzard, Inc. | 83,500 | 6,689,185 | |
| Nintendo Co. Ltd. ADR | 190,500 | 11,984,355 | |
| The Walt Disney Co. (b) | 244,900 | 33,590,484 | |
| Universal Music Group NV | 774,200 | 20,722,020 | |
| 72,986,044 | |||
| Interactive Media & Services - 3.9% | |||
| Alphabet, Inc.: | |||
| Class A (b) | 21,700 | 60,355,295 | |
| Class C (b) | 19,283 | 53,857,226 | |
| Meta Platforms, Inc. Class A (b) | 155,439 | 34,563,416 | |
| Snap, Inc. Class A (b) | 141,300 | 5,085,387 | |
| 153,861,324 | |||
| Media - 2.9% | |||
| Comcast Corp. Class A | 2,076,700 | 97,231,094 | |
| Interpublic Group of Companies, Inc. | 535,600 | 18,987,020 | |
| 116,218,114 | |||
TOTAL COMMUNICATION SERVICES | 357,499,539 | ||
| CONSUMER DISCRETIONARY - 4.3% | |||
| Auto Components - 0.5% | |||
| BorgWarner, Inc. | 454,460 | 17,678,494 | |
| Automobiles - 0.1% | |||
| General Motors Co. (b) | 82,600 | 3,612,924 | |
| Hotels, Restaurants & Leisure - 1.6% | |||
| Booking Holdings, Inc. (b) | 14,800 | 34,757,060 | |
| Expedia, Inc. (b) | 64,300 | 12,581,581 | |
| Marriott International, Inc. Class A (b) | 71,700 | 12,601,275 | |
| Starbucks Corp. | 48,500 | 4,412,045 | |
| 64,351,961 | |||
| Household Durables - 0.7% | |||
| Mohawk Industries, Inc. (b) | 91,400 | 11,351,880 | |
| Sony Group Corp. sponsored ADR | 55,100 | 5,659,321 | |
| Whirlpool Corp. | 65,800 | 11,368,924 | |
| 28,380,125 | |||
| Internet & Direct Marketing Retail - 0.3% | |||
| Amazon.com, Inc. (b) | 3,300 | 10,757,835 | |
| Chewy, Inc. (b)(c) | 58,900 | 2,401,942 | |
| 13,159,777 | |||
| Specialty Retail - 1.1% | |||
| Lowe's Companies, Inc. | 223,800 | 45,250,122 | |
TOTAL CONSUMER DISCRETIONARY | 172,433,403 | ||
| CONSUMER STAPLES - 5.8% | |||
| Beverages - 1.7% | |||
| Diageo PLC sponsored ADR | 96,500 | 19,603,010 | |
| Keurig Dr. Pepper, Inc. | 340,200 | 12,893,580 | |
| The Coca-Cola Co. | 567,600 | 35,191,200 | |
| 67,687,790 | |||
| Food & Staples Retailing - 1.4% | |||
| Costco Wholesale Corp. | 7,100 | 4,088,535 | |
| Performance Food Group Co. (b) | 131,900 | 6,715,029 | |
| Sysco Corp. | 338,800 | 27,663,020 | |
| U.S. Foods Holding Corp. (b) | 174,700 | 6,573,961 | |
| Walmart, Inc. | 54,200 | 8,071,464 | |
| 53,112,009 | |||
| Food Products - 0.1% | |||
| Lamb Weston Holdings, Inc. | 73,100 | 4,379,421 | |
| Household Products - 0.2% | |||
| Colgate-Palmolive Co. | 4,500 | 341,235 | |
| Spectrum Brands Holdings, Inc. | 93,000 | 8,250,960 | |
| 8,592,195 | |||
| Tobacco - 2.4% | |||
| Altria Group, Inc. | 1,663,900 | 86,938,775 | |
| Swedish Match Co. AB | 1,298,500 | 9,788,743 | |
| 96,727,518 | |||
TOTAL CONSUMER STAPLES | 230,498,933 | ||
| ENERGY - 11.2% | |||
| Oil, Gas & Consumable Fuels - 11.2% | |||
| Canadian Natural Resources Ltd. | 120,400 | 7,455,237 | |
| Cenovus Energy, Inc. (Canada) | 2,970,258 | 49,514,200 | |
| EQT Corp. | 90,200 | 3,103,782 | |
| Exxon Mobil Corp. | 2,785,500 | 230,054,445 | |
| Harbour Energy PLC | 1,319,900 | 8,433,625 | |
| Hess Corp. | 731,020 | 78,248,381 | |
| Imperial Oil Ltd. | 152,900 | 7,399,472 | |
| Kosmos Energy Ltd. (b) | 3,551,290 | 25,533,775 | |
| MEG Energy Corp. (b) | 319,200 | 4,358,472 | |
| Phillips 66 Co. | 106,300 | 9,183,257 | |
| Tourmaline Oil Corp. | 465,700 | 21,456,881 | |
| 444,741,527 | |||
| FINANCIALS - 16.8% | |||
| Banks - 12.0% | |||
| Bank of America Corp. | 3,044,115 | 125,478,420 | |
| JPMorgan Chase & Co. | 296,000 | 40,350,720 | |
| M&T Bank Corp. | 47,300 | 8,017,350 | |
| PNC Financial Services Group, Inc. | 254,416 | 46,927,031 | |
| Truist Financial Corp. | 589,726 | 33,437,464 | |
| U.S. Bancorp | 499,142 | 26,529,397 | |
| Wells Fargo & Co. | 4,068,950 | 197,181,317 | |
| 477,921,699 | |||
| Capital Markets - 3.2% | |||
| KKR & Co. LP | 345,585 | 20,206,355 | |
| Morgan Stanley | 239,600 | 20,941,040 | |
| Northern Trust Corp. | 377,095 | 43,912,713 | |
| Raymond James Financial, Inc. | 107,550 | 11,820,821 | |
| State Street Corp. | 324,690 | 28,286,993 | |
| 125,167,922 | |||
| Consumer Finance - 0.4% | |||
| Discover Financial Services | 143,500 | 15,812,265 | |
| Insurance - 0.2% | |||
| Chubb Ltd. | 44,800 | 9,582,720 | |
| Thrifts & Mortgage Finance - 1.0% | |||
| MGIC Investment Corp. | 583,761 | 7,909,962 | |
| Radian Group, Inc. | 1,371,952 | 30,471,054 | |
| 38,381,016 | |||
TOTAL FINANCIALS | 666,865,622 | ||
| HEALTH CARE - 14.0% | |||
| Biotechnology - 0.6% | |||
| ADC Therapeutics SA (b) | 64,688 | 950,267 | |
| Alnylam Pharmaceuticals, Inc. (b) | 43,800 | 7,152,102 | |
| Argenx SE ADR (b) | 4,200 | 1,324,302 | |
| Crinetics Pharmaceuticals, Inc. (b) | 113,300 | 2,486,935 | |
| Insmed, Inc. (b) | 157,479 | 3,700,757 | |
| Intercept Pharmaceuticals, Inc. (b)(c) | 248,105 | 4,036,668 | |
| Vaxcyte, Inc. (b) | 46,100 | 1,113,315 | |
| Verve Therapeutics, Inc. | 39,200 | 894,544 | |
| 21,658,890 | |||
| Health Care Equipment & Supplies - 1.6% | |||
| Abbott Laboratories | 20,500 | 2,426,380 | |
| Becton, Dickinson & Co. | 40,600 | 10,799,600 | |
| Boston Scientific Corp. (b) | 1,045,951 | 46,325,170 | |
| iRhythm Technologies, Inc. (b) | 412 | 64,878 | |
| Koninklijke Philips Electronics NV (depositary receipt) (NY Reg.) | 140,900 | 4,301,677 | |
| 63,917,705 | |||
| Health Care Providers & Services - 5.9% | |||
| Cardinal Health, Inc. | 345,500 | 19,589,850 | |
| Centene Corp. (b) | 47,500 | 3,999,025 | |
| Cigna Corp. | 193,800 | 46,436,418 | |
| Covetrus, Inc. (b) | 132,320 | 2,221,653 | |
| CVS Health Corp. | 424,200 | 42,933,282 | |
| Guardant Health, Inc. (b) | 63,400 | 4,199,616 | |
| Humana, Inc. | 13,200 | 5,744,244 | |
| McKesson Corp. | 155,280 | 47,535,866 | |
| Oak Street Health, Inc. (b) | 54,300 | 1,459,584 | |
| UnitedHealth Group, Inc. | 117,800 | 60,074,466 | |
| 234,194,004 | |||
| Life Sciences Tools & Services - 0.2% | |||
| Danaher Corp. | 26,400 | 7,743,912 | |
| Pharmaceuticals - 5.7% | |||
| Bayer AG | 554,878 | 37,953,154 | |
| Bristol-Myers Squibb Co. | 1,086,100 | 79,317,883 | |
| Eli Lilly & Co. | 44,600 | 12,772,102 | |
| GlaxoSmithKline PLC sponsored ADR | 992,800 | 43,246,368 | |
| Johnson & Johnson | 261,560 | 46,356,279 | |
| Pliant Therapeutics, Inc. (b) | 58,000 | 406,580 | |
| Sanofi SA sponsored ADR | 140,400 | 7,208,136 | |
| Viatris, Inc. | 50,600 | 550,528 | |
| 227,811,030 | |||
TOTAL HEALTH CARE | 555,325,541 | ||
| INDUSTRIALS - 14.2% | |||
| Aerospace & Defense - 2.8% | |||
| Airbus Group NV | 165,400 | 19,958,569 | |
| General Dynamics Corp. | 49,300 | 11,890,174 | |
| Huntington Ingalls Industries, Inc. | 33,400 | 6,661,296 | |
| MTU Aero Engines AG | 15,500 | 3,612,847 | |
| Raytheon Technologies Corp. | 62,000 | 6,142,340 | |
| Safran SA | 26,400 | 3,108,218 | |
| The Boeing Co. (b) | 306,400 | 58,675,600 | |
| 110,049,044 | |||
| Air Freight & Logistics - 2.1% | |||
| FedEx Corp. | 79,400 | 18,372,366 | |
| United Parcel Service, Inc. Class B | 312,100 | 66,932,966 | |
| 85,305,332 | |||
| Airlines - 0.1% | |||
| Copa Holdings SA Class A (b) | 13,500 | 1,129,140 | |
| Ryanair Holdings PLC sponsored ADR (b) | 34,400 | 2,996,928 | |
| 4,126,068 | |||
| Building Products - 0.2% | |||
| Johnson Controls International PLC | 98,900 | 6,484,873 | |
| Commercial Services & Supplies - 0.2% | |||
| ACV Auctions, Inc. Class A (b) | 444,300 | 6,580,083 | |
| Electrical Equipment - 0.9% | |||
| Acuity Brands, Inc. | 68,200 | 12,910,260 | |
| Hubbell, Inc. Class B | 43,218 | 7,942,172 | |
| Regal Rexnord Corp. | 5,600 | 833,168 | |
| Vertiv Holdings Co. | 1,126,600 | 15,772,400 | |
| 37,458,000 | |||
| Industrial Conglomerates - 6.3% | |||
| 3M Co. | 48,300 | 7,190,904 | |
| General Electric Co. | 2,660,687 | 243,452,861 | |
| 250,643,765 | |||
| Machinery - 1.0% | |||
| Cummins, Inc. | 22,800 | 4,676,508 | |
| Epiroc AB (A Shares) | 17,200 | 367,888 | |
| Flowserve Corp. | 208,700 | 7,492,330 | |
| Fortive Corp. | 112,100 | 6,830,253 | |
| Otis Worldwide Corp. | 71,750 | 5,521,163 | |
| PACCAR, Inc. | 25,600 | 2,254,592 | |
| Stanley Black & Decker, Inc. | 33,700 | 4,710,923 | |
| Westinghouse Air Brake Tech Co. | 81,602 | 7,847,664 | |
| 39,701,321 | |||
| Professional Services - 0.1% | |||
| Equifax, Inc. | 14,100 | 3,343,110 | |
| Road & Rail - 0.5% | |||
| Knight-Swift Transportation Holdings, Inc. Class A | 377,800 | 19,063,788 | |
| Trading Companies & Distributors - 0.0% | |||
| Beijer Ref AB (B Shares) | 61,800 | 1,126,576 | |
TOTAL INDUSTRIALS | 563,881,960 | ||
| INFORMATION TECHNOLOGY - 19.6% | |||
| Electronic Equipment & Components - 0.2% | |||
| Mirion Technologies, Inc. (d) | 981,748 | 7,922,706 | |
| IT Services - 4.3% | |||
| Amadeus IT Holding SA Class A (b) | 113,600 | 7,386,057 | |
| Edenred SA | 249,700 | 12,408,280 | |
| Fidelity National Information Services, Inc. | 162,100 | 16,278,082 | |
| Genpact Ltd. | 158,400 | 6,891,984 | |
| Global Payments, Inc. | 21,500 | 2,942,060 | |
| IBM Corp. | 40,500 | 5,265,810 | |
| MasterCard, Inc. Class A | 32,200 | 11,507,636 | |
| PayPal Holdings, Inc. (b) | 94,400 | 10,917,360 | |
| Sabre Corp. (b) | 761,100 | 8,699,373 | |
| Snowflake, Inc. (b) | 3,300 | 756,129 | |
| Twilio, Inc. Class A (b) | 70,000 | 11,536,700 | |
| Unisys Corp. (b) | 515,247 | 11,134,488 | |
| Visa, Inc. Class A | 295,000 | 65,422,150 | |
| 171,146,109 | |||
| Semiconductors & Semiconductor Equipment - 2.9% | |||
| Analog Devices, Inc. | 41,900 | 6,921,042 | |
| Applied Materials, Inc. | 88,000 | 11,598,400 | |
| Intel Corp. | 356,000 | 17,643,360 | |
| Lam Research Corp. | 13,000 | 6,988,930 | |
| Marvell Technology, Inc. | 158,400 | 11,358,864 | |
| Qualcomm, Inc. | 392,890 | 60,041,450 | |
| 114,552,046 | |||
| Software - 8.6% | |||
| Adobe, Inc. (b) | 14,900 | 6,788,738 | |
| Autodesk, Inc. (b) | 36,800 | 7,888,080 | |
| Coupa Software, Inc. (b) | 4,400 | 447,172 | |
| DocuSign, Inc. (b) | 31,700 | 3,395,704 | |
| DoubleVerify Holdings, Inc. (b) | 64,200 | 1,615,914 | |
| Dynatrace, Inc. (b) | 132,400 | 6,236,040 | |
| Elastic NV (b) | 110,300 | 9,811,185 | |
| Microsoft Corp. | 857,200 | 264,283,328 | |
| PTC, Inc. (b) | 41,100 | 4,427,292 | |
| Salesforce.com, Inc. (b) | 13,300 | 2,823,856 | |
| SAP SE sponsored ADR | 258,800 | 28,716,448 | |
| Workday, Inc. Class A (b) | 12,900 | 3,089,034 | |
| 339,522,791 | |||
| Technology Hardware, Storage & Peripherals - 3.6% | |||
| Apple, Inc. | 796,200 | 139,024,482 | |
| Samsung Electronics Co. Ltd. | 84,220 | 4,808,786 | |
| 143,833,268 | |||
TOTAL INFORMATION TECHNOLOGY | 776,976,920 | ||
| MATERIALS - 3.2% | |||
| Chemicals - 0.7% | |||
| Axalta Coating Systems Ltd. (b) | 143,100 | 3,517,398 | |
| DuPont de Nemours, Inc. | 348,200 | 25,620,556 | |
| 29,137,954 | |||
| Metals & Mining - 2.5% | |||
| First Quantum Minerals Ltd. | 722,500 | 25,012,838 | |
| Freeport-McMoRan, Inc. | 1,201,079 | 59,741,669 | |
| Glencore Xstrata PLC | 2,293,800 | 14,925,090 | |
| 99,679,597 | |||
TOTAL MATERIALS | 128,817,551 | ||
| REAL ESTATE - 0.8% | |||
| Equity Real Estate Investment Trusts (REITs) - 0.8% | |||
| American Tower Corp. | 39,800 | 9,998,556 | |
| Equinix, Inc. | 1,400 | 1,038,268 | |
| Simon Property Group, Inc. | 159,400 | 20,970,664 | |
| 32,007,488 | |||
| UTILITIES - 0.4% | |||
| Electric Utilities - 0.3% | |||
| Entergy Corp. | 32,200 | 3,759,350 | |
| Southern Co. | 124,100 | 8,998,491 | |
| 12,757,841 | |||
| Multi-Utilities - 0.1% | |||
| Sempra Energy | 9,300 | 1,563,516 | |
TOTAL UTILITIES | 14,321,357 | ||
| TOTAL COMMON STOCKS (Cost $2,449,413,303) | 3,943,369,841 | ||
| Preferred Stocks - 0.1% | |||
| Shares | Value ($) | ||
| Convertible Preferred Stocks - 0.0% | |||
| COMMUNICATION SERVICES - 0.0% | |||
| Interactive Media & Services - 0.0% | |||
| Reddit, Inc. Series E (d)(e) | 5,200 | 321,331 | |
| Nonconvertible Preferred Stocks - 0.1% | |||
| INDUSTRIALS - 0.1% | |||
| Aerospace & Defense - 0.1% | |||
| Embraer SA sponsored ADR (b) | 451,800 | 5,697,198 | |
| TOTAL PREFERRED STOCKS (Cost $5,449,043) | 6,018,529 | ||
| Other - 0.0% | |||
| Shares | Value ($) | ||
| Energy - Oil, Gas & Consumable Fuels - 0.0% | |||
Utica Shale Drilling Program (non-operating revenue interest) (d)(e)(f) (Cost $7,810,134) | 7,810,134 | 1,958,001 | |
| Money Market Funds - 0.5% | |||
| Shares | Value ($) | ||
| Fidelity Cash Central Fund 0.31% (g) | 12,211,328 | 12,213,771 | |
| Fidelity Securities Lending Cash Central Fund 0.31% (g)(h) | 6,250,556 | 6,251,181 | |
| TOTAL MONEY MARKET FUNDS (Cost $18,464,952) | 18,464,952 | ||
| TOTAL INVESTMENT IN SECURITIES - 99.9% (Cost $2,481,137,432) | 3,969,811,323 |
NET OTHER ASSETS (LIABILITIES) - 0.1% | 2,115,253 |
| NET ASSETS - 100.0% | 3,971,926,576 |
| (a) | Security exempt from registration under Rule 144A of the Securities Act of 1933. These securities may be resold in transactions exempt from registration, normally to qualified institutional buyers. At the end of the period, the value of these securities amounted to $4,398,571 or 0.1% of net assets. |
| (b) | Non-income producing |
| (c) | Security or a portion of the security is on loan at period end. |
| (d) | Restricted securities (including private placements) - Investment in securities not registered under the Securities Act of 1933 (excluding 144A issues). At the end of the period, the value of restricted securities (excluding 144A issues) amounted to $10,202,038 or 0.3% of net assets. |
| (e) | Level 3 security |
| (f) | Investment is owned by a wholly-owned subsidiary (Subsidiary) that is treated as a corporation for U.S. tax purposes. |
| (g) | Affiliated fund that is generally available only to investment companies and other accounts managed by Fidelity Investments. The rate quoted is the annualized seven-day yield of the fund at period end. A complete unaudited listing of the fund's holdings as of its most recent quarter end is available upon request. In addition, each Fidelity Central Fund's financial statements are available on the SEC's website or upon request. |
| (h) | Investment made with cash collateral received from securities on loan. |
| Additional information on each restricted holding is as follows: | ||
| Security | Acquisition Date | Acquisition Cost ($) |
| Mirion Technologies, Inc. | 6/16/21 | 9,817,480 |
| Reddit, Inc. Series E | 5/18/21 | 220,866 |
| Utica Shale Drilling Program (non-operating revenue interest) | 10/05/16 - 9/01/17 | 7,810,134 |
| Affiliate | Value, beginning of period ($) | Purchases ($) | Sales Proceeds ($) | Dividend Income ($) | Realized Gain (loss) ($) | Change in Unrealized appreciation (depreciation) ($) | Value, end of period ($) | %ownership, end of period |
| Fidelity Cash Central Fund 0.31% | 8,778,631 | 85,639,378 | 82,204,238 | 2,865 | - | - | 12,213,771 | 0.0% |
| Fidelity Securities Lending Cash Central Fund 0.31% | 45,803,444 | 158,251,655 | 197,803,918 | 21,120 | - | - | 6,251,181 | 0.0% |
| Total | 54,582,075 | 243,891,033 | 280,008,156 | 23,985 | - | - | 18,464,952 |
| Valuation Inputs at Reporting Date: | ||||
| Description | Total ($) | Level 1 ($) | Level 2 ($) | Level 3 ($) |
Investments in Securities: | ||||
| Equities: | ||||
Communication Services | 357,820,870 | 353,100,968 | 4,398,571 | 321,331 |
Consumer Discretionary | 172,433,403 | 172,433,403 | - | - |
Consumer Staples | 230,498,933 | 230,498,933 | - | - |
Energy | 444,741,527 | 444,741,527 | - | - |
Financials | 666,865,622 | 666,865,622 | - | - |
Health Care | 555,325,541 | 517,372,387 | 37,953,154 | - |
Industrials | 569,579,158 | 546,144,483 | 23,434,675 | - |
Information Technology | 776,976,920 | 764,782,077 | 12,194,843 | - |
Materials | 128,817,551 | 113,892,461 | 14,925,090 | - |
Real Estate | 32,007,488 | 32,007,488 | - | - |
Utilities | 14,321,357 | 14,321,357 | - | - |
| Other | 1,958,001 | - | - | 1,958,001 |
| Money Market Funds | 18,464,952 | 18,464,952 | - | - |
| Total Investments in Securities: | 3,969,811,323 | 3,874,625,658 | 92,906,333 | 2,279,332 |
| Statement of Assets and Liabilities | ||||
March 31, 2022 (Unaudited) | ||||
| Assets | ||||
| Investment in securities, at value (including securities loaned of $5,998,105) - See accompanying schedule: | $3,951,346,371 | |||
Unaffiliated issuers (cost $2,462,672,480) | ||||
Fidelity Central Funds (cost $18,464,952) | 18,464,952 | |||
| Total Investments in Securities (cost $2,481,137,432) | $ | 3,969,811,323 | ||
| Restricted cash | 209,009 | |||
| Foreign currency held at value (cost $135,260) | 135,260 | |||
| Receivable for investments sold | 3,823,946 | |||
| Receivable for fund shares sold | 767,276 | |||
| Dividends receivable | 5,821,448 | |||
| Distributions receivable from Fidelity Central Funds | 3,352 | |||
| Prepaid expenses | 2,120 | |||
| Other receivables | 354,996 | |||
Total assets | 3,980,928,730 | |||
| Liabilities | ||||
| Payable for fund shares redeemed | $724,581 | |||
| Accrued management fee | 1,709,275 | |||
| Distribution and service plan fees payable | 123,183 | |||
| Other affiliated payables | 112,158 | |||
| Other payables and accrued expenses | 72,907 | |||
| Collateral on securities loaned | 6,260,050 | |||
| Total Liabilities | 9,002,154 | |||
| Net Assets | $ | 3,971,926,576 | ||
| Net Assets consist of: | ||||
| Paid in capital | $ | 2,365,834,140 | ||
| Total accumulated earnings (loss) | 1,606,092,436 | |||
| Net Assets | $ | 3,971,926,576 | ||
| Net Asset Value and Maximum Offering Price | ||||
| Class O : | ||||
Net Asset Value , offering price and redemption price per share ($3,342,012,718 ÷ 168,349,611 shares) | $ | 19.85 | ||
| Class A : | ||||
Net Asset Value and redemption price per share ($581,919,689 ÷ 30,712,253 shares) (a) | $ | 18.95 | ||
| Maximum offering price per share (100/94.25 of $18.95) | $ | 20.11 | ||
| Class M : | ||||
Net Asset Value and redemption price per share ($3,873,061 ÷ 211,783 shares) (a) | $ | 18.29 | ||
| Maximum offering price per share (100/96.50 of $18.29) | $ | 18.95 | ||
| Class C : | ||||
Net Asset Value and offering price per share ($3,270,098 ÷ 187,806 shares) (a) | $ | 17.41 | ||
| Class I : | ||||
Net Asset Value , offering price and redemption price per share ($40,851,010 ÷ 2,048,757 shares) | $ | 19.94 | ||
(a)Redemption price per share is equal to net asset value less any applicable contingent deferred sales charge. | ||||
| Statement of Operations | ||||
Six months ended March 31, 2022 (Unaudited) | ||||
| Investment Income | ||||
| Dividends | $ | 34,823,696 | ||
| Income from Fidelity Central Funds (including $21,120 from security lending) | 23,985 | |||
| Total Income | 34,847,681 | |||
| Expenses | ||||
| Management fee | $ | 10,792,118 | ||
| Transfer agent fees | 2,621,001 | |||
| Distribution and service plan fees | 750,579 | |||
| Accounting fees | 522,422 | |||
| Custodian fees and expenses | 46,471 | |||
| Independent trustees' fees and expenses | 7,338 | |||
| Registration fees | 46,446 | |||
| Audit | 37,246 | |||
| Legal | 6,746 | |||
| Interest | 4,851 | |||
| Miscellaneous | 9,504 | |||
| Total expenses before reductions | 14,844,722 | |||
| Expense reductions | (2,515,737) | |||
| Total expenses after reductions | 12,328,985 | |||
| Net Investment income (loss) | 22,518,696 | |||
| Realized and Unrealized Gain (Loss) | ||||
| Net realized gain (loss) on: | ||||
| Investment Securities: | ||||
| Unaffiliated issuers | 159,686,294 | |||
| Foreign currency transactions | 49,131 | |||
| Total net realized gain (loss) | 159,735,425 | |||
| Change in net unrealized appreciation (depreciation) on: | ||||
| Investment Securities: | ||||
| Unaffiliated issuers | 88,158,566 | |||
| Unfunded commitments | 787,362 | |||
| Assets and liabilities in foreign currencies | (76,309) | |||
| Total change in net unrealized appreciation (depreciation) | 88,869,619 | |||
| Net gain (loss) | 248,605,044 | |||
| Net increase (decrease) in net assets resulting from operations | $ | 271,123,740 | ||
| Statement of Changes in Net Assets | ||||
Six months ended March 31, 2022 (Unaudited) | Year ended September 30, 2021 | |||
| Increase (Decrease) in Net Assets | ||||
| Operations | ||||
| Net investment income (loss) | $ | 22,518,696 | $ | 78,773,929 |
| Net realized gain (loss) | 159,735,425 | 123,046,581 | ||
| Change in net unrealized appreciation (depreciation) | 88,869,619 | 1,022,946,154 | ||
| Net increase (decrease) in net assets resulting from operations | 271,123,740 | 1,224,766,664 | ||
| Distributions to shareholders | (224,711,132) | (155,641,747) | ||
| Share transactions - net increase (decrease) | (240,174,588) | (9,040,569) | ||
| Total increase (decrease) in net assets | (193,761,980) | 1,060,084,348 | ||
| Net Assets | ||||
| Beginning of period | 4,165,688,556 | 3,105,604,208 | ||
| End of period | $ | 3,971,926,576 | $ | 4,165,688,556 |
| Fidelity Advisor® Capital Development Fund Class O |
Six months ended (Unaudited) March 31, 2022 | Years ended September 30, 2021 | 2020 | 2019 | 2018 | 2017 | |||||||
Selected Per-Share Data | ||||||||||||
| Net asset value, beginning of period | $ | 19.65 | $ | 14.71 | $ | 15.41 | $ | 17.96 | $ | 16.69 | $ | 14.42 |
| Income from Investment Operations | ||||||||||||
Net investment income (loss) A,B | .11 | .37 C | .29 | .31 | .26 | .24 | ||||||
| Net realized and unrealized gain (loss) | 1.21 | 5.32 | .21 | (.79) D | 2.13 | 2.47 | ||||||
| Total from investment operations | 1.32 | 5.69 | .50 | (.48) | 2.39 | 2.71 | ||||||
| Distributions from net investment income | (.38) | (.28) | (.31) | (.28) | (.24) | (.21) | ||||||
| Distributions from net realized gain | (.73) | (.47) | (.88) | (1.80) | (.88) | (.22) | ||||||
| Total distributions | (1.12) E | (.75) | (1.20) E | (2.07) E | (1.12) | (.44) E | ||||||
| Net asset value, end of period | $ | 19.85 | $ | 19.65 | $ | 14.71 | $ | 15.41 | $ | 17.96 | $ | 16.69 |
Total Return F,G | 6.89% | 39.61% | 2.62% | (1.43)% H,D | 15.04% H | 19.08% H | ||||||
Ratios to Average Net Assets I,J,B | ||||||||||||
| Expenses before reductions | .68% K | .70% | .72% | .70% | .58% | .59% | ||||||
| Expenses net of fee waivers, if any | .55% K | .56% | .57% | .58% | .58% | .59% | ||||||
| Expenses net of all reductions | .55% K | .56% | .57% | .57% | .58% | .59% | ||||||
| Net investment income (loss) | 1.14% K | 2.03% C | 1.95% | 2.07% | 1.52% | 1.55% | ||||||
| Supplemental Data | ||||||||||||
| Net assets, end of period (000 omitted) | $ | 3,342,013 | $ | 3,567,329 | $ | 2,663,852 | $ | 2,611,342 | $ | 2,896,451 | $ | 2,705,474 |
Portfolio turnover rate L | 16% K | 16% | 26% | 38% | 36% | 31% |
| Fidelity Advisor® Capital Development Fund Class A |
Six months ended (Unaudited) March 31, 2022 | Years ended September 30, 2021 | 2020 | 2019 | 2018 | 2017 | |||||||
Selected Per-Share Data | ||||||||||||
| Net asset value, beginning of period | $ | 18.78 | $ | 14.09 | $ | 14.80 | $ | 17.34 | $ | 16.15 | $ | 13.97 |
| Income from Investment Operations | ||||||||||||
Net investment income (loss) A,B | .08 | .31 C | .24 | .26 | .20 | .19 | ||||||
| Net realized and unrealized gain (loss) | 1.15 | 5.09 | .20 | (.77) D | 2.07 | 2.39 | ||||||
| Total from investment operations | 1.23 | 5.40 | .44 | (.51) | 2.27 | 2.58 | ||||||
| Distributions from net investment income | (.33) | (.24) | (.27) | (.23) | (.19) | (.17) | ||||||
| Distributions from net realized gain | (.73) | (.47) | (.88) | (1.80) | (.88) | (.22) | ||||||
| Total distributions | (1.06) | (.71) | (1.15) | (2.03) | (1.08) E | (.40) E | ||||||
| Net asset value, end of period | $ | 18.95 | $ | 18.78 | $ | 14.09 | $ | 14.80 | $ | 17.34 | $ | 16.15 |
Total Return F,G,H | 6.74% | 39.21% | 2.37% | (1.76)% I,D | 14.71% I | 18.72% I | ||||||
Ratios to Average Net Assets J,K,A | ||||||||||||
| Expenses before reductions | .95% L | .97% | 1.00% | 1.00% | .87% | .88% | ||||||
| Expenses net of fee waivers, if any | .85% L | .85% | .86% | .87% | .87% | .88% | ||||||
| Expenses net of all reductions | .85% L | .85% | .86% | .86% | .87% | .88% | ||||||
| Net investment income (loss) | .85% L | 1.74% C | 1.66% | 1.78% | 1.23% | 1.26% | ||||||
| Supplemental Data | ||||||||||||
| Net assets, end of period (000 omitted) | $ | 581,920 | $ | 552,638 | $ | 425,890 | $ | 433,610 | $ | 460,953 | $ | 426,665 |
Portfolio turnover rate M | 16% L | 16% | 26% | 38% | 36% | 31% |
| Fidelity Advisor® Capital Development Fund Class M |
Six months ended (Unaudited) March 31, 2022 | Years ended September 30, 2021 | 2020 | 2019 | 2018 | 2017 | |||||||
Selected Per-Share Data | ||||||||||||
| Net asset value, beginning of period | $ | 18.12 | $ | 13.61 | $ | 14.34 | $ | 16.85 | $ | 15.71 | $ | 13.62 |
| Income from Investment Operations | ||||||||||||
Net investment income (loss) A,B | .04 | .21 C | .16 | .18 | .11 | .10 | ||||||
| Net realized and unrealized gain (loss) | 1.11 | 4.93 | .18 | (.75) D | 2.02 | 2.32 | ||||||
| Total from investment operations | 1.15 | 5.14 | .34 | (.57) | 2.13 | 2.42 | ||||||
| Distributions from net investment income | (.24) | (.17) | (.19) | (.14) | (.11) | (.11) | ||||||
| Distributions from net realized gain | (.73) | (.47) | (.88) | (1.80) | (.88) | (.22) | ||||||
| Total distributions | (.98) E | (.63) E | (1.07) | (1.94) | (.99) | (.33) | ||||||
| Net asset value, end of period | $ | 18.29 | $ | 18.12 | $ | 13.61 | $ | 14.34 | $ | 16.85 | $ | 15.71 |
Total Return F,G,H | 6.48% | 38.61% | 1.76% | (2.27)% D | 14.18% | 18.02% | ||||||
Ratios to Average Net Assets I,J,B | ||||||||||||
| Expenses before reductions | 1.32% K | 1.33% | 1.37% | 1.40% | 1.41% | 1.42% | ||||||
| Expenses net of fee waivers, if any | 1.31% K | 1.33% | 1.37% | 1.40% | 1.41% | 1.42% | ||||||
| Expenses net of all reductions | 1.31% K | 1.33% | 1.36% | 1.40% | 1.41% | 1.42% | ||||||
| Net investment income (loss) | .38% K | 1.25% C | 1.16% | 1.24% | .69% | .71% | ||||||
| Supplemental Data | ||||||||||||
| Net assets, end of period (000 omitted) | $ | 3,873 | $ | 3,476 | $ | 2,468 | $ | 3,294 | $ | 3,469 | $ | 3,421 |
Portfolio turnover rate L | 16% K | 16% | 26% | 38% | 36% | 31% |
| Fidelity Advisor® Capital Development Fund Class C |
Six months ended (Unaudited) March 31, 2022 | Years ended September 30, 2021 | 2020 | 2019 | 2018 | 2017 | |||||||
Selected Per-Share Data | ||||||||||||
| Net asset value, beginning of period | $ | 17.28 | $ | 12.99 | $ | 13.73 | $ | 16.23 | $ | 15.17 | $ | 13.18 |
| Income from Investment Operations | ||||||||||||
Net investment income (loss) A,B | - C | .13 D | .09 | .11 | .04 | .04 | ||||||
| Net realized and unrealized gain (loss) | 1.05 | 4.70 | .19 | (.73) E | 1.94 | 2.25 | ||||||
| Total from investment operations | 1.05 | 4.83 | .28 | (.62) | 1.98 | 2.29 | ||||||
| Distributions from net investment income | (.19) | (.07) | (.14) | (.09) | (.04) | (.08) | ||||||
| Distributions from net realized gain | (.73) | (.47) | (.88) | (1.80) | (.88) | (.22) | ||||||
| Total distributions | (.92) | (.54) | (1.02) | (1.88) F | (.92) | (.30) | ||||||
| Net asset value, end of period | $ | 17.41 | $ | 17.28 | $ | 12.99 | $ | 13.73 | $ | 16.23 | $ | 15.17 |
Total Return G,H,I | 6.25% | 37.89% | 1.39% | (2.72)% E | 13.62% | 17.57% | ||||||
Ratios to Average Net Assets J,K,B | ||||||||||||
| Expenses before reductions | 1.75% L | 1.80% | 1.83% | 1.83% | 1.84% | 1.85% | ||||||
| Expenses net of fee waivers, if any | 1.75% L | 1.80% | 1.83% | 1.83% | 1.84% | 1.85% | ||||||
| Expenses net of all reductions | 1.75% L | 1.80% | 1.82% | 1.82% | 1.83% | 1.85% | ||||||
| Net investment income (loss) | (.06)% L | .79% D | .70% | .82% | .26% | .28% | ||||||
| Supplemental Data | ||||||||||||
| Net assets, end of period (000 omitted) | $ | 3,270 | $ | 2,607 | $ | 1,956 | $ | 3,247 | $ | 3,082 | $ | 3,016 |
Portfolio turnover rate M | 16% L | 16% | 26% | 38% | 36% | 31% |
| Fidelity Advisor® Capital Development Fund Class I |
Six months ended (Unaudited) March 31, 2022 | Years ended September 30, 2021 | 2020 | 2019 | 2018 | 2017 | |||||||
Selected Per-Share Data | ||||||||||||
| Net asset value, beginning of period | $ | 19.73 | $ | 14.77 | $ | 15.46 | $ | 18.03 | $ | 16.74 | $ | 14.48 |
| Income from Investment Operations | ||||||||||||
Net investment income (loss) A,B | .10 | .35 C | .27 | .29 | .23 | .22 | ||||||
| Net realized and unrealized gain (loss) | 1.20 | 5.34 | .22 | (.81) D | 2.16 | 2.46 | ||||||
| Total from investment operations | 1.30 | 5.69 | .49 | (.52) | 2.39 | 2.68 | ||||||
| Distributions from net investment income | (.36) | (.26) | (.29) | (.26) | (.22) | (.20) | ||||||
| Distributions from net realized gain | (.73) | (.47) | (.88) | (1.80) | (.88) | (.22) | ||||||
| Total distributions | (1.09) | (.73) | (1.18) E | (2.05) E | (1.10) | (.42) | ||||||
| Net asset value, end of period | $ | 19.94 | $ | 19.73 | $ | 14.77 | $ | 15.46 | $ | 18.03 | $ | 16.74 |
Total Return F,G | 6.79% | 39.40% | 2.54% | (1.68)% D | 14.97% | 18.82% | ||||||
Ratios to Average Net Assets H,I,B | ||||||||||||
| Expenses before reductions | .72% J | .71% | .72% | .73% | .72% | .74% | ||||||
| Expenses net of fee waivers, if any | .71% J | .71% | .72% | .73% | .72% | .74% | ||||||
| Expenses net of all reductions | .71% J | .71% | .71% | .73% | .72% | .74% | ||||||
| Net investment income (loss) | .98% J | 1.87% C | 1.81% | 1.91% | 1.38% | 1.39% | ||||||
| Supplemental Data | ||||||||||||
| Net assets, end of period (000 omitted) | $ | 40,851 | $ | 39,639 | $ | 11,438 | $ | 12,138 | $ | 5,315 | $ | 3,381 |
Portfolio turnover rate K | 16% J | 16% | 26% | 38% | 36% | 31% |
| Fidelity Central Fund | Investment Manager | Investment Objective | Investment Practices | Expense Ratio (a) |
| Fidelity Money Market Central Funds | Fidelity Management & Research Company LLC (FMR) | Each fund seeks to obtain a high level of current income consistent with the preservation of capital and liquidity. | Short-term Investments | Less than.005% |
| (a) Expenses expressed as a percentage of average net assets and are as of each underlying Central Fund's most recent annual or semi-annual shareholder report. | ||||
| Amount ($) | |
| Fidelity Advisor® Capital Development Fund | 19,604 |
| Amount ($) | ||
| Gross unrealized appreciation | 1,574,755,434 | |
| Gross unrealized depreciation | (102,569,993) | |
| Net unrealized appreciation (depreciation) | 1,472,185,441 | |
| Tax Cost | 2,497,625,882 |
| Amount ($) | % of Net Assets | |
| Fidelity Advisor® Capital Development Fund | 2,167,010 | .05 |
| Purchases ($) | Sales ($) | |
| Fidelity Advisor® Capital Development Fund | 324,606,944 | 779,700,312 |
| Distribution Fee (%) | Service Fee (%) | Total Fees ($) | Retained by FDC ($) | ||||
| Class A | - | .25 | 726,476 | 4,523 | |||
| Class M | .25 | .25 | 9,106 | 36 | |||
| Class C | .75 | .25 | 14,997 | 4,506 | |||
| 750,579 | 9,065 | ||||||
| Retained by FDC ($) | |||
| Class A | 13,720 | ||
| Class M | 517 | ||
Class C (a) | 16 | ||
| 14,253 | |||
Amount ($) | % of Class-Level Average Net Assets (a) | ||
| Class O | 2,158,231 | .12 | |
| Class A | 423,505 | .15 | |
| Class M | 4,742 | .26 | |
| Class C | 2,902 | .19 | |
| Class I | 31,621 | .16 | |
| 2,621,001 |
| (a) Annualized |
| % of Average Net Assets | |
| Fidelity Advisor® Capital Development Fund | .03 |
| Amount ($) | |
| Fidelity Advisor® Capital Development Fund | 8,323 |
| Borrower or Lender | Average Loan Balance ($) | Weighted Average Interest Rate (%) | Interest Expense ($) | |
| Fidelity Advisor® Capital Development Fund | Borrower | 16,880,759 | .32 | 4,284 |
| Purchases ($) | Sales ($) | Realized Gain (Loss) ($) | |
| Fidelity Advisor® Capital Development Fund | 49,107,815 | 84,078,073 | 25,346,601 |
Amount ($) | |
| Fidelity Advisor® Capital Development Fund | 5,094 |
| Total Security Lending Fees Paid to NFS ($) | Security Lending Income From Securities Loaned to NFS ($) | Value of Securities Loaned to NFS at Period End ($) | |||
| Fidelity Advisor® Capital Development Fund | 2,254 | - | - |
| Average Loan Balance ($) | Weighted Average Interest Rate (%) | Interest Expense ($) | |||
| Fidelity Advisor® Capital Development Fund | 1,679,429 | .58 | 567 |
| Transfer Agent Fees Limitation (%) | Waiver ($) | ||
| Class O | .00 | 2,148,710 | |
| Class A | .04 | 303,245 | |
Six months ended March 31, 2022 ($) | Year ended September 30, 2021($) | |||
| Fidelity Advisor® Capital Development Fund | ||||
| Distributions to shareholders | ||||
| Class O | 191,171,927 | 133,701,379 | ||
| Class A | 31,061,601 | 21,172,380 | ||
| Class M | 181,972 | 114,340 | ||
| Class C | 154,286 | 77,238 | ||
| Class I | 2,141,346 | 576,410 | ||
| Total | 224,711,132 | 155,641,747 | ||
| Shares Six months ended March 31, 2022 | Shares Year ended September 30, 2021 | Dollars Six months ended March 31, 2022 ($) | Dollars Year ended September 30, 2021 ($) | ||||||
| Fidelity Advisor® Capital Development Fund | |||||||||
| Class O | |||||||||
| Shares Sold | 1,560,400 | 12,232,081 | 31,482,929 | 216,823,303 | |||||
| Reinvestment of distributions | 9,628,271 | 7,825,312 | 185,055,365 | 129,743,638 | |||||
| Shares redeemed | (24,375,478) | (19,623,890) | (481,906,373) | (362,405,743) | |||||
| Net increase (decrease) | (13,186,807) | 433,503 | (265,368,079) | (15,838,802) | |||||
| Class A | |||||||||
| Shares Sold | 712,179 | 1,188,669 | 13,684,891 | 20,715,119 | |||||
| Reinvestment of distributions | 1,681,558 | 1,325,985 | 30,873,405 | 21,056,644 | |||||
| Shares redeemed | (1,111,960) | (3,315,570) | (21,341,453) | (59,203,805) | |||||
| Net increase (decrease) | 1,281,777 | (800,916) | 23,216,843 | (17,432,042) | |||||
| Class M | |||||||||
| Shares Sold | 21,336 | 30,785 | 396,292 | 537,022 | |||||
| Reinvestment of distributions | 10,252 | 7,434 | 181,972 | 114,340 | |||||
| Shares redeemed | (11,677) | (27,652) | (220,165) | (467,994) | |||||
| Net increase (decrease) | 19,911 | 10,567 | 358,099 | 183,368 | |||||
| Class C | |||||||||
| Shares Sold | 66,656 | 57,417 | 1,184,406 | 969,562 | |||||
| Reinvestment of distributions | 8,891 | 5,021 | 150,435 | 73,914 | |||||
| Shares redeemed | (38,571) | (62,195) | (670,164) | (1,028,141) | |||||
| Net increase (decrease) | 36,976 | 243 | 664,677 | 15,335 | |||||
| Class I | |||||||||
| Shares Sold | 541,320 | 1,643,647 | 11,043,352 | 31,855,937 | |||||
| Reinvestment of distributions | 96,947 | 27,856 | 1,873,010 | 464,074 | |||||
| Shares redeemed | (598,983) | (436,626) | (11,962,490) | (8,288,439) | |||||
| Net increase (decrease) | 39,284 | 1,234,877 | 953,872 | 24,031,572 | |||||
| The Example is based on an investment of $1,000 invested at the beginning of the period and held for the entire period (October 1, 2021 to March 31, 2022). |
Annualized Expense Ratio- A | Beginning Account Value October 1, 2021 | Ending Account Value March 31, 2022 | Expenses Paid During Period- C October 1, 2021 to March 31, 2022 | |||||||
| Fidelity Advisor® Capital Development Fund | ||||||||||
| Class O | .55% | |||||||||
| Actual | $ 1,000 | $ 1,068.90 | $ 2.84 | |||||||
Hypothetical- B | $ 1,000 | $ 1,022.19 | $ 2.77 | |||||||
| Class A | .85% | |||||||||
| Actual | $ 1,000 | $ 1,067.40 | $ 4.38 | |||||||
Hypothetical- B | $ 1,000 | $ 1,020.69 | $ 4.28 | |||||||
| Class M | 1.31% | |||||||||
| Actual | $ 1,000 | $ 1,064.80 | $ 6.74 | |||||||
Hypothetical- B | $ 1,000 | $ 1,018.40 | $ 6.59 | |||||||
| Class C | 1.75% | |||||||||
| Actual | $ 1,000 | $ 1,062.50 | $ 9.00 | |||||||
Hypothetical- B | $ 1,000 | $ 1,016.21 | $ 8.80 | |||||||
| Class I | .71% | |||||||||
| Actual | $ 1,000 | $ 1,067.90 | $ 3.66 | |||||||
Hypothetical- B | $ 1,000 | $ 1,021.39 | $ 3.58 | |||||||
- Highly liquid investments - cash or convertible to cash within three business days or less
- Moderately liquid investments - convertible to cash in three to seven calendar days
- Less liquid investments - can be sold or disposed of, but not settled, within seven calendar days
- Illiquid investments - cannot be sold or disposed of within seven calendar days
|
Item 2.
Code of Ethics
Not applicable.
Item 3.
Audit Committee Financial Expert
Not applicable.
Item 4.
Principal Accountant Fees and Services
Not applicable.
Item 5.
Audit Committee of Listed Registrants
Not applicable.
Item 6.
Investments
(a)
Not applicable.
(b)
Not applicable
Item 7.
Disclosure of Proxy Voting Policies and Procedures for Closed-End Management Investment Companies
Not applicable.
Item 8.
Portfolio Managers of Closed-End Management Investment Companies
Not applicable.
Item 9.
Purchase of Equity Securities by Closed-End Management Investment Company and Affiliated Purchasers
Not applicable.
Item 10.
Submission of Matters to a Vote of Security Holders
There were no material changes to the procedures by which shareholders may recommend nominees to the Fidelity Destiny Portfolios’s Board of Trustees.
Item 11.
Controls and Procedures
(a)(i) The President and Treasurer and the Chief Financial Officer have concluded that the Fidelity Destiny Portfolios’s (the “Trust”) disclosure controls and procedures (as defined in Rule 30a-3(c) under the Investment Company Act) provide reasonable assurances that material information relating to the Trust is made known to them by the appropriate persons, based on their evaluation of these controls and procedures as of a date within 90 days of the filing date of this report.
(a)(ii) There was no change in the Trust’s internal control over financial reporting (as defined in Rule 30a-3(d) under the Investment Company Act) that occurred during the period covered by this report that has materially affected, or is reasonably likely to materially affect, the Trust’s internal control over financial reporting.
Item 12.
Disclosure of Securities Lending Activities for Closed-End Management
Investment Companies
Not applicable.
Item 13.
Exhibits
(a) | (1) | Not applicable. |
(a) | (2) | |
(a) | (3) | Not applicable. |
(b) |
SIGNATURES
Pursuant to the requirements of the Securities Exchange Act of 1934 and the Investment Company Act of 1940, the registrant has duly caused this report to be signed on its behalf by the undersigned, thereunto duly authorized.
Fidelity Destiny Portfolios
By: | /s/Stacie M. Smith |
Stacie M. Smith | |
President and Treasurer | |
Date: | May 19, 2022 |
Pursuant to the requirements of the Securities Exchange Act of 1934 and the Investment Company Act of 1940, this report has been signed below by the following persons on behalf of the registrant and in the capacities and on the dates indicated.
By: | /s/Stacie M. Smith |
Stacie M. Smith | |
President and Treasurer | |
Date: | May 19, 2022 |
By: | /s/John J. Burke III |
John J. Burke III | |
Chief Financial Officer | |
Date: | May 19, 2022 |