As filed with the Securities and Exchange Commission on April 27, 2010
UNITED STATES
SECURITIES AND EXCHANGE COMMISSION
Washington, D.C. 20549
FORM 20-F
| (Mark One) | ||
| o | REGISTRATION STATEMENT PURSUANT TO SECTION 12(b) OR (g) OF THE SECURITIES EXCHANGE ACT OF 1934 | |
OR | ||
| x | ANNUAL REPORT PURSUANT TO SECTION 13 OR 15(d) OF THE SECURITIES EXCHANGE ACT OF 1934 | |
| For the fiscal year ended December 31, 2009 | ||
OR | ||
| o | TRANSITION REPORT PURSUANT TO SECTION 13 OR 15(d) OF THE SECURITIES EXCHANGE ACT OF 1934 | |
OR | ||
| o | SHELL COMPANY REPORT PURSUANT TO SECTION 13 OR 15(d) OF THE SECURITIES EXCHANGE ACT OF 1934 | |
Date of event requiring this shell company report ___________
For the transition period from ___________ to ___________
Commission file number 001-10306
THE ROYAL BANK OF SCOTLAND GROUP plc
(Exact name of Registrant as specified in its charter)
United Kingdom
(Jurisdiction of incorporation or organization)
RBS Gogarburn, PO Box 1000, Edinburgh EH12 1HQ
(Address of principal executive offices)
Aileen Taylor, Deputy Group Secretary, Tel: +44 (0) 131 626 4099, Fax: +44 (0) 131 626 3081,
PO Box 1000, Gogarburn, Edinburgh EH12 1HQ
(Name, Telephone, E-mail and/or Facsimile number and Address of Company Contact Person)
Securities registered or to be registered pursuant to Section 12(b) of the Act:
| Title of each class | Name of each exchange on which registered | |
| American Depositary Shares, each representing 20 ordinary shares, nominal value £0.25 per share | New York Stock Exchange | |
| Ordinary shares, nominal value £0.25 per share | New York Stock Exchange* | |
| American Depositary Shares Series F, H, L, M, N, P, Q, R, S, T and U each representing one Non-Cumulative Dollar Preference Share, Series F, H, L, M, N, P, Q, R, S, T and U respectively | New York Stock Exchange | |
| Dollar Perpetual Regulatory tier one securities, Series 1 | New York Stock Exchange |
* Not for trading, but only in connection with the registration of American Depositary Shares representing such ordinary shares pursuant to the requirements of the Securities and Exchange Commission.
Securities registered or to be registered pursuant to Section 12(g) of the Act:
None
Securities for which there is a reporting obligation pursuant to Section 15(d) of the Act:
None
Indicate the number of outstanding shares of each of the issuer’s classes of capital or common stock as of December 31, 2009, the close of the period covered by the annual report:
| Ordinary shares of 25 pence each | 56,365,721,284 | Non-cumulative dollar preference shares, Series F, H and L to U | 308,015,000 | ||
| B Shares | 51,000,000,000 | Non-cumulative convertible dollar preference shares, Series 1 | 1,000,000 | ||
| Non-voting Deferred Shares | 2,660,556,304 | Non-cumulative euro preference shares, Series 1 to 3 | 2,526,000 | ||
| Dividend Access Share | 1 | Non-cumulative convertible sterling preference shares, Series 1 | 200,000 | ||
| 11% cumulative preference shares | 500,000 | Non-cumulative sterling preference shares, Series 1 and 2 | 750,000 | ||
| 5½% cumulative preference shares | 400,000 |
Indicate by check mark if the registrant is a well-known seasoned issuer, as defined in Rule 405 of the Securities Act.
Yes x No o
If this report is an annual or transition report, indicate by check mark if the registrant is not required to file reports pursuant to Section 13 or 15(d) of the Securities Exchange Act of 1934.
Yes o No x
Note — checking the box above will not relieve any registrant required to file reports pursuant to Section 13 or 15(d) of the Securities Exchange Act of 1934 from their obligations under those Sections.
Indicate by check mark whether the registrant (1) has filed all reports required to be filed by Section 13 or 15(d) of the Securities Exchange Act of 1934 during the preceding 12 months (or for such shorter period that the registrant was required to file such reports), and (2) has been subject to such filing requirements for the past 90 days.
Yes x No o
Indicate by check mark whether the registrant has submitted electronically and posted on its corporate Web site, if any, every Interactive Data File required to be submitted and posted pursuant to Rule 405 of Regulation S-T (§232.405 of this chapter) during the preceding 12 months (or for such shorter period that the registrant was required to submit and post such files).
Yes o No o
Indicate by check mark whether the registrant is a large accelerated filer, an accelerated filer, or a non-accelerated filer. See definition of “accelerated filer and large accelerated filer” in Rule 12b-2 of the Exchange Act. (Check one):
Large accelerated filer x | Accelerated filer o | Non-accelerated filer o |
Indicate by check mark which basis of accounting the registrant has used to prepare the financial statements included in this filing:
U.S. GAAP o International Financial Reporting Standards as issued by the International Accounting Standards Board x Other o
If “Other” has been checked in response to the previous question, indicate by check mark which financial statement item the registrant has elected to follow.
Item 17 o Item 18 o
If this is an annual report, indicate by check mark whether the registrant is a shell company (as defined in Rule 12b-2 of the Exchange Act).
Yes o No x
(APPLICABLE ONLY TO ISSUERS INVOLVED IN BANKRUPTCY PROCEEDINGS DURING THE PAST FIVE YEARS)
Indicate by check mark whether the registrant has filed all documents and reports required to be filed by Sections 12, 13 or 15(d) of the Securities Exchange Act of 1934 subsequent to the distribution of securities under a plan confirmed by a court.
Yes o No o
SEC Form 20-F cross reference guide
| Item | Item Caption | Pages | |
| PART I | |||
| 1 | Identity of Directors, Senior Management and Advisers | Not applicable | |
| 2 | Offer Statistics and Expected Timetable | Not applicable | |
| 3 | Key Information | ||
Selected financial data | 23-24, 281-283, 311-312, 336-338 | ||
| Capitalisation and indebtedness | Not applicable | ||
| Reasons for the offer and use of proceeds | Not applicable | ||
| Risk factors | 7-22 | ||
| 4 | Information on the Company | 28-31, 69, 80-113, 248-249, 253-255, 311-320 | |
| History and development of the Company | 5-7, 163-164, 262-263, 342 | ||
| Business overview | 5-7, 163-164, 297-302, 321-323 | ||
| Organisational structure | 5-7, 256 | ||
| Property, plant and equipment | 260-261, 323-324 | ||
4A | Unresolved Staff Comments | Not applicable | |
| 5 | Operating and Financial Review and Prospects | ||
| Operating results | 6, 23-69, 120, 250-252, 321-324 | ||
| Liquidity and capital resources | 68-69, 80-159, 166, 226-247, 250-255, 260-261, 266, 284-287, 289, 293-296, 319-320 | ||
| Research and development, patents, licences etc | Not applicable | ||
| Trend information | 5-22, 321-323 | ||
| Off balance sheet arrangements | 155-159, 250-252, 285-286, 288-289 | ||
| Contractual obligations | 109-113, 284-286 | ||
| 6 | Directors, Senior Management and Employees | ||
| Directors and senior management | 161-162 | ||
| Compensation | 181-192, 217-221, 302-303 | ||
| Board practices | 167, 169-172, 181-184 | ||
| Employees | 64, 164, 217-218 | ||
| Share ownership | 166-167, 189-191, 193 | ||
| 7 | Major Shareholders and Related Party Transactions | ||
| Major shareholders | 168, 324 | ||
| Related party transactions | 303-304 | ||
| Interests of experts and counsel | Not applicable | ||
| 8 | Financial Information | ||
| Consolidated statements and other financial information | 5-7, 163, 195-309, 322-324, 338 | ||
| Significant changes | 6, 304 | ||
i
| Item | Item Caption | Pages | |
| 9 | The Offer and Listing | ||
| Offer and listing details | 335-336 | ||
| Plan of distribution | Not applicable | ||
| Markets | 334 | ||
| Selling shareholders | Not applicable | ||
| Dilution | Not applicable | ||
| Expenses of the issue | Not applicable | ||
| 10 | Additional Information | ||
| Share capital | Not applicable | ||
| Memorandum and articles of association | 342 | ||
| Material contracts | 324-330 | ||
| Exchange controls | 342 | ||
| Taxation | 338-342 | ||
| Dividends and paying agents | Not applicable | ||
| Statement of experts | Not applicable | ||
| Documents on display | 342 | ||
| Subsidiary information | Not applicable | ||
| 11 | Quantitative and Qualitative Disclosure about Market Risk | 70-159, 226-247, 250-255 | |
| 12 | Description of Securities other than Equity Securities | 330 | |
| PART II | |||
| 13 | Defaults, Dividend Arrearages and Delinquencies | Not applicable | |
| 14 | Material Modifications to the Rights of Security Holders and Use of Proceeds | Not applicable | |
| 15 | Controls and Procedures | 176, 196 | |
| 16 | [Reserved] | ||
| 16 | A | Audit Committee financial expert | 173-175 |
| B | Code of ethics | 165, 342 | |
| C | Principal Accountant Fees and services | 173-175, 222 | |
| D | Exemptions from the Listing Standards for Audit Committees | Not applicable | |
| E | Purchases of Equity Securities by the Issuer and Affiliated Purchasers | Not applicable | |
| F | Change in Registrant’s Certifying Accountant | Not applicable | |
| G | Corporate Governance | 169 | |
| PART III | |||
| 17 | Financial Statements | Not applicable | |
| 18 | Financial Statements | 195-309 | |
| 19 | Exhibits | 361 | |
| Signature | 362 | ||
ii
Business Review
| 2 | Presentation of information |
| 4 | Forward-looking statements |
| 5 | Description of business |
| 6 | Recent developments |
| 6 | Competition |
| 7 | Risk factors |
| 23 | Key financials |
| 24 | Summary consolidated income statement |
| 28 | Analysis of results |
| 38 | Divisional performance |
| 65 | Consolidated balance sheet |
| 68 | Cash flow |
| 69 | Capital resources |
| 70 | Risk, capital and liquidity management |
1
Presentation of information
In this document, and unless specified otherwise, the term ‘company’ means The Royal Bank of Scotland Group plc, ‘RBS’ or the ‘Group’ means the company and its subsidiaries, ‘the Royal Bank’ means The Royal Bank of Scotland plc and ‘NatWest’ means National Westminster Bank Plc.
The company publishes its financial statements in pounds sterling (‘£’ or ‘sterling’). The abbreviations ‘£m’ and ‘£bn’ represent millions and thousands of millions of pounds sterling, respectively, and references to ‘pence’ represent pence in the United Kingdom (‘UK’). Reference to ‘dollars’ or ‘$’ are to United States of America (‘US’) dollars. The abbreviations ‘$m’ and ‘$bn’ represent millions and thousands of millions of dollars, respectively, and references to ‘cents’ represent cents in the US. The abbreviation ‘€’ represents the ‘euro’, the European single currency, and the abbreviations ‘€m’ and ‘€bn’ represent millions and thousands of millions of euros, respectively.
Certain information in this report is presented separately for domestic and foreign activities. Domestic activities primarily consist of the UK domestic transactions of the Group. Foreign activities comprise the Group’s transactions conducted through those offices in the UK specifically organised to service international banking transactions and transactions conducted through offices outside the UK.
The geographic analysis in the average balance sheet and interest rates, changes in net interest income and average interest rates, yields, spreads and margins in this report have been compiled on the basis of location of office – UK and overseas. Management believes that this presentation provides more useful information on the Group’s yields, spreads and margins of the Group’s activities than would be provided by presentation on the basis of the domestic and foreign activities analysis used elsewhere in this report as it more closely reflects the basis on which the Group is managed. ‘UK’ in this context includes domestic transactions and transactions conducted through the offices in the UK which service international banking transactions.
The results, assets and liabilities of individual business units are classified as trading or non-trading based on their predominant activity. Although this method may result in some non-trading activity being classified as trading, and vice versa, the Group believes that any resulting misclassification is not material.
International Financial Reporting Standards
As required by the Companies Act 2006 and Article 4 of the European Union IAS Regulation, the consolidated financial statements of the Group are prepared in accordance with International Financial Reporting Standards issued by the International Accounting Standards Board (IASB) and interpretations issued by the International Financial Reporting Interpretations Committee of the IASB (together ‘IFRS’) as adopted by the European Union. They also comply with IFRS as issued by the IASB.
Acquisition of ABN AMRO
On 17 October 2007, RFS Holdings B.V. (“RFS Holdings”), which at the time was owned by RBSG, Fortis N.V., Fortis S.A./N.V., Fortis Bank Nederland (Holding) N.V. (“Fortis”) and Banco Santander, S.A. (“Santander”), completed the acquisition of ABN AMRO Holding N.V. (which was renamed RBS Holdings N.V. on 1 April 2010).
RFS Holdings, which is now jointly owned by RBSG, the Dutch State (following its acquisition of Fortis) and Santander (the “Consortium Members”), is continuing the process of implementing an orderly separation of the business units of RBS Holdings N.V. As part of this reorganisation, on 6 February 2010, the businesses of RBS Holdings N.V. acquired by the Dutch State were legally demerged from the RBS Holdings N.V. businesses acquired by the Group and were transferred into a newly established holding company, ABN AMRO Bank N.V. (save for certain assets and liabilities acquired by the Dutch State that were not part of the legal separation and which will be transferred to the Dutch State as soon as possible).
Legal separation of ABN AMRO Bank N.V. occurred on 1 April 2010, with the shares in that entity being transferred by RBS Holdings N.V. to a holding company called ABN AMRO Group N.V., which is owned by the Dutch State. Certain assets within RBS Holdings N.V. continue to be shared by the Consortium Members. RBS Holdings N.V. is a fully operational bank within the Group and is independently rated and licensed and regulated by the Dutch Central Bank.
Statutory results
RFS Holdings is jointly owned by the consortium members. It is controlled by the company and is therefore fully consolidated in its financial statements. Consequently, the statutory results of the Group include the results of ABN AMRO. The interests of Fortis, and its successor the State of the Netherlands, and Santander in RFS Holdings are included in minority interests.
2
Presentation of information continued
Restatements
Divisional results for 2008 have been restated to reflect the Group’s new organisational structure that includes a Non-Core division comprising individual assets, portfolios and lines of business that the Group intends to run off or dispose. The Non-Core division is reported separately from the divisions which form the Core Group. In addition, separate reporting of Business Services (formerly Group Manufacturing) and Centre results has changed and, with the exception of certain items of a one off nature, costs incurred are now allocated to the customer-facing divisions and included in the measurement of the returns which they generate. The changes do not affect the Group’s results. Comparatives have been restated accordingly.
IAS 1 (Revised 2007) ‘Presentation of Financial Statements’ has required the Group to present a third balance sheet (31 December 2007) as a result of the restatement of the Group’s income statement following the implementation of IFRS 2 (see below). A fourth balance sheet (31 December 2006) has not been presented as there is no material impact on that period.
Results for 2008 have been restated for the amendment to IFRS 2 ‘Share-based Payment’. This has resulted in an increase in staff costs amounting to £169 million for 2008 with no material effect on earlier periods.
Glossary
A glossary of terms is detailed on pages 355 to 359.
3
Forward-looking statements
Certain sections in this document contain ‘forward-looking statements’ as that term is defined in the United States Private Securities Litigation Reform Act of 1995, such as statements that include the words ‘expect’, ‘estimate’, ‘project’, ‘anticipate’, ‘believes’, ‘should’, ‘intend’, ‘plan’, ‘probability’, ‘risk’, ‘Value-at-Risk (VaR)’, ‘target’, ‘goal’, ‘objective’, ‘will’, ‘endeavour’, ‘outlook’, ‘optimistic’, ‘prospects’ and similar expressions or variations on such expressions.
In particular, this document includes forward-looking statements relating, but not limited to: the Group’s restructuring plans, capitalisation, portfolios, capital ratios, liquidity, risk weighted assets, return on equity, cost:income ratios, leverage and loan:deposit ratios, funding and risk profile; the Group’s future financial performance; the level and extent of future impairments and write-downs; the protection provided by the APS; and to the Group’s potential exposures to various types of market risks, such as interest rate risk, foreign exchange rate risk and commodity and equity price risk. These statements are based on current plans, estimates and projections, and are subject to inherent risks, uncertainties and other factors which could cause actual results to differ materially from the future results expressed or implied by such forward-looking statements. For example, certain of the market risk disclosures are dependent on choices about key model characteristics and assumptions and are subject to various limitations. By their nature, certain of the market risk disclosures are only estimates and, as a result, actual future gains and losses could differ materially from those that have been estimated.
Other factors that could cause actual results to differ materially from those estimated by the forward-looking statements contained in this document include, but are not limited to: the full nationalisation of the Group or other resolution procedures under the Banking Act 2009; the global economy and instability in the global financial markets, and their impact on the financial industry in general and on the Group in particular; the financial stability of other financial institutions, and the Group’s counterparties and borrowers; the ability to complete restructurings on a timely basis, or at all, including the disposal of certain non-core assets and assets and businesses required as part of the EC State Aid restructuring plan; organizational restructuring; the ability to access sufficient funding to meet liquidity needs; cancellation or failure to renew governmental support schemes; the extent of future write-downs and impairment charges caused by depressed asset valuations; the inability to hedge certain risks economically; the value and effectiveness of any credit protection purchased by the Group; unanticipated turbulence in interest rates, foreign currency exchange rates, credit spreads, bond prices, commodity prices and equity prices; changes in the credit ratings of the Group; ineffective management of capital or changes to capital adequacy or liquidity requirements; changes to the valuation of financial instruments recorded at fair value; competition and consolidation in the banking sector; HM Treasury exercising influence over the operations of the Group; the ability of the Group to attract or retain senior management or other key employees; regulatory change or a change in UK Government policy; changes to the monetary and interest rate policies of the Bank of England, the Board of Governors of the Federal Reserve System and other G7 central banks; impairment of goodwill; pension fund shortfall; litigation and regulatory investigations; general operational risks; insurance claims; reputational risk; general geopolitical and economic conditions in the UK and in other countries in which the Group has significant business activities or investments, including the United States; the ability to achieve revenue benefits and cost savings from the integration of certain of RBS Holdings N.V.’s businesses and assets; changes in UK and foreign laws, regulations, accounting standards and taxes, including changes in regulatory capital regulations and liquidity requirements; the participation of the Group in the APS and the effect of such Scheme on the Group’s financial and capital position; the ability to access the contingent capital arrangements with HM Treasury; the conversion of the B Shares in accordance with their terms; limitations on, or additional requirements imposed on, the Group’s activities as a result of HM Treasury’s investment in the Group; and the success of the Group in managing the risks involved in the foregoing.
The forward-looking statements contained in this document speak only as of the date of this report, and the Group does not undertake to update any forward-looking statement to reflect events or circumstances after the date hereof or to reflect the occurrence of unanticipated events.
For a further discussion of certain risks faced by the Group, see Risk factors on pages 7 to 22.
4
Business review
Description of business
Introduction
The Royal Bank of Scotland Group plc is the holding company of a large global banking and financial services group. Headquartered in Edinburgh, the Group operates in the United Kingdom, the United States and internationally through its two principal subsidiaries, the Royal Bank and NatWest. Both the Royal Bank and NatWest are major UK clearing banks whose origins go back over 275 years. In the United States, the Group’s subsidiary Citizens is a large commercial banking organisation. The Group has a large and diversified customer base and provides a wide range of products and services to personal, commercial and large corporate and institutional customers in over 50 countries.
Following placing and open offers in December 2008 and in April 2009, HM Treasury owned 70.3% of the enlarged ordinary share capital of the company.
In December 2009, the company issued £25.5 billion of new capital to HM Treasury. This new capital took the form of B shares, which do not generally carry voting rights at general meetings of ordinary shareholders but are convertible into ordinary shares and qualify as core tier one capital.
Following the issuance of B shares, HM Treasury’s holding of ordinary shares of the company remained at 70.3% although its economic interest rose to 84.4%.
HM Treasury has agreed not to convert its B shares into ordinary shares to the extent that its holding of ordinary shares following the conversion would represent more than 75% of the company’s issued ordinary share capital.
In March 2010, the company converted 935,228 non-cumulative dollar preference shares in the company into ordinary shares resulting in approximately 1.6 billion ordinary shares being issued. This increase in the company's issued ordinary share capital resulted in HMT's holding in the company's ordinary shares reducing to approximately 68.4%.
The Group had total assets of £1,696.5 billion and owners’ equity of £77.7 billion at 31 December 2009. The Group’s capital ratios, which included the equity minority interest of the State of the Netherlands and Santander in ABN AMRO, were a total capital ratio of 16.1 per cent., a core Tier 1 capital ratio of 11.0 per cent. and a Tier 1 capital ratio of 14.1 per cent., as at 31 December 2009.
Organisational structure and business overview
Following a comprehensive strategic review, changes have been made to the Group’s operating segments in 2009. A Non-Core division has been created comprising those lines of business, portfolios and individual assets that the Group intends to run off or sell. Furthermore, Business Services (formerly Group Manufacturing) is no longer reported as a separate division and its costs are now allocated to the customer-facing divisions along with certain central costs. UK Retail & Commercial Banking has been split into three segments (UK Retail, UK Corporate and Wealth). Ulster Bank has become a specific segment. The remaining elements of Europe & Middle East Retail & Commercial Banking, Asia Retail & Commercial Banking and Share of shared assets form part of Non-Core. The segment measure is now Operating profit/(loss) before tax which differs from Contribution used previously; it excludes certain infrequent items and RFS Holdings minority interest, which is not an operating segment of the Group. Comparative data have been restated accordingly.
UK Retail offers a comprehensive range of banking products and related financial services to the personal market. It serves customers through the RBS and NatWest networks of branches and ATMs in the United Kingdom, and also through telephone and internet channels.
UK Corporate is a leading provider of banking, finance, and risk management services to the corporate and SME sector in the United Kingdom. It offers a full range of banking products and related financial services through a nationwide network of relationship managers, and also through telephone and internet channels. The product range includes asset finance through the Lombard brand.
Wealth provides private banking and investment services in the UK through Coutts & Co and Adam & Company, offshore banking through RBS International, NatWest Offshore and Isle of Man Bank, and international private banking through RBS Coutts.
Global Banking & Markets (GBM) is a leading banking partner to major corporations and financial institutions around the world, providing an extensive range of debt and equity financing, risk management and investment services to its customers. The division is organised along six principal business lines: money markets; rates flow trading; currencies and commodities; equities; credit markets and portfolio management & origination.
Global Transaction Services ranks among the top five global transaction services providers, offering global payments, cash and liquidity management, and trade finance and commercial card products and services. It includes the Group’s corporate money transmission activities in the United Kingdom and the United States as well as Global Merchant Services, the Group’s United Kingdom and international merchant acquiring business.
Ulster Bank is the leading retail and commercial bank in Northern Ireland and the third largest banking group on the island of Ireland. It provides a comprehensive range of financial services through both its Retail Markets division which has a network of branches and operates in the personal and bancassurance sectors, and its Corporate Markets division which provides services to SME business customers, corporates and institutional markets.
US Retail & Commercial provides financial services primarily through the Citizens and Charter One brands. US Retail & Commercial is engaged in retail and corporate banking activities through its branch network in 12 states in the United States and through non-branch offices in other states. It ranks among the top five banks in New England.
RBS Insurance sells and underwrites retail and SME insurance over the telephone and internet, as well as through brokers and partnerships. Its brands include Direct Line, Churchill and Privilege, which sell general insurance products direct to the customer, as well as Green Flag and NIG.
5
Business review continued |
Through its international division, RBS Insurance sells general insurance, mainly motor, in Germany and Italy. The Intermediary and Broker division sells general insurance products through independent brokers.
Business Services (formerly Group Manufacturing) supports the customer-facing businesses and provides operational technology, customer support in telephony, account management, lending and money transmission, global purchasing, property and other services. Business Services drives efficiencies and supports income growth across multiple brands and channels by using a single, scalable platform and common processes wherever possible. It also leverages the Group’s purchasing power and is the Group’s centre of excellence for managing large-scale and complex change.
Central Functions comprises group and corporate functions, such as treasury, funding and finance, risk management, legal, communications and human resources. The Centre manages the Group’s capital resources and Group-wide regulatory projects and provides services to the operating divisions.
Non-Core Division manages separately assets that the Group intends to run off or dispose. The division contains a range of businesses and asset portfolios primarily from the GBM division including RBS Sempra Commodities, linked to proprietary trading, higher risk profile asset portfolios including excess risk concentrations, and other illiquid portfolios. It also includes a number of other portfolios and businesses including regional markets businesses that the Group has concluded are no longer strategic.
Business divestments
To comply with European Commission State Aid (EC State Aid) requirements the Group has agreed a series of restructuring measures to be implemented over a four year period. This will supplement the measures in the strategic plan previously announced by the Group. These include divesting fully RBS Insurance, Global Merchant Services and RBS Sempra Commodities, as well as divesting the RBS branch-based business in England & Wales and the NatWest branches in Scotland, along with the Direct SME customers across the UK.
Relationship with major shareholder
The UK Government currently owns 68.4 per cent. of the issued ordinary share capital of RBS. The UK Government’s shareholding in RBS is currently held by the Solicitor for the Affairs of HM Treasury as nominee for HM Treasury and managed by UK Financial Investments Limited (“UKFI”), a company wholly owned by HM Treasury. The relationship between HM Treasury and UKFI, and between UKFI and Government investee banks is set out in the UKFI Framework Document and Investment Mandate, agreed between HM Treasury and UKFI.
The Framework Document sets out UKFI’s overarching objective, to “develop and execute an investment strategy for disposing of the investments [in the banks] in an orderly and active way through sale, redemption, buy-back or other means within the context of an overarching objective of protecting and creating value for the taxpayer as shareholder, paying due regard to the maintenance of financial stability and to acting in a way that promotes competition.”
It states that UKFI will manage the UK financial institutions in which HM Treasury holds an interest “at an arms length and on a commercial basis and will not intervene in day-to-day management decisions of the Investee Companies (including with respect to individual lending or remuneration decisions)”.This document also makes it clear that such UK financial institutions “will continue to have their own independent boards and management teams, determining their own strategies and commercial policies (including business plans and budgets).”
HM Treasury expects UKFI to act in the same way as any other engaged institutional shareholder would. The UKFI Investment Mandate states that it will “follow best institutional shareholder practice. This includes compliance with the Institutional Shareholders’ Committee’s Statement of Principles together with any developments to best institutional shareholder practice arising from recommendations or guidance contained in the Walker Review or elsewhere.”
For example, RBS announced on 17 February 2009 that it had reached an agreement with UKFI in respect of certain changes to its remuneration policy. RBS also undertook to conduct a review of its strategy and UKFI was actively engaged in reviewing the output of this review, as any other engaged shareholder would be expected to be. RBS has made a commitment to comply with the FSA Remuneration Code. These rules came into force on 1 January 2010 and are in line with the agreement reached by the G-20, setting global standards for the implementation of the Financial Stability Board’s remuneration principles. RBS agreed that it will be at the leading edge of implementing the G-20 principles. UKFI was granted consent rights over the shape and size of the RBS aggregate bonus pool for the 2009 performance year. Separate to the shareholding relationship, RBS has a number of relationships with the UK Government arising out of the Government’s provision of support.
As a result of the Government’s recapitalisation of RBS, an undertaking was given to UKFI in 2008 to appoint a new Chairman and three new Non-executive Directors to the Group Board. This undertaking has been completed by the following appointments: Philip Hampton as Chairman, Sandy Crombie as Senior Independent Director and Philip Scott and Penny Hughes as Non-executive Directors. In addition, Brendan Nelson was appointed as a Non-executive Director with effect from 1 April 2010. Subsequently, UKFI were consulted as majority shareholder on proposed Non-executive Director appointments but in all cases the usual process for appointments was followed i.e. candidates were considered by the Nominations Committee and then recommended to the Group Board for approval. For the avoidance of doubt, no member of the Board represents or acts on the instructions of UKFI or HMT. There is no further arrangement with UKFI in this regard, beyond usual shareholder rights, and no such arrangements with any other shareholder.
In connection with its accession to the APS (further details of which are set out above), RBS has undertaken to provide lending to creditworthy UK homeowners and businesses in a commercial manner. RBS’s compliance with this commitment is subject to a monthly reporting process to the UK Government. The lending commitment does not require RBS to engage in uncommercial practices.
Certain other considerations relating to RBS’s relationship with HM Treasury and UKFI are set out in the risk factors headed “HM Treasury (or UKFI on its behalf) may be able to exercise a significant degree of influence over the Group”.
Other than in relation to these areas, however, the UK Government has confirmed publicly that its intention is to allow the financial institutions in which it holds an interest to operate their business independently, as set out in UKFI’s governance documents described above.
As a result of the UK Government’s holding, the UK Government and UK Government controlled bodies became related parties of the Group. In the normal course of business the Group enters into transactions with many of these bodies on an arms' length basis.
The Group is not a party to any transaction with the UK Government or any UK Government controlled body involving goods or services which is material to the Group, or any such transaction that is unusual in its nature or conditions. To the Group's knowledge, the Group is not a party to any transaction with the UK Government or any UK Government controlled body involving goods or services which is material to the UK Government or any UK Government controlled body. However, given the nature and extent of the UK Government controlled bodies, the Group may not know whether a transaction is material for such a party.
Any outstanding loans made by the Group to or for the benefit of the UK Government or any UK Government controlled body, were made on an arm's length basis and (A) such loans were made in the ordinary course of business, (B) were made on substantially the same terms, including interest rates and collateral, as those prevailing at the time for comparable transactions with other persons, and (C) did not involve more than the normal risk of collectibility or present other unfavorable features. The Group notes, however, that with respect to outstanding loans made by the Group to or for the benefit of the UK Government or any UK Government controlled body, there may not exist any comparable transactions with other persons.
Recent Developments
On 25 March 2010, the RBS Group announced its intention to launch (i) an offer to exchange certain subordinated debt securities issued by Group members for new senior debt and (ii) tender offers in respect of certain preference shares, preferred securities and perpetual securities issued by Group members. The RBS Group announced the offers on 6 April 2010 and will seek shareholder approvals as required in coordination with the annual general meeting of The Royal Bank of Scotland Group plc scheduled to take place on 28 April 2010.
In January 2010, the FSA informed the Group that it intended to commence an investigation into certain aspects of the handling of customer complaints. On 25 March 2010 FSA formally notified the Group of the appointment of investigators in respect of aspects of complaint handling relating to RBS and NatWest retail bank products and services. The company and its subsidiaries intend to co-operate fully with this investigation.
In March 2010, the company converted 935,228 non-cumulative dollar preference shares in the company into ordinary shares resulting in approximately 1.6 billion ordinary shares being issued. This increase in the company's issued ordinary share capital resulted in HMT's holding in the company's ordinary shares reducing to approximately 68.4%.
In the UK, the OFT has been investigating RBS Group for alleged conduct in breach of Article 101 of the Treaty on the Functioning of the European Union and/or the Chapter 1 prohibition of the Competition Act 1998 relating to the provision of loan products to professional services firms. RBS Group co-operated fully with the OFT's investigation. On 30 March 2010 the OFT announced that it has arrived at an early resolution agreement with RBS Group by which RBS Group will pay a (discounted) fine of £28.59 million and admit a breach in competition law relating to the provision of loan products to professional services firms.
Brendan Nelson has been appointed as a non-executive director with effect from 1 April 2010. Brendan will succeed Archie Hunter as Chairman of the Group Audit Committee with effect from the conclusion of the Group's Annual General Meeting on 28 April 2010.
Legal separation of ABN AMRO Bank N.V. occurred on 1 April 2010, with the shares in that entity being transferred by RBS Holdings N.V. to a holding company called ABN AMRO Group N.V., which is owned by the Dutch State. Certain assets within RBS Holdings N.V. continue to be shared by the Consortium Members. RBS Holdings N.V. is a fully operational bank within the Group and is independently rated and licensed and regulated by the Dutch Central Bank.
Competition
The Group faces strong competition in all the markets it serves. However, the global banking crisis has reduced either the capacity or appetite of many institutions to lend and has resulted in the withdrawal or disappearance of a number of market participants and significant consolidation of competitors, particularly in the US and UK. Competition for retail deposits has intensified significantly as institutions have re-orientated their funding strategies following the difficulties experienced in the wholesale markets since late 2007.
Competition for corporate and institutional customers in the UK is from UK banks and from large foreign financial institutions who are also active and offer combined investment and commercial banking capabilities. In asset finance, the Group competes with banks and specialised asset finance providers, both captive and non-captive. In European and Asian corporate and institutional banking markets the Group competes with the large domestic banks active in these markets and with the major international banks.
In the small business banking market, the Group competes with other UK clearing banks, specialist finance providers and building societies.
In the personal banking segment the Group competes with UK banks and building societies, major retailers and life assurance companies. In the mortgage market the Group competes with UK banks and building societies. A number of competitors have either left or scaled back their lending in the mortgage and unsecured markets. The Group’s life assurance businesses compete with Independent Financial Advisers and life assurance companies.
In the UK credit card market large retailers and specialist card issuers, including major US operators, are active in addition to the UK banks. In addition to physical distribution channels, providers compete through direct marketing activity and the internet.
In Wealth Management, The Royal Bank of Scotland International competes with other UK and international banks to offer offshore banking services. Coutts and Adam & Company compete as private banks with UK clearing and private banks, and with international private banks. Competition in wealth management remains strong as banks maintain their focus on competing for affluent and high net worth customers.
6
Business review continued |
In Ireland, Ulster Bank competes in retail and commercial banking with the major Irish banks and building societies, and with other UK and international banks and building societies active in the market.
In the United States, Citizens competes in the New England, Mid- Atlantic and Mid West retail and mid-corporate banking markets with local and regional banks and other financial institutions. The Group also competes in the US in large corporate lending and specialised finance markets, and in fixed-income trading and sales. Competition is principally with the large US commercial and investment banks and international banks active in the US.
Risk factors
Set out below are certain risk factors which could affect the Group’s future results and cause them to be materially different from expected results. The Group’s results are also affected by competition and other factors. The factors discussed in this report should not be regarded as a complete and comprehensive statement of all potential risks and uncertainties.
The company and its United Kingdom bank subsidiaries may face the risk of full nationalisation or other resolution procedures under the Banking Act 2009.
Under the provisions of the Banking Act , substantial powers have been granted to HM Treasury and the Bank of England as part of the special resolution regime to stabilise banks that are in financial difficulties (the “SRR”), which includes certain consultation and consent rights granted to the FSA (the FSA, together with HM Treasury and the Bank of England, the “Authorities”). The SRR confers powers on the Bank of England: (i) to transfer to the private sector all or part of the business of a United Kingdom incorporated institution with permission to accept deposits pursuant to Part IV of the FSMA (a “relevant entity”) or the securities of such relevant entity; (ii) to transfer all or part of the business of the relevant entity to a “bridge bank” established by the Bank of England and also confers a power on HM Treasury to transfer into temporary public ownership (nationalise) the relevant entity or its United Kingdom incorporated holding company. The Banking Act also provides for two new insolvency and administration procedures for relevant entities.
The purpose of the stabilisation options is to address the situation where all or part of the business of a relevant entity has encountered, or is likely to encounter, financial difficulties. Accordingly, the stabilisation options may only be exercised if the FSA is satisfied that (i) a relevant entity such as the company’s United Kingdom banking subsidiaries, including The Royal Bank of Scotland plc (“RBS”) and National Westminster Bank Plc (“NatWest”), is failing, or is likely to fail, to satisfy the threshold conditions set out in Schedule 6 to the FSMA; and (ii) having regard to timing and other relevant circumstances, it is not reasonably likely that (ignoring the stabilisation options) action will be taken that will enable the relevant entity to satisfy those threshold conditions. The threshold conditions are conditions which an FSA-authorised institution must satisfy in order to retain its FSA authorisation. They are relatively wide-ranging and deal with most aspects of a relevant entity’s business, including, but not limited to, minimum capital resource requirements. It is therefore possible that the FSA may trigger one of the stabilisation options before an application for an insolvency or administration order could be made.
The stabilisation options may be exercised by means of powers to transfer property, rights or liabilities of a relevant entity and shares and other securities issued by a relevant entity. HM Treasury may also take the parent company of a relevant entity (such as the company) into temporary public ownership provided that certain conditions set out in Section 82 of the Banking Act are met. Temporary public ownership is effected by way of a share transfer order and can be actioned irrespective of the financial condition of the parent company.
If HM Treasury makes the decision to take the company into temporary public ownership, it may take various actions in relation to any securities issued by the company (the “Securities”) without the consent of holders of the Securities, including (among other things):
| (i) | transferring the Securities free from any contractual or legislative restrictions on transfer; |
| (ii) | transferring the Securities free from any trust, liability or encumbrance; |
| (iii) | extinguishing any rights to acquire Securities; |
| (iv) | delisting the Securities; |
| (v) | converting the Securities into another form or class (including for example, into equity securities); or |
| (vi) | disapplying any termination or acceleration rights or events of default under the terms of the Securities which would be triggered by the transfer. |
Where HM Treasury has made a share transfer order in respect of securities issued by the holding company of a relevant entity, HM Treasury may make an order providing for the property, rights or liabilities of the holding company or of any relevant entity in the holding company group to be transferred and where such property is held on trust, removing or altering the terms of such trust.
Accordingly, there can be no assurance that the taking of any such actions would not adversely affect the rights of holders of the Securities and/or adversely affect the price or value of their investment or that the ability of the company to satisfy its obligations under contracts related to the Securities would be unaffected. In such circumstances, such holders may have a claim for compensation under one of the compensation schemes currently existing under, or contemplated by, the Banking Act if any action is taken in respect of the Securities (for the purposes of determining an amount of compensation, an independent valuer must disregard actual or potential financial assistance provided by the Bank of England or HM Treasury). There can be no assurance that holders of the Securities would thereby recover compensation promptly and/or equal to any loss actually incurred.
If the company was taken into temporary public ownership and a partial transfer of its or any relevant entity’s business was effected, or if a relevant entity were made subject to the SRR and a partial transfer of its business to another entity was effected, the transfer may directly affect the company and/or its Group companies by creating, modifying or cancelling their contractual arrangements with a view to ensuring the provision of such services and facilities as are required to enable the bridge bank or private sector purchaser to operate the transferred business (or any
7
Business review continued |
part of it) effectively. For example, the transfer may (among other things) (i) require the company or Group companies to support and co-operate with the bridge bank or private sector purchaser; (ii) cancel or modify contracts or arrangements between the company or the transferred business and a Group company; or (iii) impose additional obligations on the company under new or existing contracts. There can be no assurance that the taking of any such actions would not adversely affect the ability of the company to satisfy its obligations under the issued Securities or related contracts.
If the company was taken into temporary public ownership and a partial transfer of its or any relevant entity’s business was effected, or if a relevant entity were made subject to the SRR and a partial transfer of its business to another entity was effected, the nature and mix of the assets and liabilities not transferred may adversely affect the company’s financial condition and increase the risk that the company may eventually become subject to administration or insolvency proceedings pursuant to the Banking Act.
While the main provisions of the Banking (Special Provisions) Act 2008 were in force, which conferred certain transfer powers on HM Treasury, the United Kingdom Government took action under that Act in respect of a number of United Kingdom financial institutions, including, in extreme circumstances, full and part nationalisation. There have been concerns in the market in the past year regarding the risks of such nationalisation in relation to the company and other United Kingdom banks. If economic conditions in the United Kingdom or globally were to deteriorate, or the events described in the following risk factors occur to such an extent that they have a materially adverse impact on the financial condition, perceived or actual credit quality, results of operations or business of any of the relevant entities in the Group, the United Kingdom Government may decide to take similar action in relation to the company under the Banking Act. Given the extent of the Authorities’ powers under the Banking Act, it is difficult to predict what effect such actions might have on the Group and any securities issued by the company or Group companies. However, potential impacts may include full nationalisation of the company, the total loss of value in Securities issued by the company and the inability of the company to perform its obligations under the Securities.
If the relevant stabilisation option was effected in respect of the company or the stabilisation options were effected in respect of a relevant entity or its business within the Group, HM Treasury would be required to make certain compensation orders, which will depend on the stabilisation power adopted. For example, in the event that the Bank of England were to transfer some of the business of a relevant entity to a bridge bank, HM Treasury would have to make a resolution fund order including a third party compensation order pursuant to the Banking Act (Third Party Compensation Arrangements for Partial Property Transfers) Regulations 2009. However, there can be no assurance that compensation would be assessed to be payable or that holders of the Securities would recover any compensation promptly and/or equal to any loss actually incurred.
The Group’s businesses, earnings and financial condition have been and will continue to be affected by the global economy and instability in the global financial markets.
The performance of the Group has been and will continue to be influenced by the economic conditions of the countries in which it operates, particularly the United Kingdom, the United States and other countries throughout Europe, the Middle East and Asia. The outlook for the global economy over the near to medium term remains challenging, particularly in the United Kingdom, the United States and other European economies. In addition, the global financial system has yet to fully overcome the difficulties which first manifested themselves in August 2007 and financial markets conditions have not yet fully normalised. These conditions led to severe dislocation of financial markets around the world and unprecedented levels of illiquidity in 2008 and 2009, resulting in the development of significant problems at a number of the world’s largest corporate institutions operating across a wide range of industry sectors, many of whom are the Group’s customers and counterparties in the ordinary course of its business. In response to this economic instability and illiquidity in the market, a number of governments, including the United Kingdom Government, the governments of the other EU member states and the United States Government, have intervened in order to inject liquidity and capital into the financial system, and, in some cases, to prevent the failure of these institutions.
Despite such measures, the volatility and disruption of the capital and credit markets have continued, with many forecasts predicting only modest levels of GDP growth over the course of 2010. Similar conditions are likely to exist in a number of the Group’s key markets, including those in the United States and Europe, particularly Ireland. These conditions have exerted, and may continue to exert, downward pressure on asset prices and on availability and cost of credit for financial institutions, including the company, and will continue to impact the credit quality of the Group’s customers and counterparties. Such conditions, alone or in combination with regulatory changes or actions of other market participants, may cause the Group to incur losses or to experience further reductions in business activity, increased funding costs and funding pressures, lower share prices, decreased asset values, additional write-downs and impairment charges and lower profitability.
The performance of the Group may be affected by economic conditions impacting euro-zone member states. For example the financial problems experienced by the government of Greece, may lead to Greece issuing significant volumes of debt which may in turn reduce demand for debt issued by financial institutions and corporate borrowers. This could adversely affect the Group’s access to the debt capital markets and may increase the Group’s funding costs, having a negative impact on the Group’s earnings and financial condition. In addition, euro-zone countries in which the Group operates may be required to provide financial assistance to Greece, which may in turn have a negative impact on the financial condition of those EU member states. Should the economic conditions facing Greece be replicated in other euro-zone member states, the risks above would be exacerbated.
In addition, the Group will continue to be exposed to the risk of loss if major corporate borrowers or counterparty financial institutions fail or are otherwise unable to meet their obligations. The Group currently experiences certain business sector and country concentration risk, primarily focused in the United States, the United Kingdom and the rest of Europe and relating to personal and banking and financial institution exposures. The Group’s performance may also be affected by future recovery rates on assets and the historical assumptions underlying asset recovery rates, which (as has already occurred in certain instances) may no longer be accurate given the unprecedented market disruption and general economic instability. The precise nature of all the risks and uncertainties the Group faces as a result of current economic conditions cannot be predicted and many of these risks are outside the control of the Group.
The Group was required to obtain State Aid approval, for the aid given to the Group by HM Treasury and for the Group’s State Aid restructuring plan, from the European Commission. The Group is subject to a variety of risks as a result of implementing the State Aid restructuring plan. The State Aid restructuring plan includes a prohibition on the making of discretionary dividend or coupon payments on existing hybrid capital instruments (including preference shares and B Shares) for a two-year period commencing no later than 30 April 2010, which may impair the Group’s ability to raise new Tier 1 capital through the issuance of ordinary shares and other Securities.
The Group was required to obtain State Aid approval for the aid given to the Group by HM Treasury as part of the placing and open offer undertaken by the company in December 2008 (the “First Placing and Open Offer”), the issuance of £25.5 billion of B shares in the capital of the company which are, subject to certain terms and conditions, convertible into ordinary shares in the share capital of the company (the “B Shares”) to HM Treasury, a contingent commitment by HM Treasury to subscribe for up to an additional £8 billion of B Shares if certain conditions are met and the Group’s participation in the Asset Protection Scheme (the “APS”) (the “State Aid”).
As a result of the First Placing and Open Offer (approved as part of the European Commission’s approval of a package of measures to the banking industry in the United Kingdom in October 2008), the Group was required to cooperate with HM Treasury to submit a forward plan to the
8
Business review continued |
European Commission. This plan was submitted and detailed discussions took place between HM Treasury, the Group and the European Commission. The plan submitted not only had regard to the First Placing and Open Offer, but also the issuance of B Shares to HM Treasury, the commitment by HM Treasury to subscribe for additional B Shares if certain conditions were met and the Group’s participation in the APS. As part of its review, the European Commission was required to assess the State Aid and to consider whether the Group’s long-term viability would be assured, that the Group makes a sufficient contribution to the costs of its restructuring and that measures are taken to limit any distortions of competition arising from the State Aid provided to the Group by the United Kingdom Government. The Group, together with HM Treasury, agreed in principle with the European Competition Commissioner the terms of the State Aid and the terms of a restructuring plan (the “State Aid restructuring plan”). On 14 December 2009, the European Commission formally approved the Group’s participation in the APS, the issuance of £25.5 billion of B Shares to HM Treasury, a contingent commitment by HM Treasury to subscribe for up to an additional £8 billion of B Shares and the State Aid restructuring plan. The prohibition on the making of discretionary dividend (including preference shares and B Shares) or coupon payments on existing hybrid capital instruments for a two-year period commencing no later than 30 April 2010 will prevent the company from paying dividends on its ordinary and preference shares and coupons on other Tier 1 securities for the same duration, and it may impair the Group’s ability to raise new Tier 1 capital through the issuance of ordinary shares and other Securities.
It is possible a third party could challenge the approval decision in the European Courts (within specified time limits). The Group does not believe that any such challenge would be likely to succeed but, if it were to succeed, the European Commission would need to reconsider its decision, which might result in an adverse outcome for the Group, including a prohibition or amendment to some or all of the terms of the State Aid. The European Commission could also impose conditions that are more disadvantageous, potentially materially so, to the Group than those in the State Aid restructuring plan.
The Group is subject to a variety of risks as a result of implementing the State Aid restructuring plan. There is no assurance that the price that the Group receives for any assets sold pursuant to the State Aid restructuring plan will be at a level the Group considers adequate or which it could obtain in circumstances in which the Group was not required to sell such assets in order to implement the State Aid restructuring plan or if such sale were not subject to the restrictions (including in relation to potential purchasers of the United Kingdom branch divestment) contained in the terms thereof. Further, should the Group fail to complete any of the required disposals within the agreed timeframes for such disposals, under the terms of the State Aid clearance, a divestiture trustee can be empowered to conduct the disposals, with the mandate to complete the disposal at no minimum price.
Furthermore, if the Group is unable to comply with the terms of the State Aid approval it could constitute a misuse of aid. In circumstances where the European Commission doubts that the Group is complying with the terms of the State Aid approval, it may open a formal investigation. At the conclusion of this investigation, if the European Commission decides that there has been misuse of aid, it can issue a decision requiring HM Treasury to recover the misused aid which could have a material adverse impact on the Group.
In implementing the State Aid restructuring plan, the Group will lose existing customers, deposits and other assets (both directly through the sale and potentially through the impact on the rest of the Group’s business arising from implementing the State Aid restructuring plan) and the potential for realising additional associated revenues and margins that it otherwise might have achieved in the absence of such disposals. Further, the loss of such revenues and related income may extend the time period over which the Group may pay any amounts owed to HM Treasury under the APS or otherwise. The implementation of the State Aid restructuring plan may also result in disruption to the retained business and give rise to significant strain on management, employee, operational and financial resources, impacting customers and giving rise to separation costs which could be substantial.
The implementation of the State Aid restructuring plan may result in the emergence of one or more new viable competitors or a material strengthening of one or more of the Group’s competitors in the Group’s markets. The effect of this on the Group’s future competitive position, revenues and margins is uncertain and there could be an adverse effect on the Group’s operations and financial condition and its business generally. If any or all of the risks described above, or any other currently unforeseen risks, materialise, there could be a materially negative impact on the Group’s business, operations, financial condition, capital position and competitive position.
The Group’s ability to implement its strategic plan depends on the success of the Group’s refocus on its core strengths and the balance sheet reduction programme arising out of its previously announced non-core restructuring plan and the State Aid restructuring plan.
In light of the changed global economic outlook, the Group has embarked on a financial and core business restructuring which is focused on achieving appropriate risk-adjusted returns under these changed circumstances, reducing reliance on wholesale funding and lowering exposure to capital intensive businesses. A key part of this restructuring is the programme announced in February 2009 to run-down and sell the Group’s non-core assets and the continued review of the Group’s portfolio to identify further disposals of certain non-core assets. Assets identified for this purpose and allocated to the Group's Non-Core division totalled £252 billion, excluding derivatives, as at 31 December 2008. At 31 December 2009, this total had reduced to £187 billion, excluding the Group's interest in RBS Sempra Commodities LLP (“RBS Sempra Commodities”), which was transferred to the Non-Core division during 2009. This balance sheet reduction programme will continue alongside the disposals under the State Aid restructuring plan approved by the European Commission.
Because the ability to dispose of assets and the price achieved for such disposals will be dependent on prevailing economic and market conditions, which may remain challenging, there is no assurance that the Group will be able to sell or run-down (as applicable) those businesses it is seeking to exit either on favourable economic terms to the Group or at all. Furthermore, where transactions are entered into for the purpose of selling non-core assets and businesses, they may be subject to conditions precedent, including government and regulatory approvals and completion mechanics that in certain cases may entail consent from customers. There is no assurance that such conditions precedent will be satisfied, or consents and approvals obtained, in a timely manner or at all. There is consequently a risk that the Group may fail to complete such disposals by any agreed longstop date.
Furthermore, in the context of implementing the State Aid restructuring plan, the Group is subject to certain timing and other restrictions which may result in the sale of assets at prices below those which the Group would have otherwise agreed had the Group not been required to sell such assets as part of the State Aid restructuring plan or if such sale were not subject to the restrictions contained in the terms of the State Aid conditions.
9
Business review continued |
In addition, the Group may be liable for any deterioration in businesses being sold between the announcement of the disposal and its completion. In certain cases, the period between the announcement of a transaction and its completion may be lengthy and may span many months. Other risks that may arise out of the disposal of the Group’s assets include ongoing liabilities up to completion of the relevant transaction in respect of the assets and businesses disposed of, commercial and other risks associated with meeting covenants to the buyer during the period up to completion, the risk of employee and customer attrition in the period up to completion, substantive indemnity obligations in favour of the buyer, the risk of liability for breach of warranty, the need to continue to provide transitional service arrangements for potentially lengthy periods following completion of the relevant transaction to the businesses being transferred and redundancy and other transaction costs. Further, the Group may be required to enter into covenants agreeing not to compete in certain markets for specific periods of time. In addition, as a result of the disposals, the Group will lose existing customers, deposits and other assets (both directly through the sale and potentially through the impact on the rest of the Group’s business arising from implementing the restructuring plans) and the potential for realising additional associated revenues and margins that it otherwise might have achieved in the absence of such disposals.
Any of the above factors, either in the context of State Aid-related or non-core or other asset disposals, could affect the Group's ability to implement its strategic plan and have a material adverse effect on the Group's business, results of operations, financial condition, capital ratios and liquidity and could result in a loss of value in the Securities.
The extensive organisational restructuring may adversely affect the Group’s business, results of operations and financial condition.
As part of its refocus on core strengths and its disposal programme, the Group has undertaken and continues to undertake extensive organisational restructuring involving the allocation of assets identified as non-core assets to a separate Non-Core Division, and the run-down and sale of those assets over a period of time. In addition, to comply with State Aid clearance, the Group agreed to undertake a series of measures to be implemented over a four-year period from December 2009, which include disposing of RBS Insurance (subject to potentially maintaining a minority interest until the end of 2014). the company will also divest by the end of 2013 Global Merchant Services, subject to the company retaining up to 20 per cent. of each business within Global Merchant Services if required by the purchaser, and its interest in RBS Sempra Commodities, as well as divesting the RBS branch-based business in England and Wales and the NatWest branches in Scotland, along with the direct small and medium-sized enterprise (“SME”) customers and certain mid-corporate customers across the United Kingdom. On 16 February 2010, the company announced that RBS Sempra Commodities had agreed to sell its Metals, Oil and European Energy business lines, subject to certain conditions including regulatory approvals. The Group and its joint venture partner, Sempra Energy, are continuing to consider ownership alternatives for the remaining North American Power and Gas businesses of RBS Sempra Commodities.
In order to implement the restructurings referred to above, various businesses and divisions within the Group will be re-organised, transferred or sold, or potentially merged with other businesses and divisions within the Group. As part of this process, personnel may be reallocated, where permissible, across the Group, new technology may be implemented, and new policies and procedures may be established in order to accommodate the new shape of the Group. As a result, the Group may experience a high degree of business interruption, significant restructuring charges, delays in implementation, and significant strain on management, employee, operational and financial resources. Any of the above factors could affect the Group’s ability to achieve its strategic objectives and have a material adverse effect on its business, results of operations and financial condition or could result in a loss of value in the Securities.
Lack of liquidity is a risk to the Group’s business and its ability to access sources of liquidity has been, and will continue to be, constrained.
Liquidity risk is the risk that a bank will be unable to meet its obligations, including funding commitments, as they fall due. This risk is inherent in banking operations and can be heightened by a number of enterprise specific factors, including an over-reliance on a particular source of funding (including, for example, short-term and overnight funding), changes in credit ratings or market-wide phenomena such as market dislocation and major disasters. During the course of 2008 and 2009, credit markets worldwide experienced a severe reduction in liquidity and term-funding. During this time, perception of counterparty risk between banks also increased significantly. This increase in perceived counterparty risk also led to reductions in inter-bank lending, and hence, in common with many other banking groups, the Group’s access to traditional sources of liquidity has been, and may continue to be, restricted.
The Group’s liquidity management focuses on maintaining a diverse and appropriate funding strategy for its assets, controlling the mismatch of maturities and carefully monitoring its undrawn commitments and contingent liabilities. However, the Group’s ability to access sources of liquidity (for example, through the issue or sale of financial and other instruments or through the use of term loans) during the recent period of liquidity stress has been constrained to the point where it, like other banks, has had to rely on shorter term and overnight funding with a consequent reduction in overall liquidity, and to increase its recourse to liquidity schemes provided by central banks. While during the course of 2009 money market conditions improved, with the Group seeing a material reduction of funding from central banks and the issuance of non-government guaranteed term debt, further tightening of credit markets could have a negative impact on the Group. The Group, in line with other financial institutions, may need to seek funds from alternative sources, potentially at higher costs of funding than has previously been the case.
In addition, there is also a risk that corporate and institutional counterparties with credit exposures may look to reduce all credit exposures to banks, given current risk aversion trends. It is possible that credit market dislocation becomes so severe that overnight funding from non-government sources ceases to be available.
Like many banking groups, the Group relies on customer deposits to meet a considerable portion of its funding. Furthermore, as part of its ongoing strategy to improve its liquidity position, the Group is actively seeking to increase the proportion of its funding represented by customer deposits. However, such deposits are subject to fluctuation due to certain factors outside the Group’s control, such as a loss of confidence, increasing competitive pressures or the encouraged or mandated repatriation of deposits by foreign wholesale or central bank depositors, which could result in a significant outflow of deposits within a short period of time. There is currently heavy competition among United Kingdom banks for retail customer deposits, which has increased the cost of procuring new deposits and impacted the Group’s ability to grow its deposit base. An inability to grow, or any material decrease in, the Group’s deposits could, particularly if accompanied by one of the other factors described above, have a negative impact on the Group’s ability to satisfy its liquidity needs unless corresponding actions were taken to improve the liquidity profile of other deposits or to reduce assets. In particular, the liquidity position of the Group may be negatively impacted if it is unable to achieve the run-off and sale of non-core and other assets as expected. Any significant delay in those plans may require the Group to consider disposal of other assets not previously identified for disposal to achieve its funded balance sheet target level.
The governments of some of the countries in which the Group operates have taken steps to guarantee the liabilities of the banks and branches operating in their respective jurisdiction. Whilst in some instances the operations of the Group are covered by government guarantees alongside
10
Business review continued |
other local banks, in other countries this may not necessarily always be the case. This may place the Group’s subsidiaries operating in those countries, such as Ulster Bank Ireland Ltd, which did not participate in such government guarantee schemes, at a competitive disadvantage to the other local banks and therefore may require the Group to provide additional funding and liquidity support to these operations.
There can be no assurance that these measures, alongside other available measures, will succeed in improving the funding and liquidity in the markets in which the Group operates, or that these measures, combined with any increased cost of any funding currently available in the market, will not lead to a further increase in the Group’s overall cost of funding, which could have an adverse impact on the Group’s financial condition and results of operations or result in a loss of value in the Securities.
Governmental support schemes may be subject to cancellation, change or withdrawal or may fail to be renewed, which may have a negative impact on the availability of funding in the markets in which the Group operates.
Governmental support schemes may be subject to cancellation, change or withdrawal (on a general or individual basis, subject to relevant contracts) or may fail to be renewed, based on changing economic and political conditions in the jurisdiction of the relevant scheme. To the extent government support schemes are cancelled, changed or withdrawn in a manner which diminishes their effectiveness, or to the extent such schemes fail to generate additional liquidity or other support in the relevant markets in which such schemes operate, the Group, in common with other banking groups, may continue to face limited access to, have insufficient access to, or incur higher costs associated with, funding alternatives, which could have a material adverse impact on the Group’s business, financial condition, results of operations and prospects or result in a loss of value in the Securities.
The financial performance of the Group has been and will be affected by borrower credit quality.
Risks arising from changes in credit quality and the recoverability of loans and amounts due from counterparties are inherent in a wide range of the Group’s businesses. Whilst some economies stabilised over the course of 2009, the Group may continue to see adverse changes in the credit quality of its borrowers and counterparties, for example, as a result of their inability to refinance their indebtedness, with increasing delinquencies, defaults and insolvencies across a range of sectors (such as the personal and banking and financial institution sectors) and in a number of geographies (such as the United Kingdom, the United States, the Middle East and the rest of Europe, particularly Ireland). This trend has led and may lead to further and accelerated impairment charges, higher costs, additional write-downs and losses for the Group or result in a loss of value in the Securities.
The actual or perceived failure or worsening credit of the Group’s counterparties has adversely affected and could continue to adversely affect the Group.
The Group’s ability to engage in routine funding transactions has been and will continue to be adversely affected by the actual or perceived failure or worsening credit of its counterparties, including other financial institutions and corporate borrowers. The Group has exposure to many different industries and counterparties and routinely executes transactions with counterparties in the financial industry, including brokers and dealers, commercial banks, investment banks, mutual and hedge funds and other institutional clients. As a result, defaults by, or even the perceived creditworthiness of or concerns about, one or more corporate borrowers, financial services institutions or the financial services industry generally, have led to market-wide liquidity problems, losses and defaults and could lead to further losses or defaults, by the Group or by other institutions. Many of these transactions expose the Group to credit risk in the event of default of the Group’s counterparty or client and the Group does have significant exposures to certain individual counterparties (including counterparties in certain weakened sectors and markets). In addition, the Group’s credit risk is exacerbated when the collateral it holds cannot be realised or is liquidated at prices not sufficient to recover the full amount of the loan or derivative exposure that is due to the Group, which is most likely to occur during periods of illiquidity and depressed asset valuations, such as those recently experienced. Any such losses could have a material adverse effect on the Group’s results of operations and financial condition or result in a loss of value in the Securities.
The Group’s earnings and financial condition have been, and its future earnings and financial condition may continue to be, affected by depressed asset valuations resulting from poor market conditions.
Financial markets continue to be subject to significant stress conditions, where steep falls in perceived or actual asset values have been accompanied by a severe reduction in market liquidity, as exemplified by recent events affecting asset-backed collateralised debt obligations, residential mortgage-backed securities and the leveraged loan market. In dislocated markets, hedging and other risk management strategies have proven not to be as effective as they are in normal market conditions due in part to the decreasing credit quality of hedge counterparties, including monoline and other insurance companies and credit derivative product companies. Severe market events have resulted in the Group recording large write-downs on its credit market exposures in 2007, 2008 and 2009. Any deterioration in economic and financial market conditions could lead to further impairment charges and write-downs. Moreover, market volatility and illiquidity (and the assumptions, judgements and estimates in relation to such matters that may change over time and may ultimately not turn out to be accurate) make it difficult to value certain of the Group’s exposures. Valuations in future periods, reflecting, among other things, then-prevailing market conditions and changes in the credit ratings of certain of the Group’s assets, may result in significant changes in the fair values of the Group’s exposures, even in respect of exposures, such as credit market exposures, for which the Group has previously recorded write-downs. In addition, the value ultimately realised by the Group may be materially different from the current or estimated fair value. Any of these factors could require the Group to recognise further significant write-downs or realise increased impairment charges, any of which may adversely affect its capital position, its financial condition and its results of operations or result in a loss of value in the Securities.
Further information about the write-downs which the Group has incurred and the assets it has reclassified can be found in the Risk, capital and liquidity management section of the Business review.
The value or effectiveness of any credit protection that the Group has purchased from monoline and other insurers and other market counterparties (including credit derivative product companies) depends on the value of the underlying assets and the financial condition of the insurers and such counterparties.
The Group has credit exposure arising from over-the-counter derivative contracts, mainly credit default swaps (“CDSs”), which are carried at fair value. The fair value of these CDSs, as well as the Group’s exposure to the risk of default by the underlying counterparties, depends on the valuation and the perceived credit risk of the instrument against which protection has been bought. Since 2007, monoline and other insurers and other market counterparties (including credit derivative product companies) have been adversely affected by their exposure to residential mortgage linked and corporate credit products, whether synthetic or otherwise, and their actual and perceived creditworthiness has deteriorated
11
Business review continued |
rapidly, which may continue. If the financial condition of these counterparties or their actual or perceived creditworthiness deteriorates further, the Group may record further credit valuation adjustments on the credit protection bought from these counterparties under the CDSs in addition to those already recorded and such adjustments may have a material adverse impact on the Group’s financial condition and results of operations.
Changes in interest rates, foreign exchange rates, credit spreads, bond, equity and commodity prices and other market factors have significantly affected and will continue to affect the Group’s business.
Some of the most significant market risks the Group faces are interest rate, foreign exchange, credit spread, bond, equity and commodity price risks. Changes in interest rate levels, yield curves and spreads may affect the interest rate margin realised between lending and borrowing costs, the effect of which may be heightened during periods of liquidity stress, such as those experienced in the past year. Changes in currency rates, particularly in the sterling-US dollar and sterling-euro exchange rates, affect the value of assets, liabilities, income and expenses denominated in foreign currencies and the reported earnings of the company’s non-United Kingdom subsidiaries (principally Citizens Financial Group, Inc. (“Citizens”) and RBS Securities Inc.) and may affect income from foreign exchange dealing. The performance of financial markets may affect bond, equity and commodity prices and, therefore, cause changes in the value of the Group’s investment and trading portfolios. This has been the case during the period since August 2007, with market disruptions and volatility resulting in significant reductions in the value of such portfolios. While the Group has implemented risk management methods to mitigate and control these and other market risks to which it is exposed, it is difficult, particularly in the current environment, to predict with accuracy changes in economic or market conditions and to anticipate the effects that such changes could have on the Group’s financial performance and business operations.
The Group’s borrowing costs and its access to the debt capital markets depend significantly on its and the United Kingdom Government’s credit ratings.
The company and other Group members have been subject to a number of downgrades in the recent past. Any future reductions in the long-term or short-term credit ratings of the company or one of its principal subsidiaries (particularly RBS) would further increase its borrowing costs, require the Group to replace funding lost due to the downgrade, which may include the loss of customer deposits, and may also limit the Group’s access to capital and money markets and trigger additional collateral requirements in derivatives contracts and other secured funding arrangements. Furthermore, given the extent of the United Kingdom Government ownership and support provided to the Group through HM Treasury’s guarantee scheme (announced by the United Kingdom Government on 8 October 2008) (the “Credit Guarantee Scheme”), any downgrade in the United Kingdom Government’s credit ratings could adversely affect the Group’s own credit ratings and may have the effects noted above. All credit rating agencies have reaffirmed the United Kingdom Government’s AAA rating, although S&P changed its outlook to “negative” on 21 May 2009. Fitch reaffirmed the United Kingdom Government’s stable outlook on 31 July 2009 and Moody’s reiterated the United Kingdom Government’s stable outlook on 26 October 2009. Credit ratings of the company, RBS, ABN AMRO Holding N.V. (which was renamed “RBS Holdings N.V.” on 1 April 2010) (“ABN AMRO”), The Royal Bank of Scotland N.V. (which was renamed from “ABN AMRO Bank N.V.” on 6 February 2010), Ulster Bank and Citizens are also important to the Group when competing in certain markets, such as over-the-counter derivatives. As a result, any further reductions in the company’s long-term or short-term credit ratings or those of its principal subsidiaries could adversely affect the Group’s access to liquidity and competitive position, increase its funding costs and have a negative impact on the Group’s earnings and financial condition or result in a loss of value in the Securities.
The Group’s business performance could be adversely affected if its capital is not managed effectively or if there are changes to capital adequacy and liquidity requirements.
Effective management of the Group’s capital is critical to its ability to operate its businesses, to grow organically and to pursue its strategy of returning to standalone strength. The Group is required by regulators in the United Kingdom, the United States and in other jurisdictions in which it undertakes regulated activities, to maintain adequate capital resources. The maintenance of adequate capital is also necessary for the Group’s financial flexibility in the face of continuing turbulence and uncertainty in the global economy. Accordingly, the purpose of the issuance of the £25.5 billion of B Shares, the grant of the Contingent Subscription (as defined below) and the previous placing and open offers was to allow the Group to strengthen its capital position. The FSA’s recent liquidity policy statement articulates that firms must hold sufficient eligible securities to survive a liquidity stress and this will result in banks holding a greater amount of government securities, to ensure that these institutions have adequate liquidity in times of financial stress.
In addition, on 17 December 2009, the Basel Committee on Banking Supervision (the “Basel Committee”) proposed a number of fundamental reforms to the regulatory capital framework in its consultative document entitled "Strengthening the resilience of the banking sector". If the proposals made by the Basel Committee are implemented, these could result in the Group being subject to significantly higher capital requirements. The proposals include: (a) the build-up of a counter-cyclical capital buffer in excess of the regulatory minimum capital requirement, which is large enough to enable the Group to remain above the minimum capital requirement in the face of losses expected to be incurred in a feasibly severe downturn; (b) an increase in the capital requirements for counterparty risk exposures arising from derivatives, repo-style transactions and securities financing transactions; (c) the imposition of a leverage ratio as a supplementary measure to the existing Basel II risk-based measure; (d) the phasing out of hybrid capital instruments as Tier 1 capital and the requirement that the predominant form of Tier 1 capital must be common shares and retained earnings; and (e) the imposition of global minimum liquidity standards that include a requirement to hold a stock of unencumbered high quality liquid assets sufficient to cover cumulative net cash outflows over a 30-day period under a prescribed stress scenario. The proposed reforms are subject to a consultative process and an impact assessment and are not likely to be implemented before the end of 2012. The Basel Committee will also consider appropriate transition and grandfathering arrangements.
These and other future changes to capital adequacy and liquidity requirements in the jurisdictions in which it operates may require the Group to raise additional Tier 1, Core Tier 1 and Tier 2 capital by way of further issuances of securities, including in the form of Ordinary Shares or B Shares and could result in existing Tier 1 and Tier 2 securities issued by the Group ceasing to count towards the Group’s regulatory capital, either at the same level as present or at all. The requirement to raise additional Core Tier 1 capital could have a number of negative consequences for the company and its shareholders, including impairing the company’s ability to pay dividends on or make other distributions in respect of Ordinary Shares and diluting the ownership of existing shareholders of the company. If the Group is unable to raise the requisite Tier 1 and Tier 2 capital, it may be required to further reduce the amount of its risk-weighted assets and engage in the disposition of core and other non-core businesses, which may not occur on a timely basis or achieve prices which would otherwise be attractive to the Group. In addition, pursuant to the State Aid approval, should the Group’s Core Tier 1 capital ratio decline to below 5 per cent. at any time before 31 December 2014, or should the Group fall short of its funded balance sheet target level (after adjustments) for 31 December 2013 by £30 billion or more, the Group will be required to reduce its risk-weighted assets by a further £60 billion in excess of its plan through further disposals of identifiable businesses and their
12
Business review continued |
associated assets. As provided in the Acquisition and Contingent Capital Agreement (as defined below), the Group would also be subject to restrictions on payments on its hybrid capital instruments should its Core Tier 1 ratio fall below 6 per cent. or if it would fall below 6 per cent. as a result of such payment.
As at 31 December 2009, the Group’s Tier 1 and Core Tier 1 capital ratios were 14.1 per cent. and 11.0 per cent., respectively, calculated in accordance with FSA definitions (see page 69). Any change that limits the Group’s ability to manage effectively its balance sheet and capital resources going forward (including, for example, reductions in profits and retained earnings as a result of write-downs or otherwise, increases in risk-weighted assets, delays in the disposal of certain assets or the inability to syndicate loans as a result of market conditions, a growth in unfunded pension exposures or otherwise) or to access funding sources, could have a material adverse impact on its financial condition and regulatory capital position or result in a loss of value in the Securities.
The value of certain financial instruments recorded at fair value is determined using financial models incorporating assumptions, judgements and estimates that may change over time or may ultimately not turn out to be accurate.
Under IFRS, the Group recognises at fair value: (i) financial instruments classified as “held-for-trading” or “designated as at fair value through profit or loss”; (ii) financial assets classified as “available-for-sale”; and (iii) derivatives. Generally, to establish the fair value of these instruments, the Group relies on quoted market prices or, where the market for a financial instrument is not sufficiently active, internal valuation models that utilise observable market data. In certain circumstances, the data for individual financial instruments or classes of financial instruments utilised by such valuation models may not be available or may become unavailable due to changes in market conditions, as has been the case during the recent financial crisis. In such circumstances, the Group’s internal valuation models require the Group to make assumptions, judgements and estimates to establish fair value. In common with other financial institutions, these internal valuation models are complex, and the assumptions, judgements and estimates the Group is required to make often relate to matters that are inherently uncertain, such as expected cash flows, the ability of borrowers to service debt, residential and commercial property price appreciation and depreciation, and relative levels of defaults and deficiencies. Such assumptions, judgements and estimates may need to be updated to reflect changing facts, trends and market conditions. The resulting change in the fair values of the financial instruments has had and could continue to have a material adverse effect on the Group’s earnings and financial condition. Also, recent market volatility and illiquidity have challenged the factual bases of certain underlying assumptions and have made it difficult to value certain of the Group’s financial instruments. Valuations in future periods, reflecting prevailing market conditions, may result in further significant changes in the fair values of these instruments, which could have a negative effect on the Group’s results of operations and financial condition or result in a loss of value in the Securities.
The Group operates in markets that are highly competitive and consolidating. If the Group is unable to perform effectively, its business and results of operations will be adversely affected.
Recent consolidation among banking institutions in the United Kingdom, the United States and throughout Europe is changing the competitive landscape for banks and other financial institutions. If financial markets continue to be volatile, more banks may be forced to consolidate. This consolidation, in combination with the introduction of new entrants into the United States and United Kingdom markets from other European and Asian countries, could increase competitive pressures on the Group. In addition, certain competitors may have access to lower cost funding and/or be able to offer retail deposits on more favourable terms than the Group and may have stronger multi-channel and more efficient operations as a result of greater historical investments. Furthermore, the Group’s competitors may be better able to attract and retain clients and talent, which may have a negative impact on the Group’s relative performance and future prospects.
Furthermore, increased government ownership of, and involvement in, banks generally may have an impact on the competitive landscape in the major markets in which the Group operates. Although, at present, it is difficult to predict what the effects of this increased government ownership and involvement will be or how they will differ from jurisdiction to jurisdiction, such involvement may cause the Group to experience stronger competition for corporate, institutional and retail clients and greater pressure on profit margins. Future disposals and restructurings by the Group and the compensation structure and restrictions imposed on the Group may also have an impact on its ability to compete effectively. Since the markets in which the Group operates are expected to remain highly competitive in all areas, these and other changes to the competitive landscape could adversely affect the Group’s business, margins, profitability and financial condition or result in a loss of value in the Securities.
As a condition to HM Treasury support, the company has agreed to certain undertakings which may serve to limit the RBS Group’s operations.
Under the terms of the First Placing and Open Offer, the company provided certain undertakings aimed at ensuring that the subscription by HM Treasury of the relevant ordinary shares and preference shares and the RBS Group’s participation in the Credit Guarantee Scheme offered by HM Treasury as part of its support for the United Kingdom banking industry are compatible with the common market under EU law. These undertakings include (i) supporting certain initiatives in relation to mortgage lending and lending to SMEs until 2011, (ii) regulating management remuneration and (iii) regulating the rate of growth of the RBS Group’s balance sheet. Under the terms of the placing and open offer undertaken by the company in April 2009, the RBS Group’s undertakings in relation to mortgage lending and lending to SMEs were extended to larger commercial and industrial companies in the United Kingdom. Pursuant to these arrangements, the company agreed to make available to creditworthy borrowers on commercial terms, £16 billion above the amount the company had budgeted to lend to United Kingdom businesses and £9 billion above the amount the company had budgeted to lend to United Kingdom homeowners in the year commencing 1 March 2009.
In relation to the 2009 commitment period, which ended on 28 February 2010, the RBS Group’s net mortgage lending to UK homeowners was £12.7 billion above the amount it had originally budgeted to lend. In relation to its business lending commitment, the RBS Group achieved £60 billion of gross new lending to businesses, including £39 billion to SMEs but, in the economic environment prevailing at the time, many customers were strongly focused on reducing their borrowings and repayments consequently increased. Moreover, the withdrawal of foreign lenders was less pronounced than anticipated, there was a sharp increase in capital market issuance and demand continued to be weak. As a result, the RBS Group’s net lending did not reach the £16 billion targeted.
In March 2010, the company agreed with the United Kingdom government certain adjustments to the lending commitments for the 2010 commitment period (the 12 month period commencing 1 March 2010), to reflect expected economic circumstances over the period. As part of the amended lending commitments, the company has committed, among other things, to make available gross new facilities, drawn or undrawn, of £50 billion to UK businesses in the period 1 March 2010 to 28 February 2011. In addition, the company has agreed with the United Kingdom government to make available £8 billion of net mortgage lending in the 2010 commitment period. This is a decrease of £1 billion on the net
13
Business review continued |
mortgage lending target that previously applied to the 2010 commitment period which ends on 28 February 2011, to reflect that the mortgage lending commitment for the 2009 commitment period was increased from £9 billion to £10 billion.
The RBS Group has also agreed to certain other commitments, which are material for the structure of the RBS Group and its operations, under the State Aid restructuring plan approved by the European Commission in relation to State Aid.
In addition, the RBS Group, together with HM Treasury, has agreed with the European Commission a prohibition on the making of discretionary dividends (including on preference shares and B Shares) or coupon payments on existing hybrid capital instruments for a two-year period from a date commencing no later than 30 April 2010 (which the RBS Group has subsequently announced shall be 30 April 2010). It is possible that the RBS Group may, in future, be subject to further restrictions on payments on such hybrid capital instruments, whether as a result of undertakings given to regulatory bodies, changes to capital requirements such as the proposals published by the Basel Committee on 17 December 2009 or otherwise. The RBS Group has also agreed to certain other undertakings in the Acquisition and Contingent Capital Agreement.
The undertakings described above may serve to limit the RBS Group’s operations. See “HM Treasury (or UKFI on its behalf) may be able to exercise a significant degree of influence over the Group.”
The Group could fail to attract or retain senior management, which may include members of the Board, or other key employees, and it may suffer if it does not maintain good employee relations.
The Group’s ability to implement its strategy depends on the ability and experience of its senior management, which may include directors, and other key employees. The loss of the services of certain key employees, particularly to competitors, could have a negative impact on the Group’s business. The Group’s future success will also depend on its ability to attract, retain and remunerate highly skilled and qualified personnel competitively with its peers. This cannot be guaranteed, particularly in light of heightened regulatory oversight of banks and heightened scrutiny of, and (in some cases) restrictions placed upon, management compensation arrangements, in particular those in receipt of Government funding (such as the company). The Group has made a commitment to comply with the FSA Remuneration Code. These rules came into force on 1 January 2010 and are in line with the agreement reached by the G-20, setting global standards for the implementation of the Financial Stability Board’s remuneration principles. The Group agreed that it will be at the leading edge of implementing the G-20 principles and granted UK Financial Investments Limited (“UKFI”) consent rights over the shape and size of its aggregate bonus pool for the 2009 performance year. The level of the 2009 bonus pool and the deferral and claw-back provisions implemented by the Group may impair the ability of the Group to attract and retain suitably qualified personnel in various parts of the Group’s businesses.
The Group is also altering certain of the pension benefits it offers to staff. Some employees continue to participate in defined benefit arrangements. The following two changes have been made to the main defined benefit pension plans: (i) a yearly limit on the amount of any salary increase that will count for pension purposes; and (ii) a reduction in the severance lump sum for those who take an immediate undiscounted pension for redundancy. In addition to the effects of such measures on the Group’s ability to retain senior management and other key employees, the marketplace for skilled personnel is becoming more competitive, which means the cost of hiring, training and retaining skilled personnel may continue to increase. The failure to attract or retain a sufficient number of appropriately skilled personnel could place the Group at a significant competitive disadvantage and prevent the Group from successfully implementing its strategy, which could have a material adverse effect on the Group’s financial condition and results of operations or result in a loss of value in the Securities.
In addition, certain of the Group’s employees in the United Kingdom, continental Europe and other jurisdictions in which the Group operates are represented by employee representative bodies, including trade unions. Engagement with its employees and such bodies is important to the Group and a breakdown of these relationships could adversely affect the Group’s business, reputation and results. As the Group implements cost-saving initiatives and disposes of, or runs-down, certain assets or businesses (including as part of its expected restructuring plans), it faces increased risk in this regard and there can be no assurance that the Group will be able to maintain good relations with its employees or employee representative bodies in respect of all matters. As a result, the Group may experience strikes or other industrial action from time to time, which could have a material adverse effect on its business and results of operations and could cause damage to its reputation.
Each of the Group’s businesses is subject to substantial regulation and oversight. Any significant regulatory developments could have an effect on how the Group conducts its business and on its results of operations and financial condition.
The Group is subject to financial services laws, regulations, corporate governance requirements, administrative actions and policies in each location in which it operates. All of these are subject to change, particularly in the current market environment, where there have been unprecedented levels of government intervention and changes to the regulations governing financial institutions, including recent nationalisations in the United States, the United Kingdom and other European countries. As a result of these and other ongoing and possible future changes in the financial services regulatory landscape (including requirements imposed by virtue of the Group’s participation in government or regulator-led initiatives), the Group expects to face greater regulation in the United Kingdom, the United States and other countries in which it operates, including throughout the rest of Europe. Compliance with such regulations may increase the Group’s capital requirements and costs and have an adverse impact on how the Group conducts its business, on the products and services it offers, on the value of its assets and on its results of operations and financial condition or result in a loss of value in the Securities.
Other areas where governmental policies and regulatory changes could have an adverse impact include, but are not limited to:
| · | the monetary, interest rate, capital adequacy, liquidity, balance sheet leverage and other policies of central banks and regulatory authorities; |
| · | general changes in government or regulatory policy or changes in regulatory regimes that may significantly influence investor decisions in particular markets in which the Group operates, increase the costs of doing business in those markets or result in a reduction in the credit ratings of the company or one of its subsidiaries; |
| · | changes to financial reporting standards; |
| · | changes in regulatory requirements relating to capital and liquidity, such as limitations on the use of deferred tax assets in calculating Core Tier 1 and/or Tier 1 capital, or prudential rules relating to the capital adequacy framework; |
14
Business review continued |
| · | other general changes in the regulatory requirements, such as the imposition of onerous compliance obligations, restrictions on business growth or pricing, new levies or fees, requirements in relation to the structure and organisation of the Group and requirements to operate in a way that prioritises objectives other than shareholder value creation; |
| · | changes in competition and pricing environments; |
| · | further developments in financial reporting, corporate governance, corporate structure, conduct of business and employee compensation; |
| · | differentiation among financial institutions by governments with respect to the extension of guarantees to bank customer deposits and the terms attaching to such guarantees, including requirements for the entire Group to accept exposure to the risk of any individual member of the Group, or even third party participants in guarantee schemes, failing; |
| · | implementation of, or costs related to, local customer or depositor compensation or reimbursement schemes; |
| · | transferability and convertibility of currency risk; |
| · | expropriation, nationalisation and confiscation of assets; |
| · | changes in legislation relating to foreign ownership; and |
| · | other unfavourable political, military or diplomatic developments producing social instability or legal uncertainty which, in turn, may affect demand for the Group’s products and services. |
The Group’s results have been and could be further adversely affected in the event of goodwill impairment.
The Group capitalises goodwill, which is calculated as the excess of the cost of an acquisition over the net fair value of the identifiable assets, liabilities and contingent liabilities acquired. Acquired goodwill is recognised initially at cost and subsequently at cost less any accumulated impairment losses. As required by IFRS, the Group tests goodwill for impairment annually or more frequently, at external reporting dates, when events or circumstances indicate that it might be impaired. An impairment test involves comparing the recoverable amount (the higher of value in use and fair value less cost to sell) of an individual cash generating unit with its carrying value. The value in use and fair value of the Group’s cash generating units are affected by market conditions and the performance of the economies in which the Group operates. Where the Group is required to recognise a goodwill impairment, it is recorded in the Group’s income statement, although it has no effect on the Group’s regulatory capital position. For the year ended 31 December 2009, the Group recorded a £363 million accounting write down of goodwill and other intangibles relating to prior year acquisitions (see page 257).
The Group may be required to make further contributions to its pension schemes if the value of pension fund assets is not sufficient to cover potential obligations.
The Group maintains a number of defined benefit pension schemes for past and a number of current employees. Pensions risk is the risk that the liabilities of the Group’s various defined benefit pension schemes which are long term in nature will exceed the schemes’ assets, as a result of which the Group is required or chooses to make additional contributions to the schemes. The schemes’ assets comprise investment portfolios that are held to meet projected liabilities to the scheme members. Risk arises from the schemes because the value of these asset portfolios and returns from them may be less than expected and because there may be greater than expected increases in the estimated value of the schemes’ liabilities. In these circumstances, the Group could be obliged, or may choose, to make additional contributions to the schemes, and during recent periods, the Group has voluntarily made such contributions. Given the current economic and financial market difficulties and the prospect that they may continue over the near and medium term, the Group may experience increasing pension deficits or be required or elect to make further contributions to its pension schemes and such deficits and contributions could be significant and have a negative impact on the Group’s capital position, results of operations or financial condition or result in a loss of value in the Securities. The next funding valuation of the Group’s major defined benefit pension plan, The Royal Bank of Scotland Group Pension Fund, will take place with an effective date of 31 March 2010.
The Group is and may be subject to litigation and regulatory investigations that may impact its business.
The Group’s operations are diverse and complex, and it operates in legal and regulatory environments that expose it to potentially significant litigation, regulatory investigation and other regulatory risk. As a result, the Group is, and may in the future be, involved in various disputes, legal proceedings and regulatory investigations in the United Kingdom, the EU, the United States and other jurisdictions, including class action litigation, anti-money laundering investigations and review by the European Commission under State Aid rules. Furthermore, the Group, like many other financial institutions, has come under greater regulatory scrutiny over the last year and expects that environment to continue for the foreseeable future, particularly as it relates to compliance with new and existing corporate governance, employee compensation, conduct of business, anti-money laundering and anti-terrorism laws and regulations, as well as the provisions of applicable sanctions programmes. Disputes, legal proceedings and regulatory investigations are subject to many uncertainties, and their outcomes are often difficult to predict, particularly in the earlier stages of a case or investigation. Adverse regulatory action or adverse judgments in litigation could result in restrictions or limitations on the Group’s operations or result in a material adverse effect on the Group’s reputation or results of operations or result in a loss of value in the Securities. For details about certain litigation and regulatory investigations in which the Group is involved, see Note 32 on the Financial statements.
Operational risks are inherent in the Group’s operations.
The Group’s operations are dependent on the ability to process a very large number of transactions efficiently and accurately while complying with applicable laws and regulations where it does business. The Group has complex and geographically diverse operations and operational risk and losses can result from internal and external fraud, errors by employees or third parties, failure to document transactions properly or to obtain proper authorisation, failure to comply with applicable regulatory requirements and conduct of business rules (including those arising out of anti-money laundering and anti-terrorism legislation, as well as the provisions of applicable sanctions programmes), equipment failures, natural disasters or the inadequacy or failure of systems and controls, including those of the Group’s suppliers or counterparties. Although the Group has
15
Business review continued |
implemented risk controls and loss mitigation actions, and substantial resources are devoted to developing efficient procedures, to identify and rectify weaknesses in existing procedures and to train staff, it is not possible to be certain that such actions have been or will be effective in controlling each of the operational risks faced by the Group. Any weakness in these systems or controls, or any breaches or alleged breaches of applicable laws or regulations, could have a materially negative impact on the Group’s business, reputation and results of operations and the price of any Securities. Notwithstanding anything contained in this risk factor, it should not be taken as implying that the company will be unable to comply with its obligations as a company with securities admitted to the Official List of the United Kingdom Listing Authority (the “Official List”) nor that it, or its relevant subsidiaries, will be unable to comply with its or their obligations as supervised firms regulated by the FSA.
The Group is exposed to the risk of changes in tax legislation and its interpretation and to increases in the rate of corporate and other taxes in the jurisdictions in which it operates.
The Group’s activities are subject to tax at various rates around the world computed in accordance with local legislation and practice. Action by governments to increase tax rates or to impose additional taxes or to restrict the tax reliefs currently available to the Group would reduce the Group’s profitability. Revisions to tax legislation or to its interpretation might also affect the Group’s results in the future.
HM Treasury (or UKFI on its behalf) may be able to exercise a significant degree of influence over the Group.
UKFI manages HM Treasury’s shareholder relationship with the company. Although HM Treasury has indicated that it intends to respect the commercial decisions of the Group and that the Group will continue to have its own independent board of directors and management team determining its own strategy, should its current intentions change, HM Treasury's position as a majority shareholder (and UKFI’s position as manager of this shareholding) means that HM Treasury or UKFI may be able to exercise a significant degree of influence over, among other things, the election of directors and the appointment of senior management. In addition, as the provider of the APS, HM Treasury has a range of rights that other shareholders do not have. These include rights under the terms of the APS over the Group's remuneration policy and practice. The manner in which HM Treasury or UKFI exercises HM Treasury’s rights as majority shareholder or in which HM Treasury exercises its rights under the APS could give rise to conflict between the interests of HM Treasury and the interests of other shareholders. The Board has a duty to promote the success of the company for the benefit of its members as a whole.
The Group’s insurance businesses are subject to inherent risks involving claims.
Future claims in the Group’s general and life assurance business may be higher than expected as a result of changing trends in claims experience resulting from catastrophic weather conditions, demographic developments, changes in the nature and seriousness of claims made, changes in mortality, changes in the legal and compensatory landscape and other causes outside the Group’s control. These trends could affect the profitability of current and future insurance products and services. The Group reinsures some of the risks it has assumed and is accordingly exposed to the risk of loss should its reinsurers become unable or unwilling to pay claims made by the Group against them.
The Group’s operations have inherent reputational risk.
Reputational risk, meaning the risk to earnings and capital from negative public opinion, is inherent in the Group’s business. Negative public opinion can result from the actual or perceived manner in which the Group conducts its business activities, from the Group’s financial performance, from the level of direct and indirect government support or from actual or perceived practices in the banking and financial industry. Negative public opinion may adversely affect the Group’s ability to keep and attract customers and, in particular, corporate and retail depositors. The Group cannot ensure that it will be successful in avoiding damage to its business from reputational risk.
In the United Kingdom and in other jurisdictions, the Group is responsible for contributing to compensation schemes in respect of banks and other authorised financial services firms that are unable to meet their obligations to customers.
In the United Kingdom, the Financial Services Compensation Scheme (the “Compensation Scheme”) was established under the FSMA and is the United Kingdom’s statutory fund of last resort for customers of authorised financial services firms. The Compensation Scheme can pay compensation to customers if a firm is unable, or likely to be unable, to pay claims against it and may be required to make payments either in connection with the exercise of a stabilisation power or in exercise of the bank insolvency procedures under the Banking Act. The Compensation Scheme is funded by levies on firms authorised by the FSA, including the Group. In the event that the Compensation Scheme raises funds from the authorised firms, raises those funds more frequently or significantly increases the levies to be paid by such firms, the associated costs to the Group may have a material impact on its results of operations and financial condition. During the financial year ended 31 December 2009, the Group has accrued £135 million for its share of Compensation Scheme management expenses levies for the 2009/10 and 2010/2011 Compensation Scheme years.
In addition, to the extent that other jurisdictions where the Group operates have introduced or plan to introduce similar compensation, contributory or reimbursement schemes (such as in the United States with the Federal Deposit Insurance Corporation), the Group may make further provisions and may incur additional costs and liabilities, which may negatively impact its financial condition and results of operations or result in a loss of value in the Securities.
The Group’s business and earnings may be affected by geopolitical conditions.
The performance of the Group is significantly influenced by the geopolitical and economic conditions prevailing at any given time in the countries in which it operates, particularly the United Kingdom, the United States and other countries in Europe and Asia. For example, the Group has a presence in countries where businesses could be exposed to the risk of business interruption and economic slowdown following the outbreak of a pandemic, or the risk of sovereign default following the assumption by governments of the obligations of private sector institutions. Similarly, the Group faces the heightened risk of trade barriers, exchange controls and other measures taken by sovereign governments which may impact a borrower’s ability to repay. Terrorist acts and threats and the response to them of governments in any of these countries could also adversely affect levels of economic activity and have an adverse effect upon the Group’s business.
The restructuring proposals for ABN AMRO are complex and may not realise the anticipated benefits for the Group.
The restructuring plan in place for the integration and separation of ABN AMRO (called The Royal Bank of Scotland N.V. with effect from 6 February 2010) into and among the businesses and operations of the Consortium Members (as defined below) is complex, involving substantial reorganisation of ABN AMRO’s operations and legal structure. The restructuring plan is being implemented and significant elements have been completed within the planned timescales and the integration of the Group’s businesses continues. As part of this reorganisation, on 6 February 2010, the majority of the businesses of ABN AMRO acquired by the Dutch State were legally demerged from the ABN AMRO businesses acquired
16
Business review continued |
by the Group and were transferred into a newly established company, ABN AMRO Bank N.V. (formerly named ABN AMRO II N.V.). This company was transferred to ABN AMRO Group N.V., a company wholly owned by the Dutch State, on 1 April 2010. Certain assets and liabilities of ABN AMRO acquired by the Dutch State were not part of the transfer which occurred on 1 April 2010 and remain within ABN AMRO (now The Royal Bank of Scotland N.V.). These will be transferred to the Dutch State as soon as possible. In addition, certain assets within ABN AMRO (The Royal Bank of Scotland N.V.) continue to be under shared ownership by the Consortium Members.
The Group may not realise the benefits of the acquisition or the restructuring when expected or to the extent projected. The occurrence of any of these events, including as a result of staff losses or performance issues, or as a result of further disposals or restructurings by the Group, may have a negative impact on the Group’s financial condition and results of operations.
The recoverability and regulatory capital treatment of certain deferred tax assets recognised by the Group depends on the Group's ability to generate sufficient future taxable profits and there being no adverse changes to tax legislation, regulatory requirements or accounting standards.
In accordance with IFRS, the Group has recognised deferred tax assets on losses available to relieve future profits from tax only to the extent that it is probable that they will be recovered. The deferred tax assets are quantified on the basis of current tax legislation and accounting standards and are subject to change in respect of the future rates of tax or the rules for computing taxable profits and allowable losses. Failure to generate sufficient future taxable profits or changes in tax legislation or accounting standards may reduce the recoverable amount of the recognised deferred tax assets.
There is currently no restriction in respect of deferred tax assets recognised by the Group for regulatory purposes. Changes in regulatory rules may restrict the amount of deferred tax assets that can be recognised and such changes could lead to a reduction in the Group’s Core Tier 1 capital ratio. In particular, on 17 December 2009, the Basel Committee published a consultative document setting out certain proposed changes to capital requirements (see risk factor above headed “The Group’s business performance could be adversely affected if its capital is not managed effectively or if there are changes to capital adequacy and liquidity requirements”). Those proposals included a requirement that deferred tax assets which rely on future profitability of the Group to be realised should be deducted from the common equity component of Tier 1 and therefore not count towards Tier 1 capital.
RBS has entered into a credit derivative and a financial guarantee contract with The Royal Bank of Scotland N.V. which may adversely affect the Issuer Group’s results
RBS has also entered into a credit derivative and a financial guarantee contract with The Royal Bank of Scotland N.V., which is a subsidiary undertaking of RBSG, under which it has sold credit protection over the exposures held by The Royal Bank of Scotland N.V. and its subsidiaries that are subject to the APS. These agreements may adversely affect the Issuer Group's results as: (a) they cover 100% of losses on these assets whilst the APS provides 90% protection if losses on the whole APS portfolio exceed the first loss; and (b) the basis of valuation of the APS and the financial guarantee contract are asymmetrical: the one measured at fair value and the other at the higher of cost less amortisation and the amount determined in accordance with IAS 37 “Provisions, Contingent Liabilities and Contingent Assets”.
Risks relating to the Group’s participation in the Asset Protection Scheme, the B Shares, the Contingent B Shares and the Dividend Access Share
Owing to the complexity, scale and unique nature of the APS and the uncertainty surrounding the duration and severity of the recent economic recession, there may be unforeseen issues and risks that are relevant in the context of the Group’s participation in the APS and in the impact of the APS on the Group’s business, operations and financial condition. In addition, the assets or exposures to be covered by the APS may not be those with the greatest future losses or with the greatest need for protection.
Since the APS is a unique form of credit protection over a complex range of diversified assets and exposures (the “Covered Assets”) in a number of jurisdictions and there is significant uncertainty about the duration and severity of the recent economic recession, there may be unforeseen issues and risks that may arise as a result of the Group’s participation in the APS and the impact of the APS on the Group’s business, operations and financial condition cannot be predicted with certainty. Such issues or risks may have a material adverse effect on the Group. Moreover, the Group’s choice of assets or exposures to be covered by the APS was based on predictions at the time of its accession to the APS regarding the performance of counterparties and assumptions about market dynamics and asset and liability pricing, all or some of which may prove to be inaccurate. There is, therefore, a risk that the Covered Assets will not be those with the greatest future losses or with the greatest need for protection and, as a result, the Group’s financial condition, income from operations and the value of any Securities may still suffer due to further impairments and credit write-downs.
There is no assurance that the Group’s participation in the APS and the issue of £25.5 billion of B Shares and, if required, the £8 billion Contingent B Shares will achieve the Group’s goals of improving and maintaining the Group’s capital ratios in the event of further losses. Accordingly, the Group’s participation in the APS and the issue of £25.5 billion of B Shares and, if required, the £8 billion Contingent B Shares may not improve market confidence in the Group and the Group may still face the risk of full nationalisation or other resolution procedures under the Banking Act.
The Group’s participation in the APS, together with the issue of £25.5 billion of B Shares in December 2009 and, if required, the £8 billion Contingent B Shares (as defined below), has improved its consolidated capital ratios. In the event that the Group’s Core Tier 1 capital ratio declines to below 5 per cent., and if certain conditions are met, HM Treasury is committed to subscribe (the “Contingent Subscription”) for up to an additional £8 billion of B Shares (the “Contingent B Shares”) and, in connection with such subscription, would receive further enhanced dividend rights under the associated series 1 dividend access share in the capital of the company (the “Dividend Access Share”). However, notwithstanding the Group’s participation in the APS and the issue of the £25.5 billion of B Shares and, if required, the issue of the £8 billion Contingent B, the Group remains exposed to a substantial first loss amount of £60 billion in respect of the Covered Assets and for 10 per cent. of Covered Assets losses after the first loss amount. In addition, as mentioned in the previous risk factor, the assets or exposures covered by the APS may not be those with the greatest future losses or with the greatest need for protection. Moreover, the Group continues to carry the risk of losses, impairments and write-downs with respect to assets not covered by the APS. Therefore, there can be no assurance that any regulatory capital benefits and the additional Core Tier 1 capital will be sufficient to maintain the Group’s capital ratios at the requisite levels in the event of further losses (even with the £8 billion Contingent B Shares). If the Group is unable to improve its capital ratios sufficiently or to maintain its capital ratios in the event of further losses, its business, results of operations and financial condition will suffer, its credit ratings may fall, its ability to lend and access funding will be further limited and its cost of funding may increase. The occurrence of any or all of such events may cause the price of the
17
Business review continued |
Securities to decline substantially and may result in intervention by the Authorities, which could include full nationalisation or other resolution procedures under the Banking Act. Any compensation payable to holders of the Securities would be subject to the provisions of the Banking Act, and investors may receive no value for their Securities.
In the event that the Group’s Core Tier 1 capital ratio declines to below 5 per cent., HM Treasury is committed to subscribe for up to an additional £8 billion of Contingent B Shares if certain conditions are met. If such conditions are not met, and the Group is unable to issue the £8 billion Contingent B Shares, the Group may be unable to find alternative methods of obtaining protection for stressed losses against severe or prolonged recessionary periods in the economic cycle and improving its capital ratios, with the result that the Group may face increased risk of full nationalisation or other resolution procedures under the Banking Act.
In the event that the Group’s Core Tier 1 capital ratio declines to below 5 per cent., HM Treasury is committed to subscribe for up to an additional £8 billion of Contingent B Shares if certain conditions are met. Such conditions include that the European Commission’s decision that the State Aid is compatible with article 87 of the consolidated version of the Treaty establishing the European Community continues to be in force, that the European Commission has not opened a formal investigation under article 88(2) of such Treaty in relation to the possible misuse of State Aid, that there has been no breach by the company of the State Aid Commitment Deed and that no Termination Event has occurred.
If such conditions are not met, and the Group is unable to issue the £8 billion Contingent B Shares, the Group may be unable to find alternative methods of obtaining protection for stressed losses against severe or prolonged recessionary periods in the economic cycle and improving its capital ratios, with the result that the Group may face increased risk of full nationalisation or other resolution procedures under the Banking Act.
In these circumstances, if the Group is unable to issue the £8 billion Contingent B Shares, the Group will need to assess its strategic and operational position and will be required to find alternative methods for achieving the requisite capital ratios. Such methods could include an accelerated reduction in risk-weighted assets, disposals of certain businesses, increased issuance of Tier 1 capital securities, increased reliance on alternative government-supported liquidity schemes and other forms of government assistance. There can be no assurance that any of these alternative methods will be available or would be successful in increasing the Group’s capital ratios to the desired or requisite levels. If the Group is unable to issue the £8 billion Contingent B Shares, the Group’s business, results of operations, financial condition and capital position and ratios will suffer, its credit ratings may drop, its ability to lend and access funding will be further limited and its cost of funding may increase. The occurrence of any or all of such events may cause the price of the Securities to decline substantially and may result in intervention by the Authorities or other regulatory bodies in the other jurisdictions in which RBS and its subsidiaries operate, which could include full nationalisation, other resolution procedures under the Banking Act or revocation of permits and licences necessary to conduct the Group’s businesses. Any compensation payable to holders of Securities would be subject to the provisions of the Banking Act, and investors may receive no value for their Securities (see the risk factor headed “the company and its United Kingdom bank subsidiaries may face the risk of full nationalisation or other resolution procedures under the Banking Act 2009” above).
The Group may have included Covered Assets that are ineligible (or that later become ineligible) for protection under the APS. Protection under the APS may be limited or may cease to be available where Covered Assets are not correctly or sufficiently logged or described, where a Covered Asset is disposed of (in whole or in part) prior to a Trigger, where the terms of the APS do not apply or are uncertain in their application, where the terms of the protection itself potentially give rise to legal uncertainty, where certain criminal conduct has or may have occurred or where a breach of bank secrecy, confidentiality, data protection or similar laws may occur. In addition, certain assets included in the APS do not satisfy the eligibility requirements of the Scheme Documents. In each case this would reduce the anticipated benefits to the Group of the APS.
The Covered Assets comprise a wide variety and a very large number of complex assets and exposures. As a result of the significant volume, variety and complexity of assets and exposures and the resulting complexity of the Scheme Documents, there is a risk that the Group may have included assets or exposures within the Covered Assets that are not eligible for protection under the APS, with the result that such assets or exposures may not be protected by the APS. Furthermore, if Covered Assets are not correctly or sufficiently logged or described for the purposes of the APS, protection under the APS may, in certain circumstances and subject to certain conditions, not be available or may be limited, including by potentially being limited to the terms of the assets “as logged”. If a Covered Asset is disposed of prior to the occurrence of a failure to pay, a bankruptcy or a restructuring, as described in the UK Asset Protection Scheme Terms and Conditions (the “Scheme Conditions”) (a “Trigger”) in respect of that Covered Asset, the Group will also lose protection under the APS in respect of that disposed asset or, if the Covered Asset is disposed of in part, in respect of that disposed part of the Covered Asset or in some circumstances all of the Covered Asset, in each case with no rebate of the fee payable to HM Treasury, unless an agreement otherwise is reached with HM Treasury at the relevant time. Moreover, since the terms of the credit protection available under the APS are broad and general (given the scale and purpose of the APS and the wide variety and very large number of complex assets and exposures intended to be included as Covered Assets) and also very complex and in some instances operationally restrictive, certain Scheme Conditions may not apply to particular assets, exposures or operational scenarios or their applicability may be uncertain (for example, in respect of overdrafts). In addition, many of these provisions apply from 31 December 2008 and therefore may not have been complied with between this date and the date of the Group’s accession to the APS on 22 December 2009. In each case this may result in a loss or reduction of protection. There are certain limited terms and conditions of the Scheme Conditions which are framed in such a way that may give rise to lack of legal certainty. Furthermore, if a member of the Group becomes aware after due and reasonable enquiry that there has been any material or systemic criminal conduct on the part of the Group (including its directors, officers and employees) relating to or affecting any of the Covered Assets, some or all of those assets may cease to be protected by the APS. HM Treasury may also require the withdrawal or the company may itself consider it necessary to withdraw Covered Assets held in certain jurisdictions where disclosure of certain information to HM Treasury may result in a breach of banking secrecy, confidentiality, data protection or similar laws. In addition, at the time of accession to the APS, approximately £3 billion of derivative and structured finance assets were identified as having been included in the APS which, for technical reasons, did not or which were anticipated at some stage not to, satisfy the eligibility requirements specified in the Scheme Documents. HM Treasury and the company agreed to negotiate in good faith to establish as soon as practicable whether (and if so, to what extent) coverage should extend to these derivative assets. These negotiations remain ongoing. The £3 billion of derivative and structured finance assets referred to above were in addition to approximately £1.2 billion of Covered Assets across a broad range of asset classes which were withdrawn from the APS at the time of accession.
The effect of (i) failures to be eligible and/or to log or correctly describe Covered Assets, (ii) disposals of Covered Assets prior to a Trigger, (iii) the uncertainty of certain Scheme Conditions and the exclusion of certain assets and exposures from the APS and potential lack of legal certainty, (iv) the occurrence of material or systemic criminal conduct on the part of the company or its representatives relating to or affecting Covered Assets or breach of banking secrecy, confidentiality, data protection or similar laws and (v) failure or potential failure of HM Treasury and the company to
18
Business review continued |
reach agreement in respect of whether (and if so, to what extent) cover should extend to certain ineligible assets, may (or, in respect of assets which HM Treasury and the company have agreed are ineligible, will) impact the enforceability and/or level of protection available to the Group and may materially reduce the protection anticipated by the Group for its stressed losses. Further, there is no ability to nominate additional or alternative assets or exposures in place of those which turn out not to be covered under the APS. If the Group is then unable to find alternative methods for improving and maintaining its capital ratios, its business, results of operations and financial condition will suffer, its credit ratings may drop, its ability to lend and access funding will be further limited and its cost of funding may increase. The occurrence of any or all of such events may cause the price of the Securities to decline substantially and may result in intervention by the Authorities, which could include full nationalisation or other resolution procedures under the Banking Act. Any compensation payable to holders of Securities would be subject to the provisions of the Banking Act, and investors may receive no value for their Securities.
During the life of the APS, certain or all of the Covered Assets may cease to be protected due to a failure to comply with continuing obligations under the APS, reducing the benefit of the APS to the Group.
The Group is subject to limitations on actions it can take in respect of the Covered Assets and certain related assets and to extensive continuing obligations under the Scheme Conditions relating to governance, asset management, audit and reporting. The Group’s compliance with the Scheme Conditions is dependent on its ability to (i) implement efficiently and accurately new approval processes and reporting, governance and management systems in accordance with the Scheme Conditions and (ii) comply with applicable laws and regulations where it does business. The Group has complex and geographically diverse operations, and operational risk in the context of the APS may result from errors by employees or third-parties, failure to document transactions or procedures properly or to obtain proper authorisations in accordance with the Scheme Conditions, equipment failures or the inadequacy or failure of systems and controls. Although the Group has devoted substantial financial and operational resources, and intends to devote further substantial resources, to developing efficient procedures to deal with the requirements of the APS and to training staff, it is not possible to be certain that such actions will be effective to control each of the operational risks faced by the Group or to provide the necessary information in the necessary time periods in the context of the APS. Since the Group’s operational systems were not originally designed to facilitate compliance with these extensive continuing obligations, there is a risk that the Group will fail to comply with a number of these obligations. This risk is particularly acute in the period immediately following the APS becoming effective. Certain of the reporting requirements, in particular, are broad in their required scope and challenging in their required timing. There is, as a result, a real possibility that the Group, at least initially, will not be able to achieve full compliance. Where the Group is in breach of its continuing obligations under the Scheme Conditions in respect of any of the Covered Assets, related assets or other obligations, or otherwise unable to provide or verify information required under the APS within the requisite time periods, recovery of losses under the APS may be adversely impacted, may lead to an indemnity claim and HM Treasury may in addition have the right to exercise certain step-in rights, including the right to require the Group to appoint a step-in manager who may exercise oversight, direct management rights and certain other rights including the right to modify certain of the Group’s strategies, policies or systems. Therefore, there is a risk that Covered Assets in relation to which the Group has failed to comply with its continuing obligations under the Scheme Conditions, will not be protected or fully protected by the APS. As there is no ability to nominate additional or alternative assets or exposures for cover under the APS, the effect of such failures will impact the level of protection available to the Group and may reduce or eliminate in its entirety the protection anticipated by the Group for its stressed losses, in which case its business, results of operations and financial condition will suffer, its credit ratings may drop, its ability to lend and access funding will be further limited and its cost of funding may increase. The occurrence of any or all of such events may cause the price of the Securities to decline substantially and may result in intervention by the Authorities, which could include full nationalisation or other resolution procedures under the Banking Act. Any compensation payable to holders of Securities would be subject to the provisions of the Banking Act, and investors may receive no value for their Securities.
The Scheme Conditions may be modified by HM Treasury in certain prescribed circumstances, which could result in a loss or reduction in the protection provided under the APS in relation to certain Covered Assets, increased costs to the Group in respect of the APS or limitations on the Group’s operations.
HM Treasury may, following consultation with the Group, modify or replace certain of the Scheme Conditions in such a manner as it considers necessary (acting reasonably) to:
| · | remove or reduce (or remedy the effects of) any conflict between: (i) the operation, interpretation or application of certain Scheme Conditions; and (ii) any of the overarching principles governing the APS; |
| · | correct any manifest error contained in certain Scheme Conditions; or |
| · | take account of any change in law. |
HM Treasury can only effect a modification or replacement of a Scheme Condition if (i) it is consistent with each of the Scheme Principles, (ii) there has been no formal notification from the FSA that such modification would result in any protection provided to the Group under the APS ceasing to satisfy certain requirements for eligible credit risk mitigation and (iii) HM Treasury has considered in good faith and had regard to any submissions, communications or representations of or made by the Group regarding the anticipated impact of the proposed modification under any non-United Kingdom capital adequacy regime which is binding on the company or a Covered Entity.
Such modifications or replacements may be retrospective and may result in a loss of or reduction in the protection expected by the Group under the APS in relation to certain Covered Assets, an increase in the risk weightings of the Covered Assets (either in the United Kingdom or overseas), a material increase in the continuing reporting obligations or asset management conditions applicable to the Group under the Scheme Conditions or a material increase in the expenses incurred or costs payable by the Group under the APS. Modifications by HM Treasury of the Scheme Conditions could result in restrictions or limitations on the Group’s operations. The consequences of any such modifications by HM Treasury are impossible to quantify and are difficult to predict and may have a material adverse effect on the Group’s financial condition and results of operations.
Owing to the complexity of the APS and possible regulatory capital developments, the operation of the APS and the issue of £25.5 billion of B Shares and, if required, the £8 billion Contingent B Shares may fail to achieve the desired effect on the Group’s regulatory capital position. This may mean the Group’s participation in the APS and the issuance of £25.5 billion of B Shares and, if required, the £8 billion Contingent B Shares does not improve market confidence in the Group sufficiently or at all. This may result in the Group facing the risk of full nationalisation or other resolution procedures under the Banking Act.
19
Business review continued |
One of the key objectives of the APS and the issuance of £25.5 billion of B Shares in December 2009 and, if required, the £8 billion Contingent B Shares was to improve capital ratios at a consolidated level for the Group and at an individual level for certain relevant Group members. The Group has entered and may in the future enter into further back-to-back arrangements with Group members holding assets or exposures to be covered by the APS in order to ensure the capital ratios of these entities are also improved by virtue of the APS. As the APS and certain of the associated back-to-back arrangements are a unique form of credit protection over a complex range of diversified Covered Assets in a number of jurisdictions, there is a risk that the interpretation of the relevant regulatory capital requirements by one or more of the relevant regulatory authorities may differ from that assumed by the Group, with the result that the anticipated improvement to the Group’s capital ratios will not be fully achieved. There is a further risk that, given that the current regulatory capital requirements and the regulatory bodies governing these requirements are subject to unprecedented levels of review and scrutiny both globally and locally, regulatory capital treatment that differs from that assumed by the Group in respect of the APS, the treatment of the B Share issuance or the back-to-back arrangement may also occur because of changes in law or regulation, regulatory bodies or interpretation of the regulatory capital regimes applicable to the Group and/or the APS and/or the B Shares and/or the back-to-back arrangements described above. If participation in the APS and the issuance of £25.5 billion of B Shares and, if required, the £8 billion Contingent B Shares are not sufficient to maintain the Group’s capital ratios, this could cause the Group’s business, results of operations and financial condition to suffer, its credit rating to drop, its ability to lend and access to funding to be further limited and its cost of funding to increase. The occurrence of any or all of such events may cause the price of the Securities to decline substantially and may result in intervention by the Authorities, which could include full nationalisation or other resolution procedures under the Banking Act. Any compensation payable to holders of Securities would be subject to the provisions of the Banking Act and investors may receive no value for their Securities.
The costs of the Group’s participation in the APS may be greater than the amounts received thereunder.
The costs of participating in the APS incurred by the Group to HM Treasury include a fee of £700 million per annum, payable in advance for the first three years of the APS and £500 million per annum thereafter until the earlier of (i) the date of termination of the APS and (ii) 31 December 2099. The fee may be paid in cash or, subject to HM Treasury consent, by the waiver of certain United Kingdom tax reliefs that are treated as deferred tax assets (pursuant to three agreements which provide the right, at the company’s option, subject to HM Treasury consent, to satisfy all or part of the annual fee in respect of the APS and £8 billion of Contingent B Shares, and the exit fee payable in connection with any termination of the Group’s participation in the APS, by waiving the right to certain United Kingdom tax reliefs that are treated as deferred tax assets (“Tax Loss Waiver”)) or be funded by a further issue of B Shares to HM Treasury. The Group has paid in cash the fee of £1.4 billion in respect of 2009 and 2010. On termination of the Group’s participation in the APS, the fees described in the risk factor below headed “The Group may have to repay any net pay-outs made by HM Treasury under the APS in order to terminate its participation in the APS” will apply. Furthermore, the Group may be subject to additional liabilities in connection with the associated intra group arrangements. Significant costs either have been or will also be incurred in (i) establishing the APS (including a portion of HM Treasury’s costs attributed to the Group by HM Treasury), (ii) implementing the APS, including the Group’s internal systems building and as a consequence of its on-going management and administration obligations under the Scheme Conditions, such as complying with (a) the extensive governance, reporting, auditing and other continuing obligations of the APS and (b) the asset management objective which is generally applied at all times to the Covered Assets and will require increased lending in certain circumstances and (iii) paying the five-year annual fee for the £8 billion of Contingent B Shares of £320 million less 4 per cent. of: (a) the value of any B Shares subscribed for under the Contingent Subscription; and (b) the amount by which the Contingent Subscription has been reduced pursuant to any exercise by the company of a partial termination of the Contingent Subscription (payable in cash or, with HM Treasury’s consent, by waiving certain United Kingdom tax reliefs that are treated as deferred tax assets (pursuant to the Tax Loss Waiver), or funded by a further issue of B Shares to HM Treasury). In addition, there will be ongoing expenses associated with compliance with the Scheme Conditions, including the company’s and HM Treasury’s professional advisers’ costs and expenses. These expenses are expected to be significant due to the complexity of the APS, the need to enhance the Group’s existing systems in order to comply with reporting obligations required by the APS and the Group’s obligations under the Scheme Conditions to pay HM Treasury’s and its advisers’ costs in relation to the APS. In addition, the Group has certain other financial exposures in connection with the APS including (i) an obligation to indemnify HM Treasury, any governmental entity or their representatives and (ii) for the minimum two-year period from a Trigger until payment is made by HM Treasury under the APS, exposure to the funding costs of retaining assets and exposures on its balance sheet whilst receiving interest based on the “Sterling General Collateral Repo Rate” as displayed on the Bloomberg service, or such other rate as may be notified by HM Treasury from time to time as reflecting its costs of funds. The aggregate effect of the joining, establishment and operational costs of the APS and the on-going costs and expenses, including professional advisers’ costs, may significantly reduce or even eliminate the anticipated amounts to be received by the Group under the APS.
The amounts received under the APS (which amounts are difficult to quantify precisely) may be less than the costs of participation, as described above. There are other, non-cash, anticipated benefits of the Group’s participation, which include the regulatory capital benefits referred to above and the potential protection from future losses, which are themselves also difficult to quantify.
The Group may have to repay any net pay-outs made by HM Treasury under the APS in order to terminate its participation in the APS.
During its participation in the APS, RBS will pay an annual participation fee to HM Treasury. The annual fee, which is payable in advance, is £700 million per annum for the first three years of the Group’s participation in the APS and £500 million per annum thereafter until the earlier of (i) the date of termination of the APS and (ii) 31 December 2099. The Group has paid in cash the fee of £1.4 billion in respect of 2009 and 2010. Pursuant to the Accession Agreement and the Tax Loss Waiver, subject to HM Treasury consent, all or part of the exit fee (but not the refund of the net payments the Group has received from HM Treasury under the APS) may be paid by the waiver of certain United Kingdom tax reliefs that are treated as deferred tax assets (pursuant to the Tax Loss Waiver). The directors of the company may, in the future, conclude that the cost of this annual fee, in combination with the other costs of the Group’s participation in the APS, outweighs the benefits of the Group’s continued participation and therefore that the Group’s participation in the APS should be terminated. However, in order to terminate the Group’s participation in the APS, the Group must have FSA approval and pay an exit fee which is an amount equal to (a) the larger of (i) the cumulative aggregate fee of £2.5 billion and (ii) 10 per cent. of the annual aggregate reduction in Pillar I capital requirements in respect of the assets covered by the APS up to the time of exit less (b) the aggregate of the annual fees paid up to the date of exit. In the event that the Group has received payments from HM Treasury under the APS in respect of losses on any Covered Assets in respect of which a Trigger occurs (“Triggered Assets”), it must either negotiate a satisfactory exit payment to exit the APS, or absent such agreement, refund to HM Treasury any net payments made by HM Treasury under the APS in respect of losses on the Triggered Assets.
The effect of the payment of the exit fee and potentially the refund of the net pay-outs it has received from HM Treasury under the APS may significantly reduce or even eliminate the anticipated further regulatory capital benefits to the Group of its participation in the APS or if FSA approval for the proposed termination is not obtained and could have an adverse impact on the Group’s financial condition and results of operation
20
Business review continued |
or result in a loss of value in the Securities. Alternatively, if the Group is unable to repay to HM Treasury in full the exit fee and potentially the net pay-outs it has received under the APS and, therefore, unable to terminate its participation in the APS, the Group will be required under the Scheme Conditions to continue to pay the annual fee to HM Treasury until 31 December 2099, which could have an adverse impact on the Group’s financial condition and results of operation or result in a loss of value in the Securities.
Under certain circumstances, the Group cannot be assured that assets of ABN AMRO (and certain other entities) will continue to be covered under the APS, either as a result of a withdrawal of such assets or as a result of a breach of the relevant obligations.
If HM Treasury seeks to exercise its right to appoint one or more step-in managers in relation to the management and administration of Covered Assets held by ABN AMRO or its wholly-owned subsidiaries, ABN AMRO will, in certain circumstances, need to seek consent from the Dutch Central Bank to allow it to comply with such step-in. If this consent is not obtained by the date (which will fall no less than 10 business days after the notice from HM Treasury) on which the step-in rights must be effective, and other options to effect compliance are not possible (at all or because the costs involved prove prohibitive), those assets would need to be withdrawn by the Group from the APS where permissible under the Scheme Conditions or, otherwise, with HM Treasury consent. If the Group cannot withdraw such Covered Assets from the APS, it would be likely to lose protection in respect of these assets under the APS and/or may be liable under its indemnity to HM Treasury. If the Group loses cover under the APS in respect of any Covered Asset held by ABN AMRO or its wholly-owned subsidiaries, any losses incurred on such asset will continue to be borne fully by the Group and may have a material adverse impact on its financial condition, profitability and capital ratios. Similar issues apply in certain other jurisdictions but the relevant Covered Assets are of a lower quantum.
The extensive governance, asset management and information requirements under the Scheme Conditions and HM Treasury’s step-in rights may serve to limit materially the Group’s operations. In addition, the market’s reaction to such controls and limitations may have an adverse impact on the price of the Securities.
Under the Scheme Conditions, the Group has extensive governance, asset management, audit and information obligations aimed at ensuring (amongst other things) that (i) there is no prejudice to, discrimination against, or disproportionate adverse effect on the management and administration of Covered Assets when compared with the management and administration of other assets of the Group that are outside of the APS and (ii) HM Treasury is able to manage and assess its exposure under the APS, perform any other functions within HM Treasury’s responsibilities or protect or enhance the stability of the United Kingdom financial system. Any information obtained by HM Treasury through its information rights under the APS may be further disclosed by HM Treasury to other government agencies, the United Kingdom Parliament, the European Commission, and more widely if HM Treasury determines that doing so is required, for example, to protect the stability of the United Kingdom financial system.
Moreover, HM Treasury has the right under the Scheme Conditions to appoint one or more step-in managers (identified or agreed to by HM Treasury) to exercise certain step-in rights upon the occurrence of certain specified events. The step-in rights are extensive and include certain oversight, investigation, approval and other rights, the right to require the modification or replacement of any of the systems, controls, processes and practices of the Group and extensive rights in relation to the direct management and administration of the Covered Assets. For further information on these rights. If the Group does not comply with the instructions of the step-in manager, once appointed, the Group may lose protection under the APS in respect of all or some of the Covered Assets. The step-in manager may be a person identified by HM Treasury and not by the company.
The payment obligations of HM Treasury under the Scheme Documents are capable of being transferred to any third party (provided the transfer does not affect the risk weightings the Group is entitled to apply to its exposures to Covered Assets). The step-in rights, together with all other monitoring, administration and enforcement rights, powers and discretions of HM Treasury under the Scheme Documents, are capable of being transferred to any government entity.
The obligations of the Group and the rights of HM Treasury may, individually or in the aggregate, impact the way the Group runs its business and may serve to limit the Group’s operations with the result that the Group’s business, results of operations and financial condition will suffer.
Any conversion of the B Shares, in combination with any future purchase by HM Treasury of Ordinary Shares, would increase HM Treasury’s ownership interest in the company, and could result in the delisting of the company’s Securities.
On 22 December 2009, the company issued £25.5 billion of B Shares to HM Treasury. The B Shares are convertible, at the option of the holder at any time, into Ordinary Shares at an initial conversion price of £0.50 per Ordinary Share. Although HM Treasury has agreed not to convert any B Shares it holds if, as a result of such conversion, it would hold more than 75 per cent. of the Ordinary Shares, if HM Treasury were to acquire additional ordinary shares otherwise than through the conversion of the B Shares, such additional acquisitions could significantly increase HM Treasury’s ownership interest in the company to above 75 per cent. of the company’s ordinary issued share capital, which would put the company in breach of the FSA’s Listing Rules requirement that at least 25 per cent. of its issued ordinary share capital must be in public hands. Although the company may apply to the UK Listing Authority for a waiver in such circumstances, there is no guarantee that such a waiver would be granted, the result of which could be the delisting of the company from the Official List and potentially other exchanges where its Securities are currently listed and traded. In addition, HM Treasury will not be entitled to vote in respect of the B Shares or in respect of the Dividend Access Share to the extent, but only to the extent, that votes cast on such B Shares and/or on such Dividend Access Share, together with any other votes which HM Treasury is entitled to cast in respect of any other Ordinary Shares held by or on behalf of HM Treasury, would exceed 75 per cent. of the total votes eligible to be cast on a resolution presented at a general meeting of the company. In addition, holders of the B Shares will only be entitled to receive notice of and to attend any general meeting of the company and to speak to or vote upon any resolution proposed at such meeting if a resolution is proposed which either varies or abrogates any of the rights and restrictions attached to the B Shares or proposes the winding up of the company (and then in each such case only to speak and vote upon any such resolution).
A significant proportion of senior management’s time and resources will have to be committed to the APS, which may have a material adverse effect on the rest of the Group’s business.
The Group expects that significant senior management and key employee time and resources will have to be committed to the ongoing operation of the APS, including governance, asset management and reporting and generally to ensure compliance with the Scheme Conditions. The time and resources required to be committed to the APS by the Group’s senior management and other key employees is likely to place significant additional demands on senior management in addition to the time and resources required to be dedicated to the rest of the Group’s business. In addition, and separately from the Group’s participation in the APS, significant headcount reductions are being introduced at all levels of
21
Business review continued |
management in the context of a restructuring of the Group. The Group’s ability to implement its overall strategy depends on the availability of its senior management and other key employees. If the Group is unable to dedicate sufficient senior management resources to the Group’s business outside the APS, its business, results of operations and financial condition will suffer.
The cost of the Tax Loss Waiver and related undertakings is uncertain and the Group may be subject to additional tax liabilities in connection with the APS.
It is difficult to value accurately the cost to the Group if it opts, subject to HM Treasury consent, to satisfy the annual fee in respect of both the APS and the Contingent Subscription and any exit fee (payable to terminate the Group’s participation in the APS) by waiving certain United Kingdom tax reliefs that are treated as deferred tax assets pursuant to the Tax Loss Waiver. The cost will depend on unascertainable factors including the extent of future losses, the extent to which the Group regains profitability and any changes in tax law. In addition to suffering greater tax liabilities in future years as a result of the Tax Loss Waiver, the Group may also be subject to further tax liabilities in the United Kingdom and overseas in connection with the APS and the associated intra-group arrangements which would not otherwise have arisen. The Tax Loss Waiver provides that the Group will not be permitted to enter into arrangements which have a main purpose of reducing the net cost of the Tax Loss Waiver. It is unclear precisely how these restrictions will apply, but it is possible that they may limit the operations and future post-tax profitability of the Group.
In order to fulfil its disclosure obligations under the APS, the Group may incur the risk of civil suits, criminal liability or regulatory actions.
The Scheme Conditions require that certain information in relation to the Covered Assets be disclosed to HM Treasury to enable HM Treasury to quantify, manage and assess its exposure under the APS. The FSA has issued notices to the Group requiring the information that HM Treasury required under the Scheme Documents prior to the Group’s accession to and participation in the APS (and certain other information which HM Treasury requires under the Scheme Documents following the Group’s accession), be provided to it through its powers under the FSMA and the Banking Act. To the extent regulated by the FSA, the Group has a legal obligation to comply with these disclosure requests from the FSA. However, in complying with these disclosure obligations and providing such information to the FSA, the Group may, in certain jurisdictions, incur the risk of civil suits or regulatory action (which could include fines) to the extent that disclosing information related to the Covered Assets results in the Group breaching common law or statutory confidentiality laws, contractual undertakings, data protection laws, banking secrecy and other laws restricting disclosure. There can be no guarantee that future requests for information will not be made by the FSA in the same manner. Requests made directly by HM Treasury pursuant to the terms of the APS are likely to expose the Group to a greater risk of such suits or regulatory action. Adverse regulatory action or adverse judgments in litigation could result in a material adverse effect on the Group’s reputation or results of operations or result in a loss of value in the Securities. Alternatively, in order to avoid the risk of such civil suits or regulatory actions or to avoid the risk of criminal liability, the Group may choose to or (in the case of criminal liability) be required to remove Covered Assets from the APS so as not to be required to disclose to HM Treasury, such information, with the result that such assets will not be protected by the APS. The effect of the removal of such Covered Assets will impact the level of protection available to the Group and may materially reduce the protection anticipated by the Group for its stressed losses, in which case its business, results of operations and financial condition will suffer.
Where the Group discloses information to HM Treasury as set out above, HM Treasury may disclose that information to a number of third parties for certain specified purposes. Such disclosures by HM Treasury may put the Group in breach of common law or statutory confidentiality laws, contractual undertakings, data protection laws, banking secrecy or other laws restricting disclosure.
22
Business review continued |
Key financials
| 2009 | Restated (1) 2008 | 2007 | ||||||||||
| For year ended 31 December 2009 | £m | £m | £m | |||||||||
| Total income | 38,690 | 25,868 | 30,366 | |||||||||
| Operating (loss)/profit before tax | (2,595 | ) | (40,836 | ) | 9,832 | |||||||
| (Loss)/profit attributable to ordinary and B shareholders | (3,607 | ) | (24,306 | ) | 7,303 | |||||||
| Cost:income ratio | 55.5 | % | 209.5 | % | 45.9 | % | ||||||
| Basic (loss)/earnings per ordinary and B share from continuing operations (pence) | (6.3p | ) | (146.2p | ) | 64.0 | p | ||||||
| 2009 | 2008 | 2007 | ||||||||||
| At 31 December 2009 | £m | £m | £m | |||||||||
| Total assets | 1,696,486 | 2,401,652 | 1,840,829 | |||||||||
| Loans and advances to customers | 728,393 | 874,722 | 828,538 | |||||||||
| Deposits | 756,346 | 897,556 | 994,657 | |||||||||
| Owners’ equity | 77,736 | 58,879 | 53,038 | |||||||||
| Risk asset ratio | ||||||||||||
| – Core Tier 1 | 11.0 | % | 6.6 | % | 4.5 | % | ||||||
| – Tier 1 | 14.1 | % | 10.0 | % | 7.3 | % | ||||||
| – Total | 16.1 | % | 14.1 | % | 11.2 | % | ||||||
Note:
| (1) | The results for 2008 have been restated for the amendment to IFRS 2 ‘Share-based Payment’. This has resulted in an increase in staff costs amounting to £169 million. |
Overview of results
As discussed on page 2, the results of ABN AMRO are fully consolidated in the Group’s financial statements. Consequently, the results of RBS for the year ended 31 December 2009 and 2008 include the results of ABN AMRO for the full year, and for the year ended 31 December 2007 include the results of ABN AMRO for 76 days. The interests of the State of the Netherlands and Santander in RFS Holdings are included in minority interests.
23
Business review continued |
Summary consolidated income statement for the year ended 31 December 2009
| 2009 | Restated (1) 2008 | 2007 | ||||||||||
| £m | £m | £m | ||||||||||
| Net interest income | 16,504 | 18,675 | 12,069 | |||||||||
| Fees and commissions receivable | 9,831 | 9,831 | 8,278 | |||||||||
| Fees and commissions payable | (2,822 | ) | (2,386 | ) | (2,193 | ) | ||||||
| Other non-interest income | 9,633 | (6,578 | ) | 6,125 | ||||||||
| Insurance net premium income | 5,544 | 6,326 | 6,087 | |||||||||
| Non-interest income | 22,186 | 7,193 | 18,297 | |||||||||
| Total income | 38,690 | �� | 25,868 | 30,366 | ||||||||
| Operating expenses | (21,478 | ) | (54,202 | ) | (13,942 | ) | ||||||
| Profit/(loss) before other operating charges and impairment losses | 17,212 | (28,334 | ) | 16,424 | ||||||||
| Insurance net claims | (4,857 | ) | (4,430 | ) | (4,624 | ) | ||||||
| Impairment losses | (14,950 | ) | (8,072 | ) | (1,968 | ) | ||||||
| Operating (loss)/profit before tax | (2,595 | ) | (40,836 | ) | 9,832 | |||||||
| Tax credit/(charge) | 371 | 2,323 | (2,044 | ) | ||||||||
| (Loss)/profit from continuing operations | (2,224 | ) | (38,513 | ) | 7,788 | |||||||
| (Loss)/profit from discontinued operations, net of tax | (99 | ) | 3,971 | (76 | ) | |||||||
| (Loss)/profit for the year | (2,323 | ) | (34,542 | ) | 7,712 | |||||||
| Minority interests | (349 | ) | 10,832 | (163 | ) | |||||||
| Preference shares and other dividends | (935 | ) | (596 | ) | (246 | ) | ||||||
| (Loss)/profit attributable to ordinary and B shareholders | (3,607 | ) | (24,306 | ) | 7,303 | |||||||
| Basic (loss)/earnings per ordinary and B share from continuing operations | (6.3p | ) | (146.2p | ) | 64.0 | p | ||||||
Note:
| (1) | The results for 2008 have been restated for the amendment to IFRS 2 ‘Share-based Payment’. This has resulted in an increase in staff costs amounting to £169 million. |
24
Business review continued |
2009 compared with 2008
Operating loss before tax
Operating loss before tax for the year was £2,595 million compared with a loss of £40,836 million in 2008. The reduction in the loss is primarily a result of a substantial increase in non-interest income and a substantial fall in the write-down of goodwill and other intangible assets partially offset by a significant increase in impairment losses and lower net interest income.
After tax, minority interests and preference share and other dividends, the loss attributable to ordinary and B shareholders was £3,607 million, compared with an attributable loss of £24,306 million in 2008.
Total income
Total income increased 50% to £38,690 million in 2009 primarily reflecting a significant reduction in credit and other market losses and a gain on redemption of own debt. Increased market volatility and strong customer demand in a positive trading environment also contributed to this improvement. While income was down marginally in UK Corporate and held steady in Retail & Commercial Banking and RBS Insurance, a significant improvement occurred in Global Banking & Markets, reflecting the reduced credit and other market losses and a more buoyant trading market during the year compared to 2008.
Net interest income
Net interest income fell by 12% to £16,504 million, with average loans and advances to customers stable and average customer deposits down 1%. Group net interest margin fell from 2.12% to 1.83% largely reflecting the pressure on liability margins, given rates on many deposit products already at floors in the low interest rate environment, and strong competition, particularly for longer-term deposits and the build up of the Group’s liquidity portfolio.
Non-interest income
Non-interest income increased to £22,186 million from £7,193 million in 2008, largely reflecting the sharp improvement in income from trading activities, as improved asset valuations led to lower credit market losses and GBM benefited from the restructuring of its business to focus on core customer franchises. The Group also recorded a gain of £3,790 million on a liability management exercise to redeem a number of Tier 1 and upper Tier 2 securities. However, fees and commissions fell as a result of the withdrawal of the single premium payment protection insurance product and the restructuring of UK current account overdraft fees, offset by higher fees in businesses attributable to RFS Holdings minority interest..
Operating expenses
Total operating expenses decreased from £54,202 million in 2008 to £21,478 million, largely resulting from the substantial decrease in the write-down of goodwill and other intangible assets, down to £363 million compared with £32,581 million in 2008. Staff costs, excluding curtailment gains, were up 13% with most of the movement relating to adverse movements in foreign exchange rates and some salary inflation. Changes in incentive compensation, primarily in Global Banking & Markets, represented most of the remaining change. This was offset by a gain of £2,148 million arising from the curtailment of prospective pension benefits in the defined benefit scheme and certain other subsidiary schemes. The Group cost:income ratio improved to 56%, compared with 210% in 2008.
Net insurance claims
Bancassurance and general insurance claims, after reinsurance, increased by 10% to £4,857 million.
Impairment losses
Impairment losses increased to £14,950 million from £8,072 million in 2008, with Core bank impairments rising by £2,182 million, Non-Core by £4,285 million and RFS Holdings minority interest by £411 million. Signs that impairments might be plateauing appear to have been borne out in the latter part of the year, and there are indications that the pace of downwards credit rating migration for corporates is slowing. Nonetheless, the financial circumstances of many consumers and businesses remain fragile, and rising refinancing costs, whether as a result of monetary tightening or of increased regulatory capital requirements, could expose some customers to further difficulty.
Impairments represented 2.0% of gross loans and advances, excluding reverse repos, in 2009 compared with 0.8% in 2008.
Risk elements in lending and potential problem loans at 31 December 2009 represented 5.5% of loans and advances, excluding reverse repos, compared with 2.5% a year earlier. Provision coverage was 44%, compared with 51% at 31 December 2008 as a consequence of the growth in risk elements in lending being concentrated in secured, property-related loans. These loans require relatively lower provisions in view of their collateralised nature.
Taxation
The effective tax rate for 2009 was 14.3% compared with 5.7% in 2008.
Earnings
Basic earnings per ordinary and B share, including discontinued operations, improved from a loss of 146.7p to a loss of 6.4p.
Balance Sheet
Total assets of £1,696.5 billion at 31 December 2009 were down £705.2 billion, 29%, compared with 31 December 2008, principally reflecting substantial repayments of customer loans and advances, as corporate customer demand fell and corporates looked to deleverage their balance sheets. Lending to banks also fell in line with significantly reduced wholesale funding activity. There were also significant falls in the value of derivative assets, with a corresponding reduction in derivative liabilities.
Loans and advances to banks decreased by £46.4 billion, 34%, to £91.8 billion with reverse repurchase agreements and stock borrowing (‘reverse repos’) down by £23.7 billion, 40% to £35.1 billion and lower bank placings, down £22.7 billion, 29%, to £56.7 billion, largely as a result of reduced wholesale funding activity in Global Banking & Markets.
25
Business review continued |
Loans and advances to customers were down £146.3 billion, 17%, at £728.4 billion. Within this, reverse repos increased by 4%, £1.7 billion to £41.0 billion. Excluding reverse repos, lending decreased by £148.0 billion to £687.4 billion or by £141.8 billion, 17%, before impairment provisions.
Capital
Capital ratios at 31 December 2009 were 11.0% (Core Tier 1), 14.1% (Tier 1) and 16.1% (Total).
2008 compared with 2007
Operating loss before tax
Operating loss before tax was £40,836 million compared with an operating profit before tax of £9,832 million in 2007. The results have been adversely affected by the write-down of goodwill and other assets, a substantial decline in non-interest income, a number of specific losses such as counterparty failures, and a marked increase in the credit impairment charge, reflecting weakness in financial markets and a deteriorating global economy.
Losses from credit market exposures increased to £7,781 million, compared with £1,410 million in 2007, with the great majority incurred in the first half of the year. Write-down of goodwill and other assets was £32,581 million. Other one-off items amounted to a credit of £1,674 million, 25% higher than in 2007, principally as a result of a £1,232 million increase in the carrying value of own debt carried at fair value.
Loss attributable to ordinary shareholders was £24,306 million, compared with an attributable profit of £7,303 million in 2007.
Total income
Total income declined by 15% to £25,868 million, with a significant deterioration experienced during the second half of the year principally as a result of £5.8 billion of trading asset write-downs, counterparty failure and incremental reserving within GBM and Non-Core. While income increased in 2008 in Global Transaction Services, UK Corporate, Ulster Bank and US Retail & Commercial, a significant reduction occurred in UK Retail, and in Global Banking & Markets and Non-Core, where a strong performance in rates, currencies and commodities was offset by marked deterioration in credit markets and equities.
Net interest income
Net interest income increased by 55% to £18,675 million, with average loans and advances to customers up 61% and average customer deposits up 53%. Group net interest margin fell from 2.32% to 2.12% largely reflecting tightened margins within UK Retail as market interest rates fell, with deposit markets remaining competitive and price adjustments on lending taking some time to feed through to the back book.
Non-interest income
Non-interest income was severely affected by the weakness in financial markets experienced over the course of the year, particularly in the fourth quarter. Non-interest income decreased to £7,193 million principally due to the credit market write-downs of £7,781 million offset by a movement in the fair value of own debt of £1,232 million. While the decline was particularly marked in GBM and Non-Core credit markets and equities businesses, with reduced business volumes and mounting mark-to-market trading losses, UK Retail also saw non-interest income fall in the latter part of the year as declining consumer confidence led to lower demand for credit and other financial products.
Operating expenses
Total operating expenses rose to £54,202 million, with cost growth in the Group’s core retail and commercial banking franchises offset by efficiency programmes. Integration and restructuring costs were £1,357 million compared with £108 million in 2007. Write-down of goodwill and other assets was £32,581 million.
Net insurance claims
Bancassurance and general insurance claims, after reinsurance, decreased by 4% to £4,430 million, reflecting improved risk selection, better claims management and the non-recurrence of the severe floods experienced in 2007 and as a result of movements in financial market values.
Impairment losses
Impairment losses increased to £8,072 million in 2008, compared with £1,968 million in 2007. The Group experienced a pronounced deterioration in impairments in the second half of the year, as financial stress spread to a broad range of customers. The greatest increase in impairments occurred in GBM and Non-Core, where fourth quarter impairments included a loss of approximately £900 million on the Group’s exposure to LyondellBasell. However businesses in all geographies also experienced a noticeable increase in impairments in the second half, particularly in the UK and Irish corporate and US personal segments.
Impairments represented 0.44% of gross loans and advances, excluding reverse repos, in the first half but reached 1.27% in the second half. For 2008 as a whole, impairments amounted to 0.82% of loans and advances, excluding reverse repos, compared with 0.28% in 2007. Risk elements in lending and potential problem loans at 31 December 2008 represented 2.52% of gross loans and advances to customers, excluding reverse repos, compared with 1.64% a year earlier. Provision coverage was 51%, compared with 57% at 31 December 2007 reflecting the higher proportion of secured loans included in risk elements in lending and potential problem loans.
Credit market losses
Losses for 2008 relating to the Group’s previously identified credit market exposures totalled £7,781 million, net of hedging gains of £1,642 million. This includes impairment losses of £466 million incurred on credit market assets reclassified out of the ‘held-for-trading’ category in line with the amendments to IAS 39 ‘Financial Instruments: Recognition and Measurement’ issued in October 2008. While the majority of these write-downs were incurred in the first half of 2008, the severity of the financial market dislocation intensified in the fourth quarter, resulting in further losses in particular on the Group’s structured credit portfolios.
26
Business review continued |
Write-down of goodwill and other intangible assets
After reviewing the carrying value of goodwill and other purchased intangible assets, the Group recorded an impairment charge of £32,581 million. Of this charge, £23,348 million relates to part of the goodwill in respect of the acquisition of ABN AMRO, while other significant impairments have been recorded on part of the Citizens/Charter One goodwill of £4,382 million, part of the NatWest goodwill (principally allocated to Global Banking & Markets) of £2,742 million and other goodwill of £720 million. Other intangible asset impairments of £1,389 million principally relate to the write down in the value of customer relationships recognised on the acquisition of ABN AMRO.
These impairments have no cash impact, and minimal impact on the Group’s capital ratios.
Other non-operating items
Integration and restructuring costs totalled £1,357 million, primarily reflecting the integration of ABN AMRO into the Group, while the amortisation of purchased intangibles increased to £582 million from £124 million.
Taxation
The Group recorded a tax credit of £2,323 million in 2008, compared with a tax charge of £2,044 million in 2007. The effective tax rate for 2008 was 5.7% compared with 20.8% in 2007.
Earnings
Basic earnings per ordinary share, including discontinued operations, decreased from 64.0p to (146.7p).
The number of shares in issue increased to 39,456 million at 31 December 2008, compared with 10,006 million in issue at 31 December 2007, reflecting the Group’s capital raisings in June and December and the capitalisation issue in lieu of the interim dividend for 2008.
27
Business review continued |
Analysis of results
Net interest income
| 2009 | 2008 | 2007 | ||||||||||
| £m | £m | £m | ||||||||||
| Interest receivable | 33,835 | 49,522 | 32,252 | |||||||||
| Interest payable | (17,331 | ) | (30,847 | ) | (20,183 | ) | ||||||
| Net interest income | 16,504 | 18,675 | 12,069 | |||||||||
| % | % | % | ||||||||||
Gross yield on interest-earning assets of the banking business (1) | 3.76 | 5.61 | 6.19 | |||||||||
| Cost of interest-bearing liabilities of the banking business | (2.18 | ) | (3.79 | ) | (4.36 | ) | ||||||
Interest spread of the banking business (2) | 1.58 | 1.82 | 1.83 | |||||||||
| Benefit from interest-free funds | 0.25 | 0.30 | 0.49 | |||||||||
Net interest margin of the banking business (3) | 1.83 | 2.12 | 2.32 | |||||||||
| Yields, spreads and margins of the banking business | % | % | % | |||||||||
Gross yield (1) | ||||||||||||
| Group | 3.76 | 5.61 | 6.19 | |||||||||
| UK | 3.35 | 5.72 | 6.69 | |||||||||
| Overseas | 4.09 | 5.54 | 5.52 | |||||||||
Interest spread (2) | ||||||||||||
| Group | 1.58 | 1.82 | 1.83 | |||||||||
| UK | 1.50 | 1.92 | 2.30 | |||||||||
| Overseas | 1.67 | 1.76 | 1.20 | |||||||||
Net interest margin (3) | ||||||||||||
| Group | 1.83 | 2.12 | 2.32 | |||||||||
| UK | 1.81 | 2.39 | 2.55 | |||||||||
| Overseas | 1.85 | 1.91 | 1.99 | |||||||||
| The Royal Bank of Scotland plc base rate (average) | 0.64 | 4.67 | 5.51 | |||||||||
| London inter-bank three month offered rates (average): | ||||||||||||
| Sterling | 1.21 | 5.51 | 6.00 | |||||||||
| Eurodollar | 0.69 | 2.92 | 5.29 | |||||||||
| Euro | 1.21 | 4.63 | 4.28 | |||||||||
Notes:
| (1) | Gross yield is the interest rate earned on average interest-earning assets of the banking business. |
| (2) | Interest spread is the difference between the gross yield and the interest rate paid on average interest-bearing liabilities of the banking business. |
| (3) | Net interest margin is net interest income of the banking business as a percentage of average interest-earning assets of the banking business. |
28
Business review continued |
Average balance sheet and related interest
| 2009 | 2008 | ||||||||||||||||||||||||
Average Balance | Interest | Rate | Average Balance | Interest | Rate | ||||||||||||||||||||
| £m | £m | % | £m | £m | % | ||||||||||||||||||||
| Assets | |||||||||||||||||||||||||
| Loans and advances to banks | – UK | 21,616 | 310 | 1.43 | 19,039 | 939 | 4.93 | ||||||||||||||||||
| – Overseas | 32,367 | 613 | 1.89 | 31,388 | 1,417 | 4.51 | |||||||||||||||||||
| Loans and advances to customers | – UK | 333,230 | 11,940 | 3.58 | 319,696 | 19,046 | 5.96 | ||||||||||||||||||
| – Overseas | 376,382 | 16,339 | 4.34 | 393,405 | 22,766 | 5.79 | |||||||||||||||||||
| Debt securities | – UK | 52,470 | 1,414 | 2.69 | 33,206 | 1,276 | 3.84 | ||||||||||||||||||
| – Overseas | 84,822 | 3,220 | 3.80 | 85,625 | 4,078 | 4.76 | |||||||||||||||||||
| Total interest-earning assets | – banking business (2, 3) | 900,887 | 33,836 | 3.76 | 882,359 | 49,522 | 5.61 | ||||||||||||||||||
– trading business (4) | 291,092 | 425,454 | |||||||||||||||||||||||
| Total interest-earning assets | 1,191,979 | 1,307,813 | |||||||||||||||||||||||
Non-interest-earning assets (2, 3) | 831,501 | 732,872 | |||||||||||||||||||||||
| Total assets | 2,023,480 | 2,040,685 | |||||||||||||||||||||||
| Percentage of assets applicable to overseas operations | 47.4 | % | 48.6 | % | |||||||||||||||||||||
| Liabilities and owners’ equity | |||||||||||||||||||||||||
| Deposits by banks | – UK | 24,837 | 679 | 2.73 | 46,217 | 1,804 | 3.90 | ||||||||||||||||||
| – Overseas | 104,396 | 2,362 | 2.26 | 113,592 | 4,772 | 4.20 | |||||||||||||||||||
| Customer accounts: demand deposits | – UK | 110,294 | 569 | 0.52 | 99,852 | 2,829 | 2.83 | ||||||||||||||||||
| – Overseas | 82,177 | 1,330 | 1.62 | 70,399 | 1,512 | 2.15 | |||||||||||||||||||
| Customer accounts: savings deposits | – UK | 54,270 | 780 | 1.44 | 42,870 | 1,708 | 3.98 | ||||||||||||||||||
| – Overseas | 83,388 | 2,114 | 2.54 | 72,473 | 2,203 | 3.04 | |||||||||||||||||||
| Customer accounts: other time deposits | – UK | 68,625 | 932 | 1.36 | 94,365 | 4,011 | 4.25 | ||||||||||||||||||
| – Overseas | 71,315 | 2,255 | 3.16 | 105,660 | 4,097 | 3.88 | |||||||||||||||||||
| Debt securities in issue | – UK | 116,536 | 2,830 | 2.43 | 101,520 | 4,095 | 4.03 | ||||||||||||||||||
| – Overseas | 117,428 | 2,500 | 2.13 | 132,699 | 5,846 | 4.41 | |||||||||||||||||||
| Subordinated liabilities | – UK | 26,053 | 834 | 3.20 | 26,300 | 1,356 | 5.16 | ||||||||||||||||||
| – Overseas | 12,468 | 656 | 5.26 | 12,385 | 788 | 6.36 | |||||||||||||||||||
| Internal funding of trading business | – UK | (60,284 | ) | (317 | ) | 0.53 | (85,664 | ) | (3,445 | ) | 4.02 | ||||||||||||||
| – Overseas | (14,845 | ) | (192 | ) | 1.29 | (18,090 | ) | (729 | ) | 4.03 | |||||||||||||||
| Total interest-bearing liabilities | – banking business (2, 3) | 796,658 | 17,332 | 2.18 | 814,578 | 30,847 | 3.79 | ||||||||||||||||||
– trading business (4) | 331,380 | 466,610 | |||||||||||||||||||||||
| Total interest-bearing liabilities | 1,128,038 | 1,281,188 | |||||||||||||||||||||||
| Non-interest-bearing liabilities: | |||||||||||||||||||||||||
| Demand deposits | – UK | 38,220 | 37,568 | ||||||||||||||||||||||
| – Overseas | 27,149 | 17,625 | |||||||||||||||||||||||
Other liabilities (3, 4) | 772,770 | 645,760 | |||||||||||||||||||||||
| Owners’ equity | 57,303 | 58,544 | |||||||||||||||||||||||
| Total liabilities and owners’ equity | 2,023,480 | 2,040,685 | |||||||||||||||||||||||
| Percentage of liabilities applicable to overseas operations | 45.8 | % | 47.2 | % | |||||||||||||||||||||
Notes:
| (1) | The analysis into UK and Overseas has been compiled on the basis of location of office. |
(2) | Interest-earning assets and interest-bearing liabilities include the Retail bancassurance assets and liabilities attributable to policyholders. |
(3) | Interest income and interest expense do not include interest on financial assets and liabilities designated as at fair value through profit or loss. |
(4) | Interest receivable and interest payable on trading assets and liabilities are included in income from trading activities. |
29
Business review continued |
Average balance sheet and related interest
| 2007 | |||||||||||||
Average Balance | Interest | Rate | |||||||||||
| £m | £m | % | |||||||||||
| Assets | |||||||||||||
| Loans and advances to banks | – UK | 21,133 | 1,024 | 4.85 | |||||||||
| – Overseas | 12,654 | 546 | 4.31 | ||||||||||
| Loans and advances to customers | – UK | 268,911 | 18,506 | 6.88 | |||||||||
| – Overseas | 175,301 | 10,062 | 5.74 | ||||||||||
| Debt securities | – UK | 10,883 | 600 | 5.51 | |||||||||
| – Overseas | 31,792 | 1,514 | 4.76 | ||||||||||
| Total interest-earning assets | – banking business (2, 3) | 520,674 | 32,252 | 6.19 | |||||||||
– trading business (4) | 313,110 | ||||||||||||
| Total interest-earning assets | 833,784 | ||||||||||||
Non-interest-earning assets (2, 3) | 289,188 | ||||||||||||
| Total assets | 1,122,972 | ||||||||||||
Percentage of assets applicable to overseas operations | 38.0 | % | |||||||||||
| Liabilities and owners’ equity | |||||||||||||
| Deposits by banks | – UK | 52,951 | 2,234 | 4.22 | |||||||||
| – Overseas | 31,073 | 1,172 | 3.77 | ||||||||||
| Customer accounts: demand deposits | – UK | 93,764 | 3,296 | 3.52 | |||||||||
| – Overseas | 30,739 | 1,031 | 3.35 | ||||||||||
| Customer accounts: savings deposits | – UK | 36,334 | 1,658 | 4.56 | |||||||||
| – Overseas | 27,645 | 902 | 3.26 | ||||||||||
| Customer accounts: other time deposits | – UK | 88,089 | 4,201 | 4.77 | |||||||||
| – Overseas | 43,141 | 2,100 | 4.87 | ||||||||||
| Debt securities in issue | – UK | 57,140 | 3,060 | 5.36 | |||||||||
| – Overseas | 49,848 | 2,627 | 5.27 | ||||||||||
| Subordinated liabilities | – UK | 23,502 | 1,300 | 5.53 | |||||||||
| – Overseas | 4,509 | 230 | 5.10 | ||||||||||
| Internal funding of trading business | – UK | (68,395 | ) | (3,307 | ) | 4.84 | |||||||
| – Overseas | (7,454 | ) | (321 | ) | 4.31 | ||||||||
| Total interest-bearing liabilities | – banking business (2, 3) | 462,886 | 20,183 | 4.36 | |||||||||
– trading business (4) | 316,453 | ||||||||||||
| Total interest-bearing liabilities | 779,339 | ||||||||||||
| Non-interest-bearing liabilities: | |||||||||||||
| Demand deposits | – UK | 18,416 | |||||||||||
| – Overseas | 14,455 | ||||||||||||
Other liabilities (3, 4) | 267,403 | ||||||||||||
| Owners’ equity | 43,359 | ||||||||||||
| Total liabilities and owners’ equity | 1,122,972 | ||||||||||||
| Percentage of liabilities applicable to overseas operations | 35.9 | % | |||||||||||
Notes:
| (1) | The analysis into UK and Overseas has been compiled on the basis of location of office. |
| (2) | Interest-earning assets and interest-bearing liabilities include the Retail bancassurance assets and liabilities attributable to policyholders. |
| (3) | Interest income and interest expense do not include interest on financial assets and liabilities designated as at fair value through profit or loss. |
| (4) | Interest receivable and interest payable on trading assets and liabilities are included in income from trading activities. |
30
Business review continued |
Analysis of change in net interest income – volume and rate analysis
Volume and rate variances have been calculated based on movements in average balances over the period and changes in interest rates on average interest-earning assets and average interest-bearing liabilities. Changes due to a combination of volume and rate are allocated pro rata to volume and rate movements.
| 2009 over 2008 | 2008 over 2007 | |||||||||||||||||||||||
| Increase/(decrease) due to changes in: | Increase/(decrease) due to changes in: | |||||||||||||||||||||||
| Average | Average | Net | Average | Average | Net | |||||||||||||||||||
| volume | rate | change | volume | rate | change | |||||||||||||||||||
| £m | £m | £m | £m | £m | £m | |||||||||||||||||||
| Interest-earning assets | ||||||||||||||||||||||||
| Loans and advances to banks | ||||||||||||||||||||||||
| UK | 113 | (742 | ) | (629 | ) | (103 | ) | 18 | (85 | ) | ||||||||||||||
| Overseas | 43 | (847 | ) | (804 | ) | 845 | 26 | 871 | ||||||||||||||||
| Loans and advances to customers | ||||||||||||||||||||||||
| UK | 775 | (7,881 | ) | (7,106 | ) | 3,221 | (2,681 | ) | 540 | |||||||||||||||
| Overseas | (949 | ) | (5,478 | ) | (6,427 | ) | 12,621 | 83 | 12,704 | |||||||||||||||
| Debt securities | ||||||||||||||||||||||||
| UK | 594 | (456 | ) | 138 | 906 | (230 | ) | 676 | ||||||||||||||||
| Overseas | (38 | ) | (820 | ) | (858 | ) | 2,564 | — | 2,564 | |||||||||||||||
| Total interest receivable of the banking business | ||||||||||||||||||||||||
| UK | 1,482 | (9,079 | ) | (7,597 | ) | 4,024 | (2,893 | ) | 1,131 | |||||||||||||||
| Overseas | (944 | ) | (7,145 | ) | (8,089 | ) | 16,030 | 109 | 16,139 | |||||||||||||||
| 538 | (16,224 | ) | (15,686 | ) | 20,054 | (2,784 | ) | 17,270 | ||||||||||||||||
| Interest-bearing liabilities | ||||||||||||||||||||||||
| Deposits by banks | ||||||||||||||||||||||||
| UK | 683 | 442 | 1,125 | 481 | (51 | ) | 430 | |||||||||||||||||
| Overseas | 360 | 2,050 | 2,410 | (3,708 | ) | 108 | (3,600 | ) | ||||||||||||||||
| Customer accounts: demand deposits | ||||||||||||||||||||||||
| UK | (268 | ) | 2,528 | 2,260 | 117 | 350 | 467 | |||||||||||||||||
| Overseas | (228 | ) | 410 | 182 | (376 | ) | (105 | ) | (481 | ) | ||||||||||||||
| Customer accounts: savings deposits | ||||||||||||||||||||||||
| UK | (369 | ) | 1,297 | 928 | (29 | ) | (21 | ) | (50 | ) | ||||||||||||||
| Overseas | (306 | ) | 395 | 89 | (1,248 | ) | (53 | ) | (1,301 | ) | ||||||||||||||
| Customer accounts: other time deposits | ||||||||||||||||||||||||
| UK | 881 | 2,198 | 3,079 | 75 | 115 | 190 | ||||||||||||||||||
| Overseas | 1,175 | 667 | 1,842 | (1,751 | ) | (246 | ) | (1,997 | ) | |||||||||||||||
| Debt securities in issue | ||||||||||||||||||||||||
| UK | (540 | ) | 1,805 | 1,265 | (785 | ) | (250 | ) | (1,035 | ) | ||||||||||||||
| Overseas | 609 | 2,737 | 3,346 | (2,930 | ) | (289 | ) | (3,219 | ) | |||||||||||||||
| Subordinated liabilities | ||||||||||||||||||||||||
| UK | 13 | 509 | 522 | (36 | ) | (20 | ) | (56 | ) | |||||||||||||||
| Overseas | (5 | ) | 137 | 132 | (588 | ) | 30 | (558 | ) | |||||||||||||||
| Internal funding of trading business | ||||||||||||||||||||||||
| UK | (795 | ) | (2,333 | ) | (3,128 | ) | 83 | 55 | 138 | |||||||||||||||
| Overseas | (112 | ) | (425 | ) | (537 | ) | 390 | 18 | 408 | |||||||||||||||
| Total interest payable of the banking business | ||||||||||||||||||||||||
| UK | (395 | ) | 6,446 | 6,051 | (94 | ) | 178 | 84 | ||||||||||||||||
| Overseas | 1,493 | 5,971 | 7,464 | (10,211 | ) | (537 | ) | (10,748 | ) | |||||||||||||||
| 1,098 | 12,417 | 13,515 | (10,305 | ) | (359 | ) | (10,664 | ) | ||||||||||||||||
| Movement in net interest income | ||||||||||||||||||||||||
| UK | 1,087 | (2,633 | ) | (1,546 | ) | 3,930 | (2,715 | ) | 1,215 | |||||||||||||||
| Overseas | 549 | (1,174 | ) | (625 | ) | 5,819 | (428 | ) | 5,391 | |||||||||||||||
| 1,636 | (3,807 | ) | (2,171 | ) | 9,749 | (3,143 | ) | 6,606 | ||||||||||||||||
Note:
| (1) | The analysis into UK and Overseas has been compiled on the basis of location of office. |
31
Business review continued |
Non-interest income
| 2009 | 2008 | 2007 | |
| £m | £m | £m | |
| Fees and commissions receivable | 9,831 | 9,831 | 8,278 |
| Fees and commissions payable | (2,822) | (2,386) | (2,193) |
| Income/(loss) from trading activities | 3,881 | (8,477) | 1,292 |
| Gain on redemption of own debt | 3,790 | — | — |
| Other operating income (excluding insurance net premium income) | 1,962 | 1,899 | 4,833 |
| 16,642 | 867 | 12,210 | |
| Insurance premium income | 5,807 | 6,626 | 6,376 |
| Reinsurers’ share | (263) | (300) | (289) |
| 5,544 | 6,326 | 6,087 | |
| 22,186 | 7,193 | 18,297 |
2009 compared with 2008
Net fees and commissions fell by £436 million primarily due to the withdrawal of the single premium payment protection insurance product and the restructuring of current account overdraft fees within UK Retail during the year, as well as to reduced fees received in Non-Core. This was partially offset by improved performance in GBM (£112 million) and US Retail & Commercial (£50 million).
Income from trading activities rose substantially during the year by £12,358 million, principally due to lower credit market losses reflecting improved underlying asset prices compared with 2008. Increased market volatility and strong customer demand in a positive trading environment also contributed to this improvement.
In the second quarter of 2009 the Group recorded a gain of £3,790 million on a liability management exercise to redeem a number of Tier 1 and upper Tier 2 securities.
Other operating income increased by £63 million. This improvement reflected a small gain in the fair value of securities and other assets and liabilities compared with a loss of £1.4 billion in 2008. This was partially offset by lower profits on sales of securities and properties and reduced dividend income, together with a loss on sale of subsidiaries and associates of £0.1 billion compared with a profit of £0.9 billion in 2008, which included a gain of £600 million on the sale of Angel Trains.
Insurance net premium income fell by £782 million principally reflecting lower bancassurance fees, and lower general insurance premiums.
2008 compared with 2007
Non-interest income, decreased by 61%, £11,104 million to £7,193 million. Non-interest income was severely affected by the weakness in financial markets experienced over the course of the year. While the decline was particularly marked in Global Banking & Markets and Non-Core credit markets and equities businesses, with reduced business volumes and mounting mark-to-market trading losses, UK Retail also saw non-interest income fall in the latter part of the year as declining consumer confidence led to lower demand for credit and other financial products.
Excluding general insurance premium income, non-interest income fell by £11,343 million to £867 million.
Within non-interest income, fees and commissions receivable increased by 19% or £1,553 million, to £9,831 million, while fees and commissions payable increased by 9%, £193 million to £2,386 million.
Income from trading activities was down from £1,292 million to a loss of £8,477 million. Currency trading activities benefited from increased volatility in the markets. However, this improvement was more than offset by substantial credit market write downs during the year.
Other operating income also decreased, falling by 61%, £2,934 million to £1,899 million. This was principally due to a fall in the fair value of securities and other financial assets and liabilities partially offset by profits from the sale of subsidiaries and associates.
Insurance premium income, after reinsurance, increased by 4% to £6,326 million primarily reflecting a full year of ABN AMRO businesses in comparison with 76 days in 2007. This was partly offset by the discontinuation of less profitable partnership contracts.
32
Business review continued |
Operating expenses
2009 | Restated (1) 2008 | 2007 | ||||||||||
| £m | £m | £m | ||||||||||
| Administrative expenses: | ||||||||||||
| Staff costs | ||||||||||||
| – excluding gains on pensions curtailment | 11,783 | 10,410 | 7,338 | |||||||||
| – gains on pensions curtailment | (2,148 | ) | — | — | ||||||||
| Premises and equipment | 3,087 | 2,593 | 1,703 | |||||||||
| Other administrative expenses | 5,584 | 5,464 | 2,969 | |||||||||
| Total administrative expenses | 18,306 | 18,467 | 12,010 | |||||||||
| Depreciation and amortisation | 2,809 | 3,154 | 1,932 | |||||||||
| Write-down of goodwill and other intangible assets | 363 | 32,581 | — | |||||||||
| 21,478 | 54,202 | 13,942 | ||||||||||
Note:
| (1) | The results for 2008 have been restated for the amendment to IFRS 2 ‘Share-based Payment’. This has resulted in an increase in staff costs amounting to £169 million. |
2009 compared with 2008
Staff costs, excluding pension schemes curtailment gains, were up £1,373 million with most of the movement relating to adverse movements in foreign exchange rates and some salary inflation. Changes in incentive compensation, primarily in Global Banking & Markets, represented most of the remaining change.
Pension curtailment gains of £2,148 million were recognised in 2009 arising from changes to prospective pension benefits in the defined benefit scheme and certain other subsidiary schemes.
Premises and equipment costs rose by £494 million primarily due to the impact of expanded Group premises in London and the US.
Other expenses fell by £120 million due to integration benefits in GBM partially offset by increased deposit insurance levies in the US.
2008 compared with 2007
Operating expenses increased by £40,260 million to £54,202 million, primarily reflecting the write-down of goodwill and other assets of £32,581 million following a review of the carrying value of goodwill and other assets. Cost growth in the Group’s core retail and commercial banking franchises was offset by efficiency programmes. The 2008 costs reflect a full year of the retained ABN AMRO businesses in comparison with 76 days in 2007.
33
Business review continued |
Integration costs
| 2009 | 2008 | 2007 | ||||||||||
| £m | £m | £m | ||||||||||
| Staff costs | 365 | 503 | 18 | |||||||||
| Premises and equipment | 78 | 25 | 4 | |||||||||
| Other administrative expenses | 398 | 486 | 26 | |||||||||
| Depreciation and amortisation | 18 | 36 | 60 | |||||||||
| 859 | 1,050 | 108 | ||||||||||
2009 compared with 2008
Integration costs in 2009 were £859 million compared with £1,050 million in 2008. Integration and restructuring costs decreased primarily due to restructuring activity resulting from the strategic review undertaken earlier in the year. This was more than offset by lower ABN AMRO integration activity during the year.
2008 compared with 2007
Integration costs in 2008 were £1,050 million compared with £108 million in 2007. The significant increase reflects a full year of integration costs being incurred in respect of the ABN AMRO acquisition, compared to 76 days in 2007.
Accruals in relation to integration costs are set out below.
At 31 December 2007 | At 31 December 2008 | Currency translation adjustments | Charge to income statement | Utilised .during the year | At 31 December 2009 | |||||||||||||||||||
| £m | £m | £m | £m | £m | £m | |||||||||||||||||||
| Staff costs – redundancy | — | — | — | 158 | (158 | ) | — | |||||||||||||||||
| Staff costs – other | 4 | 5 | — | 207 | (212 | ) | — | |||||||||||||||||
| Premises and equipment | 2 | 1 | — | 78 | (39 | ) | 40 | |||||||||||||||||
| Other | 1 | 3 | — | 416 | (418 | ) | 1 | |||||||||||||||||
| 7 | 9 | — | 859 | (827 | ) | 41 | ||||||||||||||||||
Restructuring costs
| 2009 | 2008 | 2007 | ||||||||||
| £m | £m | £m | ||||||||||
| Staff costs | 328 | 251 | — | |||||||||
| Premises and equipment | 48 | 15 | — | |||||||||
| Other administrative expenses | 51 | 41 | — | |||||||||
| 427 | 307 | — | ||||||||||
Accruals in relation to restructuring costs are set out below.
| At | At | Currency | Charge | Utilised | At | |||||||||||||||||||
| 31 December | 31 December | translation | to income | during | 31 December | |||||||||||||||||||
| 2007 | 2008 | adjustments | statement | the year | 2009 | |||||||||||||||||||
| £m | £m | £m | £m | £m | £m | |||||||||||||||||||
| Staff costs – redundancy | — | 284 | (13 | ) | 299 | (315 | ) | 255 | ||||||||||||||||
| Staff costs – other | — | — | — | 29 | (25 | ) | 4 | |||||||||||||||||
| Premises and equipment | — | 15 | — | 48 | (26 | ) | 37 | |||||||||||||||||
| Other | — | 51 | (4 | ) | 51 | (63 | ) | 35 | ||||||||||||||||
| — | 350 | (17 | ) | 427 | (429 | ) | 331 | |||||||||||||||||
34
Business review continued |
Impairment losses
| 2009 | 2008 | 2007 | ||||||||||
| £m | £m | £m | ||||||||||
| New impairment losses | 15,349 | 8,391 | 2,310 | |||||||||
| less: recoveries of amounts previously written-off | (399 | ) | (319 | ) | (342 | ) | ||||||
| Charge to income statement | 14,950 | 8,072 | 1,968 | |||||||||
| Comprising: | ||||||||||||
| Loan impairment losses | 14,134 | 7,091 | 1,946 | |||||||||
| Impairment of available-for-sale securities | 816 | 981 | 22 | |||||||||
| Charge to income statement | 14,950 | 8,072 | 1,968 | |||||||||
Refer to pages 98 to 101 for additional analysis.
2009 compared with 2008
Impairment losses were £14,950 million compared with £8,072 million. Impairment losses in the Core divisions increased by £2,182 million, Non-Core losses increased by £4,285 million and RFS Holdings minority interest losses increased by £411 million.
In the Core business, the biggest increases were in UK Retail, UK Corporate and Ulster Bank, reflecting the difficult economic environment.
Non-Core losses also increased substantially, particularly across the corporate and property sectors.
2008 compared with 2007
Credit impairment losses increased to £8,072 million in 2008, compared with £1,968 million in 2007. The Group experienced a pronounced deterioration in impairments during the year, as financial stress spread to a broad range of customers. The greatest increase in impairments occurred in Non-Core and Global Banking & Markets. However, businesses in all geographies also experienced a noticeable increase in impairments during the year, particularly in the UK SME and US personal segments.
Total balance sheet provisions for impairment amounted to £11,016 million compared with £6,452 million in 2007.
Total provision coverage (the ratio of total balance sheet provisions for impairment to total risk elements in lending) decreased from 60% to 52%. The ratio of total balance sheet provisions for impairment to total risk elements in lending and potential problem loans also decreased to 51% compared with 57% in 2007.
35
Business review continued |
Credit market exposures
| 2009 | 2008 | |||||||
Credit and other market losses (1) | £m | £m | ||||||
| Monoline exposures | 2,387 | 3,093 | ||||||
| CDPCs | 957 | 615 | ||||||
Asset-backed products (2) | 288 | 4,778 | ||||||
| Other credit exotics | 558 | 947 | ||||||
| Equities | 47 | 948 | ||||||
| Leveraged finance | — | 1,088 | ||||||
| Banking book hedges | 1,727 | (1,642 | ) | |||||
| Other | 188 | 268 | ||||||
| Group | 6,152 | 10,095 | ||||||
Notes:
| (1) | Included in ‘Income/(loss) from trading activities’. |
| (2) | Includes super senior asset-backed structures and other asset-backed products. |
2009 compared with 2008
Losses relating to monoline exposures were £2,387 million in 2009 compared with £3,093 million in 2008.
| • | The credit quality of the monolines has continued to deteriorate and the level of CVA held against exposures to monoline counterparties has increased from 52% to 62% during the year. This was driven by a combination of wider credit spreads and lower recovery rates. |
| • | The gross exposure to monoline counterparties has decreased primarily due to a combination of higher prices of underlying reference instruments and restructuring certain exposures. |
| • | The increase in CVA resulting from the credit quality deterioration was partially offset by the decrease in CVA requirement following the reduction in gross exposure due to higher prices of underlying reference instruments. Consequently the net losses incurred in this regard were lower than in 2008 when there was both an increase in gross exposure and deterioration in credit quality. |
Losses relating to CDPC exposures were £957 million in 2009 compared with £615 million in 2008.
| • | The credit quality of the CDPCs has continued to deteriorate and the level of CVA held against exposures to CDPC counterparties has increased from 27% to 39% during the year. |
| • | The gross exposure to CDPC counterparties has reduced primarily due to a combination of tighter credit spreads of the underlying reference loans and bonds, and a decrease in the relative value of senior tranches compared with the underlying reference portfolios. |
| • | The decrease in CVA requirement following the reduction in gross exposure was partially offset by the increase in CVA requirement resulting from the credit quality deterioration. Consequently there were net gains in this regard in 2009 compared with losses in 2008 when there was both an increase in gross exposure and deterioration in credit quality. |
| • | Net losses were incurred in 2009 due to hedges put in place at the end of 2008 and during 2009 which effectively cap the exposure to certain CDPCs. As the exposure to these CDPCs has reduced, losses have been incurred on the hedges. |
Losses relating to asset-backed products were £288 million in 2009 compared with £4,778 million in 2008.
| • | Losses reported in 2009 primarily relate to super senior CDOs. The significant price declines of the underlying predominantly mortgage-backed securities seen in 2008 were not repeated in 2009. |
| • | Losses on other mortgage backed securities were greatly reduced in 2009 as many of these positions were sold or substantially written down in 2008 resulting in reduced net exposure in 2009. |
Losses relating to credit exotics were £558 million in 2009 compared with £947 million in 2008. These losses were reduced in 2009 as hedges were put in place to mitigate the risk.
Leveraged finance assets were reclassified on 1 July 2009. Changes in the fair value of these assets are only recognised in the income statement to the extent that they are considered impairments.
Losses relating to banking book hedges were £1,727 million in 2009 compared with profits of £1,642 million in 2008. These trades hedge counterparty risk that arises from loans and bonds on the regulatory banking book. As credit spreads have generally tightened in 2009 the value of these hedges has decreased resulting in losses. These hedges gave rise to gains in 2008 due to credit spreads generally widening.
36
Business review continued |
Additional disclosures on these and other related exposures can be found in the following sections:
| Disclosure | Section | Sub-section | Page | |||
| Further analysis of credit market exposures | Risk and capital management | Market turmoil exposures | 137 | |||
| Valuation aspects | Financial statements | Note 11 Financial instruments | 234 | |||
| Financial statements | Critical accounting policies | 211 | ||||
| Reclassification of financial instruments | Financial statements | Note 11 Financial instruments | 231 |
Taxation
| 2009 | 2008 | 2007 | ||||||||||
| £m | £m | £m | ||||||||||
| Tax credit/(charge) | 371 | 2,323 | (2,044 | ) | ||||||||
| % | % | % | ||||||||||
| UK corporation tax rate | 28.0 | 28.5 | 30.0 | |||||||||
| Effective tax rate | 14.3 | 5.7 | 20.8 | |||||||||
The actual tax credit differs from the expected tax credit computed by applying the standard rate of UK corporation tax as follows:
| 2009 | 2008 | 2007 | ||||||||||
| £m | £m | £m | ||||||||||
| Expected tax credit/(charge) | 727 | 11,638 | (2,950 | ) | ||||||||
| Non-deductible goodwill impairment | (102 | ) | (8,292 | ) | (12 | ) | ||||||
| Unrecognised timing differences | 274 | (274 | ) | (29 | ) | |||||||
| Other non-deductible items | (508 | ) | (378 | ) | (222 | ) | ||||||
| Non-taxable items: | ||||||||||||
| – gain on redemption of own debt | 693 | — | — | |||||||||
| – other | 410 | 491 | 595 | |||||||||
| Taxable foreign exchange movements | 1 | (80 | ) | (16 | ) | |||||||
| Reduction in deferred tax liability following change in the rate of UK corporation tax | — | — | 189 | |||||||||
| Foreign profits taxed at other rates | (320 | ) | (203 | ) | 25 | |||||||
| Losses in year not recognised | (780 | ) | (942 | ) | (2 | ) | ||||||
| Losses brought forward and utilised | 94 | 11 | 11 | |||||||||
| Adjustments in respect of prior periods | (118 | ) | 352 | 367 | ||||||||
| Actual tax credit/(charge) | 371 | 2,323 | (2,044 | ) | ||||||||
The effective tax rate for the year was 14.3% (2008 – 5.7%; 2007 – 20.8%). The tax credit is lower than that arising from applying the standard rate of UK corporation tax of 28% to the loss for the period, principally due to certain carried forward losses on which no tax relief has been recognised.
37
Business review continued |
Divisional performance
The results of each division are set out below. The results are stated before amortisation of purchased intangible assets, write-down of goodwill and other intangible assets, integration and restructuring costs, gain on redemption of own debt, strategic disposals, gains on pensions curtailment and bonus tax.
Business Services directly attributable costs have been allocated to the operating divisions, based on their service usage. Where services span more than one division an appropriate measure is used to allocate the costs on a basis which management considers reasonable. Business Services costs are fully allocated and there are no residual unallocated costs.
Group Centre directly attributable costs have been allocated to the operating divisions, based on their service usage. Where services span more than one division, the costs are allocated on a basis management considers reasonable. The residual unallocated costs remaining in the Group centre relate to volatile corporate items that do not naturally reside within a division.
Treasury costs are allocated to operating divisions as follows: term funding costs are allocated or rewarded based on long term funding gap or surplus; liquidity buffer funding costs are allocated based on share of overall liquidity buffer derived from divisional stresses; and capital cost or benefit is allocated based on share of divisional risk-adjusted RWAs.
| 2009 | 2008 | 2007 | ||||||||||
| £m | £m | £m | ||||||||||
| UK Retail | 229 | 723 | 1,232 | |||||||||
| UK Corporate | 1,125 | 1,781 | 1,803 | |||||||||
| Wealth | 420 | 348 | 491 | |||||||||
| Global Banking & Markets | 5,709 | (1,796 | ) | 1,024 | ||||||||
| Global Transaction Services | 973 | 1,002 | 895 | |||||||||
| Ulster Bank | (368 | ) | 218 | 317 | ||||||||
| US Retail & Commercial | (113 | ) | 528 | 743 | ||||||||
| RBS Insurance | 58 | 584 | 542 | |||||||||
| Central items | 292 | 1,025 | 845 | |||||||||
| Core | 8,325 | 4,413 | 7,892 | |||||||||
| Non-Core | (14,557 | ) | (11,351 | ) | 2,147 | |||||||
| (6,232 | ) | (6,938 | ) | 10,039 | ||||||||
| Reconciling items | ||||||||||||
| RFS Holdings minority interest | (304 | ) | 41 | 163 | ||||||||
| Amortisation of purchased intangible assets | (272 | ) | (443 | ) | (262 | ) | ||||||
| Write-down of goodwill and other intangible assets | (363 | ) | (32,581 | ) | — | |||||||
| Integration and restructuring costs | (1,286 | ) | (1,357 | ) | (108 | ) | ||||||
| Gain on redemption of own debt | 3,790 | — | — | |||||||||
| Strategic disposals | 132 | 442 | — | |||||||||
| Gains on pensions curtailment | 2,148 | — | — | |||||||||
| Bonus tax | (208 | ) | — | — | ||||||||
| Group operating (loss)/profit before tax | (2,595 | ) | (40,836 | ) | 9,832 | |||||||
The performance of each of the divisions is reviewed on pages 40 to 64.
| 2009 | 2008 | 2007 | ||||||||||
| Impairment losses by division | £m | £m | £m | |||||||||
| UK Retail | 1,679 | 1,019 | 975 | |||||||||
| UK Corporate | 927 | 319 | 178 | |||||||||
| Wealth | 33 | 16 | 3 | |||||||||
| Global Banking & Markets | 640 | 522 | 66 | |||||||||
| Global Transaction Services | 39 | 54 | 14 | |||||||||
| Ulster Bank | 649 | 106 | 46 | |||||||||
| US Retail & Commercial | 702 | 437 | 246 | |||||||||
| RBS Insurance | 8 | 42 | — | |||||||||
| Central items | 1 | (19 | ) | 3 | ||||||||
| Core | 4,678 | 2,496 | 1,531 | |||||||||
| Non-Core | 9,221 | 4,936 | 399 | |||||||||
| 13,899 | 7,432 | 1,930 | ||||||||||
| Reconciling item | ||||||||||||
| RFS Holdings minority interest | 1,051 | 640 | 38 | |||||||||
| Group impairment losses | 14,950 | 8,072 | 1,968 | |||||||||
38
Business review continued |
| 2009 | 2008 | 2007(1) | |||||||
| Net interest margin by division | % | % | % | ||||||
| UK Retail | 3.59 | 3.58 | |||||||
| UK Corporate | 2.22 | 2.40 | |||||||
| Wealth | 4.38 | 4.51 | |||||||
| Global Banking & Markets | 1.38 | 1.34 | |||||||
| Global Transaction Services | 9.22 | 8.25 | |||||||
| Ulster Bank | 1.87 | 1.89 | |||||||
| US Retail & Commercial | 2.37 | 2.68 | |||||||
| Non-Core | 0.69 | 0.87 | |||||||
| Group | 1.83 | 2.12 | 2.32 | ||||||
| 2009 | 2008 | 2007(1) | |||||||
| Risk-weighted assets by division | £bn | £bn | £bn | ||||||
| UK Retail | 51.3 | 45.7 | |||||||
| UK Corporate | 90.2 | 85.7 | |||||||
| Wealth | 11.2 | 10.8 | |||||||
| Global Banking & Markets | 123.7 | 151.8 | |||||||
| Global Transaction Services | 19.1 | 17.4 | |||||||
| Ulster Bank | 29.9 | 24.5 | |||||||
| US Retail & Commercial | 59.7 | 63.9 | |||||||
| Other | 9.4 | 7.1 | |||||||
| Core | 394.5 | 406.9 | |||||||
| Non-Core | 171.3 | 170.9 | |||||||
| Group before benefit of APS | 565.8 | 577.8 | 490.0 | ||||||
| Benefit of APS | (127.6 | ) | — | — | |||||
| Group before RFS Holdings minority interest | 438.2 | 577.8 | 490.0 | ||||||
| RFS Holdings minority interest | 102.8 | 118.0 | 119.0 | ||||||
| Total | 541.0 | 695.8 | 609.0 | ||||||
Note
| (1) | As noted on page 5, following a comprehensive strategic review, changes have been made to the Group’s operating segments in 2009. The company has also improved the granularity of certain segment information resulting in the provision of supplementary disclosures. However, it is not possible to source certain elements of these supplementary disclosures for 2007 without undue cost. |
39
Business review continued |
UK Retail
| 2009 | 2008 | 2007(2) | ||||||||||
| £m | £m | £m | ||||||||||
| Net interest income | 3,452 | 3,187 | 3,230 | |||||||||
| Net fees and commissions | 1,320 | 1,577 | 1,754 | |||||||||
| Other non-interest income | 309 | 358 | 754 | |||||||||
| Non–interest income | 1,629 | 1,935 | 2,508 | |||||||||
| Total income | 5,081 | 5,122 | 5,738 | |||||||||
| Direct expenses | ||||||||||||
| – staff | (845 | ) | (924 | ) | (936 | ) | ||||||
| – other | (421 | ) | (421 | ) | (424 | ) | ||||||
| Indirect expenses | (1,773 | ) | (1,851 | ) | (1,653 | ) | ||||||
| (3,039 | ) | (3,196 | ) | (3,013 | ) | |||||||
| Insurance net claims | (134 | ) | (184 | ) | (518 | ) | ||||||
| Impairment losses | (1,679 | ) | (1,019 | ) | (975 | ) | ||||||
| Operating profit before tax | 229 | 723 | 1,232 | |||||||||
| Analysis of income by product | ||||||||||||
| Personal advances | 1,192 | 1,244 | ||||||||||
| Personal deposits | 1,349 | 2,037 | ||||||||||
| Mortgages | 1,214 | 500 | ||||||||||
| Bancassurance | 380 | 401 | ||||||||||
| Cards | 869 | 831 | ||||||||||
| Other | 77 | 109 | ||||||||||
| Total income | 5,081 | 5,122 | 5,738 | |||||||||
| Analysis of impairment by sector | ||||||||||||
| Mortgages | 124 | 31 | ||||||||||
| Personal | 1,023 | 568 | ||||||||||
| Cards | 532 | 420 | ||||||||||
| Total impairment | 1,679 | 1,019 | 975 | |||||||||
| Loan impairment charge as % of gross customer loans and advances by sector | ||||||||||||
| Mortgages | 0.15 | % | 0.04 | % | ||||||||
| Personal | 7.52 | % | 3.71 | % | ||||||||
| Cards | 8.58 | % | 6.67 | % | ||||||||
| 1.63 | % | 1.09 | % | |||||||||
| Performance ratios | ||||||||||||
Return on equity (1) | 4.2 | % | 13.1 | % | ||||||||
| Net interest margin | 3.59 | % | 3.58 | % | ||||||||
| Cost:income ratio | 59.8 | % | 62.4 | % | 52.5 | % | ||||||
| £bn | £bn | £bn | ||||||||||
| Capital and balance sheet | ||||||||||||
| Loans and advances to customers – gross | 86.6 | |||||||||||
| – mortgages | 83.2 | 72.2 | ||||||||||
| – personal | 13.6 | 15.3 | ||||||||||
| – cards | 6.2 | 6.3 | ||||||||||
| Customer deposits (excluding bancassurance) | 87.2 | 78.9 | 76.1 | |||||||||
| Assets under management (excluding deposits) | 5.3 | 5.7 | 7.0 | |||||||||
| Risk elements in lending | 4.6 | 3.8 | ||||||||||
| Loan:deposit ratio (excluding repos) | 115 | % | 116 | % | ||||||||
| Risk-weighted assets | 51.3 | 45.7 | ||||||||||
Notes
| (1) | Return on equity is based on divisional operating profit after tax, divided by divisional notional equity (based on 7% of divisional risk-weighted assets, adjusted for capital deductions). |
| (2) | As noted on page 5, following a comprehensive strategic review, changes have been made to the Group’s operating segments in 2009. The company has also improved the granularity of certain segment information resulting in the provision of supplementary disclosures. However, it is not possible to source certain elements of these supplementary disclosures for 2007 without undue cost. |
40
Business review continued |
2009 compared with 2008
Operating profit before tax of £229 million was £494 million lower than in 2008. Profit before impairments was up £166 million or 10%, but impairments rose by £660 million as the economic environment deteriorated, albeit with signs of conditions stabilising in the second half of the year.
The division has focused in 2009 on growing secured lending to meet its Government targets while at the same time building customer deposits, thereby reducing the Group’s reliance on wholesale funding. Loans and advances to customers grew 10%, with a change in mix from unsecured to secured as the Group sought actively to reduce its risk profile, with 15% growth in mortgage lending and an 8% reduction in unsecured lending.
| • | Mortgage growth was due to good retention of existing customers and new business sourced predominantly from the existing customer base. Gross mortgage lending market share increased to 12% from 7% in 2008, with the Group on track to exceed its Government targets on net lending by £3 billion. |
| • | Customer deposits grew 11% on 2008 reflecting the strength of the UK Retail customer franchise, which outperformed the market in an increasingly competitive environment. Savings balances grew by £6 billion or 11% and account acquisition saw a 20% increase, with 2.2 million accounts opened. Personal current account balances increased by 12% on 2008 with a 3% growth in accounts to 12.8 million. |
Net interest income increased significantly by 8% to £3,452 million, driven by strong balance sheet growth. Net interest margin was flat at 3.59%, with decreasing liability margins in the face of stiff competition for deposits offsetting wider asset margins. The growth in mortgages and the reduction in higher margin unsecured balances also had a negative impact on the blended net interest margin.
Non-interest income declined 16% to £1,629 million, principally reflecting the withdrawal of the single premium payment protection insurance product and the restructuring of current account overdraft fees in the final quarter of 2009, with the annualised impact of the overdraft fee restructuring further affecting income in 2010. The weak economic environment presented little opportunity in 2009 to grow credit card, private banking and bancassurance fees.
Expenses decreased by 5%, with the cost:income ratio improving from 62% to 60%.
| • | Direct staff costs declined by 9%, as the division benefited from strong cost control, a focus on process re-engineering and a 10% reduction in headcount. |
| • | RBS continues to progress towards a more convenient, lower cost operating model, with over 4 million active users of online banking and a record share of new sales achieved through direct channels. More than 5.5 million accounts have switched to paperless statements and 254 branches now utilise automated cash deposit machines. |
Impairment losses increased 65% to £1,679 million reflecting the deterioration in the economic environment, and its impact on customer finances.
| • | The mortgage impairment charge was £124 million (2008 – £31 million) on a total book of £83.2 billion. Mortgage arrears rates stabilised in the second half of 2009 and remain well below the industry average, as reported by the Council of Mortgage Lenders. Repossessions show only a small increase on 2008, as the Group continues to support customers facing financial difficulties. |
| • | The unsecured lending impairment charge was £1,555 million (2008 – £988 million) on a book of £19.8 billion. Industry benchmarks for cards arrears showed a slightly improving trend in the final quarter of 2009, which is consistent with the Group’s experience. RBS continues to perform better than the market on arrears. |
Risk weighted assets increased by 12% to £51.3 billion due to higher lending and the upward pressure from procyclicality, more than offsetting the adoption of a through-the-cycle loss given default approach for mortgages.
2008 compared with 2007
Due to an economic environment which became markedly weaker in the second half of the year, UK Retail Banking saw an 11% decrease in total income to £5,122 million, whilst direct costs remained in line with 2007. However the deterioration in the macroeconomic environment resulted in a 5% increase in impairment losses. Consequently, operating profit before tax decreased 41%, to £723 million. In the personal segment, RBS retained top position and NatWest was again joint second for customer satisfaction amongst main high street banks. UK Retail continues to maintain availability of lending while managing risk exposure and focusing on supporting customers through a difficult economic environment.
Net interest income decreased 1% to £3,187 million. There was good volume growth coupled with improving new lending margins. Spot loans and advances to customers increased 8% and average deposits were up 4%. Despite increasing competitive pressure in a slowing market, at year end deposit balances were £3 billion higher than in 2007. Net interest margin reduced to 3.58%, reflecting increased funding and liquidity costs.
UK Retail mortgage balances grew 12% despite more muted demand in the second half, and net mortgage lending market share increased to 18% (2007 – 2%). Personal unsecured lending slowed, however, particularly in the second half of the year.
41
Business review continued |
Non-interest income declined 23% to £1,935 million. Bancassurance sales grew 3% to £353 million annual premium equivalent in the year, however the negative performance of debt and equity markets reduced investment income by £48 million. Excluding BBU, non-interest income declined 20% reflecting reduced demand for unsecured lending and lower sales of payment protection insurance.
Direct expenses remained in line with 2007. Direct staff costs reduced 1% reflecting increased efficiency. Other direct costs rose by 2% as a result of increased investment in selected business lines. During 2008 the division almost doubled the number of branches open on a Saturday and introduced 1,000 MoneySense advisers into branches to provide impartial advice to customers on managing their money.
Impairment losses increased 5% to £1,019 million, reflecting the changed economic environment, particularly in the second half. The increase in impairments has been driven by mortgage impairment charges of £33 million (2007 – £21 million) on a total book of £72.3 billion, and a slight increase in unsecured personal lending impairments to £986 million (2007 – £954 million). Higher Loan-to-Value ratio mortgages have been restricted and affordability criteria tightened. The average LTV for new business was 67% (2007 – 63%). Repossessions represented 0.06% of outstanding mortgage balances at 31 December 2008, compared with a Council of Mortgage Lenders’ average at December 2008 of 0.21%.
Risk weighted assets totalled £45.7 billion at year end.
42
Business review continued |
UK Corporate
| 2009 | 2008 | 2007(2) | ||||||||||
| £m | £m | £m | ||||||||||
| Net interest income | 2,292 | 2,448 | 2,252 | |||||||||
| Net fees and commissions | 858 | 829 | 518 | |||||||||
| Other non-interest income | 432 | 460 | 709 | |||||||||
| Non–interest income | 1,290 | 1,289 | 1,227 | |||||||||
| Total income | 3,582 | 3,737 | 3,479 | |||||||||
| Direct expenses | ||||||||||||
| – staff | (753 | ) | (801 | ) | (721 | ) | ||||||
| – other | (268 | ) | (318 | ) | (295 | ) | ||||||
| Indirect expenses | (509 | ) | (518 | ) | (482 | ) | ||||||
| (1,530 | ) | (1,637 | ) | (1,498 | ) | |||||||
| Impairment losses | (927 | ) | (319 | ) | (178 | ) | ||||||
| Operating profit before tax | 1,125 | 1,781 | 1,803 | |||||||||
| Analysis of income by business | ||||||||||||
| Corporate and commercial lending | 2,401 | 2,166 | ||||||||||
| Asset and invoice finance | 232 | 241 | ||||||||||
| Corporate deposits | 985 | 1,266 | ||||||||||
| Other | (36 | ) | 64 | |||||||||
| Total income | 3,582 | 3,737 | 3,479 | |||||||||
| Analysis of impairment by sector | ||||||||||||
| Banks and financial institutions | 15 | 9 | ||||||||||
| Hotels and restaurants | 98 | 25 | ||||||||||
| Housebuilding and construction | 106 | 42 | ||||||||||
| Manufacturing | 51 | 14 | ||||||||||
| Other | 150 | 53 | ||||||||||
| Private sector education, health, social work, recreational and community services | 59 | 15 | ||||||||||
| Property | 259 | 24 | ||||||||||
| Wholesale and retail trade, repairs | 76 | 37 | ||||||||||
| Asset and invoice finance | 113 | 100 | ||||||||||
| Total impairment | 927 | 319 | 178 | |||||||||
| Loan impairment charge as % of gross customer loans and advances (excluding reverse repurchase agreements) by sector | ||||||||||||
| Banks and financial institutions | 0.29 | % | 0.17 | % | ||||||||
| Hotels and restaurants | 1.75 | % | 0.41 | % | ||||||||
| Housebuilding and construction | 3.12 | % | 0.81 | % | ||||||||
| Manufacturing | 1.38 | % | 0.26 | % | ||||||||
| Other | 0.36 | % | 0.14 | % | ||||||||
| Private sector education, health, social work, recreational and community services | 0.80 | % | 0.20 | % | ||||||||
| Property | 0.93 | % | 0.08 | % | ||||||||
| Wholesale and retail trade, repairs | 0.97 | % | 0.41 | % | ||||||||
| Asset and invoice finance | 1.33 | % | 1.18 | % | ||||||||
| 0.83 | % | 0.27 | % | |||||||||
| Performance ratios | ||||||||||||
Return on equity (1) | 10.3 | % | 18.0 | % | ||||||||
| Net interest margin | 2.22 | % | 2.40 | % | ||||||||
| Cost:income ratio | 42.7 | % | 43.8 | % | 43.1 | % | ||||||
Notes:
| (1) | Return on equity is based on divisional operating profit after tax, divided by divisional notional equity (based on 8% of divisional risk-weighted assets, adjusted for capital deductions). |
| (2) | As noted on page 5, following a comprehensive strategic review, changes have been made to the Group’s operating segments in 2009. The company has also improved the granularity of certain segment information resulting in the provision of supplementary disclosures. However, it is not possible to source certain elements of these supplementary disclosures for 2007 without undue cost. |
43
Business review continued |
| 2009 | 2008 | 2007(2) | ||||||||||
| £bn | £bn | £bn | ||||||||||
| Capital and balance sheet | ||||||||||||
| Total assets | 114.9 | 121.0 | ||||||||||
| Loans and advances to customers – gross | 101.5 | |||||||||||
| – Banks and financial institutions | 5.2 | 5.4 | ||||||||||
| – Hotels and restaurants | 5.6 | 6.1 | ||||||||||
| – Housebuilding and construction | 3.4 | 5.2 | ||||||||||
| – Manufacturing | 3.7 | 5.3 | ||||||||||
| – Other | 42.0 | 38.1 | ||||||||||
| – Private sector education, health, social work, recreational and community services | 7.4 | 7.4 | ||||||||||
| – Property | 28.0 | 31.8 | ||||||||||
| – Wholesale and retail trade, repairs | 7.8 | 9.1 | ||||||||||
| – Asset and invoice finance | 8.5 | 8.5 | ||||||||||
| Customer deposits | 87.8 | 82.0 | 83.4 | |||||||||
| Risk elements in lending | 2.3 | 1.3 | ||||||||||
| Loan:deposit ratio | 126 | % | 142 | % | ||||||||
| Risk-weighted assets | 90.2 | 85.7 | ||||||||||
Notes:
| (1) | Return on equity is based on divisional operating profit after tax, divided by divisional notional equity (based on 8% of divisional risk-weighted assets, adjusted for capital deductions). |
| (2) | As noted on page 5, following a comprehensive strategic review, changes have been made to the Group’s operating segments in 2009. The company has also improved the granularity of certain segment information resulting in the provision of supplementary disclosures. However, it is not possible to source certain elements of these supplementary disclosures for 2007 without undue cost. |
2009 compared with 2008
Operating profit before tax of £1,125 million was £656 million lower than in 2008, largely due to an increase of £608 million in impairments.
Net interest margin levels were rebuilt during the second half as asset pricing was amended to reflect increased funding and credit costs. For the year as a whole net interest margin was 18 basis points lower than in 2008, reflecting higher funding costs and continued competitive pricing for deposits.
Gross new lending to customers remained resilient in 2009, with a noticeable acceleration of lending activity in the second half of the year. However, as customers have deleveraged and turned increasingly to capital markets, repayments have accelerated even more sharply. Loans and advances to customers, therefore, declined by 5% to £111.5 billion.
Initiatives aimed at increasing customer deposits have been successful, with balance growth of 7%, although margins declined as a result of increased competition for balances.
Non-interest income was flat, with stable fee income from refinancing and structuring activity.
A reduction in costs of 7% was driven by lower staff expenses as a result of the Group’s restructuring programme, together with restraint on discretionary spending levels.
Impairment losses increased substantially reflecting both a rise in the number of corporate delinquencies requiring a specific impairment and a higher charge to recognise losses not yet specifically identified.
Risk-weighted assets grew 5% despite the fall in customer lending, reflecting the impact of procyclicality, which was most pronounced in the first half of 2009.
2008 compared with 2007
UK Corporate experienced a solid performance in the first half of 2008, with the second half of 2008 being impacted by the marked deterioration in economic conditions. Total income increased by 7% to £3,737 million. However, growth in impairments, especially in the second half of the year, resulted in a 1% fall in operating profit before tax to £1,781 million.
Net interest income rose 9% to £2,448 million. Loans and advances were 6% higher than 2007, reflecting the Group’s continuing support for the UK economy. New business margins widened in the second half to reflect increasing risk premia, however, higher funding costs on the back book impacted net interest income.
Non interest income increased 5% to £1,289 million. 2007 benefited from the profit on disposal of the Securities Services Group business. Year on year growth reflects increased sales of interest rate and currency risk management products.
Direct expenses increased by 10% to £1,119 million, reflecting the recruitment of additional front line staff in the second half of 2008.
Impairment losses totalled £319 million, a sharp increase from the low levels seen in 2007. Losses were concentrated in the smaller end of the corporate sector, although a number of specific exposures in the larger corporate sector have also impacted the charge.
44
Business review continued |
| 2009 | 2008 | 2007(1) | ||||||||||
| £m | £m | £m | ||||||||||
| Net interest income | 663 | 578 | 653 | |||||||||
| Net fees and commissions | 363 | 405 | 410 | |||||||||
| Other non-interest income | 83 | 76 | 55 | |||||||||
| Non-interest income | 446 | 481 | 465 | |||||||||
| Total income | 1,109 | 1,059 | 1,118 | |||||||||
| Direct expenses | ||||||||||||
| – staff | (357 | ) | (377 | ) | (346 | ) | ||||||
| – other | (139 | ) | (156 | ) | (139 | ) | ||||||
| Indirect expenses | (160 | ) | (162 | ) | (139 | ) | ||||||
| (656 | ) | (695 | ) | (624 | ) | |||||||
| Impairment losses | (33 | ) | (16 | ) | (3 | ) | ||||||
| Operating profit before tax | 420 | 348 | 491 | |||||||||
| Analysis of income | ||||||||||||
| Private Banking | 916 | 819 | ||||||||||
| Investments | 193 | 240 | ||||||||||
| Total income | 1,109 | 1,059 | 1,118 | |||||||||
| Performance ratios | ||||||||||||
| Net interest margin | 4.38 | % | 4.51 | % | ||||||||
| Cost:income ratio | 59.2 | % | 65.6 | % | 55.8 | % | ||||||
| £bn | £bn | £bn | ||||||||||
| Capital and balance sheet | ||||||||||||
| Loans and advances to customers – gross | 10.2 | |||||||||||
| – mortgages | 6.5 | 5.3 | ||||||||||
| – personal | 4.9 | 5.0 | ||||||||||
| – other | 2.3 | 2.1 | ||||||||||
| Customer deposits | 35.7 | 34.1 | 33.6 | |||||||||
| Assets under management (excluding deposits) | 30.7 | 34.7 | 35.0 | |||||||||
| Risk elements in lending | 0.2 | 0.1 | ||||||||||
| Loan:deposit ratio | 38 | % | 36 | % | ||||||||
| Risk-weighted assets | 11.2 | 10.8 | ||||||||||
Note:
| (1) | As noted on page 5, following a comprehensive strategic review, changes have been made to the Group’s operating segments in 2009. The company has also improved the granularity of certain segment information resulting in the provision of supplementary disclosures. However, it is not possible to source certain elements of these supplementary disclosures for 2007 without undue cost. |
2009 compared with 2008
Wealth produced strong growth in operating profit before tax, up 21% to £420 million, reflecting the increased value of the division’s healthy deposit base in an increasingly competitive market for funding. Deposit balances increased by 5% from 2008, though the deposit market remains highly competitive.
Total income was up 5%, with strong growth in net interest income, reflecting the increased internal pricing applied to Wealth’s deposit base. This was offset by a marked decrease in investment income year on year as assets under management decreased by 12% during 2009, with investors turning to more liquid assets and away from longer term investments.
Loans and advances increased by 10% over 2008, primarily in the UK. Lending margins improved, particularly for mortgages, and credit metrics for new business remain satisfactory.
Expenses were down 6%, reflecting a rigorous focus on cost management, with staff costs decreasing by 5% as a result of planned headcount reduction. The cost:income ratio improved from 65.6% to 59.2%.
Impairments increased by £17 million over 2008 reflecting some isolated difficulties in the UK and offshore mortgage books (representing mortgages for second properties for expatriates). Provisions as a percentage of lending to customers increased slightly to 0.25%.
45
Business review continued |
2008 compared with 2007
Total income decreased by 5% to £1,059 million despite an increase in underlying business which was more than offset by a movement in the Group's funds transfer pricing mechanism. Operating profit before tax decreased by 29% to £348 million.
Average loans and advances to customers rose by 22% but average customer deposits by only 1%. Deposit growth, which had been strong up to the end of Q4 2008 ceased and a deposit outflow occurred during the most volatile parts of Q4 2008. Deposit margins were also adversely affected by the deep falls in base rates in Q4 2008.
Non interest income grew by 3% to £481 million as higher fee income was offset by lower investment income. Average assets under management were 1% lower than in 2007, as investor risk appetite dropped sharply in Q4 2008.
Direct expenses rose by 10% to £533 million partly due to increased headcount and higher deposit protection scheme contributions.
Impairments rose from £3 million in 2007 to £16 million and represented approximately 0.1% of the total Wealth lending book.
46
Business review continued |
Global Banking & Markets
| 2009 | 2008 | 2007(2) | ||||||||||
| £m | £m | £m | ||||||||||
| Net interest income from banking activities | 2,424 | 2,390 | 467 | |||||||||
| Funding costs of rental assets | (49 | ) | (64 | ) | (49 | ) | ||||||
| Net interest income | 2,375 | 2,326 | 418 | |||||||||
| Net fees and commissions receivable | 1,144 | 973 | 960 | |||||||||
| Income/(loss) from trading activities | 7,954 | (493 | ) | 2,486 | ||||||||
| Other operating income | (464 | ) | (92 | ) | (17 | ) | ||||||
| Non-interest income | 8,634 | 388 | 3,429 | |||||||||
| Total income | 11,009 | 2,714 | 3,847 | |||||||||
| Direct expenses | ||||||||||||
| – staff | (2,930 | ) | (2,056 | ) | (1,802 | ) | ||||||
| – other | (965 | ) | (1,269 | ) | (552 | ) | ||||||
| Indirect expenses | (765 | ) | (663 | ) | (403 | ) | ||||||
| (4,660 | ) | (3,988 | ) | (2,757 | ) | |||||||
| Impairment losses | (640 | ) | (522 | ) | (66 | ) | ||||||
| Operating profit/(loss) before tax | 5,709 | (1,796 | ) | 1,024 | ||||||||
| Analysis of income by product | ||||||||||||
| Rates – money markets | 1,714 | 1,641 | ||||||||||
| Rates – flow | 3,142 | 1,386 | ||||||||||
| Currencies & commodities | 1,277 | 1,539 | ||||||||||
| Equities | 1,474 | 368 | ||||||||||
| Credit markets | 2,255 | (3,435 | ) | |||||||||
| Portfolio management and origination | 1,196 | 858 | ||||||||||
| Fair value of own debt | (49 | ) | 357 | |||||||||
| Total income | 11,009 | 2,714 | 3,847 | |||||||||
| Analysis of impairment by sector | ||||||||||||
| Manufacturing and infrastructure | 91 | 39 | ||||||||||
| Property and construction | 49 | 12 | ||||||||||
| Transport | 3 | — | ||||||||||
| Banks and financial institutions | 348 | 186 | ||||||||||
| Other | 149 | 285 | ||||||||||
| Total impairment | 640 | 522 | 66 | |||||||||
Loan impairment charge as % of gross customer loans and advances (excluding reverse repurchase agreements) | 0.59 | % | 0.29 | % | ||||||||
| Performance ratios | ||||||||||||
Return on equity (1) | 30.7 | % | (8.4 | %) | ||||||||
| Net interest margin | 1.38 | % | 1.34 | % | ||||||||
| Cost:income ratio | 42.3 | % | 146.9 | % | 71.7 | % | ||||||
Notes:
| (1) | Return on equity is based on divisional operating profit after tax, divided by divisional notional equity (based on 10% of divisional risk-weighted assets, adjusted for capital deductions). |
| (2) | As noted on page 5, following a comprehensive strategic review, changes have been made to the Group’s operating segments in 2009. The company has also improved the granularity of certain segment information resulting in the provision of supplementary disclosures. However, it is not possible to source certain elements of these supplementary disclosures for 2007 without undue cost. |
47
Business review continued |
| 2009 | 2008 | 2007 | (1) | |||||||||
| £bn | £bn | £bn | ||||||||||
| Capital and balance sheet | ||||||||||||
| Loans and advances (including banks) | 127.8 | 224.2 | 188.0 | |||||||||
| Reverse repos | 73.3 | 88.8 | 278.4 | |||||||||
| Securities | 106.0 | 127.5 | 205.7 | |||||||||
| Cash and eligible bills | 74.0 | 20.2 | 22.7 | |||||||||
| Other assets | 31.1 | 38.0 | 38.7 | |||||||||
| Total third party assets (excluding derivatives mark to market) | 412.2 | 498.7 | 733.5 | |||||||||
| Net derivative assets (after netting) | 68.0 | 121.0 | 49.4 | |||||||||
| Customer deposits (excluding repos) | 46.9 | 87.8 | 93.3 | |||||||||
| Risk elements in lending | 1.8 | 0.9 | ||||||||||
| Loan:deposit ratio | 194 | % | 192 | % | ||||||||
| Risk-weighted assets | 123.7 | 151.8 | ||||||||||
Note:
| (1) | As noted on page 5, following a comprehensive strategic review, changes have been made to the Group’s operating segments in 2009. The company has also improved the granularity of certain segment information resulting in the provision of supplementary disclosures. However, it is not possible to source certain elements of these supplementary disclosures for 2007 without undue cost. |
2009 compared with 2008
Operating profit before tax improved to £5,709 million in 2009, compared with an operating loss before tax of £1,796 million in 2008. Although the buoyant market conditions experienced in the first quarter levelled off over the course of the year, the refocusing of the business on its core franchises was successful. Global Banking & Markets (GBM) has tightened its balance sheet management over the course of the year, with disciplined deployment of capital to support its targeted client base.
In an often volatile market environment, GBM responded quickly to its clients’ needs to strengthen their balance sheets and to take advantage of the attractive environment for debt and equity issues. RBS participated in the five largest equity issues worldwide in 2009, and in six out of the ten largest debt capital markets transactions.
Income grew significantly, reflecting a very strong first quarter benefiting from market volatility, client activity and a marked improvement from Credit Markets. Rates flow business, up 127%, benefited from good client activity, while strong equity capital markets drove a fourfold increase in Equities.
Portfolio management and origination grew 39% as financial institutions and corporate clients refinanced through the debt capital markets. The refocused Credit Markets delivered a much improved result from greater liquidity and a more positive trading environment.
Despite quarterly movement in the Group’s credit spreads, overall spreads remained broadly flat over the year resulting in a small loss from movements in the fair value of own debt compared with a £357 million gain in 2008.
Expenses increased 17%, reflecting higher performance-related costs and the impact of adverse exchange rate movements, partly offset by restructuring and efficiency benefits. Less than half of the change in staff costs related to increases in 2009 bonus awards.
Staff costs represented 27% of income. The Group introduced new deferral policies in 2009, which have led to changes in accrual patterns. Adjusting for both 2008 and 2009 deferrals, GBM’s compensation ratio in 2009 would have been 28%.
Higher impairments principally reflected a large individual failure recognised in the third quarter. Impairments represented 0.59% of loans and advances to customers compared with 0.29% in the prior year, reflecting the marked reduction in loans and advances.
Total third party assets, excluding derivatives, were down 17% compared with 31 December 2008, driven by a 43% reduction in loans and advances as customers took advantage of favourable capital market conditions to raise alternative forms of finance to bank debt. This reduction was partially offset by an increase in liquid assets.
Risk-weighted assets decreased 19%, reflecting the fall in third party assets and the Group’s continued focus on reducing its risk profile and balance sheet usage.
2008 compared with 2007
GBM’s operating profit before tax fell from £1,024 million in 2007 to a loss of £1,796 million. This decline reflected the effect of the market turmoil which adversely affected the division’s results in 2008. GBM incurred losses from counterparty failures (notably Lehman), write-downs of our subprime mortgage related positions and higher credit impairments as the effects of the down-turn widened. These were only partly offset by good performances in a number of businesses, most notably in rates and currencies, the inclusion of the ABN AMRO businesses for a full twelve months and gains on the fair value of own debt.
Costs were up by 45%, with the inclusion of the acquired businesses of ABN AMRO for a full year outweighing reduced bonus payments. Credit impairments rose sharply from a very low level, £66 million, to £522 million, resulting in a 2008 operating loss before tax of £1,796 million.
Net interest income grew by £1,908 million to £2,326 million, with the rates business benefiting from the declining interest rate environment. Non-interest income reduced by £3,041 million to £388 million. Fees and commissions increased mainly as a result of the inclusion of the ABN AMRO businesses for a full twelve months partially offset by a decline in origination volumes. Income from trading activities fell from £2,486 million to a loss of £493 million, primarily as a result of counterparty failures and mortgage trading asset write-downs. Other operating income was a loss of £92 million, reflecting losses incurred on European loan sales.
48
Business review continued |
By business line, the rates and currencies business achieved a particularly strong performance in 2008, with high volumes of customer activity and flow trading. The Sempra Commodities joint venture performed ahead of expectations in the nine months since its formation. Equities improved slightly primarily as a result of the inclusion of a full year of ABN AMRO related businesses.
In a reduced market for debt origination, credit markets improved its market positions in a number of key areas such as international bond issuance. Results, however, were severely affected by the continuing market weakness, particularly in the second half of the year.
Portfolio management income remained resilient, but some losses were incurred, including on capital and credit exposure management.
Credit impairments increased sharply to £522 million primarily reflecting higher IAS latent provisions.
GBM’s total third party assets including derivatives were reduced by £165.8 billion to £619.7 billion at 31 December 2008, a reduction of 18% from a year earlier. Within this total, loans and advances were £224.2 billion, an increase of 18%. This increase was more than offset by significant reductions in reverse repos and securities holdings, both of which have been managed down over the course of the year. Net derivative assets totalled £121.0 billion, compared with £49.4 billion at the end of 2007.
49
Business review continued |
Global Transaction Services
| 2009 | 2008 | 2007(1) | ||||||||||
| £m | £m | £m | ||||||||||
| Net interest income | 912 | 937 | 647 | |||||||||
| Non-interest income | 1,575 | 1,494 | 1,150 | |||||||||
| Total income | 2,487 | 2,431 | 1,797 | |||||||||
| Direct expenses | ||||||||||||
| – staff | (371 | ) | (362 | ) | (251 | ) | ||||||
| – other | (161 | ) | (149 | ) | (127 | ) | ||||||
| Indirect expenses | (943 | ) | (864 | ) | (510 | ) | ||||||
| (1,475 | ) | (1,375 | ) | (888 | ) | |||||||
| Impairment losses | (39 | ) | (54 | ) | (14 | ) | ||||||
| Operating profit before tax | 973 | 1,002 | 895 | |||||||||
| Analysis of income by product | ||||||||||||
| Domestic cash management | 805 | 795 | ||||||||||
| International cash management | 734 | 722 | ||||||||||
| Trade finance | 290 | 241 | ||||||||||
| Merchant acquiring | 528 | 554 | ||||||||||
| Commercial cards | 130 | 119 | ||||||||||
| Total income | 2,487 | 2,431 | 1,797 | |||||||||
| Performance ratios | ||||||||||||
| Net interest margin | 9.22 | % | 8.25 | % | ||||||||
| Cost:income ratio | 59.3 | % | 56.6 | % | 49.4 | % | ||||||
| £bn | £bn | £bn | ||||||||||
| Capital and balance sheet | ||||||||||||
| Total third party assets | 18.4 | 22.2 | 21.8 | |||||||||
| Loans and advances | 12.7 | 14.8 | 17.7 | |||||||||
| Customer deposits | 61.8 | 61.8 | 55.7 | |||||||||
| Risk elements in lending | 0.2 | 0.1 | ||||||||||
| Loan:deposit ratio | 21 | % | 25 | % | ||||||||
| Risk-weighted assets | 19.1 | 17.4 | ||||||||||
Note:
| (1) | As noted on page 5, following a comprehensive strategic review, changes have been made to the Group’s operating segments in 2009. The company has also improved the granularity of certain segment information resulting in the provision of supplementary disclosures. However, it is not possible to source certain elements of these supplementary disclosures for 2007 without undue cost. |
2009 compared with 2008
Operating profit before tax declined by 3%, largely reflecting pressure on deposit income. The attrition of deposit balances experienced in the first half was reversed in the second, but margins remain compressed due to both a very competitive deposit market as well as the low rate environment.
Customer deposit balances at £61.8 billion were flat on the previous year, with growth in the UK and international business offset by weaker US domestic balances. Loans and advances were down 14% due to reduced overdraft utilisation and lower trade volumes.
International payment fees increased by 2%, while trade finance income increased by 20%, with improved penetration in the Asia-Pacific region. Merchant acquiring income, however, declined by 5%, as consumers continued to switch to lower margin debit card transactions in preference to using credit cards.
Expenses were up 7%, as cost savings and efficiencies that helped to mitigate the impact of investment in infrastructure were offset by movements in foreign exchange rates. Staff expenses were up 2%, primarily as a result of movements in foreign exchange rates, with headcount down 5%. The cost:income ratio was 59.3%, a deterioration of 2.7 percentage points.
Impairment losses were £39 million, down £15 million versus 2008. Overall defaults remain modest at 0.3% of loans and advances.
2008 compared with 2007
Global Transaction Services (GTS) grew income by 35% to £2,431 million and operating profit before tax by 12% to £1,002 million for the full year 2008, reflecting the full year income of ABN AMRO business and the strength and enhanced international capability of the cash management, trade finance and merchant acquiring platforms. The income growth rate was maintained in the second half of the year, despite difficult market conditions.
50
Business review continued |
Growth was driven by a strong performance in cash management, in particular international cash management in ABN AMRO. Steady growth was achieved in the RBS UK and US domestic markets. Average customer deposits were higher mitigating the impact of lower interest rates. International overdrafts have been re-priced, reflecting the increased cost of funds and higher risk premia during the second half of the year. Fee income from payment transactions increased strongly, particularly in the US and internationally. The division was successful throughout the year in winning new international cash management mandates from existing RBS Group clients due to the strength of the international payments platform and network.
Trade finance made good progress, with income continuing to grow strongly as the ABN AMRO platform enabled GTS to substantially improve its penetration into the Asia-Pacific market, and has expanded its supply chain finance activities with an enhanced product suite. Margins improved throughout the year reflecting the additional risk premium in the market conditions.
Merchant services and commercial cards delivered growth despite the worsening economic climate. Acquiring transaction volumes were up in the year driven by good growth in online volumes, but weaker consumer confidence in the latter part of the year meant that average transaction values decreased, slowing income growth. Commercial cards income saw strong growth for the full year, driven by higher interchange income the small and middle markets.
Direct expenses rose by 35% to £511 million, reflecting the full year costs of the ABN AMRO business. The full year cost growth reflected investment in staffing and infrastructure to support GTS’s development.
Impairment losses were £54 million, up from £14 million in 2007, reflecting in particular the downturn in the global economy and some growth in defaults amongst mid-corporates and SMEs.
51
Business review continued |
Ulster Bank
| 2009 | 2008 | 2007(2) | ||||||||||
| £m | £m | £m | ||||||||||
| Net interest income | 780 | 708 | 659 | |||||||||
| Net fees and commissions | 228 | 238 | 163 | |||||||||
| Other non-interest income | 26 | 103 | 165 | |||||||||
| Non-interest income | 254 | 331 | 328 | |||||||||
| Total income | 1,034 | 1,039 | 987 | |||||||||
| Direct expenses | ||||||||||||
| – staff | (325 | ) | (330 | ) | (258 | ) | ||||||
| – other | (85 | ) | (93 | ) | (101 | ) | ||||||
| Indirect expenses | (343 | ) | (292 | ) | (265 | ) | ||||||
| (753 | ) | (715 | ) | (624 | ) | |||||||
| Impairment losses | (649 | ) | (106 | ) | (46 | ) | ||||||
| Operating (loss)/profit before tax | (368 | ) | 218 | 317 | ||||||||
| Analysis of income by business | ||||||||||||
| Corporate | 580 | 618 | ||||||||||
| Retail | 412 | 396 | ||||||||||
| Other | 42 | 25 | ||||||||||
| Total income | 1,034 | 1,039 | 987 | |||||||||
| Analysis of impairment by sector | ||||||||||||
| Mortgages | 74 | 17 | ||||||||||
| Corporate | ||||||||||||
| – property | 306 | 37 | ||||||||||
| – other | 203 | 7 | ||||||||||
| Other | 66 | 45 | ||||||||||
| Total impairment | 649 | 106 | 46 | |||||||||
Loan impairment charge as % of gross customer loans and advances (excluding reverse repurchase agreements) by sector | ||||||||||||
| Mortgages | 0.46 | % | 0.09 | % | ||||||||
| Corporate | ||||||||||||
| – property | 3.03 | % | 0.34 | % | ||||||||
| – other | 1.85 | % | 0.05 | % | ||||||||
| Other | 2.75 | % | 2.14 | % | ||||||||
| 1.63 | % | 0.24 | % | |||||||||
| Performance ratios | ||||||||||||
Return on equity (1) | (13.3 | %) | 10.1 | % | ||||||||
| Net interest margin | 1.87 | % | 1.89 | % | ||||||||
| Cost:income ratio | 72.8 | % | 68.8 | % | 63.2 | % | ||||||
| £bn | £bn | £bn | ||||||||||
| Capital and balance sheet | ||||||||||||
| Loans and advances to customers – gross | 33.9 | |||||||||||
| – mortgages | 16.2 | 18.1 | ||||||||||
| – corporate | ||||||||||||
| – property | 10.1 | 10.9 | ||||||||||
| – other | 11.0 | 12.9 | ||||||||||
| – other | 2.4 | 2.1 | ||||||||||
| Customer deposits | 21.9 | 24.3 | 21.8 | |||||||||
| Risk elements in lending | ||||||||||||
| – mortgages | 0.6 | 0.3 | ||||||||||
| – corporate | ||||||||||||
| – property | 0.7 | 0.5 | ||||||||||
| – other | 0.8 | 0.3 | ||||||||||
| – other | 0.2 | 0.1 | ||||||||||
| Loan: deposit ratio | 177 | % | 179 | % | ||||||||
| Risk-weighted assets | 29.9 | 24.5 | ||||||||||
Notes:
| (1) | Return on equity is based on divisional operating profit after tax, divided by divisional notional equity (based on 7% of divisional risk-weighted assets, adjusted for capital deductions). |
| (2) | As noted on page 5, following a comprehensive strategic review, changes have been made to the Group’s operating segments in 2009. The company has also improved the granularity of certain segment information resulting in the provision of supplementary disclosures. However, it is not possible to source certain elements of these supplementary disclosures for 2007 without undue cost. |
52
Business review continued |
2009 compared with 2008
Operating results were in line with expectations but deteriorated during 2009 as economic conditions across the island of Ireland worsened, with an operating loss before tax for the year of £368 million.
Net interest income increased by 10% reflecting movements in foreign exchange rates and asset repricing initiatives, largely offset by the tightening of deposit margins in an increasingly competitive market. Net interest margin for the year at 1.87% remained broadly stable despite the challenging market conditions.
Loans to customers decreased by 10% from the prior year as new business demand weakened. Customer deposits reduced by 10% in 2009, reflecting an increasingly competitive Irish deposit market and reductions in wholesale funding during the first quarter. During the second half of the year the market stabilised and the division recorded strong growth in customer balances resulting in an improved funding profile.
Non-interest income declined by 23% due to lower fee income driven by reduced activity levels across all business lines.
Total costs for the year increased by 5%. Direct expenses were down 3% during 2009, driven by the bank’s restructuring programme, which incorporates the merger of the First Active and Ulster Bank businesses. The rollout of the programme has resulted in a downward trend in direct expenses throughout 2009. The reduction in direct expenses has been offset by a 17% increase in indirect expenses primarily reflecting provisions relating to the bank’s own property recognised in the fourth quarter.
Impairment losses increased to £649 million from £106 million driven by the continued deterioration in the Irish economic environment and resultant impact on loan performance across the retail and wholesale portfolios.
Necessary fiscal budgetary action allied to the well-entrenched downturn in property markets in Ireland has fed through to higher loan losses. Mortgage impairments have been driven by rising unemployment and lower incomes. Loans to the property sector experienced a substantial rise in defaults as the Irish property market declined, reflecting the difficult economic backdrop and the uncertainty surrounding the possible effect of the Irish Government's National Asset Management Agency on asset values. Sectors driven by consumer spending have been affected by the double digit decline in 2009 with rising default rates evident.
Customer account numbers increased by 3% during 2009, with growth fuelled by strong current account activity and new-to-bank savings customers.
2008 compared with 2007
The significant deterioration in global and local market conditions has impacted the main Ulster Bank Group markets, with operating profit before tax falling to £218 million, 31% lower than in 2007. A significant driver of this reduction has been an increase of £60 million in impairments, albeit from a low base, reflecting deterioration in credit quality as economic conditions have slowed.
Total income was up 5% at £1,039 million benefiting from movements in exchange rates, net interest income increased by 7%, with average loans and advances to customers up 30% in the year. The benefit from growth in lending, particularly in the first half of the year has been offset by increased funding costs associated with the wholesale funding market dislocation. Non-interest income rose 1%, reflecting a slowdown in particular in the bancassurance and wealth businesses.
Mortgage balances were 13% higher than 2007. New mortgage volumes in the second half of the year were significantly lower than in the first six months, although levels of redemptions have also fallen.
Deposit flows were strong in the latter part of the year and into the early months of 2009. During 2008, we opened 119,000 new current accounts driven by particularly successful current account switcher and student campaigns.
Direct expenses rose by 18% to £423 million, reflecting the impact of the movement in exchange rates and the full year impact of the now completed investment programme in Ulster Bank’s footprint and operations. Cost growth in the second half of 2008 was significantly lower, reflecting disciplined management of the cost base.
Impairment losses rose to £106 million, reflecting the impact on credit quality of the slowdown in the Irish economy, with the final quarter showing the most notable decline in both activity and sentiment. This was reflected in a significantly increased flow of cases into the problem debt management process.
53
Business review continued |
In January 2009, Ulster Bank announced its intention to adopt a single brand strategy under the Ulster Bank brand. This will see the merger of the operations of Ulster Bank and First Active in the Republic of Ireland (“RI”) by the end of 2009. This action is being taken to strengthen the Ulster Bank Group franchise by positioning it to deal with the prevailing local and global market conditions. A number of cost management initiatives have also commenced across the business.
Ulster Bank has launched a series of initiatives to support its customers in this difficult economic period. We announced in February 2009 that we will be making significant funds available to the Northern Ireland (“NI”) SME market. A similar announcement will be made in the coming weeks regarding the RI SME market. Ulster Bank has also indicated that it is adopting the RBS Group pledge regarding certainty of overdraft limits for this sector.
The Momentum and Secure Step mortgages have been launched in NI and RI respectively to support First Time Buyers and the Bank has confirmed its pledge of a six-month moratorium to mortgage customers facing potential repossession. In support of our retail customers across the island of Ireland the Group’s MoneySense programme is being rolled out, with trained advisers being introduced to all Ulster Bank branches.
54
Business review continued |
US Retail & Commercial
| 2009 | 2008 | 2007(2) | 2009 | 2008 | 2007(2) | |||||||||||||||||||
| £m | £m | £m | $m | $m | $m | |||||||||||||||||||
| Net interest income | 1,775 | 1,726 | 1,613 | 2,777 | 3,200 | 3,227 | ||||||||||||||||||
| Net fees and commissions | 714 | 664 | 648 | 1,119 | 1,231 | 1,296 | ||||||||||||||||||
| Other non-interest income | 235 | 197 | 153 | 368 | 362 | 305 | ||||||||||||||||||
| Non-interest income | 949 | 861 | 801 | 1,487 | 1,593 | 1,601 | ||||||||||||||||||
| Total income | 2,724 | 2,587 | 2,414 | 4,264 | 4,793 | 4,828 | ||||||||||||||||||
| Direct expenses | ||||||||||||||||||||||||
| – staff | (776 | ) | (645 | ) | (563 | ) | (1,214 | ) | (1,194 | ) | (1,126 | ) | ||||||||||||
| – other | (593 | ) | (354 | ) | (291 | ) | (929 | ) | (654 | ) | (582 | ) | ||||||||||||
| Indirect expenses | (766 | ) | (623 | ) | (571 | ) | (1,196 | ) | (1,157 | ) | (1,142 | ) | ||||||||||||
| (2,135 | ) | (1,622 | ) | (1,425 | ) | (3,339 | ) | (3,005 | ) | (2,850 | ) | |||||||||||||
| Impairment losses | (702 | ) | (437 | ) | (246 | ) | (1,099 | ) | (811 | ) | (491 | ) | ||||||||||||
| Operating (loss)/profit before tax | (113 | ) | 528 | 743 | (174 | ) | 977 | 1,487 | ||||||||||||||||
| Analysis of income by product | ||||||||||||||||||||||||
| Mortgages and home equity | 499 | 375 | 781 | 695 | ||||||||||||||||||||
| Personal lending and cards | 451 | 333 | 706 | 617 | ||||||||||||||||||||
| Retail deposits | 828 | 1,000 | 1,296 | 1,853 | ||||||||||||||||||||
| Commercial lending | 542 | 405 | 848 | 751 | ||||||||||||||||||||
| Commercial deposits | 398 | 377 | 624 | 698 | ||||||||||||||||||||
| Other | 6 | 97 | 9 | 179 | ||||||||||||||||||||
| Total income | 2,724 | 2,587 | 2,414 | 4,264 | 4,793 | 4,828 | ||||||||||||||||||
| Average exchange rate – US$/£ | 1.566 | 1.853 | 2.001 | |||||||||||||||||||||
| Analysis of impairment by sector | ||||||||||||||||||||||||
| Residential mortgages | 72 | 41 | 113 | 76 | ||||||||||||||||||||
| Home equity | 167 | 67 | 261 | 125 | ||||||||||||||||||||
| Corporate & Commercial | 326 | 181 | 510 | 335 | ||||||||||||||||||||
| Other consumer | 137 | 148 | 215 | 275 | ||||||||||||||||||||
| Total impairment | 702 | 437 | 246 | 1,099 | 811 | 491 | ||||||||||||||||||
| Loan impairment charge as % of gross customer loans and advances (excluding reverse repurchase agreements) by sector | ||||||||||||||||||||||||
| Residential mortgages | 1.11 | % | 0.43 | % | 1.07 | % | 0.55 | % | ||||||||||||||||
| Home equity | 1.08 | % | 0.36 | % | 1.04 | % | 0.46 | % | ||||||||||||||||
| Corporate & Commercial | 1.67 | % | 0.76 | % | 1.61 | % | 0.97 | % | ||||||||||||||||
| Other consumer | 1.84 | % | 1.51 | % | 1.77 | % | 1.92 | % | ||||||||||||||||
| 1.44 | % | 0.71 | % | 1.39 | % | 0.90 | % | |||||||||||||||||
| Performance ratios | ||||||||||||||||||||||||
Return on equity (1) | (1.8 | %) | 7.7 | % | (1.7 | %) | 9.7 | % | ||||||||||||||||
| Net interest margin | 2.37 | % | 2.68 | % | 2.37 | % | 2.68 | % | ||||||||||||||||
| Cost:income ratio | 78.3 | % | 62.7 | % | 59.0 | % | 78.3 | % | 62.7 | % | 59.0 | % | ||||||||||||
| £bn | £bn | £bn | US$bn | US$bn | US$bn | |||||||||||||||||||
| Capital and balance sheet | ||||||||||||||||||||||||
| Total assets | 74.8 | 87.5 | 67.1 | 121.3 | 127.8 | 134.1 | ||||||||||||||||||
| Loans and advances to customers – gross | 44.8 | 89.9 | ||||||||||||||||||||||
| – residential mortgages | 6.5 | 9.5 | 10.6 | 13.9 | ||||||||||||||||||||
| – home equity | 15.4 | 18.7 | 25.0 | 27.2 | ||||||||||||||||||||
| – corporate and commercial | 19.5 | 23.7 | 31.6 | 34.7 | ||||||||||||||||||||
| – other consumer | 7.5 | 9.8 | 12.1 | 14.3 | ||||||||||||||||||||
| Customer deposits | 60.1 | 63.9 | 52.6 | 97.4 | 93.4 | 105.4 | ||||||||||||||||||
| Risk elements in lending | ||||||||||||||||||||||||
| – retail | 0.4 | 0.2 | 0.6 | 0.3 | ||||||||||||||||||||
| – commercial | 0.2 | 0.2 | 0.4 | 0.2 | ||||||||||||||||||||
| Loan: deposit ratio | 80 | % | 96 | % | 80 | % | 96 | % | ||||||||||||||||
| Risk-weighted assets | 59.7 | 63.9 | 96.9 | 93.2 | ||||||||||||||||||||
| Spot exchange rate – US$/£ | 1.622 | 1.460 | 2.004 | |||||||||||||||||||||
Notes:
| (1) | Excluding reverse repurchase agreements by sector. |
| (2) | As noted on page 5, following a comprehensive strategic review, changes have been made to the Group’s operating segments in 2009. The company has also improved the granularity of certain segment information resulting in the provision of supplementary disclosures. However, it is not possible to source certain elements of these supplementary disclosures for 2007 without undue cost. |
55
Business review continued |
2009 compared with 2008
The recessionary economic environment, historically low interest rates and deteriorating credit conditions resulted in an operating loss before tax of £113 million. However, the business has now successfully refocused on its core customer franchises in New England, the Mid-Atlantic region and the Midwest. In dollar terms, an operating loss before tax of $174 million was recorded.
The division achieved very strong growth in mortgage origination volumes, with significantly higher penetration through the branch network and improved profitability, particularly on recent origination vintages. Cross-selling of card, deposit and checking account products has increased substantially, with over 65% of new mortgage customers also taking out a checking account. The division has also increased commercial banking market penetration, with lead bank share within its footprint increasing, in dollar terms, from 6% to 7% in the $5 million to $25 million segment and from 6% to 8% in the $25 million to $500 million segment.
Net interest income was up 3%, principally as a result of movements in exchange rates. However, net interest margin was down 31bps for the full year, reflecting the decline in deposit margins resulting from the low interest rate environment, though margins have been partially rebuilt in the second half from the lows experienced in the first half, as the business repriced lending rates and aggressively reduced pricing on term and time deposits.
Expenses increased by 32%, reflecting increased FDIC deposit insurance levies, higher employee benefit costs as well as increased costs relating to loan workout and collection activity. In dollar terms, expenses increased by 11%. Successful execution of restructuring activities resulted in approximately $75 million of cost savings.
Impairment losses increased to £702 million ($1,099 million) as charge-offs climbed to 0.90% of loans, an increase of 34bps compared with 2008.
Loans and advances were down 21%, reflecting subdued customer demand.
Customer deposits decreased 6% from the prior year. In dollar terms, customer deposits increased 4% as the deposit mix improved significantly, with strong growth in checking balances combined with migration away from higher priced term and time deposits as the division adjusted its pricing strategies. Over 58,000 consumer checking accounts were added over the course of the year, and more than 13,000 small business checking accounts. Consumer checking balances grew by 8% and small business balances by 12%.
2008 compared with 2007
US Retail & Commercial Banking increased income by 7% to £2,587 million, primarily as a result of movements in exchange rates, but experienced a sharp increase in impairment losses as economic conditions progressively worsened over the course of the year. As a result, operating profit before tax declined to £528 million, down 29%. In dollar terms, total income was down 1% at $4,793 million while operating profit before tax declined by 34% to $977 million.
Net interest income grew by 7% to £1,726 million. Average loans and advances to retail customers decreased as a result of the slowing economy and tighter underwriting standards, but this decline was offset by continued strong growth in corporate and commercial lending. Core customer deposits declined by 5% and the division further reduced its reliance on brokered deposits by 80%, leading to an overall decline of 11% in total customer deposits. Net interest margin was held steady at 2.82%, reflecting widening asset margins and management of savings rates in a competitive deposit market.
Direct expenses increased by 17% to £999 million, reflecting increased costs from the expansion of the commercial banking relationship management teams, write-downs on mortgage servicing rights, and higher costs related to loan work-out and collection activity together with movements in exchange rates. In dollar terms, direct expenses increased by 8% to $1,848 million.
Credit conditions worsened significantly over the course of the year as the housing market continued to deteriorate and unemployment rose, exacerbating already challenging conditions. Impairment losses totalled £437 million, up from £246 million in 2007 reflecting the deterioration in economic conditions. In dollar terms, impairment losses totalled $811 million, up 65% from 2007. Stress has emerged in all consumer segments during the second half of the year: non-performing loans represented 0.36% of home equity balances, 0.35% of auto balances and 1.04% of residential mortgage balances. Commercial non-performing loans represented 0.41% of loans. US Retail & Commercial does not originate negative amortization mortgages or option adjustable rate mortgages. Closing provision balances for the portfolio were £588 million ($859 million) compared with £275 million ($552 million) at the end of 2007.
The US business has continued to evaluate opportunities to optimise capital allocation by exiting or reducing exposure to lower growth or sub-scale segments. In the fourth quarter, 18 rural branches in the Adirondacks region were sold to Community Bank System. An agreement has also been announced to sell the Indiana retail branch banking network, consisting of 65 branches, and the business banking and regional banking activities, to Old National Bank.
56
Business review continued |
RBS Insurance
| 2009 | 2008 | 2007 | ||||||||||
| £m | £m | £m | ||||||||||
| Earned premiums | 4,519 | 4,512 | 4,615 | |||||||||
| Reinsurers’ share | (165 | ) | (206 | ) | (190 | ) | ||||||
| Insurance net premium income | 4,354 | 4,306 | 4,425 | |||||||||
| Net fees and commissions | (366 | ) | (396 | ) | (465 | ) | ||||||
| Other income | 472 | 520 | 614 | |||||||||
| Total income | 4,460 | 4,430 | 4,574 | |||||||||
| Direct expenses | ||||||||||||
| – staff | (267 | ) | (286 | ) | (282 | ) | ||||||
| – other | (222 | ) | (225 | ) | (228 | ) | ||||||
| Indirect expenses | (270 | ) | (261 | ) | (239 | ) | ||||||
| (759 | ) | (772 | ) | (749 | ) | |||||||
| Gross claims | (3,690 | ) | (3,136 | ) | (3,358 | ) | ||||||
| Reinsurers’ share | 55 | 104 | 75 | |||||||||
| Net claims | (3,635 | ) | (3,032 | ) | (3,283 | ) | ||||||
| Operating profit before impairment losses | 66 | 626 | 542 | |||||||||
| Impairment losses | (8 | ) | (42 | ) | — | |||||||
| Operating profit before tax | 58 | 584 | 542 | |||||||||
| Analysis of income by product | ||||||||||||
| Motor own-brand | 2,005 | 1,942 | 1,931 | |||||||||
| Household and Life own-brands | 849 | 806 | 525 | |||||||||
| Motor partnerships and broker | 577 | 686 | 827 | |||||||||
| Household and Life, partnerships and broker | 330 | 354 | 625 | |||||||||
| Other (international, commercial and central) | 699 | 642 | 666 | |||||||||
| Total income | 4,460 | 4,430 | 4,574 | |||||||||
| Performance ratios | ||||||||||||
Return on equity (1) | 1.6 | % | 18.3 | % | 17.2 | % | ||||||
| Cost:income ratio | 17.0 | % | 17.4 | % | 16.4 | % | ||||||
Adjusted cost:income ratio (2) | 92.0 | % | 55.2 | % | 58.0 | % | ||||||
| In-force policies (000’s) | ||||||||||||
| – Motor own-brand | 4,858 | 4,492 | 4,445 | |||||||||
| – Own-brand non-motor (home, rescue, pet, HR24) | 6,307 | 5,560 | 3,752 | |||||||||
| – Partnerships and broker (motor, home, rescue, pet, HR24) | 5,328 | 5,898 | 6,765 | |||||||||
| – Other (International, commercial and central) | 1,217 | 1,206 | 1,068 | |||||||||
| General insurance reserves – total (£m) | 7,030 | 6,672 | 6,707 | |||||||||
Notes:
| (1) | Based on divisional operating profit after tax, divided by divisional notional equity (based on regulatory capital). |
| (2) | Based on total income and operating expenses above and after netting insurance claims against income. |
57
Business review continued |
2009 compared with 2008
Operating profit before tax was severely affected by the rising costs of bodily injury claims, declining to £58 million. Significant price increases were implemented in the latter part of the year to mitigate the industry trend of rising claims costs.
Income grew by 1%, with premium income stable but lower reinsurance costs. Investment income was 16% lower, reflecting the impact of low interest rates and returns on the investment portfolio partially offset by gains realised on the sale of equity investments.
In-force policies grew by 3%, driven by the success of own brands, up 11%. Churchill and Privilege have benefited from deployment on selected price comparison websites, with motor policy numbers up 19% and 3% respectively, and home policies up 32% and 109% respectively, compared with prior year. Direct Line motor and home policies grew by 4% and 2% respectively. The partnerships and broker segment declined by 10% in line with business strategy.
Expenses fell by 2% in 2009, with wage inflation, higher industry levies and professional fees offset by cost efficiencies, reduction in headcount and lower marketing expenditure.
Net claims were 20% higher than in 2008 driven by a £448 million increase in bodily injury claims as well as by adverse weather experienced in the fourth quarter. Significant price increases were implemented in the latter part of the year to mitigate the industry trend of rising claims costs, and additional significant initiatives have also been undertaken to adapt pricing models and enhance claims management.
The UK combined operating ratio, including business services costs, was 105.9% compared with 93.6% in the previous year, with the impact of the increase in reserves for bodily injury claims and the bad weather experience only partially mitigated by commission and expense ratio improvement.
2008 compared with 2007
RBS Insurance made good progress in 2008, with operating profit before tax rising by £42 million, an increase of 8%. Total income was £144 million lower at £4,430 million, reflecting a fall in insurance premium income following the continuation of the strategic decision to exit less profitable partnership contracts and the effect of financial market conditions.
Own-brand businesses increased income by 2% and contribution before impairments and excluding indirect expenses by 12%. In the UK motor market the Group increased premium rates to offset claims inflation and continued to target lower risk drivers, with price increases concentrated in higher risk categories in order to improve profitability. During 2008 selected brands were successfully deployed on a limited number of aggregator web sites. Our international businesses in Italy and Germany performed well, with income up 25% and contribution up 74%. Over the last year own-brand motor policy numbers have again begun to increase, and rose by 1% to 4.5 million.
In own-brand non-motor insurance we have continued to achieve good sales through the RBS Group, where home insurance policies in force have increased by 33%. In addition, Privilege and Churchill have grown home policies by 90% and 13% respectively compared with 2007, mainly due to an increase in online sales as a result of successful marketing campaigns. A new commercial insurance offering, Direct Line for Business, was launched, and has grown rapidly over the year with particularly strong performances in Residential Property and Tradesman policies. Overall own-brand non-motor policies in force have grown by 48% to 5.6 million, benefiting from the addition of rescue cover to RBS and NatWest current account package customers.
Results from partnerships and broker business confirmed the Group’s strategy of refocusing on the more profitable opportunities in this segment, where we provide underwriting and processing services to third parties. The Group did not renew a number of rescue contracts and pulled back from some less profitable segments of the broker market. As a result partnership and broker in-force policies have fallen by 13% over the last year with a corresponding 12% reduction in income, yet contribution grew by 30%.
For RBS Insurance as a whole, insurance premium income, net of fees and commissions, was broadly maintained at £4 billion, reflecting 6% growth in the Group’s own brands offset by a 14% decline in the partnerships and broker segment. Investment income was maintained at £367 million. Other income decreased by 15% to £520 million.
Direct expenses increased by less than 1% to £511 million, despite accelerated marketing development in own brands, including the launch of Direct Line for Business.
Net claims fell by 8% to £3,032 million, benefiting from ongoing claims containment and more benign weather conditions. Impairments of £42 million reflect impairments recognised in corporate bond and equities investment portfolios.
The UK combined operating ratio for 2008, including manufacturing costs, decreased to 93.6% from 98.8%
58
Business review continued |
Central items
| 2009 | 2008 | 2007 | ||||||||||
| £m | £m | £m | ||||||||||
| Fair value of own debt | (93 | ) | 875 | 152 | ||||||||
| Other | 385 | 150 | 693 | |||||||||
| Operating profit before tax | 292 | 1,025 | 845 | |||||||||
2009 compared with 2008
Funding and operating costs have been allocated to operating divisions, based on direct service usage, requirement for market funding and other appropriate drivers where services span more than one division.
Residual unallocated items relate to volatile corporate items that do not naturally reside within a division.
Items not allocated during the year amounted to a net credit of £292 million. The Group’s credit spreads have fluctuated over the course of the year, but ended the year slightly tighter, resulting in an increase in the carrying value of own debt. This was offset by a net credit on unallocated Group treasury items, including the impact of economic hedges that do not qualify for IFRS hedge accounting. 2008’s results included some significant disposal gains.
2008 compared with 2007
Items not allocated during the year amounted to a net credit of £1,025 million reflecting the benefit from a decrease in the carrying value of own debt, profit on the sale of Tesco Personal Finance offset by a net debit on economic hedges which do not qualify for IFRS hedge accounting.
59
Business review continued |
Non-Core
| 2009 | 2008 | 2007(4) | ||||||||||
| £m | £m | £m | ||||||||||
| Net interest income from banking activities | 1,504 | 2,028 | 1,365 | |||||||||
| Funding costs of rental assets | (256 | ) | (380 | ) | (324 | ) | ||||||
| Net interest income | 1,248 | 1,648 | 1,041 | |||||||||
| Net fees and commissions receivable | 472 | 889 | 834 | |||||||||
| Loss from trading activities | (5,123 | ) | (7,716 | ) | (804 | ) | ||||||
| Insurance net premium income | 784 | 986 | 962 | |||||||||
| Other operating income | 318 | 1,161 | 2,994 | |||||||||
| Non-interest income | (3,549 | ) | (4,680 | ) | 3,986 | |||||||
| Total income | (2,301 | ) | (3,032 | ) | 5,027 | |||||||
| Direct expenses | ||||||||||||
| – staff | (851 | ) | (988 | ) | (508 | ) | ||||||
| – other | (1,044 | ) | (1,156 | ) | (1,004 | ) | ||||||
| Indirect expenses | (552 | ) | (539 | ) | (242 | ) | ||||||
| (2,447 | ) | (2,683 | ) | (1,754 | ) | |||||||
| Insurance net claims | (588 | ) | (700 | ) | (727 | ) | ||||||
| Impairment losses | (9,221 | ) | (4,936 | ) | (399 | ) | ||||||
| Operating (loss)/profit before tax | (14,557 | ) | (11,351 | ) | 2,147 | |||||||
| Analysis of income | ||||||||||||
| Banking & Portfolio | (1,338 | ) | 2,324 | |||||||||
International Businesses & Portfolios | 2,262 | 2,980 | ||||||||||
| Markets | (3,225 | ) | (8,336 | ) | ||||||||
| (2,301 | ) | (3,032 | ) | 5,027 | ||||||||
| Performance ratios | ||||||||||||
| Net interest margin | 0.69 | % | 0.87 | % | ||||||||
| Cost:income ratio | (106.3 | %) | (88.5 | %) | 34.9 | % | ||||||
| £bn | £bn | £bn | ||||||||||
Capital and balance sheet (1) | ||||||||||||
Total third party assets (including derivatives (2)) | 220.9 | 342.9 | 256.4 | |||||||||
| Loans and advances to customers – gross | 149.5 | 191.4 | 161.4 | |||||||||
| Customer deposits | 12.6 | 27.4 | 27.2 | |||||||||
| Risk elements in lending | 22.9 | 11.1 | ||||||||||
| Loan:deposit ratio | 1,121 | % | 683 | % | ||||||||
Risk-weighted assets (3) | 171.3 | 170.9 | ||||||||||
Notes:
| (1) | Includes disposal groups. |
| (2) | Derivatives were £19.9 billion at 31 December 2009 (31 December 2008 – £85.0 billion). |
| (3) | Includes Sempra: 31 December 2009 Third Party Assets (TPAs) £14.2 billion, RWAs £10.2 billion (31 December 2008 – TPAs £17.8 billion, RWAs £10.6 billion). |
| (4) | As noted on page 5, following a comprehensive strategic review, changes have been made to the Group’s operating segments in 2009. The company has also improved the granularity of certain segment information resulting in the provision of supplementary disclosures. However, it is not possible to source certain elements of these supplementary disclosures for 2007 without undue cost. |
60
Business review continued |
| 2009 | 2008 | 2007(4) | ||||||||||
| £m | £m | £m | ||||||||||
Credit and other market write-downs (1) | ||||||||||||
| Monoline exposures | 2,387 | 3,121 | ||||||||||
| CDPCs | 947 | 615 | ||||||||||
Asset backed products (2) | 288 | 3,220 | ||||||||||
| Other credit exotics | 558 | 935 | ||||||||||
| Equities | 47 | 947 | ||||||||||
| Leveraged finance | — | 1,088 | ||||||||||
| Banking book hedges | 1,613 | (1,690 | ) | |||||||||
| Other | (679 | ) | (497 | ) | ||||||||
| 5,161 | 7,739 | |||||||||||
| Impairment losses | ||||||||||||
| Banking & Portfolio | 4,215 | 938 | ||||||||||
| International Businesses & Portfolios | 4,494 | 1,832 | ||||||||||
| Markets | 512 | 2,166 | ||||||||||
| 9,221 | 4,936 | 399 | ||||||||||
Loan impairment charge as % of gross customer loans and advances (3) | ||||||||||||
| Banking & Portfolio | 4.91 | % | 0.90 | % | ||||||||
| International Businesses & Portfolios | 6.56 | % | 2.28 | % | ||||||||
| Markets | 5.34 | % | 13.32 | % | ||||||||
| Total | 5.66 | % | 2.18 | % | ||||||||
| £bn | £bn | |||||||||||
| Gross customer loans and advances | ||||||||||||
| Banking & Portfolio | 82.0 | 97.0 | ||||||||||
| International Businesses & Portfolios | 65.6 | 79.9 | ||||||||||
| Markets | 1.9 | 14.5 | ||||||||||
| 149.5 | 191.4 | 161.4 | ||||||||||
| Risk-weighted assets | ||||||||||||
| Banking & Portfolio | 58.2 | 63.1 | ||||||||||
| International Businesses & Portfolios | 43.8 | 50.1 | ||||||||||
| Markets | 69.3 | 57.7 | ||||||||||
| 171.3 | 170.9 | |||||||||||
Notes:
| (1) | Included in ‘Loss from trading activities’ on page 60. |
| (2) | Asset backed products include super senior asset backed structures and other asset backed products. |
| (3) | Includes disposal groups. |
| (4) | As noted on page 5, following a comprehensive strategic review, changes have been made to the Group’s operating segments in 2009. The company has also improved the granularity of certain segment information resulting in the provision of supplementary disclosures. However, it is not possible to source certain elements of these supplementary disclosures for 2007 without undue cost. |
61
Business review continued |
Loan impairment losses by donating division and sector
| 2009 | 2008 | 2007(1) | ||||||||||
| £m | £m | £m | ||||||||||
| UK Retail | ||||||||||||
| Mortgages | 5 | 1 | ||||||||||
| Personal | 48 | 42 | ||||||||||
| Other | — | 62 | ||||||||||
| Total UK Retail | 53 | 105 | ||||||||||
| UK Corporate | ||||||||||||
| Manufacturing & infrastructure | 87 | 42 | ||||||||||
| Property & construction | 637 | 281 | ||||||||||
| Transport | 10 | (3 | ) | |||||||||
| Banks & financials | 101 | 4 | ||||||||||
| Lombard | 122 | 61 | ||||||||||
| Invoice finance | 3 | — | ||||||||||
| Other | 717 | 142 | ||||||||||
| Total UK Corporate | 1,677 | 527 | ||||||||||
| Global Banking & Markets | ||||||||||||
| Manufacturing & infrastructure | 1,405 | 1,280 | ||||||||||
Property & construction | 1,413 | 710 | ||||||||||
| Transport | 178 | 12 | ||||||||||
| Telecoms, media & technology | 545 | 55 | ||||||||||
| Banks & financials | 567 | 870 | ||||||||||
| Other | 619 | 177 | ||||||||||
| Total Global Banking & Markets | 4,727 | 3,104 | ||||||||||
| Ulster Bank | ||||||||||||
| Mortgages | 42 | 6 | ||||||||||
| Commercial investment & development | 302 | 9 | ||||||||||
| Residential investment & development | 716 | 229 | ||||||||||
| Other | 217 | 60 | ||||||||||
| Other EMEA | 107 | 116 | ||||||||||
| Total Ulster Bank | 1,384 | 420 | ||||||||||
| US Retail & Commercial | ||||||||||||
| Auto & consumer | 136 | 140 | ||||||||||
| Cards | 130 | 63 | ||||||||||
| SBO/home equity | 445 | 321 | ||||||||||
| Residential mortgages | 55 | 6 | ||||||||||
| Commercial real estate | 228 | 54 | ||||||||||
| Commercial & other | 85 | 20 | ||||||||||
| Total US Retail & Commercial | 1,079 | 604 | ||||||||||
| Other | ||||||||||||
| Wealth | 251 | 174 | ||||||||||
| Global Transaction Services | 49 | (2 | ) | |||||||||
| Central items | 1 | 4 | ||||||||||
| Total Other | 301 | 176 | ||||||||||
| Total impairment losses | 9,221 | 4,936 | 399 | |||||||||
Note:
| (1) | As noted on page 5, following a comprehensive strategic review, changes have been made to the Group’s operating segments in 2009. The company has also improved the granularity of certain segment information resulting in the provision of supplementary disclosures. However, it is not possible to source certain elements of these supplementary disclosures for 2007 without undue cost. |
62
Business review continued |
Gross loans and advances to customers by donating division and sector (excluding reverse repurchase agreements)
| 2009 | 2008 | 2007(1) | |||||||
| £bn | £bn | £bn | |||||||
| UK Retail | |||||||||
| Mortgages | 1.9 | 2.2 | |||||||
| Personal | 0.7 | 1.1 | |||||||
| Total UK Retail | 2.6 | 3.3 | |||||||
| UK Corporate | |||||||||
| Manufacturing & infrastructure | 0.3 | 0.3 | |||||||
| Property & construction | 10.8 | 11.3 | |||||||
| Lombard | 2.7 | 3.7 | |||||||
| Invoice finance | 0.4 | 0.7 | |||||||
| Other | 20.7 | 22.1 | |||||||
| Total UK Corporate | 34.9 | 38.1 | |||||||
| Global Banking & Markets | |||||||||
| Manufacturing & infrastructure | 17.5 | ||||||||
Property & construction | 25.7 | ||||||||
| Transport | 5.8 | ||||||||
| Telecoms, media & technology | 3.2 | ||||||||
| Banks & financials | 16.0 | ||||||||
| Other | 13.5 | ||||||||
| Total Global Banking & Markets | 81.7 | 104.8 | |||||||
| Ulster Bank | |||||||||
| Mortgages | 6.0 | 6.5 | |||||||
| Commercial investment & development | 3.0 | 2.9 | |||||||
| Residential investment & development | 5.6 | 5.9 | |||||||
| Other | 1.1 | 1.1 | |||||||
| Other EMEA | 1.0 | 1.3 | |||||||
| Total Ulster Bank | 16.7 | 17.7 | |||||||
| US Retail & Commercial | |||||||||
| Auto & consumer | 3.2 | 4.2 | |||||||
| Cards | 0.5 | 0.7 | |||||||
| SBO/home equity | 3.7 | 5.2 | |||||||
| Residential mortgages | 0.8 | 1.1 | |||||||
| Commercial real estate | 1.9 | 3.0 | |||||||
| Commercial & other | 0.9 | 1.4 | |||||||
| Total US Retail & Commercial | 11.0 | 15.6 | |||||||
| Other | |||||||||
| Wealth | 2.6 | 3.6 | |||||||
| Global Transaction Services | 0.8 | 1.4 | |||||||
| RBS Insurance | 0.2 | 0.2 | |||||||
| Central items | (3.2 | ) | — | ||||||
| Total Other | 0.4 | 5.2 | |||||||
| Total loans and advances to customers | 147.3 | 184.7 | |||||||
Note:
| (1) | As noted on page 5, following a comprehensive strategic review, changes have been made to the Group’s operating segments in 2009. The company has also improved the granularity of certain segment information resulting in the provision of supplementary disclosures. However, it is not possible to source certain elements of these supplementary disclosures for 2007 without undue cost. |
63
Business review continued |
2009 compared with 2008
Losses from trading activities have declined significantly as underlying asset prices rallied. Mark to market values for exposures such as monolines, super senior high grade collateralised debt obligations, and many negative basis trade asset classes have risen over the course of 2009. However, the £1.6 billion gain recorded on banking book hedging in 2008 unwound over the course of the year to a loss of £1.6 billion in 2009, as spreads continued to tighten throughout the year, ending almost in line with origination levels.
Impairment losses increased to £9.2 billion, reflecting continued weakness in the economic environment, particularly across the corporate and property sectors. There were signs of a slowdown in the rate of provisioning towards the end of the year.
Staff costs decreased by 14% over the year, due to headcount reductions and business divestments, notably Linea Directa and Tesco Personal Finance. Lower depreciation charges followed the 2008 sale of the Angel Trains business.
Third party assets, excluding derivatives, decreased by £56.9 billion in the year as the division has run down exposures and pursued opportunities to dispose of loan portfolios. Sales of equity stakes, including Bank of China, were concluded while further disposals announced in 2009, including Asian retail and commercial operations, are moving towards completion in 2010.
Risk weighted assets increased by 0.2% in 2009. The reduction of 15% since 30 September 2009, reflects active management to reduce trading book exposures, largely offset by the impact of procyclicality, monoline downgrades and adverse market risk.
2008 compared with 2007
Overall results for 2008 deteriorated significantly due to the worsening of global economies and credit markets resulting in large increases in impairment losses and credit and other market write downs on trading activities. In addition 2008 included a full year of results from the acquisition of ABN AMRO compared with 76 days in the previous year.
Net interest income increased to £1,648 million and net fees and commissions increased to £889 million principally due to the inclusion of a full year of income for ABN AMRO. In 2008, losses from trading activities totalled £7,716 million compared with a loss of £804 million in 2007 including £10,172 million of credit and other market write downs, partially offset by £1,690 million gain on credit default swaps, particularly in the fourth quarter of 2008.
Other operating income reduced significantly due to the sale of a number of our private equity portfolios including Southern Water in 2007 which was not repeated in 2008.
The increase in operating expenses mainly reflects the inclusion of a full year of the ABN AMRO cost base partially offset by a reduction in bonus related expenses in 2008.
Insurance premiums and claims including Linea Directa were relatively stable.
Impairment losses increased to £4,936 million from £399 million, of which £3,105 million related to global corporate clients previously managed in our Global Banking & Markets division.
Third party assets had small increases in most areas. Loans and advances increased by £31 billion or 19%. Global clients saw increases of £15 billion, with steady, but smaller increases in the retail & commercial markets of UK, EME, Asia and the US.
Customer deposits remained largely unchanged.
Employee numbers at 31 December
(full time equivalents rounded to the nearest hundred)
| 2009 | 2008 | 2007 | ||||||||||
| UK Retail | 25,500 | 28,400 | 28,400 | |||||||||
| UK Corporate | 12,300 | 13,400 | 12,500 | |||||||||
| Wealth | 4,600 | 5,200 | 5,100 | |||||||||
| Global Banking & Markets | 16,800 | 16,500 | 22,000 | |||||||||
| Global Transaction Services | 3,500 | 3,900 | 3,100 | |||||||||
| Ulster Bank | 4,500 | 5,400 | 5,400 | |||||||||
| US Retail & Commercial | 15,500 | 16,200 | 16,300 | |||||||||
| RBS Insurance | 13,900 | 14,500 | 15,700 | |||||||||
| Central items | 4,200 | 4,300 | 4,300 | |||||||||
| Core | 100,800 | 107,800 | 112,800 | |||||||||
| Non-Core | 15,100 | 19,000 | 16,300 | |||||||||
| 115,900 | 126,800 | 129,100 | ||||||||||
| Business services | 44,200 | 47,600 | 44,700 | |||||||||
| Integration | 500 | 900 | — | |||||||||
| RFS Holdings minority interest | 23,100 | 24,500 | 21,600 | |||||||||
| Group total | 183,700 | 199,800 | 195,400 | |||||||||
64
Business review continued |
Consolidated balance sheet at 31 December 2009
| 2009 | 2008 | 2007 | ||||||||||
| £m | £m | £m | ||||||||||
| Assets | ||||||||||||
| Cash and balances at central banks | 52,261 | 12,400 | 17,866 | |||||||||
| Net loans and advances to banks | 56,656 | 79,426 | 43,519 | |||||||||
| Reverse repurchase agreements and stock borrowing | 35,097 | 58,771 | 175,941 | |||||||||
| Loans and advances to banks | 91,753 | 138,197 | 219,460 | |||||||||
| Net loans and advances to customers | 687,353 | 835,409 | 686,181 | |||||||||
| Reverse repurchase agreements and stock borrowing | 41,040 | 39,313 | 142,357 | |||||||||
| Loans and advances to customers | 728,393 | 874,722 | 828,538 | |||||||||
| Debt securities | 267,254 | 267,549 | 294,656 | |||||||||
| Equity shares | 19,528 | 26,330 | 53,026 | |||||||||
| Settlement balances | 12,033 | 17,832 | 16,589 | |||||||||
| Derivatives | 441,454 | 992,559 | 277,402 | |||||||||
| Intangible assets | 17,847 | 20,049 | 49,916 | |||||||||
| Property, plant and equipment | 19,397 | 18,949 | 18,745 | |||||||||
| Deferred taxation | 7,039 | 7,082 | 3,119 | |||||||||
| Prepayments, accrued income and other assets | 20,985 | 24,402 | 15,662 | |||||||||
| Assets of disposal groups | 18,542 | 1,581 | 45,850 | |||||||||
| Total assets | 1,696,486 | 2,401,652 | 1,840,829 | |||||||||
| Liabilities | ||||||||||||
| Bank deposits | 104,138 | 174,378 | 149,256 | |||||||||
| Repurchase agreements and stock lending | 38,006 | 83,666 | 163,038 | |||||||||
| Deposits by banks | 142,144 | 258,044 | 312,294 | |||||||||
| Customers deposits | 545,849 | 581,369 | 547,447 | |||||||||
| Repurchase agreements and stock lending | 68,353 | 58,143 | 134,916 | |||||||||
| Customer accounts | 614,202 | 639,512 | 682,363 | |||||||||
| Debt securities in issue | 267,568 | 300,289 | 274,172 | |||||||||
| Settlement balances and short positions | 50,876 | 54,277 | 91,021 | |||||||||
| Derivatives | 424,141 | 971,364 | 272,052 | |||||||||
| Accruals, deferred income and other liabilities | 30,327 | 31,482 | 34,208 | |||||||||
| Retirement benefit liabilities | 2,963 | 2,032 | 460 | |||||||||
| Deferred taxation | 2,811 | 4,165 | 5,400 | |||||||||
| Insurance liabilities | 10,281 | 9,976 | 10,162 | |||||||||
| Subordinated liabilities | 37,652 | 49,154 | 38,043 | |||||||||
| Liabilities of disposal groups | 18,890 | 859 | 29,228 | |||||||||
| Total liabilities | 1,601,855 | 2,321,154 | 1,749,403 | |||||||||
| Minority interests | 16,895 | 21,619 | 38,388 | |||||||||
| Owners’ equity | 77,736 | 58,879 | 53,038 | |||||||||
| Total equity | 94,631 | 80,498 | 91,426 | |||||||||
| Total liabilities and equity | 1,696,486 | 2,401,652 | 1,840,829 | |||||||||
Commentary on consolidated balance sheet: 2009 compared with 2008
Total assets of £1,696.5 billion at 31 December 2009 were down £705.2 billion, 29%, compared with 31 December 2008, principally reflecting substantial repayments of customer loans and advances as corporate customer demand fell and corporates looked to deleverage their balance sheets. Lending to banks also fell in line with significantly reduced wholesale funding activity. There were also significant falls in the value of derivative assets, with a corresponding fall in derivative liabilities.
Cash and balances at central banks were up £39.9 billion to £52.3 billion due to the placing of short-term cash surpluses, including the proceeds from the issue of B shares in December, with central banks.
Loans and advances to banks decreased by £46.4 billion, 34%, to £91.8 billion with reverse repurchase agreements and stock borrowing (‘reverse repos’) down by £23.7 billion, 40% to £35.1 billion and lower bank placings, down £22.7 billion, 29%, to £56.7 billion largely as a result of reduced wholesale funding activity in Global Banking & Markets.
Loans and advances to customers were down £146.3 billion, 17%, at £728.4 billion. Within this, reverse repos increased by 4%, £1.7 billion to £41.0 billion. Excluding reverse repos, lending decreased by £148.0 billion, 18%, to £687.4 billion or by £141.8 billion, 17%, before impairment provisions. This reflected reductions in Global Banking & Markets of £71.4 billion, and planned reductions in Non-Core of £30.1 billion, including a £3.2 billion transfer to disposal groups in respect of RBS Sempra Commodities and the Asian and Latin American businesses. Reductions were also experienced in US Retail & Commercial, £7.4 billion; UK Corporate & Commercial, £5.4 billion; Ulster Bank, £1.8 billion; and the effect of exchange rate movements, £33.1 billion, following the strengthening of sterling during the year, partially offset by growth in UK Retail of £9.2 billion, and in Wealth of £1.4 billion.
Debt securities were flat at £267.3 billion and equity shares decreased by £6.8 billion, 26%, to £19.5 billion, principally due to the sale of the Bank of China investment and lower holdings in Global Banking & Markets and Non-Core, largely offset by growth in Group Treasury, in part reflecting an £18.0 billion increase in the gilt liquidity portfolio, and in the RFS Holdings minority interest.
65
Business review continued |
Movements in the value of derivative assets, down £551.1 billion, 56%, to £441.5 billion, and liabilities, down £547.2 billion, 56%, to £424.1 billion, reflect the easing of market volatility, the strengthening of sterling and significant tightening in credit spreads in the continuing low interest rate environment.
Increases in assets and liabilities of disposal groups reflect the inclusion of the RBS Sempra Commodities business and the planned sale of a number of the Group’s retail and commercial activities in Asia and Latin America.
Deposits by banks declined by £115.9 billion, 45%, to £142.1 billion due to a decrease in repurchase agreements and stock lending (‘repos’), down £45.7 billion, 55%, to £38.0 billion and reduced inter-bank deposits, down £70.2 billion, 40% to £104.1 billion principally in Global Banking & Markets, reflecting reduced reliance on wholesale funding, and in the RFS Holdings minority interest.
Customer accounts were down £25.3 billion, 4%, to £614.2 billion. Within this, repos increased £10.2 billion, 18%, to £68.4 billion. Excluding repos, deposits were down £35.5 billion, 6%, to £545.8 billion, primarily due to; reductions in Global Banking & Markets, down £43.6 billion; Non-Core, £13.0 billion; including the transfer of £8.9 billion to disposal groups; and Ulster Bank, £1.2 billion; together with exchange rate movements, £21.3 billion, offset in part by growth across all other divisions, up £23.0 billion, and in the RFS Holdings minority interest, up £20.6 billion.
Debt securities in issue were down £32.7 billion, 11% to £267.6 billion mainly as a result of movements in exchange rates, together with reductions in Global Banking & Markets, Non-Core and the RFS Holdings minority interest.
Retirement benefit liabilities increased by £0.9 billion, 46%, to £3.0 billion, with net actuarial losses of £3.7 billion, arising from lower discount rates and higher assumed inflation, partially offset by curtailment gains of £2.1 billion due to changes in prospective pension benefits.
Subordinated liabilities were down £11.5 billion, 23% to £37.7 billion, reflecting the redemption of £5.0 billion undated loan capital, £1.5 billion trust preferred securities and £2.7 billion dated loan capital, together with the effect of exchange rate movements and other adjustments, £2.9 billion, partly offset by the issue of £2.3 billion undated loan capital within the RFS Holdings minority interest.
Equity minority interests decreased by £4.7 billion, 22%, to £16.9 billion. Equity withdrawals of £3.1 billion, due to the disposal of the investment in the Bank of China attributable to minority shareholders and the redemption, in part, of certain trust preferred securities, exchange rate movements of £1.4 billion, the recycling of related available-for-sale reserves to income, £0.5 billion, and dividends paid of £0.3 billion, were partially offset by attributable profits of £0.3 billion.
Owners' equity increased by £18.9 billion, 32% to £77.7 billion. The issue of B shares to HM Treasury in December 2009 raised £25.1 billion, net of expenses, and was offset in part by the creation of a £1.2 billion reserve in respect of contingent capital B shares. The placing and open offer in April 2009 raised £5.3 billion to fund the redemption of the £5.0 billion preference shares issued to HM Treasury in December 2008. Actuarial losses, net of tax, of £2.7 billion; the attributable loss for the period, £2.7 billion; exchange rate movements of £1.9 billion; the payment of other owners dividends of £0.9 billion including £0.3 billion to HM Treasury on the redemption of preference shares, and partial redemption of paid-in equity £0.3 billion were partly offset by increases in available-for-sale reserves, £1.8 billion; cash flow hedging reserves, £0.6 billion; and the equity owners gain on withdrawal of minority interests, net of tax, of £0.5 billion arising from the redemption of trust preferred securities.
Commentary on consolidated balance sheet: 2008 compared with 2007
Total assets of £2,401.7 billion at 31 December 2008 were up £560.8 billion, 30%, compared with 31 December 2007.
Loans and advances to banks decreased by £81.3 billion, 37%, to £138.2 billion. Reverse repurchase agreements and stock borrowing (‘reverse repos’) were down by £117.2 billion, 67% to £58.8 billion. Excluding reverse repos, bank placings increased by £35.9 billion, 83%, to £79.4 billion.
Loans and advances to customers were up £46.2 billion, 6%, at £874.7 billion or £68.0 billion, 8% following the disposal of the Banco Real and other businesses to Santander and Tesco Personal Finance. Within this, reverse repos decreased by 72%, £103.0 billion to £39.3 billion. Excluding reverse repos, lending rose by £149.2 billion, 22% to £835.4 billion reflecting both organic growth and the effect of exchange rate movements following the weakening of sterling during the second half of 2008.
Debt securities decreased by £27.1 billion, 9%, to £267.5 billion and equity shares decreased by £26.7 billion, 50%, to £26.3 billion principally due to lower holdings in Global Banking & Markets.
66
Business review continued |
Movements in the value of derivatives, assets and liabilities, primarily reflect changes in interest and exchange rates, together with growth in trading volumes.
Intangible assets declined by £29.9 billion, 60% to £20.0 billion, reflecting impairment of £32.6 billion and the disposals of the Asset Management business of ABN AMRO, Banca Antonveneta and the Banco Real and other businesses of ABN AMRO acquired by Santander, £7.2 billion. This was offset by exchange rate movements of £11.8 billion, goodwill of £0.2 billion arising on the Sempra joint venture and £0.3 billion on the buyout of the outstanding ABN AMRO shareholdings not previously owned by the Group.
Deferred tax assets increased £4.0 billion to £7.1 billion principally due to carried forward trading losses.
Prepayments, accrued income and other assets were up £8.7 billion, 56% to £24.4 billion.
Assets and liabilities of disposal groups decreased following completion of the sales of the Asset Management business of ABN AMRO to Fortis, Banca Antonveneta to Monte dei Paschi di Sienna and the majority of ABN AMRO’s Private Equity business to third parties.
Deposits by banks declined by £54.3 billion, 17% to £258.0 billion. This reflected decreased repurchase agreements and stock lending (‘repos’), down £79.4 billion, 49% to £83.7 billion partly offset by increased inter-bank deposits, up £25.1 billion, 17% to £174.4 billion.
Customer accounts were down £42.9 billion, 6% to £639.5 billion or £21.6 billion, 3% excluding disposals of subsidiaries. Within this, repos decreased £76.8 billion, 57% to £58.1 billion. Excluding repos, deposits rose by £33.9 billion, 6%, to £581.4 billion.
Debt securities in issue were up £26.1 billion, 10% to £300.3 billion mainly resulting from the effect of exchange rate movements.
Settlement balances and short positions were down £36.7 billion, 40%, to £54.3 billion reflecting reduced customer activity.
Accruals, deferred income and other liabilities decreased £2.7 billion, 8%, to £31.5 billion primarily as a result of disposals.
Retirement benefit liabilities increased by £1.6 billion to £2.0 billion due to reduced asset values only partly offset by the effect of increased discount rates.
Deferred taxation liabilities decreased by £1.2 billion, 23% to £4.2 billion due in part to the sale of Angel Trains.
Subordinated liabilities were up £11.1 billion, 29% to £49.2 billion. The issue of £2.4 billion dated loan capital and the effect of exchange rate and other adjustments, £11.3 billion, were partially offset by the redemption of £1.6 billion of dated loan capital, £0.1 billion undated loan capital and £0.9 billion in respect of the disposal of the Banco Real and other businesses of ABN AMRO to Santander.
Equity minority interests decreased by £16.8 billion, 44% to £21.6 billion. Attributable losses of £ 10.8 billion, including £15.7 billion of write downs of goodwill and other intangible assets in respect of the State of the Netherlands investment in RFS Holdings, equity withdrawals of £13.6 billion, including £12.3 billion by Santander following the disposals of Banca Antonveneta and Banco Real, reductions in the market value of available-for-sale securities of £1.4 billion, mainly the investment in Bank of China attributable to minority shareholders, movements in cash flow hedging reserves, £0.8 billion, actuarial losses on defined benefit pension schemes net of tax of £0.5 billion and dividends paid of £0.3 billion, were partially offset by effect of exchange rate movements of £9.1 billion of which £8.0 billion related to the State of the Netherlands and Santander investments in RFS Holdings, the £0.8 billion equity raised as part of the Sempra joint venture and £0.4 billion additional equity in respect of the buy-out of the ABN AMRO minority shareholders.
Owners’ equity increased by £5.8 billion, 11% to £58.9 billion. Proceeds of £12.0 billion from the rights issue, net of £246 million expenses, and £19.7 billion from the placing and open offer, net of expenses of £265 million, together with exchange rate movements of £6.8 billion and other movements of £0.2 billion were partially offset by the attributable loss for the period of £23.7 billion, a £4.6 billion decrease in available-for-sale reserves, net of tax, reflecting £1.0 billion in the Group’s share in the investment in Bank of China and £3.6 billion in other securities, the majority of which related to Global Banking & Markets, actuarial losses net of tax of £1.3 billion, the payment of the 2007 final ordinary dividend of £2.3 billion and other dividends of £0.6 billion, and a reduction in the cash flow hedging reserve of £0.3 billion.
67
Business review continued |
Cash flow
| 2009 | 2008 | 2007 | ||||||||||
| £m | £m | £m | ||||||||||
| Net cash flows from operating activities | (992 | ) | (75,338 | ) | 25,604 | |||||||
| Net cash flows from investing activities | 54 | 16,997 | 15,999 | |||||||||
| Net cash flows from financing activities | 18,791 | 15,102 | 29,691 | |||||||||
| Effects of exchange rate changes on cash and cash equivalents | (8,592 | ) | 29,209 | 6,010 | ||||||||
| Net increase/(decrease) in cash and cash equivalents | 9,261 | (14,030 | ) | 77,304 | ||||||||
2009
The major factors contributing to the net cash outflow from operating activities of £992 million were the net operating loss before tax of £2,696 million from continuing and discontinued operations, the decrease of £15,964 million in operating liabilities less operating assets, partly offset by the elimination of foreign exchange differences of £12,217 million and other items of £5,451 million.
Net cash flows from investing activities of £54 million relate to the net sales and maturities of securities of £2,899 million and a net cash inflow of £105 million in respect of other acquisitions and disposals less the net cash outflow on disposals of property, plant and equipment of £2,950 million.
Net cash flows from financing activities of £18,791 million primarily arose from the capital raised from the issue of B Shares of £25,101 million, the placing and open offer of £5,274 million and the issue of subordinated liabilities of £2,309 million. This was offset in part by the cash outflow on repayment of subordinated liabilities of £5,145 million, redemption of preference shares of £5,000 million, interest paid on subordinated liabilities of £1,746 million and dividends paid of £1,248 million.
2008
The major factors contributing to the net cash outflow from operating activities of £75,338 million were the net operating loss before tax of £36,628 million from continuing and discontinued operations, the decrease of £42,219 million in operating liabilities less operating assets, and the elimination of foreign exchange differences of £41,874 million, partly offset by the write down of goodwill and other intangible assets, £32,581 million and other non-cash items, £8,772 million.
Proceeds on disposal of discontinued activities of £20,113 million was the largest element giving rise to net cash flows of investing activities of £16,997 million. Outflow from net purchases of securities of £1,839 million and net disposals of property, plant and equipment, £3,529 million less the net cash inflow of £2,252 million in respect of other acquisitions and disposals represented the other principal factors.
Net cash flows from financing activities of £15,102 million primarily arose from the capital raised from the placing and open offer of £19,741 million and the rights issue of £12,000 million, the issue of subordinated liabilities of £2,413 million and proceeds of minority interests, £1,427 million. This was offset in part by the cash outflow on redemption of minority interests of £13,579 million, repayment of subordinated liabilities of £1,727 million, dividends paid of £3,193 million and interest paid on subordinated liabilities of £1,967 million.
2007
The major factors contributing to the net cash inflow from operating activities of £25,604 million were the increase of £28,261 million in operating liabilities less operating assets and the profit before tax of £9,900 million, partly offset by the elimination of foreign exchange differences of £10,282 million and income taxes paid of £2,442 million.
The acquisition of ABN AMRO, included within net investment in business interests and intangible assets of £13,640 million, was the largest element giving rise to net cash flows from investing activities of £15,999 million, with cash and cash equivalents acquired of £60,093 million more than offsetting the cash consideration paid of £45,856 million. Net sales and maturities of securities of £1,987 million and net disposals of property, plant and equipment, £706 million less the net cash outflow of £597 million in respect of other acquisitions and disposals represented the other principle factors.
Net cash flows from financing activities of £29,691 million primarily relate to the cash injection of £31,019 million from the consortium partners in relation to the acquisition of ABN AMRO, together with the issue of £4,829 million of equity securities and £1,018 million of subordinated liabilities, offset in part by dividend payments of £3,411 million, the repayment of £1,708 million subordinated liabilities, interest on subordinated liabilities of £1,522 million and the redemption of £545 million of minority interests.
68
Business review continued |
Capital resources
The following table analyses the Group’s regulatory capital resources on a fully consolidated basis at 31 December, the basis monitored by the FSA for regulatory purposes (refer to page 74 for further details):
| 2009 | 2008 | 2007 | 2006 | 2005 | ||||||||||||||||
| £m | £m | £m | £m | £m | ||||||||||||||||
| Capital base | ||||||||||||||||||||
| Tier 1 capital | 76,421 | 69,847 | 44,364 | 30,041 | 28,218 | |||||||||||||||
| Tier 2 capital | 15,389 | 32,223 | 33,693 | 27,491 | 22,437 | |||||||||||||||
| Tier 3 capital | — | 260 | 200 | — | — | |||||||||||||||
| 91,810 | 102,330 | 78,257 | 57,532 | 50,655 | ||||||||||||||||
| Less: Supervisory deductions | (4,565 | ) | (4,155 | ) | (10,283 | ) | (10,583 | ) | (7,282 | ) | ||||||||||
| Total capital | 87,245 | 98,175 | 67,974 | 46,949 | 43,373 | |||||||||||||||
| Risk-weighted assets | ||||||||||||||||||||
| Credit risk | 513,200 | 551,300 | ||||||||||||||||||
| Counterparty risk | 56,500 | 61,100 | ||||||||||||||||||
| Market risk | 65,000 | 46,500 | ||||||||||||||||||
| Operational risk | 33,900 | 36,900 | ||||||||||||||||||
| 668,600 | 695,800 | |||||||||||||||||||
| APS relief | (127,600 | ) | — | |||||||||||||||||
| 541,000 | 695,800 | |||||||||||||||||||
| Banking book: | ||||||||||||||||||||
| On-balance sheet | 480,200 | 318,600 | 303,300 | |||||||||||||||||
| Off-balance sheet | 84,600 | 59,400 | 51,500 | |||||||||||||||||
| Trading book | 44,200 | 22,300 | 16,200 | |||||||||||||||||
| 609,000 | 400,300 | 371,000 | ||||||||||||||||||
| Risk asset ratios | % | % | % | % | % | |||||||||||||||
| Core Tier 1 | 11.0 | 6.6 | 4.5 | |||||||||||||||||
| Tier 1 | 14.1 | 10.0 | 7.3 | 7.5 | 7.6 | |||||||||||||||
| Total | 16.1 | 14.1 | 11.2 | 11.7 | 11.7 | |||||||||||||||
Note:
| (1) | The data for 2009 and 2008 are on a Basel II basis; prior periods are on a Basel I basis. |
It is the Group’s policy to maintain a strong capital base, to expand it as appropriate and to utilise it efficiently throughout its activities to optimise the return to shareholders while maintaining a prudent relationship between the capital base and the underlying risks of the business. In carrying out this policy, the Group has regard to the supervisory requirements of the Financial Services Authority (FSA). The FSA uses Risk Asset Ratio (RAR) as a measure of capital adequacy in the UK banking sector, comparing a bank’s capital resources with its risk-weighted assets (the assets and off-balance sheet exposures are ‘weighted’ to reflect the inherent credit and other risks); by international agreement, the RAR should be not less than 8% with a Tier 1 component of not less than 4%. At 31 December 2009, the Group’s total RAR was 16.1% (2008 – 14.1%, 2007 – 11.2%) and the Tier 1 RAR was 14.1% (2008 – 10.0%, 2007 – 7.3%).
69
Business review
Risk, capital and liquidity management
Risk, capital and liquidity management
On pages 70 to 159 of the Business review certain information has been audited and is part of the Group’s financial statements as permitted by IFRS 7. Other disclosures are unaudited and labelled with an asterisk (*). Key points within this section generally relate to the Group before RFS Holdings minority interest.
Overview*
Conditions during the year continued to prove challenging as the ongoing deterioration in economic conditions and financial markets seen during 2008 continued into 2009. Market stress peaked during the first quarter of 2009 with broad improvement since then. This reflects a global effort by many governments and central banks to ease monetary conditions, increase liquidity within the financial system and support banks with a combination of increased capital, guarantees and strengthened deposit insurance. One resulting benefit for banks generally has been a significant improvement in the liquidity of money and debt markets. At the same time, regulatory oversight of the banking sector has increased globally and is expected to continue at a heightened level.
More recently, the major economies have started to demonstrate a gradually improving macroeconomic position, although conditions remain fragile. Areas of particular uncertainty include possible effects from governments ending their financial stimulus initiatives and central banks moving to exit from positions of historically very low interest rates, as well as reversing quantitative easing. These look likely to occur against a backdrop of heightened personal and corporate insolvency as well as rising unemployment.
The Group has been developing and adapting to an evolving economic environment, against a background of the strategic review which includes a clearly stated ambition to achieve standalone strength. The core aims of the strategic plan are to improve the risk profile of the Group and to reposition the balance sheet around the Group’s core strengths. The Group level risk appetite statements and limits have been reviewed to ensure they are in line with the strategy. Any potential areas of misalignment between risk appetite and the Group strategy have been discussed by the Executive Risk Forum and remediation plans have been put in place.
Enhancements have been made to a number of the risk frameworks, including:
| · | A new credit approval process has been introduced during the year, based on a pairing of business and risk managers authorised to approve credit. This replaced the former credit committee process; |
| · | Exposure to higher risk countries has been reduced and a new risk limits framework has been implemented across the Group; |
| · | Single name and sector wide credit concentrations continue to receive a high level of attention and further enhancements to the frameworks were agreed in the fourth quarter of the year; |
| · | In addition to the move to value-at-risk (VaR) based on a 99% confidence level, from 95%, the Group has improved and strengthened its market risk limit framework increasing the transparency of market risk taken across the Group’s businesses in both the trading and non-trading portfolios; |
| · | The Group’s funding and liquidity profile is supported by explicit targets and metrics to control the size and extent of both short-term and long-term liquidity risk; and |
| · | An improved reporting programme has been implemented to increase transparency and improve the management of risk exposures. |
Credit impairments in 2009 were materially higher than the previous year. As the year progressed, the level of impairments moderated, with the highest quarterly charge incurred in the second quarter. It is expected that the results for 2010 and 2011 will continue to be affected by a heightened level of credit impairments as exposures in the Non-Core division are managed down and the economic environment continues to impact the Core business. The risk weightings applied to assets are also expected to increase due to procyclicality and as a result the amount of capital that banks generally are required to hold will increase. Future regulatory changes are also expected to increase the capital requirements of the banking sector. Against this background, the Non-Core portfolio is reducing and the Group has materially strengthened its capital base through the B share issuance in December 2009.
| * unaudited |
70
Business review continued
Risk, capital and liquidity governance*
The risk, capital and liquidity management strategies are owned and set by the Group’s Board of Directors, and implemented by executive management led by the Group Chief Executive. There are a number of committees and executives that support the execution of the business plan and strategy, as set out below. Representation by and interaction between the individual risk disciplines is a key feature of the governance structure, with the aim of promoting cross-risk linkages.
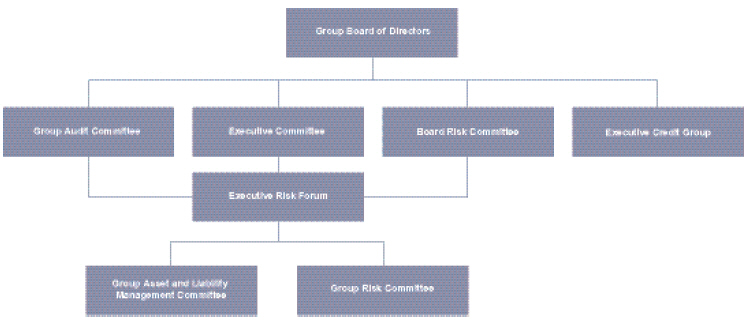
Note:
| For key changes to the risk, capital and liquidity governance structure, refer to the table overleaf. |
| * unaudited |
71
Business review
Risk, capital and liquidity management
Risk, capital and liquidity governance* continued
| The role and remit of these committees is as follows: | ||
| Committee | Focus | Membership | ||||
| Group Audit Committee (GAC) | Financial reporting and the application of accounting policies as part of the internal control and risk assessment process. From a historical perspective, GAC monitors the identification, evaluation and management of all significant risks throughout the Group. | Independent non-executive directors | ||||
| Board Risk Committee (BRC) | A new committee, formed to provide oversight and advice to the Group Board in relation to current and potential future risk exposures of the Group and future risk strategy. Reports to the Group Board, identifying any matters within its remit in respect of which it considers an action or improvement is needed, and making recommendations as to the steps to be taken. Provides quantitative and qualitative advice to the Remuneration Committee upon the Group Remuneration Policy and the implications for risk management. | At least three independent non-executive directors, one of whom is the Chairman of the Group Audit Committee | ||||
| Executive Credit Group (ECG) | Formed to replace the Advances Committee and the Group Credit Committee, the ECG decides on requests for the extension of existing or new credit limits on behalf of the Board of Directors which exceed the delegated authorities of individuals throughout the Group as determined by the credit approval grid. The Head of Restructuring and Risk or the Group Chief Credit Officer must be present along with at least one other member to ensure the meeting is quorate. | Group Chief Executive Head of Restructuring and Risk Group Chief Risk Officer Group Chief Credit Officer Chief Executive Officer from each division Group Finance Director | ||||
| Executive Committee (ExCo) | A newly formed committee responsible for managing Group wide issues and those operational issues material to the broader Group. | Group Chief Executive Business and function heads, as determined by the Group Chief Executive/Board Head of Restructuring and Risk Group Finance Director | ||||
| Group Risk Committee (GRC) | Recommends limits and approves processes and major policies to ensure the effective management of all material risks across the Group. | Head of Restructuring and Risk Group Chief Risk Officer Group Head of each risk function Group Head of Country Risk Global Head of Risk Architecture Deputy Group Finance Director Chief Operating Officer, RBS Risk Management Chief Executive and Chief Risk Officer from each division | ||||
| Group Asset and Liability Management Committee (GALCO) | Identifies, manages and controls the Group balance sheet risks. | Group Finance Director Deputy Group Finance Director Head of Restructuring and Risk Chief Executive from each division Group Chief Accountant Group Treasurer and Deputy Group Treasurer Chief Financial Officer, ABN AMRO Director, Group Corporate Finance Director, Group Financial Planning & Analysis Head of Balance Sheet Management, Group Treasury | ||||
| Executive Risk Forum (ERF) | Acts on all strategic risk and control matters across the Group including, but not limited to, credit risk, market risk, operational risk, compliance and regulatory risk, enterprise risk, treasury and liquidity risk, reputational risk, insurance risk and country risk. | Group Chief Executive Head of Restructuring and Risk Group Chief Risk Officer Group Finance Director Chief Executive Officer from each division |
| Note: |
| These committees are supported at a divisional level by a risk governance structure embedded in the businesses. |
* unaudited
72
Business review continued |
Risk, capital and liquidity governance* continued
Management responsibilities
All employees have a role to play in the day-to-day management of capital, liquidity and risk which is set and managed by specialist staff in:
| · | Risk Management: credit risk, market risk, operational risk, regulatory risk, reputational risk, insurance risk and country risk, together with risk analytics; and |
| · | Group Treasury: balance sheet, capital management, intra-group exposure, funding, liquidity and hedging policies. |
Independence underpins the approach to risk management, which is reinforced throughout the Group by appropriate reporting lines. Risk Management and Group Treasury functions are independent of the revenue generating business. As part of the move towards greater functional independence, the divisional Chief Risk Officers have a direct reporting line to the Head of Restructuring and Risk as well as to their divisional CEOs.
Group Internal Audit supports the GAC in providing an independent assessment of the design, adequacy and effectiveness of the internal controls relating to risk management.
Risk appetite
Risk appetite is an expression of the maximum level of risk that the Group is prepared to accept in order to deliver its business objectives. Risk and capital management across the Group is based on the risk appetite set by the Board, who ultimately approve annual plans for each division and regularly reviews and monitors the Group’s performance in relation to risk.
Risk appetite is defined in both quantitative and qualitative terms as follows:
| · | Quantitative: encompassing stress testing, risk concentration, VaR, liquidity and credit related metrics; and |
| · | Qualitative: ensuring that the Group applies the correct principles, policies and procedures. |
Different techniques are used to ensure that the Group’s risk appetite is achieved. The Board Risk Committee considers and recommends for approval by the Group Board, the Group’s risk appetite framework and tolerance for current and future strategy, taking into account the Group’s capital adequacy and the external risk environment. The ERF is responsible for ensuring that the implementation of strategy and operations are in line with the risk appetite determined by the Board. This is reinforced through policy and limit frameworks ensuring that all staff within the Group make appropriate risk and reward trade-offs within pre-agreed boundaries.
The annual business planning and performance management processes and associated activities together ensure that the expression of risk appetite remains appropriate. Both GRC and GALCO support this work.

Remuneration responsibilities
In August 2009, the Financial Services Authority (FSA) published its Code of Remuneration Practices (the Code). The Code requires the Group to establish, implement and maintain remuneration policies, procedures and practices that promote and are consistent with effective risk management.
The Risk Management function provides input to the Remuneration Committee on the remuneration policy for the Group. Each division is allocated risk objectives as part of the strategic plan and achievement of these objectives is evaluated as part of the annual performance management process.
During 2009 Risk Management provided formal independent 360° feedback for key individuals, reviewing their capability and performance in relation to managing risk. Individuals selected perform roles of significant influence and their activities have, or could have, a material impact on the Group’s risk profile.
An annual report on the risk performance of each division, including both qualitative and quantitative information is provided to the Remuneration Committee to allow consideration of adjustments relating to the compensation for the performance year.
Capital*
Capital resources
It is the Group’s policy to maintain a strong capital base and to utilise it efficiently throughout its activities to optimise the return to shareholders, while maintaining a prudent relationship between the capital base and the underlying risks of the business. In carrying out this policy, the Group has regard to the supervisory requirements of the FSA. The FSA uses Risk Asset Ratio (RAR) as a measure of capital adequacy in the UK banking sector, comparing a bank’s capital resources with its risk-weighted assets (RWAs) (the assets and off-balance sheet exposures are ‘weighted’ to reflect the inherent credit and other risks); by international agreement, the RAR should be not less than 8% with a Tier 1 component of not less than 4%. At 31 December 2009, the Group’s total RAR was 16.1% (2008 – 14.1%) and the Tier 1 RAR was 14.1% (2008 – 10.0%).
As part of the annual planning and budgeting cycle, each division is allocated capital based upon RWAs and associated regulatory deductions. The budgeting process considers risk appetite, available capital resources, stress testing results and business strategy. The budget is agreed by the Board and allocated to divisions to manage their allocated RWAs.
Group Treasury and GALCO monitor available capital and its utilisation across divisions. GALCO makes the necessary decisions around reallocation of budget and changes in RWA allocations.
| * unaudited |
73
Risk, capital and liquidity management
Capital* continued
Capital resources continued
In addition to the fully consolidated basis monitored by the FSA for regulatory purposes, the Group also monitors its regulatory capital resources on a proportional consolidation basis reflecting the pending separation of the RFS Minority Interest. The Group’s regulatory capital resources on a proportional consolidation basis at 31 December 2009 and in accordance with the FSA definitions were as follows:
| 2009 | 2008 | |||||||
Composition of regulatory capital (proportional) | £m | £m | ||||||
Tier 1 | ||||||||
Ordinary and B shareholders' equity | 69,890 | 45,525 | ||||||
Minority interests | 2,227 | 5,436 | ||||||
Adjustments for: | ||||||||
– Goodwill and other intangible assets – continuing | (14,786 | ) | (16,386 | ) | ||||
– Goodwill and other intangible assets of discontinued businesses | (238 | ) | — | |||||
– Unrealised losses on available-for-sale debt securities | 1,888 | 3,687 | ||||||
– Reserves arising on revaluation of property and unrealised gains on available-for-sale equities | (207 | ) | (984 | ) | ||||
– Reallocation of preference shares and innovative securities | (656 | ) | (1,813 | ) | ||||
– Other regulatory adjustments | (950 | ) | 9 | |||||
Less excess of expected losses over provisions net of tax | (2,558 | ) | (770 | ) | ||||
Less securitisation positions | (1,353 | ) | (663 | ) | ||||
Less APS first loss | (5,106 | ) | — | |||||
Core Tier 1 capital | 48,151 | 34,041 | ||||||
Preference shares | 11,265 | 16,655 | ||||||
Innovative Tier 1 securities | 2,772 | 6,436 | ||||||
Tax on the excess of expected losses over provisions | 1,020 | 308 | ||||||
Less deductions from Tier 1 capital | (310 | ) | (316 | ) | ||||
Total Tier 1 capital | 62,898 | 57,124 | ||||||
Tier 2 | ||||||||
Reserves arising on revaluation of property and unrealised gains on available-for-sale equities | 207 | 984 | ||||||
Collective impairment allowances | 796 | 666 | ||||||
Perpetual subordinated debt | 4,200 | 9,079 | ||||||
Term subordinated debt | 18,120 | 20,282 | ||||||
Minority and other interests in Tier 2 capital | 11 | 11 | ||||||
Less deductions from Tier 2 capital | (5,241 | ) | (2,055 | ) | ||||
Less APS first loss | (5,106 | ) | — | |||||
Total Tier 2 capital | 12,987 | 28,967 | ||||||
Tier 3 | — | 260 | ||||||
Supervisory deductions | ||||||||
Unconsolidated investments | ||||||||
– RBS Insurance | (4,068 | ) | (3,628 | ) | ||||
– Other investments | (404 | ) | (416 | ) | ||||
Other | (93 | ) | (111 | ) | ||||
Deductions from total capital | (4,565 | ) | (4,155 | ) | ||||
Total regulatory capital | 71,320 | 82,196 | ||||||
Risk weighted assets | ||||||||
Credit risk | 410,400 | 433,400 | ||||||
Counterparty risk | 56,500 | 61,100 | ||||||
Market risk | 65,000 | 46,500 | ||||||
Operational risk | 33,900 | 36,800 | ||||||
| 565,800 | 577,800 | |||||||
APS relief | (127,600 | ) | — | |||||
| 438,200 | 577,800 | |||||||
Risk asset ratio | ||||||||
Core Tier 1 | 11.0 | % | 5.9 | % | ||||
Tier 1 | 14.4 | % | 9.9 | % | ||||
Total | 16.3 | % | 14.2 | % | ||||
| * unaudited |
74
Capital* continued
Capital resources continued
The following table analyses the Group's regulatory capital resources on a fully consolidated basis at 31 December, the basis monitored by the FSA for regulatory purposes (refer to page 74 for further details):
| 2009 | 2008 | |||||||
Composition of regulatory capital (statutory) | £m | £m | ||||||
Tier 1 | ||||||||
Ordinary and B shareholders' equity | 69,890 | 45,525 | ||||||
Minority interests | 16,895 | 21,619 | ||||||
Adjustments for: | ||||||||
– Goodwill and other intangible assets – continuing | (17,847 | ) | (20,049 | ) | ||||
– Goodwill and other intangible assets of discontinued businesses | (238 | ) | — | |||||
– Unrealised losses on available-for-sale debt securities | 1,888 | 3,687 | ||||||
– Reserves arising on revaluation of property and unrealised gains on available-for-sale equities | (207 | ) | (984 | ) | ||||
– Reallocation of preference shares and innovative securities | (656 | ) | (1,813 | ) | ||||
– Other regulatory adjustments | (1,184 | ) | (362 | ) | ||||
Less excess of expected losses over provisions net of tax | (2,558 | ) | (770 | ) | ||||
Less securitisation positions | (1,353 | ) | (663 | ) | ||||
Less APS first loss | (5,106 | ) | — | |||||
Core Tier 1 capital | 59,524 | 46,190 | ||||||
Preference shares | 11,265 | 16,655 | ||||||
Innovative Tier 1 securities | 5,213 | 7,383 | ||||||
Tax on the excess of expected losses over provisions | 1,020 | 308 | ||||||
Less deductions from Tier 1 capital | (601 | ) | (689 | ) | ||||
Total Tier 1 capital | 76,421 | 69,847 | ||||||
Tier 2 | ||||||||
Reserves arising on revaluation of property and unrealised gains on available-for-sale equities | 207 | 984 | ||||||
Collective impairment allowances | 796 | 666 | ||||||
Perpetual subordinated debt | 4,950 | 9,829 | ||||||
Term subordinated debt | 20,063 | 23,162 | ||||||
Minority and other interests in Tier 2 capital | 11 | 11 | ||||||
Less deductions from Tier 2 capital | (5,532 | ) | (2,429 | ) | ||||
Less APS first loss | (5,106 | ) | — | |||||
Total Tier 2 capital | 15,389 | 32,223 | ||||||
Tier 3 | — | 260 | ||||||
Supervisory deductions | ||||||||
Unconsolidated investments | (4,472 | ) | (4,044 | ) | ||||
Other | (93 | ) | (111 | ) | ||||
Deductions from total capital | (4,565 | ) | (4,155 | ) | ||||
Total regulatory capital | 87,245 | 98,175 | ||||||
Risk-weighted assets | ||||||||
Credit risk | 513,200 | 551,300 | ||||||
Counterparty risk | 56,500 | 61,100 | ||||||
Market risk | 65,000 | 46,500 | ||||||
Operational risk | 33,900 | 36,900 | ||||||
| 668,600 | 695,800 | |||||||
APS relief | (127,600 | ) | — | |||||
| 541,000 | 695,800 | |||||||
Risk asset ratio | ||||||||
Core Tier 1 | 11.0 | % | 6.6 | % | ||||
Tier 1 | 14.1 | % | 10.0 | % | ||||
Total | 16.1 | % | 14.1 | % | ||||
| * unaudited |
75
Business review
Risk, capital and liquidity management
Capital* continued
Regulatory developments continued
The Group has seen a continuation of challenging financial market and economic conditions during 2009. Although some signs of improvement have started to emerge, the performance of key economies remains uncertain and the Group has continued to experience material impairment losses and credit market write-downs, including further write-downs in respect of monoline exposures. The majority of these are in the Non-Core division, which in time will be run down, significantly reducing the size of the Group’s balance sheet and associated capital requirements.
In April 2009, £5 billion of preference shares were redeemed and replaced by ordinary shares using the proceeds of the Second Placing and Open Offer. This strengthened the Group’s Core Tier 1 capital, enhancing its financial stability during a tough economic and market period.
As an interim measure pending full compliance with Basel II, the Group, with the agreement of the regulators, consolidates the RWAs of ABN AMRO on the basis of Basel I plus an adjustment factor. The Group is advanced in its preparation for moving to a Basel II compliant approach for the ABN AMRO businesses it will retain. As part of this transition the Group has agreed with the FSA to increase the adjustment factor with effect from 31 December 2009 to reflect changing circumstances. This change has increased RWAs by approximately £8 billion thereby reducing the Core Tier 1 ratio at 31 December 2009 by 20 basis points.
Asset Protection Scheme
On 22 December 2009, the Group acceded to the Asset Protection Scheme (‘APS’ or ‘the Scheme’). The key commercial terms and details of the assets covered by the Scheme are set out on page 127.
Following the accession to the APS, HM Treasury provides loss protection against potential losses arising in a pool of assets. HM Treasury also subscribed to £25.5 billion of capital in the form of B shares and a Dividend Access Share with a further £8 billion of capital in the form of B shares, potentially available as contingent capital. The Group pays annual fees in respect of the protection and contingent capital. The Group has the option, subject to HM Treasury consent, to pay the annual premium, contingent capital and the exit fee payable in connection with any termination of the Group’s participation in the APS in whole or in part, by waiving the entitlements of members of the Group to certain UK tax reliefs.
Following accession to the APS, arrangements were put in place within the Group that extended effective APS protection to all other regulated entities holding assets covered by the APS.
On 19 January 2009, the FSA announced that it expects each bank participating in the UK Government’s recapitalisation scheme to have a minimum Core Tier 1 ratio of 4% on a stressed basis. As at 31 December 2009 the Group’s Core Tier 1 ratio was 11.0% (2008 – 6.6%). While the RWA relief from the APS enabled the Group to maintain robust capital ratios, it is clear that the next few years pose continuing challenges in respect of impairment levels, trading performance and the return to profitability, RWA volatility including procyclical effects, and increasing regulatory demands.
The Group’s policy will be to continue to maintain a strong capital base, to develop this base as appropriate and to utilise it efficiently throughout the Group’s activities in order to optimise shareholder returns while maintaining a prudent relationship between the capital base and the underlying risks of the business.
The subscription for £25.5 billion of B shares improved the Group’s Core Tier 1 capital ratio by 580 basis points at 31 December 2009.
Regulatory capital impact of the APS
Methodology
The regulatory capital requirements for assets covered by the Scheme are calculated using the securitisation framework under the FSA prudential rules. The calculation is as follows (known as ‘the Uncapped Amount’):
| · | First Loss – the residual first loss, after impairments and writedowns, to date, is deducted from the available capital – split equally between Core Tier 1 and Tier 2 capital; |
| · | HM Treasury share of covered losses – after the first loss piece has been deducted, the 90% of assets covered by HM Treasury are risk weighted at 0%; and |
| · | RBS share of covered losses – the remaining 10% share of loss is borne by RBS and is risk weighted in the normal way. |
Should the Uncapped Amount be higher than those of the underlying assets (ignoring the Scheme), the capital requirements for the Scheme are capped at the level of the requirements for the underlying assets (‘Capped Amount’). Where capped, the Group apportions the Capped Amount up to the level of the First Loss as calculated above; any unused Capped Amount after the First Loss capital deduction will be taken as RWAs for the Group’s share of covered losses.
Adjustments to the regulatory capital calculation can be made for either currency or maturity mismatches. These occur where there is a difference between the currency or maturity of the protection and that of the underlying asset. These mismatches will have an impact upon the timing of the removal of the cap and level of regulatory capital benefit on the Uncapped Amount, but this effect is not material.
Impact at accession
The Group expects initially to calculate its capital requirements in accordance with the Capped basis. Accordingly, the APS itself (viewed separately from the B share issuance) at accession had no impact on the Pillar 1 regulatory capital requirement in respect of the assets covered by the APS. It will, however, improve the total capital ratios, and the Core Tier 1 ratios, of the Group as a whole. It is also expected that the protection afforded by the APS will assist the Group in satisfying the forward looking stress testing framework applied by the FSA.
* unaudited
76
Capital* continued
Future regulatory capital effects
As impairments on the pool of assets arise, these will be required to be deducted in full from Core Tier 1 Capital in the normal way. The Group will be entitled to apply these impairments to reduce the First Loss deduction for the Scheme, potentially leading to a position where the capital requirement on the Uncapped Basis would no longer for the assets covered by the APS exceed the Non-APS Requirement and, as a result, the Group would expect to start reporting the regulatory capital treatment on the Uncapped Basis.
For further information on APS refer to pages 127 to 136.
Regulatory developments
European Directives
The Group is undertaking the necessary preparations to comply with the new European Directives which will, or are expected to, come into force on or before 1 January 2011. These deal with inter alia, the eligibility of hybrid capital; restrictions on large exposures; enhanced risk management of securitisation exposures (including a requirement that banks cannot invest in a securitisation where the originator has not retained an economic interest); higher capital requirements for re-securitisations; and strengthening capital requirements for the trading book.
Basel Committee on Banking Supervision
In December 2009, the Basel Committee issued proposals to strengthen capital and liquidity of banks. The key elements include: raising the quality, consistency and transparency of regulatory capital; increased capital requirements for counterparty exposures on derivatives, repurchase agreements and securities financing activities; the introduction of a leverage ratio; promotion of countercyclical measures to encourage build up of capital buffers and a more forward-looking provisioning based on expected losses instead of the current ‘incurred loss’ provisioning model; and the introduction of a global minimum liquidity standard for internationally active banks, including a short-term liquidity coverage ratio requirement underpinned by a longer-term structural liquidity ratio. The Committee is carrying out an impact assessment in the first part of 2010 to calibrate the new requirements before issuing final proposals by the end of 2010 for phased implementation commencing in 2012.
The Group is working with the trade bodies in responding to the various consultations and will participate fully in the impact assessment.
Basel II
The Group adopted Basel II on 1 January 2008. Pillar 1 focuses on the calculation of minimum capital required to support the credit, market and operational risks in the business. For credit risk, the majority of the Group uses the Advanced Internal Ratings Based Approach for calculating RWAs.
The Group manages market risk in the trading and non-trading (treasury) portfolios through the market risk management framework. The framework includes VaR limits, back-testing, stress testing, scenario analysis and position/sensitivity analysis.
For operational risk, the Group uses the Standardised Approach, which calculates operational RWAs based on gross income. In line with other banks, the Group is considering adopting the advanced measurement approach for all or part of the business.
Using these approaches, the RWA requirements, by division, are as follows: |
| 2009 | 2008 | |||||||
RWAs | £bn | £bn | ||||||
UK Retail | 51.3 | 45.7 | ||||||
UK Corporate | 90.2 | 85.7 | ||||||
Wealth | 11.2 | 10.8 | ||||||
Global Banking & Markets | 123.7 | 151.8 | ||||||
Global Transaction Services | 19.1 | 17.4 | ||||||
Ulster Bank | 29.9 | 24.5 | ||||||
US Retail & Commercial | 59.7 | 63.9 | ||||||
Other | 9.4 | 7.1 | ||||||
Core | 394.5 | 406.9 | ||||||
Non-Core | 171.3 | 170.9 | ||||||
| 565.8 | 577.8 | |||||||
Benefit of APS | (127.6 | ) | n/a | |||||
| Group before RFS Holdings minority interest | 438.2 | 577.8 | ||||||
| RFS Holdings minority interest | 102.8 | 118.0 | ||||||
| Group | 541.0 | 695.8 | ||||||
| * unaudited |
77
Business review
Risk, capital and liquidity management
Capital* continued
Capital resources continued
In addition to the calculation of minimum capital requirements for credit, market and operational risk, banks are required to undertake an Individual Capital Adequacy Assessment Process (ICAAP) for other risks. The Group’s ICAAP, in particular, focuses on pension fund risk, interest rate risk in the banking book together with stress tests to assess the adequacy of capital over one year and the economic cycle.
The Group publishes its Pillar 3 (Market disclosures) on its website, providing a range of additional information relating to Basel II and risk and capital management across the Group. The disclosures focus on Group level capital resources and adequacy, discuss a range of credit risk approaches and their associated RWAs under various Basel II approaches such as credit risk mitigation, counterparty credit risk and provisions. Detailed disclosures are also made on equity, securitisation, operational and market risk, as well as providing Interest Rate Risk in the Banking Book disclosures.
Stress and scenario testing
Stress testing forms part of the Group’s risk and capital framework and an integral component of Basel II. As a key risk management tool, stress testing highlights to senior management potential adverse unexpected outcomes related to a mixture of risks and provides an indication of how much capital might be required to absorb losses, should adverse scenarios occur. Stress testing is used at both a divisional and Group level to assess risk concentrations, estimate the impact of stressed earnings, impairments and write-downs on capital. It determines the overall capital adequacy under a variety of adverse scenarios. The principal business benefits of the stress testing framework include: understanding the impact of recessionary scenarios; assessing material risk concentrations; forecasting the impact of market stress and scenarios on the Group’s balance sheet liquidity.
At Group level, a series of stress events are monitored on a regular basis to assess the potential impact of an extreme yet plausible event on the Group. There are four core elements of scenario stress testing:
| · | Macroeconomic stress testing considers the impact on both earnings and capital for a range of scenarios. They entail multi-year systemic shocks to assess the Group’s ability to meet its capital requirements and liabilities as they fall due under a downturn in the business cycle and/or macroeconomic environment; |
| · | Enterprise wide stress testing considers scenarios that are not macroeconomic in nature but are sufficiently broad in nature to impact across multiple risks or divisions and are likely to impact earnings, capital and funding; |
| · | Cross-divisional stress testing includes scenarios which have impacts across divisions relating to sensitivity to a common risk factor(s). This would include sector based stress testing across corporate portfolios and sensitivity analysis to stress in market factors. These stress tests are discussed with senior divisional management and are reported to senior committees across the Group; and |
| · | Divisional and risk specific stress testing is undertaken to support risk identification and management. Current examples include the daily product based stress testing using a hybrid of hypothetical and historical scenarios within market risk. |
Portfolio analysis, using historic performance and forward looking indicators of change, uses stress testing to facilitate the measurement of potential exposure to events and seeks to quantify the impact of an adverse change in factors which drive the performance and profitability of a portfolio.
| * unaudited |
78
Capital* continued
Risk coverage
The main risks facing the Group are shown below.
Risk type | Definition | Features |
Credit risk (including country and political risks) | The risk arising from the possibility that the Group will incur losses owing to the failure of customers to meet their financial obligations to the Group. | Loss characteristics vary materially across portfolios. Significant correlation between losses and the macroeconomic environment. Concentration risk - potential for large material losses. |
The risk arising from country events. | Country risks correlated with macroeconomic developments. Country vulnerabilities changing structurally in the aftermath of the financial crisis. | |
Funding and liquidity risk | The risk of being unable to meet obligations as they fall due. | Potential to disrupt the business model and stop normal functions of the Group. |
Market risk | The risk that the value of an asset or liability may change as a result of a change in market risk factors. | Potential for large, material losses. Significantly correlated with equity risk and the macroeconomic environment. Potential for losses due to stress events. |
Insurance risk | The risk of financial loss through fluctuations in the timing, frequency and/or severity of insured events, relative to the expectations at the time of underwriting. | Frequent small losses. Infrequent material losses. |
Operational risk | The risk of financial, customer or reputational loss resulting from inadequate or failed internal processes or systems; from improper behaviour; or from external events. | Frequent small losses. Infrequent material losses. |
Regulatory risk | The risks arising from regulatory changes and enforcement. | Risk of regulatory changes. Compliance with regulations. Potential for fines and/or restrictions in business activities. |
Other risk | The risks arising from reputation risk. | Additional regulation can be introduced as a result of other risk losses. Failure to meet expectations of stakeholders. |
Pension risk is the risk that the Group may have to make additional contributions to its defined benefit pension schemes. | Pension risk arises because of the uncertainty of future investment returns and the projected value of schemes’ liabilities. |
| * unaudited |
79
Risk, capital and liquidity management
Credit risk
Credit risk is the risk arising from the possibility that the Group will incur losses owing to the failure of customers to meet their financial obligations. The quantum and nature of credit risk assumed in the Group’s different businesses varies considerably, while the overall credit risk outcome usually exhibits a high degree of correlation to the macroeconomic environment. All of the disclosures in this section (pages 80 to 101) are audited unless indicated otherwise with an asterisk (*).
Principles for credit risk management
The key principles for credit risk management in the Group are as follows:
| · | A credit risk assessment of the customer and credit facilities is undertaken prior to approval of credit exposure. Typically, this includes both quantitative and qualitative elements including: the purpose of the credit and sources of repayment; compliance with affordability tests; repayment history; ability to repay; sensitivity to economic and market developments; and risk-adjusted return based on credit risk measures appropriate to the customer and facility type; |
| · | Credit risk authority is specifically granted in writing to individuals involved in the approval of credit extensions. In exercising credit authority, individuals are required to act independently of business considerations and must declare any conflicts of interest; |
| · | Credit exposures, once approved, are monitored, managed and reviewed periodically against approved limits. Lower quality exposures are subject to more frequent analysis and assessment; |
| · | Credit risk management works with business functions on the ongoing management of the credit portfolio, including decisions on mitigating actions taken against individual exposures or broader portfolios; |
| · | Customers with emerging credit problems are identified early and classified accordingly. Remedial actions are implemented promptly and are intended to restore the customer to a satisfactory status and minimise any potential loss to the Group; and |
| · | Stress testing of portfolios is undertaken to assess the potential credit impact of non-systemic scenarios and wider macroeconomic events on the Group’s income and capital. |
Credit risk organisation
The credit risk function is organised within a divisionally aligned structure to ensure appropriate proximity to the businesses it covers and to develop and provide the specialisation required to manage the associated credit risk. The function comprises a number of activities: credit approval; transaction/customer assessment; policy formulation and development (in the context of the Group-wide policy framework); portfolio reporting; and quantitative portfolio analytics.
In addition to the activities undertaken within divisional functions, a Group-wide credit risk function sets the overall framework and highest level credit risk policy standards; produces Group-wide credit risk portfolio reporting and analysis; and approves credit transactions which exceed divisional credit authority.
The Group Risk Committee (GRC) considers detailed reports of credit risk performance such as monthly risk portfolio performance trend information. The Group Credit Risk Policy Committee, a subcommittee of the GRC, approves material new credit risk policy standards.
For wholesale credit portfolios, an updated Group-wide credit approval and authority framework was introduced in early 2009, replacing the previous structure of credit committees. The authority held by an individual in respect of a particular extension of credit is determined by a Group-wide credit approval grid which links total credit limit amount for a customer group with customer credit quality (expressed as a credit grade) and the individual’s credit experience and expertise (which determines the authority level assigned to them). The Executive Credit Group (ECG) considers credit decisions which exceed the delegated authorities of individuals throughout the Group.
Global Restructuring Group (GRG)
GRG manages problem and potential problem exposures in the Group’s wholesale credit portfolios. Its primary function is to work closely with the Group’s customer facing businesses to support the proactive management of any problem lending. This may include assisting with the restructuring of a customer’s business and/or renegotiation of credit.
GRG reports to the Head of Restructuring and Risk and is structured with specialist teams focused on: large corporate cases (higher value, multiple lenders); small and medium size business cases (lower value, bilateral relationships); and recovery/litigations.
Originating business units liaise with GRG upon the emergence of a potentially negative event or trend that may impact a borrower’s ability to service its debt. This may be a significant deterioration in some aspect of the borrower’s activity, such as trading, where a breach of covenant is likely or where a borrower has missed or is expected to miss a material contractual payment to the Group or another creditor.
On transfer of a relationship to GRG a strategy is devised to:
| · | Work with the borrower to facilitate changes that will maximise the potential for turnaround of their situation and return them to profitability; |
| · | Define the Group’s role in the turnaround situation and assess the risk/return dimension of the Group’s participation; |
| · | Return customers to the originating business unit in a sound and stable condition or, if such recovery cannot be achieved, avoid additional losses and maximise recoveries; and |
| · | Ensure key lessons learned are fed back into origination policies and procedures. |
Retail collections and recoveries
There are collections and recoveries functions in each of the consumer businesses. Their role is to provide support and assistance to customers who are currently experiencing difficulties meeting their financial obligations. Where possible, the aim of the collections and recoveries teams is to return the customer to a satisfactory position, by working with them to restructure their finances. If this is not possible, the team has the objective of reducing the loss to the Group.
The ongoing investment in collections and recoveries operations has continued in 2009. Investment has increased staffing levels in all collections and recoveries functions, enhanced staff training to improve efficiency and effectiveness as well as upgraded technology and infrastructure.
80
Credit risk continued
Retail collections and recoveries continued
In the UK and Ireland, the Group has introduced new forbearance policies for customers in financial difficulty based on various government sponsored schemes, customer affordability and prospects. In the US there has been an increase in agreed loan modification programmes, including those sponsored by the US government.
Credit risk framework
The approach taken to managing credit risk varies significantly between wholesale portfolios (loans, and other products giving rise to credit risk, to all but the smaller corporate customers, to financial institutions and to government entities) and retail portfolios (secured and unsecured loans and related products to individuals and small businesses).
Wholesale portfolios
Wholesale risk limits are aggregated at the counterparty level to determine the level of credit approval required and to facilitate consolidated credit risk management.
The credit approval process has two stages, assessment and decision. Credit applications for corporate customers are prepared by relationship managers in the units originating the credit exposures or by the relationship management team with lead responsibility for a counterparty where a customer has relationships with different divisions and business units across the Group. This includes the assignment of risk parameter estimates (probability of default, loss given default and exposure at default) using approved models.
Credit approval authority is discharged by way of a framework of individual delegated authorities that requires at least two individuals to approve each credit decision, one from the business and one from the credit risk management function. Both parties must hold sufficient delegated authority under the Group-wide authority grid. The level of authority granted to an individual is dependent on their experience and expertise with only a small number of senior executives holding the highest authority provided under the framework.
Daily monitoring of individual counterparty limits is undertaken. For certain counterparties early warning indicators are also in place to detect deteriorating trends of concern in limit utilisation or account performance. A framework is also in place to monitor changes in credit quality at the portfolio level.
As a minimum, credit relationships are reviewed and re-approved annually. The renewal process addresses: borrower performance, including reconfirmation or adjustment of risk parameter estimates; the adequacy of security; and compliance with terms and conditions.
Retail portfolios
Retail business operations require a large volume of small scale credit decisions, typically involving an application for a new product or a change in facilities on an existing product. The majority of these decisions are based upon automated strategies utilising best practice credit and behaviour scoring techniques. Scores and strategies are typically segmented by product, brand and other significant drivers of credit risk. These data driven strategies utilise a wide range of credit information relating to a customer including, where appropriate, information across a customer’s holdings.
A small number of credit decisions are subject to additional manual underwriting by authorised approvers in specialist units. These include higher value more complex small business transactions and some residential mortgage applications.
Divisional risk management committees focus on portfolio level decisions which drive credit quality, changes to policy and strategy, and the setting of credit scorecard cut-offs. The divisional risk management committees are also responsible for reviewing ongoing performance of the business and, if necessary, making or recommending adjustments to risk appetite.
Credit risk measurement
Credit risk models are used throughout the Group to support the quantitative risk assessment element of the credit approval process, ongoing credit risk management, monitoring and reporting and portfolio analytics. Credit risk models used by the Group may be divided into three categories.
Probability of default/customer credit grade (PD)
These models assess the probability that a customer will fail to make full and timely repayment of their obligations. The probability of a customer failing to do so is measured over a one year period through the economic cycle, although certain retail scorecards use longer periods for business management purposes.
| · | Wholesale businesses: each counterparty is assigned an internal credit grade which is in turn assigned to a default probability range. There are a number of different credit grading models in use across the Group, each of which considers risk characteristics particular to that type of customer. The credit grading models score a combination of quantitative inputs (for example, recent financial performance) and qualitative inputs, (for example, management performance or sector outlook). Scores are then mapped to grades within each model. Grades are calibrated centrally to default probabilities. Obligor grades can, under certain circumstances, be cascaded to other borrowing entities within the obligor group where there is sufficient dependence on the graded entity. The credit grades for sovereign and central bank entities are assigned by a specialist country risk analysis team using a sovereign grading model. This team is independent of the origination function and is comprised of economists. Certain grading models also cover customers or transactions categorised as specialised lending (for example certain types of investment property and asset finance such as shipping). |
| · | Retail businesses: each customer account is separately scored using models based on the most material drivers of default. In general, scorecards are statistically derived using customer data. Customers are assigned a score which in turn, is mapped to a probability of default. The probability of default is used within the credit approval process and ongoing credit risk management, monitoring and reporting. The probabilities of default are used to group customers into risk pools. Pools are then assigned a weighted average probability of default using regulatory default definitions. |
81
Exposure at default (EAD)
Facility usage models estimate the expected level of utilisation of a credit facility at the time of a borrower’s default. For revolving and variable draw down type products which are not fully drawn, the EAD will typically be higher than the current utilisation. The methodologies used in EAD modelling provide an estimate of potential exposure and recognise that customers may make more use of their existing credit facilities as they approach default.
Counterparty credit risk exposure measurement models calculate the market driven credit risk exposure for products where the exposure is not based solely upon principal and interest due. These models are most commonly used for derivative and other traded instruments where the amount of credit risk exposure may be dependent upon one or more underlying market variables such as interest or foreign exchange rates. These models drive internal credit risk activities such as limit and excess management.
Loss given default (LGD)
These models estimate the economic loss that may be experienced – the amount that cannot be recovered – by the Group on a credit facility in the event of default. The Group’s LGD models take into account both borrower and facility characteristics for unsecured or partially unsecured facilities, as well as the quality of any risk mitigation that may be in place for secured facilities, plus the cost of collections and a time discount factor for the delay in cash recovery.
Credit risk mitigation
The Group employs a number of structures and techniques to mitigate credit risk:
| · | Netting of debtor and creditor balances is utilised in accordance with relevant regulatory and internal policies and requires a formal agreement with the customer to net the balances and a legal right of set-off; |
| · | Under market standard documentation net exposure on over-the-counter (OTC) derivative and secured financing transactions is further mitigated by the exchange of financial collateral; |
| · | The Group enhances its position as a lender in a range of transactions, from retail mortgage lending to large wholesale financing, by structuring a security interest in a physical or financial asset; |
| · | Credit derivatives, including credit default swaps, credit linked debt instruments, and securitisation structures are used to mitigate credit risk; and |
| · | Guarantees and similar instruments (for example, credit insurance) from related and third parties are used in the management of credit portfolios, typically to mitigate credit concentrations in relation to an individual obligor, a borrower group or a collection of related borrowers. |
The use and approach to credit risk mitigation varies by product type, customer and business strategy. Minimum standards applied across the Group cover:
| · | General requirements, including acceptable credit risk mitigation types and any conditions or restrictions applicable to those mitigants; |
| · | The maximum loan-to-value (LTV) percentages, minimum haircuts or other volatility adjustments applicable to each type of mitigant including, where appropriate, adjustments for currency mismatch, obsolescence and any time sensitivities on asset values; |
| · | The means by which legal certainty is to be established, including required documentation and all necessary steps required to establish legal rights; |
| · | Acceptable methodologies for the initial and any subsequent valuations of collateral and the frequency with which they are to be revalued (for example, daily in the trading book); |
| · | Actions to be taken in the event the current value of mitigation falls below required levels; |
| · | Management of the risk of correlation between changes in the credit risk of the customer and the value of credit risk mitigation, for example, any situations where customer default materially impacts the value of a mitigant and applying a haircut or recovery value adjustment which reflects the potential correlation risk; |
| · | Management of concentration risks, for example, setting thresholds and controls on the acceptability of credit risk mitigants and on lines of business that are characterised by a specific collateral type or structure; and |
| · | Collateral management to ensure that credit risk mitigation is legally effective and enforceable. |
82
Credit risk continued
Credit risk assets*
Credit risk assets consist of loans and advances (including overdraft facilities), instalment credit, finance lease receivables and traded instruments across all customer types. Reverse repurchase agreements and issuer risk (primarily debt securities – see page 104) are excluded. Where relevant, and unless otherwise stated, data reflects the effect of credit mitigation techniques.
The discussions and disclosures in this section (pages 83-94) relate only to the Group before RFS Holdings minority interest. Facilities included within RFS Holdings minority interests have not been migrated to the RBS risk systems, as they will not be part of the Group following separation of the ABN AMRO business. All the disclosures in this section are unaudited and are labelled with an asterisk (*)
| 2009 | 2008 | (1) | ||||||
| Credit risk assets | £m | £m | ||||||
UK Retail | 103,029 | 97,069 | ||||||
UK Corporate | 109,908 | 126,736 | ||||||
Wealth | 15,951 | 17,604 | ||||||
Global Banking & Markets | 224,355 | 450,321 | ||||||
Global Transaction Services | 7,152 | 8,995 | ||||||
Ulster Bank | 42,042 | 64,695 | ||||||
US Retail & Commercial | 52,104 | 82,862 | ||||||
Other | 2,981 | 6,594 | ||||||
Core(1) | 557,522 | n/a | ||||||
Non-Core | 151,264 | n/a | ||||||
| 708,786 | 854,876 | |||||||
Note:
(1) The 2008 analysis between Core and Non-Core is not available.
| Key points |
| · | Total credit risk assets reduced by £146 billion, or 17% during 2009 or 13% on a constant currency basis. |
| · | Reductions occurred across industry sectors and in most regions. The largest reductions were in lending balances and derivatives. |
| · | As part of the strategic review, the designation of assets between Core and Non-Core divisions was completed during the first half of 2009, hence the portfolio is reported according to the divisional structure as at 31 December 2009 in the table above. |
Credit concentration risk
The Group defines four key areas of concentration in credit risk that are monitored, reported and managed at both Group and divisional levels. These are single name, industry/sector, country and product/asset class. Frameworks to address single name, industry/sector and country concentrations are established and continue to be enhanced and embedded into business processes across the Group. Aspects of the product/asset class framework are in place whilst others will be developed during the course of 2010.
Under the Group’s credit approval framework, the required approval level is linked to the size of exposure with exposures above a certain level requiring the highest level of approval, held by a very small number of executives. In addition, the Group’s single name concentration framework includes specific approval requirements; additional reporting and monitoring; and the requirement to develop plans to address and reduce excess exposures.
The Group has also developed a more robust approach and framework for managing sector concentrations, a major outcome of which is the regular review of the most material concentrations at the Executive Risk Forum (ERF). These reviews include an assessment of the Group’s franchise in a particular sector, an analysis of the outlook (including downside outcomes), identification of key vulnerabilities and stress/scenario tests.
Reviews conclude with specific sector caps and other portfolio strategies to align the Group’s exposure profile with its appetite.
Country risk
Country risk arises from sovereign events (for example, default or restructuring); economic events (for example, contagion of sovereign default to other parts of the economy, cyclical economic shock); political events (for example, convertibility restrictions and expropriation or nationalisation); and natural disaster or conflict. Losses are broadly defined and include credit, market, liquidity, operational and franchise risk related losses.
The Group’s appetite for country risk is set by the ERF in the form of limits by country risk grade, with sub-limits on term exposure. Countries where exposures exceed this limit framework are approved by the ERF while authority is delegated to the Group Country Risk Committee (GCRC) to manage exposures within the framework. Specific limits are set for each country based on a risk assessment taking into account the Group’s franchise and business mix in that country. Additional limitations – on product types with higher loss potential, for example – are established to address specific vulnerabilities in the context of a country's outlook and/or the Group's business strategy in a particular country. A country watch list framework is in place to proactively monitor emerging issues and facilitate the development of mitigation strategies.
| * unaudited |
83
Business review
Risk, capital and liquidity management
Credit risk continued
Credit risk assets* continued
The country risk table below shows credit risk assets exceeding £1 billion by borrowers domiciled in countries with an external rating of A+ and below from either Standard & Poor’s or Moody’s, and is stated gross of mitigating action which may have been taken to reduce or eliminate exposure to country risk events.
| 2009 | 2008 | |||||||||||||||||||||||||||||||||||||||||||||||
| Personal | Sovereign | Banks and financial institutions | Corporate | Total | Core | Non-Core | Personal | Sovereign | Banks and financial institutions | Corporate | Total | |||||||||||||||||||||||||||||||||||||
| £m | £m | £m | £m | £m | £m | £m | £m | £m | £m | £m | £m | |||||||||||||||||||||||||||||||||||||
| Italy | 27 | 104 | 1,999 | 5,636 | 7,766 | 3,827 | 3,939 | 23 | 131 | 3,263 | 7,555 | 10,972 | ||||||||||||||||||||||||||||||||||||
| India | 547 | 5 | 476 | 2,578 | 3,606 | 2,887 | 719 | 1,020 | 6 | 738 | 3,800 | 5,564 | ||||||||||||||||||||||||||||||||||||
| Russia | 41 | — | 395 | 2,928 | 3,364 | 2,803 | 561 | 51 | — | 362 | 5,361 | 5,774 | ||||||||||||||||||||||||||||||||||||
| South Korea | 1 | — | 1,038 | 2,308 | 3,347 | 3,238 | 109 | 2 | — | 1,743 | 1,104 | 2,849 | ||||||||||||||||||||||||||||||||||||
| Turkey | 11 | 301 | 590 | 1,906 | 2,808 | 2,412 | 396 | 25 | 364 | 603 | 3,035 | 4,027 | ||||||||||||||||||||||||||||||||||||
| Poland | 6 | 62 | 113 | 1,840 | 2,021 | 1,847 | 174 | 7 | 38 | 309 | 1,309 | 1,663 | ||||||||||||||||||||||||||||||||||||
| China | 21 | 49 | 798 | 1,096 | 1,964 | 1,695 | 269 | 25 | 61 | 1,146 | 2,027 | 3,259 | ||||||||||||||||||||||||||||||||||||
| Romania | 512 | 47 | 452 | 874 | 1,885 | 64 | 1,821 | 584 | 145 | 160 | 917 | 1,806 | ||||||||||||||||||||||||||||||||||||
| Portugal | 5 | 42 | 281 | 1,119 | 1,447 | 943 | 504 | 6 | 34 | 405 | 1,914 | 2,359 | ||||||||||||||||||||||||||||||||||||
| Chile | — | 41 | 447 | 865 | 1,353 | 526 | 827 | — | 26 | 384 | 1,251 | 1,661 | ||||||||||||||||||||||||||||||||||||
| Brazil | 3 | — | 767 | 439 | 1,209 | 1,151 | 58 | 4 | — | 1,012 | 642 | 1,658 | ||||||||||||||||||||||||||||||||||||
| Mexico | 1 | 7 | 227 | 934 | 1,169 | 740 | 429 | 4 | 57 | 211 | 2,000 | 2,272 | ||||||||||||||||||||||||||||||||||||
| Kazakhstan | 45 | 15 | 365 | 646 | 1,071 | 91 | 980 | 69 | 17 | 901 | 859 | 1,846 | ||||||||||||||||||||||||||||||||||||
| Hungary | 3 | 23 | 56 | 956 | 1,038 | 579 | 459 | 5 | 74 | 101 | 831 | 1,011 | ||||||||||||||||||||||||||||||||||||
Key points
| · | There has been a sustained focus on country exposures, both in terms of those countries that represent a larger concentration and those that, under the country watch list process, have been identified as exhibiting signs of actual or potential stress. |
| · | This process, coupled with the Group’s strategic focus on a reduced number of countries, has yielded material reductions in exposure. |
| · | The reductions are magnified by the relative strength of sterling in the year, when it gained 9% on a trade weighted basis against other currencies. |
Most economies enter 2010 in a tentative recovery phase, attributed largely to official stimulus, resilient consumption and global restocking. International prospects vary and significant risks remain, particularly around exiting government support, advanced sovereign debt levels and rising inflationary pressures. Currently low yields may not last as these trends play out. Asia remains the best performing region, thanks to limited sovereign and corporate leverage. However, growth prospects remain linked to global trade flows. Middle East sovereigns are generally strong, but the private sector continues to feel the impact of weakness in real estate and construction. Latin America proved relatively insulated from the crisis, and policy gains look set to be sustained. Peripheral Euro zone sovereigns with heavy debt burdens face increased risks, with credible adjustment programmes needed. Eastern Europe has made some progress in addressing key weaknesses, but vulnerabilities in some countries remain and growth prospects are modest.
* unaudited
84
Credit risk continued
Credit risk assets* continued
Asset quality by industry and geography
Industry analysis plays an important part in assessing potential concentration risk in the loan portfolio. Particular attention is given to industry sectors where the Group believes there is a high degree of risk or potential for volatility in the future.
The table below analyses credit risk assets by industry sector and geography.
| 2009 | 2008 | |||||||||||||||||||||||||||||||||||
| UK | Western Europe (excl UK) | North America | Asia Pacific | Latin America | Other (1) | Total | of which Core | Total | ||||||||||||||||||||||||||||
| Industry sector | £m | £m | £m | £m | £m | £m | £m | £m | £m | |||||||||||||||||||||||||||
| Personal | 120,720 | 23,530 | 37,680 | 2,948 | 63 | 1,361 | 186,302 | 165,562 | 197,888 | |||||||||||||||||||||||||||
| Banks and financial institutions | 38,775 | 66,698 | 18,817 | 13,158 | 10,216 | 5,305 | 152,969 | 133,900 | 180,504 | |||||||||||||||||||||||||||
| Property | 61,779 | 27,736 | 8,315 | 2,478 | 2,924 | 507 | 103,739 | 57,073 | 112,980 | |||||||||||||||||||||||||||
Transport and storage (2) | 14,565 | 7,954 | 7,514 | 5,841 | 2,917 | 7,370 | 46,161 | 30,863 | 58,995 | |||||||||||||||||||||||||||
| Manufacturing | 9,309 | 14,646 | 7,965 | 3,627 | 1,643 | 3,948 | 41,138 | 31,199 | 67,846 | |||||||||||||||||||||||||||
| Wholesale and retail trade | 15,584 | 7,458 | 5,497 | 945 | 829 | 1,704 | 32,017 | 25,180 | 35,180 | |||||||||||||||||||||||||||
| Telecom, media and technology | 8,956 | 7,956 | 5,312 | 2,232 | 804 | 1,528 | 26,788 | 18,554 | 42,374 | |||||||||||||||||||||||||||
| Public sector | 11,091 | 4,448 | 6,016 | 2,109 | 279 | 760 | 24,703 | 21,823 | 39,890 | |||||||||||||||||||||||||||
| Building | 10,303 | 7,494 | 1,852 | 836 | 183 | 1,098 | 21,766 | 16,642 | 29,297 | |||||||||||||||||||||||||||
| Tourism and leisure | 11,396 | 3,268 | 2,700 | 755 | 586 | 481 | 19,186 | 15,583 | 19,528 | |||||||||||||||||||||||||||
| Power, water and waste | 4,745 | 6,197 | 3,502 | 1,179 | 1,215 | 941 | 17,779 | 12,055 | 26,628 | |||||||||||||||||||||||||||
| Natural resources and nuclear | 2,554 | 3,546 | 5,511 | 1,861 | 844 | 2,895 | 17,211 | 12,479 | 25,318 | |||||||||||||||||||||||||||
| Business services | 8,981 | 2,056 | 2,324 | 675 | 1,029 | 588 | 15,653 | 13,395 | 14,497 | |||||||||||||||||||||||||||
| Agriculture and fisheries | 921 | 618 | 1,671 | 18 | 64 | 82 | 3,374 | 3,214 | 3,951 | |||||||||||||||||||||||||||
| 2009 Total | 319,679 | 183,605 | 114,676 | 38,662 | 23,596 | 28,568 | 708,786 | 557,522 | 854,876 | |||||||||||||||||||||||||||
| of which Core | 271,758 | 133,824 | 89,487 | 28,718 | 14,048 | 19,687 | 557,522 | |||||||||||||||||||||||||||||
| 2008 Total | 326,639 | 225,870 | 178,139 | 56,074 | 31,235 | 36,919 | 854,876 | |||||||||||||||||||||||||||||
Notes:
| (1) | Other’ comprises Central and Eastern Europe, Middle East, Central Asia and Africa. |
| (2) | Excludes net investment in operating leases in Shipping and Aviation portfolios as they are accounted for as part of property, plant and equipment; however operating leases are included in the monitoring and management of these portfolios. |
| (3) | Certain sector and sub-sector classes were refined in 2009. |
Key points
| · | Exposures have decreased materially across industry sectors and geographies, with the exception of the UK where exposure is only 2% lower at 31 December 2009 compared with a year earlier. |
| · | Within the UK, exposure to corporate sectors was down 8%. Banks, financial institutions and public sector were unchanged and exposure to personal customers was up 6% in 2009. |
Single name concentrations
During the first half of the year, the Group implemented an enhanced framework to address the risk arising from concentrations of exposure to related groups of borrowers. Despite market illiquidity that reduced the scope for exposure management strategies against certain assets, and negative credit migration, that created additional cases in excess of the framework’s parameters, some progress was made against exceptions arising from the framework. Overall there were 9% fewer exceptions at the end of the period than at the beginning. Plans have been developed and continue to be refined to deliver alignment with the framework over the course of the Group’s strategic plan.
* unaudited
85
Credit risk continued
Credit risk assets* continued
Credit risk asset quality
Using the PD models described above, customers are assigned credit grades and scores, which are used for internal management reporting across portfolios, including a Group level asset quality scale, as shown below.
Internal reporting and oversight of risk assets is principally differentiated by credit grades. Customers are assigned credit grades, based on various credit grading models that reflect the key drivers of default for the customer type. All credit grades across the Group map to both a Group level asset quality scale, used for external financial reporting, and a master grading scale for wholesale exposures used for internal management reporting across portfolios. Accordingly, measurement of risk is easily aggregated and can be reported at increasing levels of granularity depending on audience and business need.
| 2009 | 2008 | ||||||||||||||||||||||||||
| Core | Non-Core | Total | % | Total | % | ||||||||||||||||||||||
| Asset quality band | PD range | £m | £m | £m | of total | £m | of total | ||||||||||||||||||||
| AQ1 | 0% – 0.03% | 124,172 | 20,570 | 144,742 | 20.3 | 208,033 | 24.4 | ||||||||||||||||||||
| AQ2 | 0.03% – 0.05% | 13,470 | 1,958 | 15,428 | 2.2 | 29,939 | 3.5 | ||||||||||||||||||||
| AQ3 | 0.05% – 0.10% | 27,456 | 6,462 | 33,918 | 4.8 | 44,724 | 5.2 | ||||||||||||||||||||
| AQ4 | 0.10% – 0.38% | 84,594 | 17,032 | 101,626 | 14.3 | 159,067 | 18.6 | ||||||||||||||||||||
| AQ5 | 0.38% – 1.08% | 107,960 | 27,135 | 135,095 | 19.1 | 157,138 | 18.5 | ||||||||||||||||||||
| AQ6 | 1.08% – 2.15% | 78,048 | 19,050 | 97,098 | 13.7 | 107,191 | 12.5 | ||||||||||||||||||||
| AQ7 | 2.15% – 6.09% | 42,611 | 14,449 | 57,060 | 8.1 | 48,271 | 5.6 | ||||||||||||||||||||
| AQ8 | 6.09% – 17.22% | 21,484 | 4,479 | 25,963 | 3.7 | 25,682 | 3.0 | ||||||||||||||||||||
| AQ9 | 17.22% – 100% | 10,597 | 5,845 | 16,442 | 2.3 | 12,034 | 1.4 | ||||||||||||||||||||
| AQ10 | 100 | 16,316 | 23,118 | 39,434 | 5.6 | 19,130 | 2.2 | ||||||||||||||||||||
| Other (1) | 30,814 | 11,166 | 41,980 | 5.9 | 43,667 | 5.1 | |||||||||||||||||||||
| 557,522 | 151,264 | 708,786 | 100 | 854,876 | 100 | ||||||||||||||||||||||
Note:
| (1) | Other’ largely comprises assets covered by the standardised approach for which a PD equivalent to those assigned to assets covered by the internal ratings based approach is not available. |
Key points
| · | In addition to the overall portfolio contraction, the table above evidences the negative rating migration observed across the Group’s portfolios during the course of 2009, with the lower quality bands (AQ7 and below) all showing increased exposure. |
| · | A significant majority of this increase occurred in the first half of 2009. Exposure in bands AQ7 and below grew by 23% in the first six months of the year and by a further 6% since 30 June 2009. |
* unaudited
86
Business review continued
Credit risk continued
Credit risk assets* continued
Key credit portfolios
| 2009 | 2008 | |||||||
| Personal credit risk assets | £m | £m | ||||||
| UK Retail: | ||||||||
| – Mortgages | 85,529 | 74,528 | ||||||
| – Cards, loans and overdrafts | 20,316 | 22,475 | ||||||
| Ulster Bank: | ||||||||
| – Mortgages | 22,304 | 24,531 | ||||||
| – Other personal | 1,172 | 1,350 | ||||||
| Citizens: | ||||||||
| – Mortgages | 26,534 | 34,394 | ||||||
| – Auto and cards | 6,917 | 9,126 | ||||||
| – Other (1) | 4,205 | 5,286 | ||||||
| EMEA and Asia Pacific Non-Core | 3,084 | 3,942 | ||||||
| Other (2) | 16,241 | 22,256 | ||||||
| 186,302 | 197,888 | |||||||
Notes:
| (1) | Mainly student loans and recreational vehicles/marine. |
| (2) | Personal exposures in other divisions, including Wealth, and RBS Insurance. |
Residential mortgages
The table below analyses the distribution of residential mortgages by loan-to-value (LTV) (indexed).
| UK Retail | Ulster Bank | Citizens | ||||||||||||||||||||||
| Residential mortgages – | 2009 | 2008 | 2009 | 2008 | 2009 | 2008 | ||||||||||||||||||
distribution by average LTV (1) (indexed) | % | % | % | % | % | % | ||||||||||||||||||
| <=50% | 39.2 | 46.0 | 40.7 | 47.1 | 26.3 | 29.7 | ||||||||||||||||||
| >50% and <= 60% | 10.1 | 10.9 | 7.6 | 8.7 | 7.9 | 9.0 | ||||||||||||||||||
| >60% and <= 70% | 10.9 | 10.6 | 7.6 | 8.4 | 9.0 | 10.7 | ||||||||||||||||||
| >70% and <= 80% | 13.3 | 10.5 | 7.5 | 8.6 | 12.7 | 16.3 | ||||||||||||||||||
| >80% and <= 90% | 11.2 | 9.2 | 8.0 | 9.6 | 14.5 | 15.5 | ||||||||||||||||||
| >90% and <= 100% | 7.6 | 7.8 | 9.0 | 8.5 | 12.2 | 9.5 | ||||||||||||||||||
| >100% | 7.7 | 4.9 | 19.6 | 9.1 | 17.4 | 9.3 | ||||||||||||||||||
| Total portfolio average LTV at 31 December | 59.1 | 54.5 | 62.5 | 54.3 | 72.0 | 69.1 | ||||||||||||||||||
| Average LTV on new originations during the year | 67.2 | 67.2 | 72.8 | 71.1 | 62.4 | 64.3 | ||||||||||||||||||
Note:
| (1) | LTV averages calculated by transaction volume. | |||
87
Credit risk continued
Credit risk assets* continued
The table below details residential mortgages three months or more in arrears (by volume).
| 2009 | 2008 | |||||||
| % | % | |||||||
| UK Retail (1) | 1.8 | 1.5 | ||||||
| Ulster Bank | 3.3 | 1.6 | ||||||
| Citizens | 1.5 | 0.9 | ||||||
Note:
| (1) | UK Retail analysis covers the Royal Bank and NatWest brands and covers 77% of the UK Retail mortgage portfolio (the remainder operates under the same credit policies). |
UK residential mortgages
The UK mortgage portfolio totalled £85.5 billion at 31 December 2009, an increase of 15% from 31 December 2008, due to strong sales growth and lower redemption rates. Of the total portfolio, 98% is designated as Core business with the primary brands being the Royal Bank of Scotland, NatWest, the One Account and First Active. The assets comprise prime mortgage lending and include 6.6% (£5.6 billion) of exposure to residential buy-to-let. There is a small legacy self certification book (0.4% of total assets); which was withdrawn from sale in 2004.
UK net new mortgage lending in 2009 was strong at £11 billion and the Group has exceeded its commitment to the UK Government on net mortgage lending. The average LTV for new business during 2009 was unchanged at 67.2%. The maximum LTV available to new customers remains at 90%.
The arrears rate (three or more payments missed) on the combined Royal Bank of Scotland and NatWest brands was 1.8% at 31 December 2009. After a period of deterioration driven by the economic environment this stabilised in the second half of 2009 (arrears rate stood at 1.8% at 30 June 2009 and 1.5% at 31 December 2008). The arrears rate on the buy-to-let portfolio was 1.6% at 31 December 2009 (1.6% at 30 June 2009 and 1.5% at 31 December 2008).
The mortgage impairment charge was £129 million in 2009, compared with £33 million in 2008, attributable to declining house prices driving lower recoveries and an increase in defaults reflecting the difficult economic environment. Default rates remain sensitive to economic developments, notably unemployment rates. Provision as a proportion of balances at 31 December 2009 were 0.3% and 0.2% at 31 December 2008.
A number of initiatives aimed at increasing the levels of support to customers experiencing difficulties were implemented in 2008 and will continue in 2010. The Group does not initiate repossession proceedings for at least six months after arrears are evident and participates in various government-led initiatives such as the mortgage rescue scheme and homeowner mortgage support.
Ulster Bank residential mortgages
The residential mortgage portfolio across the Ulster Bank and First Active brands totalled £22.3 billion at 31 December 2009; 91% is in the Republic of Ireland and 9% in Northern Ireland. This represents a decline of 4% in the Republic of Ireland and an increase of 13% in Northern Ireland from 31 December 2008. 27% of the portfolio is Non-Core.
The arrears rate increased to 3.3% at 31 December 2009 from 1.6% at 31 December 2008. As a result, the impairment charge for 2009 was £115 million versus £23 million for 2008. Repossessions totalled 96 in 2009, compared with 37 in 2008 with the majority of these being voluntary.
During 2009 new business originations in the Republic of Ireland were very low across all segments. The bank introduced new products –Momentum and SecureStep – in both Northern Ireland and the Republic of Ireland which aim to support market activity for new build properties. In Northern Ireland, lending increased in the second half of 2009 as a degree of confidence returned to the property market.
Citizens real estate
Citizens total residential real estate portfolio totalled $42 billion at 31 December 2009 (2008 – $50 billion). The real estate portfolio comprises $11 billion of first lien mortgages and $31 billion of home equity loans and lines (Core portfolio 48% first lien). 83% of the portfolio is Core business; $10 billion of mortgages and $25 billion of home equity loans and lines (48% of the latter being first lien). The serviced by others (SBO) portfolio (96% second lien) is the largest component of the Non-Core portfolio.
Citizens has focused its origination efforts in the more mature and stable markets of New England and Mid Atlantic (Citizen’s ‘footprint states’), targeting low risk products and adopting conservative risk policies. Loan acceptance criteria were tightened during 2009 to address deteriorating economic and market conditions. At 31 December 2009, the portfolio consisted of $34 billion (80% of the total portfolio) in these footprint states.
* unaudited
88
Business review continued
Credit risk continued
Credit risk assets* continued
The SBO portfolio consists of purchased pools of home equity loans and lines whose current LTV (95.6% on a weighted average basis at 31 December 2009) and geographic profiles (74% outside of Citizen’s footprint states and a 30% concentration in California, Arizona and Nevada) have, in the current economic climate, resulted in an annualised write-off rate of 10.7% in 2009. The SBO book has been closed to new purchases since the third quarter of 2007 and is in runoff, with exposure down from $7.0 billion at 31 December 2008 to $5.5 billion at 31 December 2009.
The current weighted average LTV of the real estate portfolio rose slightly during the year to 72.0% at 31 December 2009 (67.5% excluding the SBO portfolio), driven by significant price declines throughout the US. Based on the latest Case-Shiller forecast for the US market, economists still anticipate significant decreases in the first half of 2010 with improvements expected in late 2010 or early 2011.
The arrears rate increased significantly from 0.9% at 31 December 2008 to 1.5% at 31 December 2009. In part, this reflects the contraction of the portfolio caused by fewer new loans added, Citizen choosing to exercise its option to sell certain mortgages to the secondary market under long-term agreements, and higher run-off or pay-down rates across all residential products.
Personal lending
The Group’s personal lending portfolio includes credit cards, unsecured loans, auto finance and overdrafts. The majority of personal lending exposures exist in the UK and the US. New defaults as a proportion of average loans and receivables were:
| 2009 | 2008 | |||||||||||||||
| Impairment | Impairment | |||||||||||||||
| Average | charge as a % | Average | charge as a % | |||||||||||||
| loans and | of loans and | loans and | of loans and | |||||||||||||
| receivables | receivables | receivables | receivables | |||||||||||||
| Personal lending | £m | % | £m | % | ||||||||||||
| UK Retail cards (1) | 6,101 | 8.7 | 6,617 | 6.4 | ||||||||||||
| UK Retail loans (1) | 12,062 | 5.9 | 13,545 | 3.3 | ||||||||||||
| $m | % | $m | % | |||||||||||||
| Citizens cards (2) | 2,286 | 8.9 | 2,275 | 4.9 | ||||||||||||
| Citizens auto loans (2) | 9,759 | 1.2 | 11,386 | 1.1 | ||||||||||||
Notes:
| (1) | The charge for UK Retail assets refers to impairment on assets in the year. |
| (2) | The charge for Citizens assets refers to charge offs in the year, net of recoveries realised in the year. |
The UK personal lending portfolio, of which 97% is in Core businesses, comprises credit cards, unsecured loans and overdrafts and totalled £20.3 billion at 31 December 2009, a decrease of 10% from 31 December 2008 (£22.5 billion) due to a general market trend of customers repaying debt on credit cards and loan balances and a reduction in new lending.
Risk appetite continues to be actively managed across all unsecured products, reflecting the challenging economic environment. Support continues for customers in financial difficulties through breathing space initiatives on all unsecured products, whereby a thirty day period allows customers to work with a not-for-profit debt advice agency to establish a debt repayment plan. During this time the Group suspends collection activity. A further extension of thirty days can be granted if progress is made and discussions are continuing. Investment in collection and recovery processes continues, addressing both continued support for our customers and the management of impairments.
Default rates on both cards and loans in the UK increased in 2009, driven by the deterioration in the economic environment and, to a lesser extent, the reduction in total balances. Default rates are still sensitive to economic developments, notably unemployment rates.
The Citizens credit card portfolio totalled US$2.3 billion, at 31 December 2009. Core assets comprised 58% of the portfolio.
The Citizens cards business adopts conservative risk strategies compared to the US market as illustrated by the business generally performing better than industry benchmarks (provided by VISA). The latest available metrics (December 2009) show the rate for 60+ days delinquency as a percentage of total outstandings at 4.4% (compared to an industry figure of 4.7%) and net contractual charge-offs as a percentage of total outstandings at 7.1% (compared to an industry figure of 7.4%).
For new customers, lending criteria have been tightened and initial credit lines reduced. Existing customers are regularly monitored for changes in asset quality and behaviour and, where appropriate, proactive measures are taken to limit or reduce credit exposure.
Citizens is a leading provider of retail auto financing to US consumers through a network of 3,500 auto dealers located in 23 US states. It maintains a conservative, prime indirect auto lending credit programme with loss rates that have historically been below national averages. Current outstanding retail auto loan balances totalled $8.8 billion as of 31 December 2009, when the 30-day delinquency rate stood at 2.6%. This compares to data reported by the American Bankers’ Association (latest available is at 30 September 2009) showing the nationwide indirect auto lending delinquency rate at 2.8%. Citizens recently shifted its focus on auto financing, moving from a nationwide emphasis to its regional lending footprint. This, together with enhanced collection activities, has resulted in better than expected loss results. Total portfolio losses fell from $129.6 million in 2008 to $120.6 million in 2009.
Corporate sectors
This section discusses the components of property, transport and storage (automotive, shipping, aviation) and retail sectors, given their significance in the current market environment.
Wholesale property
The Group's exposure to the wholesale property sector totals £104 billion, of which £85 billion is commercial property financing and analysed in detail below. The remainder comprises lending to property related sectors, including housing associations, estate agents and management companies, and non-lending exposures on off balance sheet instruments and FX/derivatives.
Commercial property
The commercial property finance portfolio totalled £85 billion at 31 December 2009, an £11 billion or 12% decrease during the year. The Non-Core portion of the portfolio totalled £38 billion, or 44% of the portfolio.
| 2009 | 2008 | |||||||||||||||
| Domicile of obligor | £m | % | £m | % | ||||||||||||
| UK | 55,904 | 66 | 55,986 | 58 | ||||||||||||
| Western Europe | 19,212 | 22 | 28,439 | 30 | ||||||||||||
| Americas | 6,520 | 8 | 7,996 | 8 | ||||||||||||
| RoW | 3,575 | 4 | 4,250 | 4 | ||||||||||||
| 85,211 | 100 | 96,671 | 100 | |||||||||||||
| 2009 | 2008 | |||||||||||||||
| Segment | £m | % | £m | % | ||||||||||||
| Investment: | ||||||||||||||||
| Commercial | 47,371 | 56 | 54,028 | 56 | ||||||||||||
| Residential | 12,921 | 15 | 13,937 | 14 | ||||||||||||
| 60,292 | 71 | 67,965 | 70 | |||||||||||||
| Development: | ||||||||||||||||
| Commercial | 11,081 | 13 | 11,843 | 12 | ||||||||||||
| Residential | 11,271 | 13 | 12,154 | 13 | ||||||||||||
| 22,352 | 26 | 23,997 | 25 | |||||||||||||
| Other | 2,567 | 3 | 4,709 | 5 | ||||||||||||
| 85,211 | 100 | 96,671 | 100 | |||||||||||||
Speculative lending represents less than 1% of the portfolio. The Group’s appetite for originating speculative commercial property lending is limited and any such business requires exceptional approval under the credit approval framework.
The decrease in asset valuations has placed pressure on the portfolio with more clients seeking renegotiations of LTV covenants in the context of granting structural enhancements or equity injections. The average LTV is 91% while the average interest coverage ratios for GBM and UK Corporate originated investment portfolios (Core and Non-Core combined) are 1.60 times and 1.64 times, respectively.
Whilst asset valuations stabilised during the latter part of 2009, the outlook remains challenging, with liquidity to support refinancing still reduced and high levels of concern regarding tenant failures. Wherever feasible, the Group works closely with clients to restructure loans while achieving mutual benefits.
Portfolios are subject to close monitoring within the originating division and a dedicated unit in the GRG focuses on commercial real estate to ensure that expertise is readily available to manage this portfolio actively on a coordinated basis globally.
* unaudited
90
Business review continued
Credit risk continued
Credit risk assets* continued
Corporate sectors continued
Transport and storage
The automotive, shipping and aviation portfolios form part of the transport and storage industry sector, which stood at £46.2 billion at 31 December 2009, down 22% during the year. The remainder of the portfolio largely comprises land-based freight, storage and logistics companies.
Automotive
Exposure to the automotive sector decreased from £13.3 billion at 31 December 2008 to £8.9 billion at 31 December 2009.
| 2009 | 2008 | |||||||||||||||||||||||
| Core | Non-Core | Total | Total | |||||||||||||||||||||
| Segment | £m | £m | £m | % | £m | % | ||||||||||||||||||
| Original equipment manufacturers (OEMs) | 1,204 | 60 | 1,264 | 14 | 2,681 | 20 | ||||||||||||||||||
| Captive finance companies | 609 | 84 | 693 | 8 | 1,131 | 9 | ||||||||||||||||||
| Component suppliers | 750 | 81 | 831 | 9 | 1,854 | 14 | ||||||||||||||||||
| Retailers/services | 4,040 | 766 | 4,806 | 54 | 5,099 | 38 | ||||||||||||||||||
| Rental | 1,150 | 147 | 1,297 | 15 | 2,533 | 19 | ||||||||||||||||||
| 7,753 | 1,138 | 8,891 | 100 | 13,298 | 100 | |||||||||||||||||||
| 2009 | 2008 | |||||||||||||||||||||||
| Core | Non-Core | Total | Total | |||||||||||||||||||||
| Domicile of obligor | £m | £m | £m | % | £m | % | ||||||||||||||||||
| Americas | 1,325 | 402 | 1,727 | 19 | 3,520 | 26 | ||||||||||||||||||
| Central Eastern Europe, Middle East and Africa | 373 | 152 | 525 | 6 | 872 | 7 | ||||||||||||||||||
| UK | 3,530 | 426 | 3,956 | 45 | 3,884 | 29 | ||||||||||||||||||
| Other Europe | 1,949 | 97 | 2,046 | 23 | 4,098 | 31 | ||||||||||||||||||
| Asia | 576 | 61 | 637 | 7 | 924 | 7 | ||||||||||||||||||
| 7,753 | 1,138 | 8,891 | 100 | 13,298 | 100 | |||||||||||||||||||
The global automotive industry continues to face long-term structural challenges of overcapacity, weakened consumer demand owing to economic conditions, reduced credit availability and high input costs. The global OEMs are experiencing changing demand patterns with a greater focus on developing markets versus their established markets. Shifting production capacity to lower cost overseas locations remains a priority but one that risks labour force issues. The industry is also challenged by increasingly stringent environmental legislation that is forcing a shift to smaller, lower emission vehicles. In 2009 the automotive industry benefited from considerable government support in the form of direct intervention (US manufacturers) and other forms (for example, car scrappage schemes). Whilst there are some emerging signs of recovery and stability, albeit with volumes at historically low levels, the outlook remains fragile as government support is withdrawn and underlying demand is likely to remain subdued.
The portfolio has been reduced in size by a third since 31 December 2008 and whilst average credit quality was impacted by the restructuring of the large US manufacturers at the start of 2009, this restructuring provided a degree of stability to the portfolio that was largely maintained for the remainder of the year. Impairment provisions to date have not been material.
Shipping
| 2009 | 2008 | |||||||||||||||||||||||
| Core | Non-Core | Total | Total | |||||||||||||||||||||
| Sector | £m | £m | £m | % | £m | % | ||||||||||||||||||
| Dry bulk | 2,568 | 777 | 3,345 | 28 | 3,775 | 28 | ||||||||||||||||||
| Tankers | 3,103 | 1,640 | 4,743 | 39 | 4,975 | 37 | ||||||||||||||||||
| Container | 756 | 685 | 1,441 | 12 | 1,256 | 10 | ||||||||||||||||||
| Gas/offshore | 137 | 1,851 | 1,988 | 16 | 1,786 | 13 | ||||||||||||||||||
| Other | 168 | 419 | 587 | 5 | 1,549 | 12 | ||||||||||||||||||
| 6,732 | 5,372 | 12,104 | 100 | 13,341 | 100 | |||||||||||||||||||
Note:
| (1) | Figures shown relate to direct shipping financing exposure and do not include related operating lease and counterparty exposures of £1.1 billion in 2009 and £3.3 billion in 2008. |
The Group’s shipping portfolio is primarily focused on fully secured mortgage finance business in the dry bulk and tanker sectors, with a limited exposure to container vessels.
The performance of the sector over the past twelve months has been materially impacted by both the global downturn and the high volume of new capacity that has been delivered and will continue to come on stream into 2011.
The Group’s strategy is to focus on cash flows relating to the ships financed and to work with long-term industry participants in Europe and North America where the Group has long-standing relationships and where the companies have demonstrated an ability to withstand cyclical downturns with a consistent track record through cyclical volatility. Asset selection has been to focus on modern tonnage (average vessel age is eight years).
The Group has refined its strategy during the course of 2009 to define a core business focussed on a well established client base of owners in Europe and North America where the Group has long-standing relationships with companies that have a demonstrated ability to withstand cyclical downturns.
The performance of the portfolio reflects a rising level of stress with a number of transactions restructured in response to asset price reductions and security covenant breaches. The value of the fleet is reviewed on a quarterly basis and a large majority of deals remain fully secured. There have been few instances of payment default and in the majority of cases owners have supported transactions via cash injections. Cases on the Group’s watch list that are more closely monitored and controlled have increased and now stand at £1 billion, or 7% of the total portfolio.
* unaudited
92
Business review continued
Credit risk continued
Credit risk assets* continued
Corporate sectors continued
Aviation
| 2009 | 2008 | |||||||||||||||||||||||
| Core | Non-Core | Total | Total | |||||||||||||||||||||
| £m | £m | £m | % | £m | % | |||||||||||||||||||
| Operating leases (1) | — | 7,126 | 7,126 | 46 | 10,270 | 50 | ||||||||||||||||||
| Secured debt | 1,360 | 3,352 | 4,712 | 30 | 5,252 | 26 | ||||||||||||||||||
| Sovereign guaranteed debt | — | 2,774 | 2,774 | 18 | 3,324 | 17 | ||||||||||||||||||
| Unsecured debt | 910 | — | 910 | 6 | 1,093 | 5 | ||||||||||||||||||
| Other | — | — | — | — | 405 | 2 | ||||||||||||||||||
| 2,270 | 13,252 | 15,522 | 100 | 20,344 | 100 | |||||||||||||||||||
Note:
| (1) | Operating lease assets, which are included in property, plant and equipment, represent the net investment in aircraft owned and on order. A smaller figure, £1 billion, is included within credit risk assets, representing the risk of customer default on lease agreements. |
The aviation portfolio comprises a number of activities, but is primarily focused on the Dublin based Aviation Capital business, which has been designated as Non-Core.
The aviation sector has been under considerable pressure owing to the global downturn and compounded by the impact of the H1N1 virus (particularly in South America), overcapacity (notably in India and North America) and intense competition. Despite the publicised failure of several airlines, within the Group’s portfolio there have been very low incidences of payment defaults and exposures requiring restructuring.
The Group’s strategy is to focus on modern assets that are widely used across airlines and to maintain relationships with the strongest operators with the most flexible cost base. The majority of the portfolio is secured on modern aircraft and, although asset prices have weakened, exposures remain fully secured.
Aviation exposure on the Group’s watch list, where there is an increased level of management control and oversight, totalled £1.4 billion at 31 December 2009. Notwithstanding reduced passenger volumes, the leased fleet remains fully utilised. The young age and commodity nature of the assets and the quality of the lessees, result in a limited expectation of aircraft being returned.
* unaudited
93
Business review
Risk, capital and liquidity management
Credit risk continued
Credit risk assets* continued
Corporate sectors continued
Retail
The Group’s retail portfolio is a component of the wholesale and retail trade industry sector, for which credit risk assets totalled £32 billion at 31 December 2009. Retail comprises £16.3 billion or 51% of the total portfolio, with the remainder being exposure to wholesalers and service-orientated customers.
2009 | 2008 | |||||||||||||||||||||||
Domicile of obligor | Core | Non-Core | Total | Total | ||||||||||||||||||||
| £m | £m | £m | % | £m | % | |||||||||||||||||||
| Americas | 2,406 | 146 | 2,552 | 15 | 4,088 | 22 | ||||||||||||||||||
| Central Eastern Europe, Middle East and Africa | 394 | 74 | 468 | 3 | 589 | 3 | ||||||||||||||||||
| UK | 6,810 | 1,180 | 7,990 | 49 | 7,483 | 41 | ||||||||||||||||||
| Other Europe | 3,160 | 1,889 | 5,049 | 31 | 5,531 | 30 | ||||||||||||||||||
| Asia | 211 | 64 | 275 | 2 | 643 | 4 | ||||||||||||||||||
| 12,981 | 3,353 | 16,334 | 100 | 18,334 | 100 | |||||||||||||||||||
| 2009 | 2008 | |||||||||||||||||||||||
| Segment | Core | Non-Core | Total | Total | ||||||||||||||||||||
| £m | £m | £m | % | £m | % | |||||||||||||||||||
| Household goods | 2,127 | 338 | 2,465 | 15 | 3,117 | 17 | ||||||||||||||||||
| Food, beverages and tobacco | 3,191 | 162 | 3,353 | 21 | 4,235 | 23 | ||||||||||||||||||
| Clothing and footwear | 1,176 | 379 | 1,555 | 9 | 2,345 | 13 | ||||||||||||||||||
| Pharmaceutical, health and beauty | 1,424 | 236 | 1,660 | 10 | 2,049 | 11 | ||||||||||||||||||
| Other retail | 5,063 | 2,238 | 7,301 | 45 | 6,588 | 36 | ||||||||||||||||||
| 12,981 | 3,353 | 16,334 | 100 | 18,334 | 100 | |||||||||||||||||||
The Group’s exposure to the retail sector was £16.3 billion at 31 December 2009, down 11% on the prior year. The portfolio is well spread geographically and across sub-sectors.
Economic weakness and reduced consumer confidence is affecting the sector, with the impact most severe for stores reliant on high discretionary spend and for smaller retailers. Food retailers generally fared well during the year, as did the ‘value’ end of the sector in the context of reduced household spending.
Whilst there has been some flow of retail customers into the GRG, the total value of debt managed by that team remains low. Economic conditions are, however, increasingly bringing to light those in the sector with poor operating models and stretched balance sheets. The more successful operators continue to adapt their customer proposition, operating models and capital structure to the new environment whilst keeping tight control on working capital.
*unaudited
94
Business review continued
Credit risk continued
Risk elements and impairments
All the disclosures in this section (pages 95 to 101) are audited. The Group classifies impaired assets as either risk elements in lending (REIL) or potential problem loans (PPL). REIL represents non-accrual loans, loans that are accruing but are past due 90 days and restructured loans. PPL represents impaired assets which are not included in REIL, but where information about possible credit problems cause management to have serious doubts about the future ability of the borrower to comply with loan repayment terms.
Both REIL and PPL are reported gross and take no account of the value of any security held which could reduce the eventual loss should it occur, nor of any provision marked. Therefore impaired assets which are highly collateralised, such as mortgages, will have a low coverage ratio of provisions held against the reported impaired balance.
The analyses of risk elements in lending and impairments as discussed below, form a key part of the data provided to senior management on the credit performance of the Group’s portfolios.
Risk elements in lending and potential problem loans by division
Total | ||||||||||||||||||||||||
Total | provision | |||||||||||||||||||||||
REIL | Total | provision as | as % of | |||||||||||||||||||||
REIL | PPL | & PPL | provision | % of REIL | REIL & PPL | |||||||||||||||||||
| £m | £m | £m | £m | % | % | |||||||||||||||||||
| 2009 | ||||||||||||||||||||||||
| UK Retail | 4,641 | — | 4,641 | 2,677 | 58 | 58 | ||||||||||||||||||
| UK Corporate | 2,330 | 97 | 2,427 | 1,271 | 55 | 52 | ||||||||||||||||||
| Wealth | 218 | 38 | 256 | 55 | 25 | 21 | ||||||||||||||||||
| Global Banking & Markets | 1,800 | 131 | 1,931 | 1,289 | 72 | 67 | ||||||||||||||||||
| Global Transaction Services | 197 | 4 | 201 | 189 | 96 | 94 | ||||||||||||||||||
| Ulster Bank | 2,260 | 2 | 2,262 | 962 | 43 | 43 | ||||||||||||||||||
| US Retail & Commercial | 643 | — | 643 | 478 | 74 | 74 | ||||||||||||||||||
| Core | 12,089 | 272 | 12,361 | 6,921 | 57 | 56 | ||||||||||||||||||
| Non-Core | 22,900 | 652 | 23,552 | 8,252 | 36 | 35 | ||||||||||||||||||
| Group before RFS Holdings minority interest | 34,989 | 924 | 35,913 | 15,173 | 43 | 42 | ||||||||||||||||||
| RFS Holdings minority interest | 3,260 | 85 | 3,345 | 2,110 | 65 | 63 | ||||||||||||||||||
| Group | 38,249 | 1,009 | 39,258 | 17,283 | 45 | 44 | ||||||||||||||||||
| 2008 | ||||||||||||||||||||||||
| UK Retail | 3,832 | — | 3,832 | 2,086 | 54 | 54 | ||||||||||||||||||
| UK Corporate | 1,254 | 74 | 1,328 | 696 | 56 | 52 | ||||||||||||||||||
| Wealth | 107 | 24 | 131 | 34 | 32 | 26 | ||||||||||||||||||
| Global Banking & Markets | 869 | 18 | 887 | 621 | 71 | 70 | ||||||||||||||||||
| Global Transaction Services | 53 | — | 53 | 43 | 81 | 81 | ||||||||||||||||||
| Ulster Bank | 1,196 | 1 | 1,197 | 491 | 41 | 41 | ||||||||||||||||||
| US Retail & Commercial | 424 | — | 424 | 298 | 70 | 70 | ||||||||||||||||||
| Core | 7,735 | 117 | 7,852 | 4,269 | 55 | 54 | ||||||||||||||||||
| Non-Core | 11,056 | 109 | 11,165 | 5,182 | 47 | 46 | ||||||||||||||||||
| Group before RFS Holdings minority interest | 18,791 | 226 | 19,017 | 9,451 | 50 | 50 | ||||||||||||||||||
| RFS Holdings minority interest | 2,470 | — | 2,470 | 1,565 | 63 | 63 | ||||||||||||||||||
| Group | 21,261 | 226 | 21,487 | 11,016 | 52 | 51 | ||||||||||||||||||
| 2007 | ||||||||||||||||||||||||
| UK Retail | 3,369 | — | 3,369 | 2,048 | 61 | 61 | ||||||||||||||||||
| UK Corporate | 1,187 | 16 | 1,203 | 737 | 62 | 61 | ||||||||||||||||||
| Wealth | 45 | 11 | 56 | 26 | 58 | 46 | ||||||||||||||||||
| Global Banking & Markets | 830 | 67 | 897 | 493 | 59 | 55 | ||||||||||||||||||
| Global Transaction Services | 73 | — | 73 | 22 | 30 | 30 | ||||||||||||||||||
| Ulster Bank | 442 | 1 | 443 | 314 | 71 | 71 | ||||||||||||||||||
| US Retail & Commercial | 229 | — | 229 | 220 | 96 | 96 | ||||||||||||||||||
| Other | — | — | — | 30 | — | — | ||||||||||||||||||
| Core | 6,175 | 95 | 6,270 | 3,890 | 63 | 62 | ||||||||||||||||||
| Non-Core | 2,076 | 36 | 2,112 | 1,082 | 52 | 51 | ||||||||||||||||||
| Group before RFS Holdings minority interest | 8,251 | 131 | 8,382 | 4,972 | 60 | 59 | ||||||||||||||||||
| RFS Holdings minority interest | 2,480 | 540 | 3,020 | 1,480 | 60 | 49 | ||||||||||||||||||
| Group | 10,731 | 671 | 11,402 | 6,452 | 60 | 57 | ||||||||||||||||||
Key points
| · | Provision coverage fell during the year from 52% to 45% (REIL & PPL coverage fell from 51% to 44%) as a consequence of the growth in REIL being concentrated in secured, property-related loans. These loans require relatively lower provisions in view of their collateralised nature. With many of these being in Non-Core, the provision coverage ratio is lower in Non-Core than in Core. |
| · | Provision coverage in Core business improved from 55% to 57%. |
| · | REIL in the Core businesses increased by £4.4 billion to £12.1 billion while REIL in Non-Core more than doubled to £22.9 billion. |
95
Credit risk continued
Risk elements in lending and potential problem loans
2009 | 2008 | 2007 | ||||||||||||||||||||||||||||||||||
Group | Group | Group | ||||||||||||||||||||||||||||||||||
before RFS | RFS | before RFS | before RFS | |||||||||||||||||||||||||||||||||
Holdings | Holdings | Holdings | Holdings | |||||||||||||||||||||||||||||||||
minority | minority | minority | minority | |||||||||||||||||||||||||||||||||
Core | Non-Core | interest | interest | Group | interest | Group | interest | Group | ||||||||||||||||||||||||||||
| £m | £m | £m | £m | £m | £m | £m | £m | £m | ||||||||||||||||||||||||||||
| Loans accounted for on a | ||||||||||||||||||||||||||||||||||||
| non-accrual basis(2): | ||||||||||||||||||||||||||||||||||||
| Domestic | 6,348 | 7,221 | 13,569 | 3 | 13,572 | 8,579 | 8,588 | 5,599 | 5,599 | |||||||||||||||||||||||||||
| Foreign | 4,383 | 13,859 | 18,242 | 3,211 | 21,453 | 8,503 | 10,891 | 2,350 | 4,763 | |||||||||||||||||||||||||||
| 10,731 | 21,080 | 31,811 | 3,214 | 35,025 | 17,082 | 19,479 | 7,949 | 10,362 | ||||||||||||||||||||||||||||
| Accruing loans which are | ||||||||||||||||||||||||||||||||||||
contractually overdue 90 days or more as to principal interest(3): | ||||||||||||||||||||||||||||||||||||
| Domestic | 1,135 | 1,089 | 2,224 | — | 2,224 | 1,201 | 1,201 | 217 | 217 | |||||||||||||||||||||||||||
| Foreign | 223 | 731 | 954 | 46 | 1,000 | 508 | 581 | 85 | 152 | |||||||||||||||||||||||||||
| 1,358 | 1,820 | 3,178 | 46 | 3,224 | 1,709 | 1,782 | 302 | 369 | ||||||||||||||||||||||||||||
| Total REIL | 12,089 | 22,900 | 34,989 | 3,260 | 38,249 | 18,791 | 21,261 | 8,251 | 10,731 | |||||||||||||||||||||||||||
| Potential problem loans(4): | ||||||||||||||||||||||||||||||||||||
| Domestic | 137 | 287 | 424 | — | 424 | 218 | 218 | 63 | 63 | |||||||||||||||||||||||||||
| Foreign | 135 | 365 | 500 | 85 | 585 | 8 | 8 | 68 | 608 | |||||||||||||||||||||||||||
| Total PPL | 272 | 652 | 924 | 85 | 1,009 | 226 | 226 | 131 | 671 | |||||||||||||||||||||||||||
| REIL as a % of gross lending | ||||||||||||||||||||||||||||||||||||
to customers excluding reverse repos(5) | 2.8 | % | 15.1 | % | 6.1 | % | 2.4 | % | 5.4 | % | 2.7 | % | 2.5 | % | 1.5 | % | 1.6 | % | ||||||||||||||||||
| REIL and PPL as a % of gross | ||||||||||||||||||||||||||||||||||||
| lending to customers | ||||||||||||||||||||||||||||||||||||
| excluding reverse repos(5) | 2.9 | % | 15.5 | % | 6.2 | % | 2.5 | % | 5.5 | % | 2.7 | % | 2.5 | % | 1.5 | % | 1.6 | % | ||||||||||||||||||
Notes:
| (1) | For the analysis above, ‘Domestic’ consists of the United Kingdom domestic transactions of the Group. ‘Foreign’ comprises the Group’s transactions conducted through the offices outside the UK and those offices in the UK specifically organised to service international banking transactions. |
| (2) | All loans against which an impairment provision is held are reported in the non-accrual category. |
| (3) | Loans where an impairment event has taken place but no impairment recognised. This category is used for fully collateralised non-revolving credit facilities. |
| (4) | Loans for which an impairment event has occurred but no impairment provision is necessary. This category is used for fully collateralised advances and revolving credit facilities where identification as 90 days overdue is not feasible. |
| (5) | Includes gross loans relating to disposal groups in 2009. |
Key points
| · | At 31 December 2009 REIL were 80% greater than at 31 December 2008. The majority of this growth was attributable to property assets, particularly in Non-Core which had a 107% increase in REIL. |
| · | PPL also increased compared with 31 December 2008. |
| · | REIL growth slowed in the second half of the year (15%) compared with the first half (57%), reflecting the moderating asset quality trend observed as the year progressed. REIL levels in the fourth quarter were flat to the third quarter. |
| · | REIL and PPL represented 5.5% of gross lending to customers, up from 2.5% at the end of 2008. |
96
Business review continued
Credit risk continued
Impairment loss provision methodology
Provisions for impairment losses are assessed under three categories:
| · | Individually assessed provisions: provisions required for individually significant impaired assets which are assessed on a case by case basis, taking into account the financial condition of the counterparty and any guarantee and other collateral held after being stressed for downside risk. This incorporates an estimate of the discounted value any recoveries and realisation of security or collateral. The asset continues to be assessed on an individual basis until it is repaid in full, in transferred to the performing portfolio or written-off; |
| · | Collectively assessed provisions: provisions on impaired credits below an agreed threshold which are assessed on a portfolio basis, reflect the homogeneous nature of the assets, such as credit cards or personal loans. The provision is determined from a quantitative review of the relevant portfolio, taking account of the level of arrears, security and average loss experience over the recovery period; and |
| · | Latent loss provisions: provisions held against impairments in the performing portfolio that have been incurred as a result of events occuring before the balance sheet date but which have not been identified at the balance sheet date. The Group has developed methodologies to estimate latent loss provisions that reflect: |
| - Historical loss experience adjusted where appropriate, in the light of current economic and credit conditions; and | |
| - The period (‘emergence period’) between an impairment event and a loan being identified and reported as impaired. |
Recoverable cash flows are estimated using two parameters: loss given default (LGD) – this is the estimated loss amount, expressed as a percentage, that will be incurred if the borrower defaults; and the probability that the borrower will default (PD).
Emergence periods are estimated at a portfolio level and reflect the portfolio product characteristics such as a coupon period and repayment terms, and the duration of the administrative process required to report and identify an impaired loan as such. Emergence periods vary across different portfolios from two to 225 days. They are based on actual experience within the particular portfolio and are reviewed regularly.
The Group’s retail business segment their performing loan books into homogenous portfolios such as mortgages, credit cards or unsecured loans, to reflect their different credit characteristics. Latent provisions are computed by applying portfolio-level LGDs, PDs and emergence periods. The wholesale calculation is based on similar principles but there is no segmentation into portfolios: PDs and LGDs are calculated on an individual basis.
Provision analysis
The Group’s consumer portfolios, which consist of high volume, small value credits, have highly efficient largely automated processes for identifying problem credits and very short timescales, typically three months, before resolution or adoption of various recovery methods. Corporate portfolios consist of higher value, lower volume credits, which tend to be structured to meet individual customer requirements.
Provisions are assessed on a case by case basis by experienced specialists with input from professional valuers and accountants. The Group operates a transparent provisions governance framework, setting thresholds to trigger enhanced oversight and challenge.
97
Business review
Risk, capital and liquidity management
Credit risk continued
Impairment charge
The following table shows impairment losses charged to the income statement.
2009 | ||||||||||||||||||||||||||||
Group before | RFS | |||||||||||||||||||||||||||
RFS Holdings | Holdings | |||||||||||||||||||||||||||
minority | minority | 2008 | 2007 | |||||||||||||||||||||||||
Core | Non-Core | interest | interest | Group | Group | Group | ||||||||||||||||||||||
| £m | £m | £m | £m | £m | £m | £m | ||||||||||||||||||||||
| New impairment losses | 4,867 | 9,357 | 14,224 | 1,125 | 15,349 | 8,391 | 2,310 | |||||||||||||||||||||
| less: recoveries of amounts previously written-off | (189 | ) | (136 | ) | (325 | ) | (74 | ) | (399 | ) | (319 | ) | (342 | ) | ||||||||||||||
| Charge to income statement | 4,678 | 9,221 | 13,899 | 1,051 | 14,950 | 8,072 | 1,968 | |||||||||||||||||||||
| Comprising: | ||||||||||||||||||||||||||||
| Loan impairment losses | 4,567 | 8,523 | 13,090 | 1,044 | 14,134 | 7,091 | 1,946 | |||||||||||||||||||||
| Impairment losses on available-for-sale securities | 111 | 698 | 809 | 7 | 816 | 981 | 22 | |||||||||||||||||||||
| Charge to income statement | 4,678 | 9,221 | 13,899 | 1,051 | 14,950 | 8,072 | 1,968 | |||||||||||||||||||||
| Impairment charge by division | ||||||||||||||||||||||||||||
| 2009 | 2008 | 2007 | ||||||||||||||||||||||||||
| Division | £m | £m | £m | |||||||||||||||||||||||||
| UK Retail | 1,679 | 1,019 | 975 | |||||||||||||||||||||||||
| UK Corporate | 927 | 319 | 178 | |||||||||||||||||||||||||
| Wealth | 33 | 16 | 3 | |||||||||||||||||||||||||
| Global Banking & Markets | 640 | 522 | 66 | |||||||||||||||||||||||||
| Global Transaction Services | 39 | 54 | 14 | |||||||||||||||||||||||||
| Ulster Bank | 649 | 106 | 46 | |||||||||||||||||||||||||
| US Retail & Commercial | 702 | 437 | 246 | |||||||||||||||||||||||||
| RBS Insurance | 8 | 42 | — | |||||||||||||||||||||||||
| Central items | 1 | (19 | ) | 3 | ||||||||||||||||||||||||
| Core | 4,678 | 2,496 | 1,531 | |||||||||||||||||||||||||
| Non-Core | 9,221 | 4,936 | 399 | |||||||||||||||||||||||||
| Group before RFS Holdings minority interest | 13,899 | 7,432 | 1,930 | |||||||||||||||||||||||||
| RFS Holdings minority interest | 1,051 | 640 | 38 | |||||||||||||||||||||||||
| Group | 14,950 | 8,072 | 1,968 | |||||||||||||||||||||||||
Key point
| · | Impairment losses increased by £6.9 billion to £15.0 billion. Non-Core accounted for 62% (£4.3 billion) of the increase. Retail and commercial business in UK, Ireland and the US also recorded significant increases in loans impairments. |
98
Business review continued
Credit risk continued
Analysis of loan impairment charge
| 2009 | 2008 | 2007 | ||||||||||||||||||||||||||||||||||
Core | Non-Core | Group before RFS Holdings minority interest | RFS Holdings minority interest | Group | Group interestbefore RFS Holdings minority | Group | Group interestbefore RFS Holdings minority | Group | ||||||||||||||||||||||||||||
| £m | £m | £m | £m | £m | £m | £m | £m | £m | ||||||||||||||||||||||||||||
| Latent loss | 991 | 193 | 1,184 | 128 | 1,312 | 769 | 822 | 25 | 88 | |||||||||||||||||||||||||||
| Collectively assessed | 2,545 | 1,449 | 3,994 | 203 | 4,197 | 2,391 | 2,606 | 1,813 | 1,584 | |||||||||||||||||||||||||||
| Individually assessed (1) | 1,019 | 6,859 | 7,878 | 713 | 8,591 | 3,200 | 3,545 | 244 | 274 | |||||||||||||||||||||||||||
| Charge to income statement (2) | 4,555 | 8,501 | 13,056 | 1,044 | 14,100 | 6,360 | 6,973 | 2,082 | 1,946 | |||||||||||||||||||||||||||
Charge as a % of customer loans and advances – gross (3) | 1.1 | % | 5.7 | % | 2.3 | % | 0.8 | % | 2.0 | % | 0.9 | % | 0.8 | % | 0.4 | % | 0.3 | % | ||||||||||||||||||
Notes:
(1) | Excludes loan impairment charge against loans and advances to banks of £34 million (2008 – £118 million; 2007 – nil). |
(2) | Excludes impairments of available-for-sale securities of £816 million (2008 – £981 million; 2007 – £22 million). |
(3) | Gross of provisions and excluding reverse repurchase agreements. Includes gross loans relating to disposal groups. |
Analysis of loan impairment provisions on loans to customers
| 2009 | 2008 | 2007 | ||||||||||||||||||||||||||||||||||
Group | Group | Group | ||||||||||||||||||||||||||||||||||
before RFS | RFS | before RFS | before RFS | |||||||||||||||||||||||||||||||||
Holdings | Holdings | Holdings | Holdings | |||||||||||||||||||||||||||||||||
minority | minority | minority | minority | |||||||||||||||||||||||||||||||||
Core | Non-Core | interest | interest | Group | interest | Group | interest | Group | ||||||||||||||||||||||||||||
| £m | £m | £m | £m | £m | £m | £m | £m | £m | ||||||||||||||||||||||||||||
Latent loss | 2,005 | 735 | 2,740 | 336 | 3,076 | 1,719 | 1,944 | 734 | 1,050 | |||||||||||||||||||||||||||
Collectively assessed | 3,509 | 1,266 | 4,775 | 479 | 5,254 | 3,692 | 4,102 | 3,162 | 3,845 | |||||||||||||||||||||||||||
Individually assessed (1) | 1,272 | 6,229 | 7,501 | 1,295 | 8,796 | 3,913 | 4,843 | 1,073 | 1,554 | |||||||||||||||||||||||||||
| 6,786 | 8,230 | 15,016 | 2,110 | 17,126 | 9,324 | 10,889 | 4,969 | 6,449 | ||||||||||||||||||||||||||||
Note:
| (1) | Excludes provision of £157 million relating to loans and advances to banks (2008 – £127 million; 2007 – £3 million). |
99
Business review
Risk, capital and liquidity management
Credit risk continued
Movement in loan impairment provisions
The following table shows the movement in the provision for impairment losses for loans and advances.
Individually assessed | Collectively | 2009 | 2008 | 2007 | ||||||||||||||||||||||||
Banks | Customers | assessed | Latent | Total | Total | Total | ||||||||||||||||||||||
| £m | £m | £m | £m | £m | £m | £m | ||||||||||||||||||||||
| Group before RFS Holdings minority interest | ||||||||||||||||||||||||||||
| At 1 January | 127 | 3,913 | 3,692 | 1,719 | 9,451 | 4,972 | 4,501 | |||||||||||||||||||||
| Transfers to disposal groups | — | (152 | ) | (111 | ) | (58 | ) | (321 | ) | — | — | |||||||||||||||||
| Currency translation and other adjustments | (4 | ) | (263 | ) | (56 | ) | (105 | ) | (428 | ) | 1,007 | 72 | ||||||||||||||||
| Acquisition of subsidiaries | — | — | — | — | — | — | 129 | |||||||||||||||||||||
| Disposals | — | (65 | ) | — | — | (65 | ) | (178 | ) | — | ||||||||||||||||||
| Amounts written-off | — | (3,609 | ) | (2,869 | ) | — | (6,478 | ) | (2,897 | ) | (1,914 | ) | ||||||||||||||||
| Recoveries of amounts previously written-off | — | 38 | 287 | — | 325 | 261 | 275 | |||||||||||||||||||||
| Charge to income statement (1) | 34 | 7,878 | 3,994 | 1,184 | 13,090 | 6,478 | 2,082 | |||||||||||||||||||||
Discount unwind | — | (239 | ) | (162 | ) | — | (401 | ) | (192 | ) | (173 | ) | ||||||||||||||||
| At 31 December (2) | 157 | 7,501 | 4,775 | 2,740 | 15,173 | 9,451 | 4,972 | |||||||||||||||||||||
| Group | ||||||||||||||||||||||||||||
| At 1 January | 127 | 4,843 | 4,102 | 1,944 | 11,016 | 6,452 | 3,935 | |||||||||||||||||||||
| Transfers to disposal groups | — | (155 | ) | (111 | ) | (58 | ) | (324 | ) | (767 | ) | — | ||||||||||||||||
| Currency translation and other adjustments | (4 | ) | (326 | ) | (78 | ) | (122 | ) | (530 | ) | 1,441 | 183 | ||||||||||||||||
| Acquisition of subsidiaries | — | — | — | — | — | — | 2,221 | |||||||||||||||||||||
| Disposals | — | (65 | ) | — | — | (65 | ) | (178 | ) | — | ||||||||||||||||||
| Amounts written-off | — | (3,940 | ) | (2,999 | ) | — | (6,939 | ) | (3,148 | ) | (2,011 | ) | ||||||||||||||||
| Recoveries of amounts previously written-off | — | 94 | 305 | — | 399 | 319 | 342 | |||||||||||||||||||||
| Charge to income statement (1) | 34 | 8,591 | 4,197 | 1,312 | 14,134 | 7,091 | 1,946 | |||||||||||||||||||||
| Discount unwind | — | (246 | ) | (162 | ) | — | (408 | ) | (194 | ) | (164 | ) | ||||||||||||||||
| At 31 December (2) | 157 | 8,796 | 5,254 | 3,076 | 17,283 | 11,016 | 6,452 | |||||||||||||||||||||
Notes:
| (1) | Includes charge relating to loans and advances to banks of £34 million (2008 – £118 million; 2007 – nil). |
| (2) | Includes closing provisions relating to loans and advances to banks of £157 million (2008 – £127 million; 2007 – £3 million). |
100
Business review continued
Credit risk continued
Movement in loan impairment provisions continued
The movement in provisions balance by division is shown in the table below.
RFS | ||||||||||||||||||||||||||||||||||||||||||||||||
UK | Global | Global | US | Holdings | ||||||||||||||||||||||||||||||||||||||||||||
UK | Corporate | Banking | Transaction | Ulster | Retail & | minority | ||||||||||||||||||||||||||||||||||||||||||
Retail | Banking | Wealth | & Markets | Services | Bank | Commercial | Non-Core | interest | 2009 | 2008 | 2007 | |||||||||||||||||||||||||||||||||||||
| £m | £m | £m | £m | £m | £m | £m | £m | £m | £m | £m | £m | |||||||||||||||||||||||||||||||||||||
| At 1 January | 2,086 | 696 | 34 | 621 | 43 | 491 | 298 | 5,182 | 1,565 | 11,016 | 6,452 | 3,935 | ||||||||||||||||||||||||||||||||||||
| Transfer to disposal groups | — | — | — | (16 | ) | — | — | — | (305 | ) | (3 | ) | (324 | ) | (767 | ) | — | |||||||||||||||||||||||||||||||
Currency translation and other adjustments | 67 | 5 | 1 | 365 | 128 | (109 | ) | (34 | ) | (851 | ) | (102 | ) | (530 | ) | 1,441 | 137 | |||||||||||||||||||||||||||||||
| Acquisition of subsidiaries | — | — | — | — | — | — | — | — | — | — | — | 2,221 | ||||||||||||||||||||||||||||||||||||
| Disposal of subsidiaries | — | — | — | (62 | ) | — | — | — | (3 | ) | — | (65 | ) | (178 | ) | — | ||||||||||||||||||||||||||||||||
Net increase in provisions of discontinued operations | — | — | — | — | — | — | — | — | — | — | — | 46 | ||||||||||||||||||||||||||||||||||||
| Amounts written-off | (1,150 | ) | (352 | ) | (12 | ) | (169 | ) | (23 | ) | (34 | ) | (546 | ) | (4,192 | ) | (461 | ) | (6,939 | ) | (3,148 | ) | (2,011 | ) | ||||||||||||||||||||||||
Recoveries of amounts previously written-off | 97 | 20 | — | 11 | 2 | 1 | 58 | 136 | 74 | 399 | 319 | 342 | ||||||||||||||||||||||||||||||||||||
| Charged to the income | ||||||||||||||||||||||||||||||||||||||||||||||||
| statement (1) | 1,679 | 923 | 33 | 542 | 39 | 649 | 702 | 8,523 | 1,044 | 14,134 | 7,091 | 1,946 | ||||||||||||||||||||||||||||||||||||
Unwind of discount | (102 | ) | (21 | ) | (1 | ) | (3 | ) | — | (36 | ) | — | (238 | ) | (7 | ) | (408 | ) | (194 | ) | (164 | ) | ||||||||||||||||||||||||||
At 31 December (2) | 2,677 | 1,271 | 55 | 1,289 | 189 | 962 | 478 | 8,252 | 2,110 | 17,283 | 11,016 | 6,452 | ||||||||||||||||||||||||||||||||||||
Notes:
(1) | Includes charge relating to loans and advances to banks of £34 million (2008 - £118 million; 2007 - nil). |
| (2) | Includes closing provisions relating to loans and advances to banks of £157 million (2008 - £127 million; 2007 - £3 million). |
Key points
| · | The provision charge for 2009 was approximately double the previous year. |
| · | Wholesale portfolios continue to drive the trend in provisions, with a notable concentration in the property sector. |
Analysis of AFS impairment charge
The following table analyses the AFS impairment charge.
2009 | 2008 | 2007 | ||||||||||||||||||||||
Group before | Group before | Group before | ||||||||||||||||||||||
RFS Holdings | RFS Holdings | RFS Holdings | ||||||||||||||||||||||
minority | minority | minority | ||||||||||||||||||||||
interest | Group | interest | Group | interest | Group | |||||||||||||||||||
| £m | £m | £m | £m | £m | £m | |||||||||||||||||||
| Debt securities | 601 | 601 | 851 | 878 | 20 | 20 | ||||||||||||||||||
| Equity securities | 208 | 215 | 103 | 103 | 2 | 2 | ||||||||||||||||||
| Total | 809 | 816 | 954 | 981 | 22 | 22 | ||||||||||||||||||
| Charge as a % of AFS assets | 0.6 | % | 0.6 | % | 0.7 | % | 0.8 | % | — | — | ||||||||||||||
101
Business review
Risk, capital and liquidity management
Balance sheet analysis
All the disclosures in this section (pages 102 to 106) are audited. The following tables provide an analysis of the credit quality and distribution of financial assets by the Group’s internal credit quality gradings, geography and industry sector. Credit risk assets analysed on the preceding pages are reported internally to senior management, however they exclude certain exposures and take account of netting agreements including master netting arrangements that provide a right of legal set-off but do not meet the criteria for off-set in IFRS. The analysis below is therefore provided to supplement the credit risk assets analysis and to reconcile to the consolidated balance sheet.
Credit quality
Cash and | ||||||||||||||||||||||||||||||||||||
balances | Loans and | Loans and | Other | |||||||||||||||||||||||||||||||||
at central | advances | advances to | Settlement | financial | Contingent | |||||||||||||||||||||||||||||||
2009 | banks | to banks (1) | customers | balances | Derivatives | instruments | Commitments | liabilities | Total | |||||||||||||||||||||||||||
| £m | £m | £m | £m | £m | £m | £m | £m | £m | ||||||||||||||||||||||||||||
AQ1 | 52,234 | 79,453 | 115,738 | 6,592 | 390,786 | 754 | 62,488 | 9,792 | 717,837 | |||||||||||||||||||||||||||
AQ2 | — | 1,873 | 14,025 | 306 | 11,740 | 9 | 27,984 | 4,854 | 60,791 | |||||||||||||||||||||||||||
AQ3 | 1 | 2,206 | 36,165 | 199 | 10,903 | — | 28,749 | 6,417 | 84,640 | |||||||||||||||||||||||||||
AQ4 | 23 | 1,455 | 128,981 | 605 | 8,872 | — | 53,979 | 16,174 | 210,089 | |||||||||||||||||||||||||||
AQ5 | 2 | 2,851 | 159,914 | 149 | 8,639 | 37 | 44,342 | 8,228 | 224,162 | |||||||||||||||||||||||||||
AQ6 | 1 | 471 | 111,588 | 49 | 2,674 | — | 31,235 | 2,736 | 148,754 | |||||||||||||||||||||||||||
AQ7 | — | 122 | 64,724 | 26 | 2,326 | 98 | 27,057 | 2,605 | 96,958 | |||||||||||||||||||||||||||
AQ8 | — | 172 | 31,272 | — | 1,448 | — | 12,730 | 1,179 | 46,801 | |||||||||||||||||||||||||||
AQ 9 | — | 237 | 21,411 | — | 2,007 | — | 5,379 | 1,465 | 30,499 | |||||||||||||||||||||||||||
AQ10 | — | 386 | 10,460 | — | 2,019 | — | 3,698 | 570 | 17,133 | |||||||||||||||||||||||||||
Accruing past due | — | 36 | 16,331 | 3,910 | 39 | — | — | — | 20,316 | |||||||||||||||||||||||||||
Non-accrual | — | 115 | 34,910 | 197 | 1 | — | — | — | 35,223 | |||||||||||||||||||||||||||
Impairment provision | — | (157 | ) | (17,126 | ) | — | — | — | — | — | (17,283 | ) | ||||||||||||||||||||||||
| Group | 52,261 | 89,220 | 728,393 | 12,033 | 441,454 | 898 | 297,641 | 55,020 | 1,675,920 | |||||||||||||||||||||||||||
2008 | ||||||||||||||||||||||||||||||||||||
AQ1 | 12,397 | 98,082 | 157,212 | 11,958 | 837,987 | 630 | 123,399 | 10,279 | 1,251,944 | |||||||||||||||||||||||||||
AQ2 | 3 | 7,250 | 21,656 | 535 | 27,225 | — | 23,379 | 2,132 | 82,180 | |||||||||||||||||||||||||||
AQ3 | — | 14,296 | 68,663 | 550 | 35,756 | — | 26,797 | 2,851 | 148,913 | |||||||||||||||||||||||||||
AQ4 | — | 12,792 | 141,857 | 34 | 46,318 | — | 64,891 | 13,800 | 279,692 | |||||||||||||||||||||||||||
AQ5 | — | 1,066 | 175,544 | 252 | 27,047 | — | 64,308 | 19,124 | 287,341 | |||||||||||||||||||||||||||
AQ6 | — | 680 | 124,606 | 217 | 6,632 | 222 | 18,145 | 12,246 | 162,748 | |||||||||||||||||||||||||||
AQ7 | — | 201 | 107,624 | 248 | 4,547 | — | 17,915 | 8,208 | 138,743 | |||||||||||||||||||||||||||
AQ8 | — | 305 | 28,517 | — | 1,477 | — | 14,603 | 1,269 | 46,171 | |||||||||||||||||||||||||||
AQ9 | — | 356 | 17,329 | 9 | 2,136 | — | 6,298 | 1,160 | 27,288 | |||||||||||||||||||||||||||
AQ10 | — | 279 | 7,586 | — | 3,423 | — | 1,989 | 468 | 13,745 | |||||||||||||||||||||||||||
Accruing past due | — | — | 15,667 | 4,029 | 11 | — | — | — | 19,707 | |||||||||||||||||||||||||||
Non-accrual | — | 129 | 19,350 | — | — | — | — | — | 19,479 | |||||||||||||||||||||||||||
Impairment provision | — | (127 | ) | (10,889 | ) | — | — | — | — | — | (11,016 | ) | ||||||||||||||||||||||||
| Group | 12,400 | 135,309 | 874,722 | 17,832 | 992,559 | 852 | 361,724 | 71,537 | 2,466,935 | |||||||||||||||||||||||||||
Note:
| (1) | Excluding items in the course of collection of £2,533 million (2008 – £2,888 million). |
102
Business review continued
Balance sheet analysis continued
Credit quality continued
The following tables show 2007 and 2008 based on the old AQ1-5 bands.
Cash and | ||||||||||||||||||||||||||||||||||||
balances | Loans and | Loans and | Other | |||||||||||||||||||||||||||||||||
at central | advances | advances to | Settlement | financial | Contingent | |||||||||||||||||||||||||||||||
2008 | banks | to banks (1) | customers | balances | Derivatives | instruments | Commitments | liabilities | Total | |||||||||||||||||||||||||||
| £m | £m | £m | £m | £m | £m | £m | £m | £m | ||||||||||||||||||||||||||||
| AQ1 | 12,400 | 131,963 | 310,950 | 12,612 | 912,728 | 691 | 209,359 | 19,693 | 1,610,396 | |||||||||||||||||||||||||||
| AQ2 | — | 872 | 141,849 | 516 | 36,528 | — | 55,109 | 18,461 | 253,335 | |||||||||||||||||||||||||||
| AQ3 | — | 1,247 | 187,899 | 290 | 30,079 | 161 | 48,554 | 19,502 | 287,732 | |||||||||||||||||||||||||||
| AQ4 | — | 282 | 150,705 | 129 | 5,181 | — | 23,458 | 10,977 | 190,732 | |||||||||||||||||||||||||||
| AQ5 | — | 943 | 59,191 | 256 | 8,032 | — | 25,244 | 2,904 | 96,570 | |||||||||||||||||||||||||||
| Accruing past due | — | — | 15,667 | 4,029 | 11 | — | — | — | 19,707 | |||||||||||||||||||||||||||
| Non-accrual | — | 129 | 19,350 | — | — | — | — | — | 19,479 | |||||||||||||||||||||||||||
| Impairment provision | — | (127 | ) | (10,889 | ) | — | — | — | — | — | (11,016 | ) | ||||||||||||||||||||||||
| Group | 12,400 | 135,309 | 874,722 | 17,832 | 992,559 | 852 | 361,724 | 71,537 | 2,466,935 | |||||||||||||||||||||||||||
| 2007 | ||||||||||||||||||||||||||||||||||||
| AQ1 | 17,866 | 204,083 | 275,715 | 14,491 | 240,114 | 669 | 131,750 | 26,120 | 910,808 | |||||||||||||||||||||||||||
| AQ2 | — | 5,797 | 174,074 | 98 | 23,333 | — | 89,682 | 16,314 | 309,298 | |||||||||||||||||||||||||||
| AQ3 | — | 4,937 | 221,561 | 344 | 11,299 | — | 74,126 | 11,740 | 324,007 | |||||||||||||||||||||||||||
| AQ4 | — | 407 | 84,791 | 21 | 2,352 | — | 25,320 | 4,032 | 116,923 | |||||||||||||||||||||||||||
| AQ5 | — | 1,119 | 55,273 | 68 | 304 | 143 | 17,301 | 3,714 | 77,922 | |||||||||||||||||||||||||||
| Accruing past due | — | — | 13,236 | 1,567 | — | 65 | — | — | 14,868 | |||||||||||||||||||||||||||
| Non-accrual | — | 25 | 10,337 | — | — | — | — | — | 10,362 | |||||||||||||||||||||||||||
| Impairment provision | — | (3 | ) | (6,449 | ) | — | — | — | — | — | (6,452 | ) | ||||||||||||||||||||||||
| Group | 17,866 | 216,365 | 828,538 | 16,589 | 277,402 | 877 | 338,179 | 61,920 | 1,757,736 | |||||||||||||||||||||||||||
Note:
| (1) | Excluding items in the course of collection of £2,888 million in 2008 (2007 – £3,095 million). |
103
Business review
Risk, capital and liquidity management
Balance sheet analysis continued
| Debt securities | ||||||||
| The table below analyses debt securities by external ratings, mapped on to the Standard & Poor’s ratings scale. | ||||||||
| Bank and | ||||||||||||||||||||||||||||
| UK and US | Other | Building | Asset-backed | |||||||||||||||||||||||||
| government | government | Society | securities | Corporate | Other | Total | ||||||||||||||||||||||
| 2009 | £m | £m | £m | £m | £m | £m | £m | |||||||||||||||||||||
| AAA | 49,820 | 44,396 | 4,012 | 65,067 | 2,263 | — | 165,558 | |||||||||||||||||||||
| BBB- and above | — | 39,009 | 9,523 | 17,071 | 5,476 | — | 71,079 | |||||||||||||||||||||
| Non-investment grade | — | 353 | 169 | 3,515 | 2,042 | — | 6,079 | |||||||||||||||||||||
| Unrated | — | 504 | 289 | 1,949 | 2,601 | 1,036 | 6,379 | |||||||||||||||||||||
| Group before RFS Holdings minority interest | 49,820 | 84,262 | 13,993 | 87,602 | 12,382 | 1,036 | 249,095 | |||||||||||||||||||||
| RFS Holdings minority interest | 904 | 11,871 | 3,803 | 580 | 906 | 95 | 18,159 | |||||||||||||||||||||
| Group | 50,724 | 96,133 | 17,796 | 88,182 | 13,288 | 1,131 | 267,254 | |||||||||||||||||||||
| 2008 | ||||||||||||||||||||||||||||
| AAA | 35,301 | 43,197 | 8,126 | 93,853 | 3,953 | — | 184,430 | |||||||||||||||||||||
| BBB- and above | — | 15,862 | 13,013 | 11,437 | 10,172 | — | 50,484 | |||||||||||||||||||||
| Non-investment grade | — | 242 | 127 | 3,678 | 2,259 | — | 6,306 | |||||||||||||||||||||
| Unrated | — | 409 | 1,445 | 2,175 | 4,517 | 3,393 | 11,939 | |||||||||||||||||||||
| Group before RFS Holdings minority interest | 35,301 | 59,710 | 22,711 | 111,143 | 20,901 | 3,393 | 253,159 | |||||||||||||||||||||
| RFS Holdings minority interest | 7 | 10,761 | 1,652 | — | 885 | 1,085 | 14,390 | |||||||||||||||||||||
| Group | 35,308 | 70,471 | 24,363 | 111,143 | 21,786 | 4,478 | 267,549 |
Key points
| • | 66% of the portfolio is AAA rated; 95% is investment grade. |
| • | Securities issued by central and local governments comprised 54% of the portfolio at 31 December 2009. |
| • | 63% of corporate debt securities are investment grade. Of £2.6 billion unrated corporate securities, £1.1 billion relates to US funds derivatives portfolio. |
| • | See Market turmoil section on page 137 for further analysis of asset-backed securities. |
Business review continued
Balance sheet analysis continued | |||||||
| Past due analysis | |||||||
| The following loans and advances to customers were past due at the balance sheet date but not considered impaired: | |||||||
| 2009 | ||||||||||||||||||||||||||||
| Group before RFS | RFS Holdings | |||||||||||||||||||||||||||
| Holdings minority | minority | 2008 | 2007 | |||||||||||||||||||||||||
| Core | Non-Core | interest | interest | Group | Group | Group | ||||||||||||||||||||||
| £m | £m | £m | £m | £m | £m | £m | ||||||||||||||||||||||
| Past due 1-29 days | 5,101 | 1,486 | 6,587 | 1,209 | 7,796 | 9,517 | 8,768 | |||||||||||||||||||||
| Past due 30-59 days | 1,943 | 357 | 2,300 | 424 | 2,724 | 2,941 | 2,745 | |||||||||||||||||||||
| Past due 60-89 days | 2,203 | 207 | 2,410 | 177 | 2,587 | 1,427 | 1,354 | |||||||||||||||||||||
| Past due 90 days or more | 1,358 | 1,820 | 3,178 | 46 | 3,224 | 1,782 | 369 | |||||||||||||||||||||
| 10,605 | 3,870 | 14,475 | 1,856 | 16,331 | 15,667 | 13,236 | ||||||||||||||||||||||
Note:
| (1) | These balances include loans and advances to customers that are past due through administrative and other delays in recording payments or in finalising documentation and other events unrelated to credit quality. |
| Industry risk – geographical analysis | ||||||||
| The table below analyses financial assets by location of office and by industry type. | ||||||||
| Loans and | ||||||||||||||||||||||||
| advances to | Netting | |||||||||||||||||||||||
| banks and | and | |||||||||||||||||||||||
| 2009 | customers | Securities | Derivatives | Other (1) | Total | offset(2) | ||||||||||||||||||
| £m | £m | £m | £m | £m | £m | |||||||||||||||||||
| UK | 446,590 | 142,919 | 280,943 | 6,537 | 876,989 | 252,352 | ||||||||||||||||||
| US | 102,106 | 55,796 | 128,756 | 5,920 | 292,578 | 113,670 | ||||||||||||||||||
| Europe | 248,204 | 71,016 | 5,228 | 149 | 324,597 | — | ||||||||||||||||||
| RoW | 40,529 | 18,529 | 26,527 | 848 | 86,433 | 19,803 | ||||||||||||||||||
| 837,429 | 288,260 | 441,454 | 13,454 | 1,580,597 | 385,825 | |||||||||||||||||||
| Central and local government | 9,006 | 155,118 | 7,013 | 205 | 171,342 | 1,725 | ||||||||||||||||||
| Manufacturing | 48,683 | 2,260 | 5,420 | 116 | 56,479 | 3,184 | ||||||||||||||||||
| Construction | 15,214 | 615 | 928 | 63 | 16,820 | 1,452 | ||||||||||||||||||
Finance (3) | 201,779 | 107,116 | 411,017 | 12,118 | 732,030 | 372,343 | ||||||||||||||||||
| Service industries and business activities | 154,657 | 15,403 | 12,025 | 795 | 182,880 | 5,824 | ||||||||||||||||||
| Agriculture, forestry and fishing | 8,665 | 282 | 65 | 9 | 9,021 | 76 | ||||||||||||||||||
| Property | 103,013 | 4,509 | 4,517 | 108 | 112,147 | 1,114 | ||||||||||||||||||
| Individuals: | ||||||||||||||||||||||||
| Home mortgages | 230,412 | 729 | 241 | — | 231,382 | 7 | ||||||||||||||||||
| Other | 43,341 | 1 | 212 | 40 | 43,594 | 61 | ||||||||||||||||||
| Finance lease and instalment credit | 20,103 | �� | 306 | 16 | — | 20,425 | 39 | |||||||||||||||||
| Interest accruals | 2,556 | 1,921 | — | — | 4,477 | — | ||||||||||||||||||
| 837,429 | 288,260 | 441,454 | 13,454 | 1,580,597 | 385,825 | |||||||||||||||||||
For notes refer to the following page.
105
Balance sheet analysis continued
Industry risk – geographical analysis continued
| 2008 | Loans and advances to banks and customers £m | Securities £m | Derivatives £m | Other (1) £m | Total £m | Netting and off-set(2) £m | ||||||||||||||||||
| UK | 538,917 | 135,668 | 569,098 | 8,059 | 1,251,742 | 499,426 | ||||||||||||||||||
| US | 132,107 | 64,476 | 366,113 | 6,829 | 569,525 | 326,473 | ||||||||||||||||||
| Europe | 293,498 | 71,293 | 12,209 | 3,718 | 380,718 | 843 | ||||||||||||||||||
| RoW | 59,413 | 22,652 | 45,139 | 552 | 127,756 | 31,926 | ||||||||||||||||||
| 1,023,935 | 294,089 | 992,559 | 19,158 | 2,329,741 | 858,668 | |||||||||||||||||||
| Central and local government | 15,712 | 102,293 | 6,382 | 197 | 124,584 | 1,987 | ||||||||||||||||||
| Manufacturing | 75,489 | 2,136 | 14,160 | 308 | 92,093 | 6,498 | ||||||||||||||||||
| Construction | 20,907 | 214 | 984 | 32 | 22,137 | 1,488 | ||||||||||||||||||
| Finance | 285,550 | 160,842 | 939,154 | 16,039 | 1,401,585 | 836,428 | ||||||||||||||||||
| Service industries and business activities | 190,537 | 24,355 | 25,933 | 2,470 | 243,295 | 10,858 | ||||||||||||||||||
| Agriculture, forestry and fishing | 9,055 | 144 | 45 | 16 | 9,260 | 87 | ||||||||||||||||||
| Property | 106,633 | 2,512 | 5,586 | 71 | 114,802 | 1,067 | ||||||||||||||||||
| Individuals: | ||||||||||||||||||||||||
| Home mortgages | 234,598 | 50 | 18 | — | 234,666 | 52 | ||||||||||||||||||
| Other | 55,960 | 279 | 272 | 25 | 56,536 | 84 | ||||||||||||||||||
| Finance lease and instalment credit | 22,355 | 23 | 25 | — | 22,403 | 119 | ||||||||||||||||||
| Interest accruals | 7,139 | 1,241 | — | — | 8,380 | — | ||||||||||||||||||
| 1,023,935 | 294,089 | 992,559 | 19,158 | 2,329,741 | 858,668 | |||||||||||||||||||
| 2007 | ||||||||||||||||||||||||
| UK | 595,347 | 161,873 | 254,797 | 12,746 | 1,024,763 | 202,503 | ||||||||||||||||||
| US | 143,805 | 69,921 | 9,708 | 3,308 | 226,742 | 23,059 | ||||||||||||||||||
| Europe | 232,049 | 78,044 | 7,322 | 157 | 317,572 | 109,071 | ||||||||||||||||||
| RoW | 83,249 | 37,918 | 5,575 | 1,255 | 127,997 | 6,166 | ||||||||||||||||||
| 1,054,450 | 347,756 | 277,402 | 17,466 | 1,697,074 | 340,799 | |||||||||||||||||||
| Central and local government | 10,077 | 103,205 | 4,148 | 212 | 117,642 | 1,540 | ||||||||||||||||||
| Manufacturing | 51,719 | 3,418 | 6,010 | — | 61,147 | 4,259 | ||||||||||||||||||
| Construction | 18,760 | 631 | 757 | — | 20,148 | 1,685 | ||||||||||||||||||
Finance (3) | 442,532 | 204,587 | 259,294 | 17,178 | 923,591 | 299,705 | ||||||||||||||||||
| Service industries and business activities | 151,822 | 21,356 | 5,787 | 1 | 178,966 | 31,456 | ||||||||||||||||||
| Agriculture, forestry and fishing | 9,181 | 72 | 100 | — | 9,353 | 104 | ||||||||||||||||||
| Property | 88,837 | 5,013 | 1,005 | 7 | 94,862 | 2,033 | ||||||||||||||||||
| Individuals: | ||||||||||||||||||||||||
| Home mortgages | 185,095 | 1,813 | 5 | — | 186,913 | — | ||||||||||||||||||
| Other | 68,179 | 4,432 | 15 | 23 | 72,649 | 10 | ||||||||||||||||||
| Finance lease and instalment credit | 19,498 | 131 | 281 | 45 | 19,955 | 5 | ||||||||||||||||||
| Interest accruals | 8,750 | 3,098 | — | — | 11,848 | 2 | ||||||||||||||||||
| 1,054,450 | 347,756 | 277,402 | 17,466 | 1,697,074 | 340,799 | |||||||||||||||||||
Notes:
| (1) | Includes settlement balances of £12,033 million at 31 December 2009 (2008 – £17,832 million; 2007 – £16,589 million). |
| (2) | This column shows the amount by which the Group’s credit risk exposure is reduced through arrangements, such as master netting agreements, which give the Group a legal right to set-off the financial asset against a financial liability due to the same counterparty. In addition, the Group holds collateral in respect of individual loans and advances to banks and customers. This collateral includes mortgages over property (both personal and commercial); charges over business assets such as plant, inventories and trade debtors; and guarantees of lending from parties other than the borrower. The Group obtains collateral in the form of securities in reverse repurchase agreements. Cash and securities are received as collateral in respect of derivative transactions. |
| (3) | Loans made by the Group’s consolidated conduits to asset owning companies are included within finance. |
106
Business review continued
Funding and liquidity risk
All the disclosures in this section (pages 107 to 113) are audited unless indicated otherwise with an asterisk (*).
The Group’s liquidity policy is designed to ensure that the Group can at all times meet its obligations as they fall due.
Liquidity management within the Group addresses the overall balance sheet structure and the control, within prudent limits, of risk arising from the mismatch of maturities across the balance sheet and from exposure to undrawn commitments and other contingent obligations.
Following a difficult first quarter of 2009, most indicators of stress in financial markets are close to or better than in late 2008. Liquidity conditions in money and debt markets have improved significantly since the beginning of the second quarter of 2009. Contributing to the improvement has been a combination of ongoing central bank and other official liquidity support schemes, guarantee schemes and rate cuts. Signs of underlying macroeconomic trends such as stabilisation of the UK economy, also helped to sustain a recovery in debt markets.
Liquidity risk framework and governance
The Group has an approved risk appetite supported by explicit targets and metrics to control the size and extent of both short-term and long-term liquidity risk. These metrics are reviewed by the Board and Group Asset and Liability Management Committee (GALCO) on a regular basis. The Group uses stress tests to refine and update the risk appetite in light of changing conditions.
The GALCO, chaired by the Group Finance Director, has the responsibility to set Group policy and ensure that it is cascaded and communicated to the business divisions. Group Treasury is the functional area with responsibility for monitoring and control of the Group's funding and liquidity positions.
Group Treasury is supported by a governance process that includes a Liquidity Risk Forum comprising functional areas across the organisation that are responsible for liquidity management, including monitoring through divisional and regional asset and liability committees.
The Group uses funds transfer pricing to ensure the costs of liquidity as well as funding are integrated into the business decision making process.
The Group continues to improve and augment funding and liquidity risk management practices in light of experience of the market over the last two years and of emerging regulatory and industry standards such as the FSA policy statement on strengthening liquidity standards.
Structural management
The Group regularly evaluates its structural liquidity risk and applies a variety of balance sheet management and term funding strategies to maintain this risk within its policy parameters. The degree of maturity mismatch within the overall long-term structure of the Group’s assets and liabilities is managed within internal policy guidelines, aimed at ensuring term asset commitments are funded on an economic basis over their life. In managing its overall term structure, the Group analyses and takes into account the effect of retail and corporate customer behaviour on actual asset and liability maturities where they differ materially from the underlying contractual maturities.
The Group targets diversification in its funding sources to reduce funding risk. A key source of funds for the Group is its core customer deposits gathered by its retail banking, private client, corporate and small and medium enterprises franchises. The Group’s multi-brand offering and strong client focus is a key part of the funding strategy and continues to benefit the Group’s funding position.
The Group also accesses the wholesale funding market to provide additional flexibility in funding sources. The Group has actively sought to manage its liquidity position through increasing the duration of short-term wholesale funding, continued diversification of wholesale debt investors and depositors, supplemented by long-term issuance, government guaranteed debt, and a programme of ensuring that assets held are eligible as collateral to access central bank liquidity schemes.
Cash flow management
The short-term maturity structure of the Group’s assets and liabilities is managed daily to ensure that all material or potential cash flows, undrawn commitments and other contingent obligations can be met. The primary focus of the daily management activity is to ensure access to sufficient liquidity to meet cash flow obligations within key time horizons, including out to one month ahead and FSA target horizons such as 90 days.
Potential sources of liquidity include cash inflows from maturing assets, new borrowings or the sale of various debt securities held. Short-term liquidity risk is generally managed on a consolidated basis with liquidity mismatch limits in place for subsidiaries and non-UK branches which have material local treasury activities, thereby assuring that the daily maintenance of the Group’s overall liquidity risk position is not compromised.
Volume management
The Group also actively monitors and manages future business volumes to assess funding and liquidity requirements and ensure that the Group operates within the risk appetite and metrics set by the Board. This includes management of undrawn commitments, conduits and liquidity facilities within acceptable levels.
Liquidity reserves
The Group has built up a diversified stock of highly marketable liquid assets including highly rated central government debt that can be used as a buffer against unforeseen impacts on cash flow or in stressed environments. The makeup of this portfolio of assets is sub-divided into tiers on the basis of asset liquidity, with haircuts applied to ensure that realistic liquidation values are used in key metrics. This portfolio includes a centrally held buffer against severe liquidity stresses and locally held buffers to meet self sufficiency needs.
107
Business review
Risk, capital and liquidity management
Funding and liquidity risk continued
Stress testing
The Group performs stress tests to simulate how events may impact its funding and liquidity capabilities. Such tests assist in the planning of the overall balance sheet structure, help define suitable limits for control of the risk arising from the mismatch of maturities across the balance sheet and from undrawn commitments and other contingent obligations, and feed into the risk appetite and contingency funding plan. The form and content of stress tests are updated where required as market conditions evolve. These stresses include the following scenarios:
• | Idiosyncratic stress: an unforeseen, name-specific, liquidity stress, with the initial short-term period of stress lasting for at least two weeks; |
• | Market stress: an unforeseen, market-wide liquidity stress of three months duration; |
• | Idiosyncratic and market stress: a combination of idiosyncratic and market stress; |
• | Rating downgrade: one and two notch long-term credit rating downgrade scenarios; and |
• | Daily market lockout: no access to unsecured funding and no funding rollovers are possible. |
Contingency planning
Contingency funding plans have been developed which incorporate early warning indicators to monitor market conditions. The Group reviews its contingency funding plans in the light of evolving market conditions and stress test results. The contingency funding plans cover: the available sources of contingent funding to supplement cash flow shortages; the lead times to obtain such funding; the roles and responsibilities of those involved in the contingency plans; the communication and escalation requirements when early warning indicators signal deteriorating market conditions; and the ability and circumstances within which the Group accesses central bank liquidity.
Monitoring
Liquidity risk is constantly monitored to evaluate the Group’s position having regard to its risk appetite and key metrics. Daily, weekly and monthly monitoring and control processes are in place, which allow management to take appropriate action. Actions taken to improve the liquidity risk include a focus on improving the loan to deposit ratio, issuing longer-term wholesale funding, both guaranteed and unguaranteed, and the size of the conduit commitments. Metrics include, but are not limited to;
Wholesale funding > one year: As the wholesale funding markets have improved over the course of 2009 the Group has been better able to manage both its short and longer-term funding requirements and has significantly reduced its reliance on central bank funding. In 2009, the Group issued £21 billion of public, private and structured unguaranteed debt securities with a maturity greater than one year including issuances with maturities of ten years and five years of £3 billion and £2 billion respectively. To provide protection from liquidity risk in these markets the Group targets a ratio of wholesale funding greater than one year. The proportion of outstanding debt instruments issued with a remaining maturity of greater than 12 months has increased from 45% at 31 December 2008 to 50% at 31 December 2009, reflecting a lengthening of the maturity profile of debt issuance over the period. The Group is also targeting an absolute funding reliance (unsecured wholesale funding with a residual maturity of less than one year) of less than £150 billion by 2013. The 2013 target can also be segmented further into bank deposits of less than £65 billion and other unsecured wholesale funding of less than £85 billion. The reliance on wholesale funding has improved from £343 billion at 31 December 2008 to £249 billion at December 2009 (and this figure includes £109 billion of bank deposits).
In common with other UK banks, the Group has benefited from the UK Government’s scheme to guarantee debt issuance. At 31 December 2009 the Group had debt securities in issue amounting to £52 billion (2008 – £32 billion), which is approximately 38% of the total UK Government guaranteed debt.
Loan to deposit ratio: The Group monitors the loan to deposit ratio as a key metric. This ratio has decreased from 118% at 31 December 2008 to 104% at 31 December 2009 for Core and from 151% at 31 December 2008 to 134% at 31 December 2009 for the Group. The Group has a target of 100% for 2013. The gap between customer loans and customer deposits (excluding repos) narrowed by £91 billion from £233 billion at 31 December 2008 to £142 billion at 31 December 2009.

108
Business review continued
Funding and liquidity risk continued
Monitoring continued
Undrawn commitments: The Group has been actively managing down the amount of undrawn commitments that it is exposed to. Undrawn commitments decreased from £349 billion at 31 December 2008 to £289 billion at 31 December 2009.
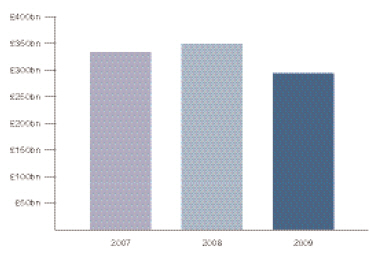
Repo Agreements: At 31 December 2009 the Group had £68 billion of customer secured funding and £38 billion of bank secured funding, which includes borrowing using central bank funding schemes. With markets continuing to stabilise through the course of 2009, the Group has significantly reduced its reliance on secured funding from central bank liquidity schemes.
Liquidity reserves: The total stock of liquid assets has increased by £81 billion during 2009 from £90 billion at 31 December 2008 to £171 billion at 31 December 2009; this reflects the injection of £25.5 billion of B shares at the end of December 2009 provided as treasury bills and cash. The Group is targeting a liquidity pool of £150 billion by 2013. The table below shows the breakdown of these assets. In addition to available liquid assets, the Group has a pool of unencumbered assets that are available for securitisation to raise funds if and when required.
The types of assets which can be used in securitisation include lending assets, and the Group benefits from not having encumbered significant amounts of lending assets historically.
Conduit commitments: The Group has taken additional measures to improve the balance sheet structure. One area of focus has been reducing the size of the multi-seller conduits business, which relies upon funding assets through the issuance of short term asset-backed commercial paper. Total facilities have declined by £17.9 billion to £25.0 billion at 31 December 2009. This has reduced the liquidity risk to the Group through the commitments provided for this type of business.

| 2009 | 2008 | |||||||
| Liquidity reserves | £m | £m | ||||||
| Government securities | 57,407 | 27,303 | ||||||
| Cash and central bank balances | 51,500 | 11,830 | ||||||
Unencumbered collateral (1) | 42,055 | 30,054 | ||||||
| Other liquid assets | 19,699 | 20,647 | ||||||
| Total liquidity reserve | 170,661 | 89,834 | ||||||
Note:
| (1) | Includes secured assets which are eligible for discounting at central banks. |
Funding profile
The contractual maturity of on balance sheet assets and liabilities, shown in the tables overleaf, highlight the maturity transformation which underpins the role of banks to lend longer-term but funded predominantly by short-term liabilities such as customer deposits. This is achieved through the diversified funding franchise of the Group across an extensive retail, wealth and SME customer base, and across a wide geographic network. In practice, the behavioural profile of many assets and liabilities exhibit greater stability and longer maturity than the contractual maturity. The Group models the behavioural maturity of liabilities so that it can target a diversified and stable funding base.
109
Business review
Risk, capital and liquidity management
Funding and liquidity risk continued
Funding profile continued
The table below analyses the contractual undiscounted cash flows receivable and payable up to a period of twenty years including future receipts and payments of interest of the on balance sheet assets by contractual maturity.
| 0-3 months | 3-12 months | 1-3 years | 3-5 years | 5-10 years | 10-20 years | |||||||||||||||||||
| 2009 | £m | £m | £m | £m | £m | £m | ||||||||||||||||||
| Assets by contractual maturity | ||||||||||||||||||||||||
| Cash and balances at central banks | 52,239 | — | — | 1 | 25 | — | ||||||||||||||||||
| Loans and advances to banks | 42,615 | 1,757 | 966 | 282 | 868 | 71 | ||||||||||||||||||
| Debt securities | 17,581 | 14,484 | 29,675 | 26,788 | 52,104 | 30,335 | ||||||||||||||||||
| Settlement balances | 12,020 | 6 | 1 | — | 8 | 1 | ||||||||||||||||||
| Other financial assets | 265 | 215 | 402 | 127 | 421 | — | ||||||||||||||||||
| Total maturing assets | 124,720 | 16,462 | 31,044 | 27,198 | 53,426 | 30,407 | ||||||||||||||||||
| Loans and advances to customers | 126,238 | 65,946 | 130,323 | 101,984 | 180,595 | 202,809 | ||||||||||||||||||
| Derivatives held for hedging | 488 | 1,547 | 3,049 | 1,076 | 751 | 10 | ||||||||||||||||||
| Total assets | 251,446 | 83,955 | 164,416 | 130,258 | 234,772 | 233,226 | ||||||||||||||||||
Liabilities by contractual maturity | ||||||||||||||||||||||||
| Deposits by banks | 65,966 | 15,541 | 3,934 | 2,301 | 632 | 12 | ||||||||||||||||||
| Debt securities in issue | 100,220 | 49,300 | 56,869 | 25,915 | 27,326 | 3,819 | ||||||||||||||||||
| Subordinated liabilities | 1,929 | 1,892 | 3,654 | 4,963 | 20,157 | 6,105 | ||||||||||||||||||
| Settlement balances and other liabilities | 12,048 | 100 | 139 | 104 | 239 | 83 | ||||||||||||||||||
| Total maturing liabilities | 180,163 | 66,833 | 64,596 | 33,283 | 48,354 | 10,019 | ||||||||||||||||||
| Customer accounts | 521,400 | 15,619 | 5,944 | 4,221 | 8,490 | 4,392 | ||||||||||||||||||
| Derivatives held for hedging | 660 | 1,566 | 3,232 | 1,264 | 1,674 | 1,508 | ||||||||||||||||||
| Total liabilities | 702,223 | 84,018 | 73,772 | 38,768 | 58,518 | 15,919 | ||||||||||||||||||
Maturity gap | (55,443 | ) | (50,371 | ) | (33,552 | ) | (6,085 | ) | 5,072 | 20,388 | ||||||||||||||
| Cumulative maturity gap | (55,443 | ) | (105,814 | ) | (139,366 | ) | (145,451 | ) | (140,379 | ) | (119,991 | ) | ||||||||||||
| Guarantees and commitments notional amount | ||||||||||||||||||||||||
Guarantees (1) | 39,952 | — | — | — | — | — | ||||||||||||||||||
Commitments (2) | 291,634 | — | — | — | — | — | ||||||||||||||||||
2008 | ||||||||||||||||||||||||
| Assets by contractual maturity | ||||||||||||||||||||||||
| Cash and balances at central banks | 12,333 | 25 | — | — | 2 | 29 | ||||||||||||||||||
| Loans and advances to banks | 61,630 | 19,369 | 2,673 | 921 | 111 | 70 | ||||||||||||||||||
| Debt securities | 26,006 | 12,895 | 24,629 | 23,927 | 57,846 | 24,535 | ||||||||||||||||||
| Settlement balances | 17,830 | — | — | — | 2 | — | ||||||||||||||||||
| Other financial assets | 621 | 193 | 58 | 111 | 343 | — | ||||||||||||||||||
| Total maturing assets | 118,420 | 32,482 | 27,360 | 24,959 | 58,304 | 24,634 | ||||||||||||||||||
| Loans and advances to customers | 195,553 | 81,054 | 138,378 | 125,621 | 160,271 | 152,084 | ||||||||||||||||||
| Derivatives held for hedging | 266 | 1,796 | 2,281 | 1,359 | 1,517 | 649 | ||||||||||||||||||
| Total assets | 314,239 | 115,332 | 168,019 | 151,939 | 220,092 | 177,367 | ||||||||||||||||||
Liabilities by contractual maturity | ||||||||||||||||||||||||
| Deposits by banks | 154,614 | 14,347 | 3,345 | 2,754 | 2,048 | 34 | ||||||||||||||||||
| Debt securities in issue | 131,714 | 48,652 | 40,067 | 38,223 | 38,667 | 5,626 | ||||||||||||||||||
| Subordinated liabilities | 1,753 | 4,271 | 6,824 | 5,793 | 24,503 | 13,030 | ||||||||||||||||||
| Settlement balances and other liabilities | 13,351 | 5 | 12 | 6 | 10 | 6 | ||||||||||||||||||
| Total maturing liabilities | 301,432 | 67,275 | 50,248 | 46,776 | 65,228 | 18,696 | ||||||||||||||||||
| Customer accounts | 523,268 | 33,450 | 6,577 | 6,337 | 7,298 | 5,319 | ||||||||||||||||||
| Derivatives held for hedging | 394 | 2,216 | 2,543 | 1,334 | 2,682 | 1,373 | ||||||||||||||||||
| Total liabilities | 825,094 | 102,941 | 59,368 | 54,447 | 75,208 | 25,388 | ||||||||||||||||||
Maturity gap | (183,012 | ) | (34,793 | ) | (22,888 | ) | (21,817 | ) | (6,924 | ) | 5,938 | |||||||||||||
| Cumulative maturity gap | (183,012 | ) | (217,805 | ) | (240,693 | ) | (262,510 | ) | (269,434 | ) | (263,496 | ) | ||||||||||||
Notes:
| (1) | The Group is only called upon to satisfy a guarantee when the guaranteed party fails to meet its obligations. The Group expects most guarantees it provides to expire unused. |
| (2) | The Group has given commitments to provide funds to customers under undrawn formal facilities, credit lines and other commitments to lend subject to certain conditions being met by the counterparty. The Group does not expect all facilities to be drawn, and some may lapse before drawdown. |
110
Business review continued
Funding and liquidity risk continued
Funding profile continued
The tables on the previous page show the timing of cash inflows and outflows to settle financial assets and liabilities. They have been prepared on the following basis:
Financial assets have been reflected in the time band of the latest date on which they could be repaid, unless earlier repayment can be demanded by the Group. Financial liabilities are included at the earliest date on which the counterparty can require repayment regardless of whether or not such early repayment results in a penalty. If the repayment of a financial asset or liability is triggered by, or is subject to, specific criteria, such as market price hurdles being reached, the asset is included in the latest date on which it can repay regardless of early repayment, the liability is included at the earliest possible date that the conditions could be fulfilled without considering the probability of the conditions being met.
For example, if a structured note is automatically prepaid when an equity index exceeds a certain level, the cash outflow will be included in the less than three months period whatever the level of the index at the year end. The settlement date of debt securities in issue, issued by certain securitisation vehicles consolidated by the Group, depends on when cash-flows are received from the securitised assets. Where these assets are prepayable, the timing of the cash-outflow relating to securities assumes that each asset will be prepaid at the earliest possible date. As the repayment of assets and liabilities are linked, the repayment of assets in securitisations are shown on the earliest date that the asset can be prepaid as this is the basis used for liabilities.
Assets and liabilities with a contractual maturity of greater than twenty years – the principal amounts of financial assets and liabilities that are repayable after twenty years or where the counterparty has no right to repayment of the principal are excluded from the table, as are interest payments after twenty years.
Held-for-trading assets and liabilities – held-for-trading assets and liabilities amounting to £651 billion (assets) and £568 billion (liabilities) (2008 – £1,227 billion assets, £1,147 billion liabilities) have been excluded from the table in view of their short term nature.
Wholesale funding breakdown
The table below shows the composition of the sources of wholesale funding of the Group before RFS minority interest. The Group has implemented its funding strategy of reducing its reliance on short-term wholesale funding. Deposits by banks have decreased by £63 billion to £116 billion; comprising 14.3% of total funding sources at 31 December 2009, down from 18.8% at 31 December 2008. Short-term debt securities such as commercial paper and certificates of deposits in issue have also reduced by £41 billion to £103 billion at 31 December 2009 from £144 billion at 31 December 2008.
| 2009 | 2008 | |||||||||||||||
| £m | % | £m | % | |||||||||||||
Deposits by banks (1) | 115,642 | 14.3 | 178,943 | 18.8 | ||||||||||||
| Debt securities in issue: | ||||||||||||||||
| – Commercial paper | 44,307 | 5.5 | 69,891 | 7.3 | ||||||||||||
| – Certificates of deposits | 58,195 | 7.2 | 73,925 | 7.8 | ||||||||||||
| – Medium term notes and other bonds | 125,800 | 15.6 | 108,529 | 11.4 | ||||||||||||
| – Securitisations | 18,027 | 2.2 | 17,113 | 1.8 | ||||||||||||
| 246,329 | 30.5 | 269,458 | 28.3 | |||||||||||||
| Subordinated debt | 31,538 | 3.9 | 43,678 | 4.6 | ||||||||||||
| Total wholesale funding | 393,509 | 48.7 | 492,079 | 51.7 | ||||||||||||
Customer deposits (1) | 414,251 | 51.3 | 460,318 | 48.3 | ||||||||||||
| 807,760 | 100.0 | 952,397 | 100.0 | |||||||||||||
Note:
| (1) | Excluding repurchase agreements and stock lending. |
The total level of the Group’s wholesale funding has reduced year on year by £99 billion with the majority of the reduction attributable to a reduced reliance on inter-bank funding.
111
Business review
Risk, capital and liquidity management
Funding and liquidity risk continued
Wholesale funding breakdown continued
The table below shows the maturity profile of the Group’s debt securities in issue and subordinated debt. The composition of the profile reflects the increased proportion of the Group’s debt securities in issue of greater than 1 year maturity. Debt securities with a remaining maturity of less than 1 year has reduced by £33 billion to £139 billion at 31 December 2009 (2008 – £172 billion). The proportion of debt securities in issue with remaining maturity greater than 1 year has increased from 45% at 31 December 2008 to 50% at 31 December 2009.
The table below shows the maturity profile of the Group’s debt securities in issue and subordinated debt. The composition of the profile reflects the increased proportion of the Group’s debt securities in issue of greater than 1 year maturity. Debt securities with a remaining maturity of less than 1 year has reduced by £33 billion to £139 billion at 31 December 2009 (2008 – £172 billion). The proportion of debt securities in issue with remaining maturity greater than 1 year has increased from 45% at 31 December 2008 to 50% at 31 December 2009.
| 2009 | 2008 | |||||||||||||||||||||||
Debt securitiesin issue £m | Subordinated debt£m | Total £m | % | Total £m | % | |||||||||||||||||||
| Less than one year | 136,901 | 2,144 | 139,045 | 50.0 | 172,234 | 55.0 | ||||||||||||||||||
| 1-5 years | 70,437 | 4,235 | 74,672 | 26.9 | 61,842 | 19.8 | ||||||||||||||||||
| More than 5 years | 38,991 | 25,159 | 64,150 | 23.1 | 79,060 | 25.2 | ||||||||||||||||||
| 246,329 | 31,538 | 277,867 | 100.0 | 313,136 | 100.0 | |||||||||||||||||||
Wholesale funding maturity profile
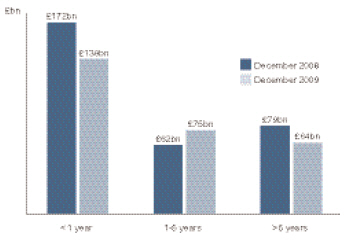
Outlook for 2010*
Whilst there have been improvements in the state of the global economy over the course of 2009, the outlook for 2010 remains uncertain. In line with meeting the objectives of the strategic plan, the Group is actively focusing on closing the customer funding gap, continuing to exit Non-Core businesses and focusing on reducing undrawn and contingent commitments. This will reduce the absolute need for wholesale funding with the Group targeting £150 billion by 2013. In addition, the Group will continue to make progress in terming out its remaining wholesale funding. The Group will continue to reduce reliance on government supported schemes and be governed by the state of the markets and economies in which it operates. These strategies will ensure that the Group will be more resilient to any further disruptions in the market and will be better placed to take advantage of favourable trading conditions as they return.
Regulatory environment*
The Group operates in multiple jurisdictions across the globe and is subject to a number of regulatory regimes. The Group’s lead regulator is the UK FSA, with other authorities such as the De Nederlandsche Bank and the US Federal Reserve Bank playing key roles. The liquidity framework applied by the FSA is the Sterling Stock regime. In line with the FSA policy statement PS09/16, the Group will be subject to a new liquidity risk regulatory framework in the future. The Group has been working towards this new framework and will meet the requirements as they come into force.
In the US the Group is required to meet the liquidity requirements set out by all relevant regulatory authorities, including the Federal Reserve Bank, Office of the Comptroller of the Currency, Federal Deposit Insurance Corporation and Financial Industry Regulatory Authority. In the Netherlands, ABN AMRO is subject the De Nederlandsche Bank liquidity regulation regime.
* unaudited
112
Business review continued
Funding and liquidity risk continued
Net stable funding ratio*
The net stable funding ratio shown below is assessed using the proposed Basel measure. This measure seeks to show the proportion of structural term assets which are funded by stable funding including customer deposits, long-term wholesale funding, and equity. Through the course of 2009, the measure has improved from 79% at 31 December 2008 to 90% at 31 December 2009. Over time this will be reviewed as proposals are developed and industry standards implemented.
| 2009 | 2008 | |||||||||||||||||||
ASF (1) | ASF (1) | Weighting | ||||||||||||||||||
| Structural term liabilities | £bn | £bn | £bn | £bn | % | |||||||||||||||
| Equity | 80 | 80 | 62 | 62 | 100 | |||||||||||||||
| Wholesale lending > 1 year | 144 | 144 | 149 | 149 | 100 | |||||||||||||||
| Wholesale lending < 1 year | 249 | — | 343 | — | — | |||||||||||||||
| Derivatives | 422 | — | 969 | — | — | |||||||||||||||
| Repos | 106 | — | 142 | — | — | |||||||||||||||
| Customer deposits | 415 | 353 | 460 | 391 | 85 | |||||||||||||||
| Others (deferred tax, insurance liabilities, etc) | 106 | — | 94 | — | — | |||||||||||||||
| Total liabilities and equity | 1,522 | 577 | 2,219 | 602 | ||||||||||||||||
| Structural term assets | ||||||||||||||||||||
| Cash | 52 | — | 12 | — | — | |||||||||||||||
| Inter bank lending | 49 | — | 71 | — | — | |||||||||||||||
| Government and corporate bonds | 249 | 50 | 253 | 51 | 20 | |||||||||||||||
| Derivatives | 438 | — | 991 | — | — | |||||||||||||||
| Reverse repos | 76 | — | 98 | — | — | |||||||||||||||
| Advances < 1 year | 139 | 69 | 173 | 87 | 50 | |||||||||||||||
| Advances >1 year | 416 | 416 | 518 | 518 | 100 | |||||||||||||||
| Others (prepayments, accrued income, deferred taxation) | 103 | 103 | 103 | 103 | 100 | |||||||||||||||
| 1,522 | 638 | 2,219 | 759 | |||||||||||||||||
| Net stable funding ratio | 90 | % | 79 | % | ||||||||||||||||
Note:
| (1) | ASF means available stable funding. |
* unaudited
113
Business review
Risk, capital and liquidity management
Market risk
All the disclosures in this section (pages 114 to 121) are audited unless indicated otherwise with an asterisk (*).
Market risk arises from changes in interest rates, foreign currency, credit spread, equity prices and risk related factors such as market volatilities. The Group manages market risk centrally within its trading and non-trading portfolios through a comprehensive market risk management framework. This framework includes limits based on, but not limited to VaR, scenario analysis, position and sensitivity analyses.
Measurement
At the Group level, the risk appetite is expressed in the form of a combination of VaR, sensitivity and scenario limits. VaR is a technique that produces estimates of the potential change in the market value of a portfolio over a specified time horizon at given confidence levels. For internal risk management purposes, the Group’s VaR assumes a time horizon of one trading day and in June 2009 the Group changed its VaR confidence level from 95% to 99% as it considers this provides greater clarity in respect of more severe potential economic outcomes. The Group’s VAR model is based on a historical simulation model utilising data from the previous two years trading results.
The Group continued to update and enhance its market risk management framework during 2009. In addition to the move to a VaR based on a 99% confidence level, the Group has improved and strengthened its market risk limit framework increasing the transparency of market risk taken across the Group’s businesses in both the trading and non-trading portfolios.
The Group’s market risk appetite is defined within this limit framework which is cascaded down through legal entity, division, business and ultimately trader level market risk limits.
The VaR disclosure is broken down into trading and non-trading, where trading VaR relates to the main trading activities of the Group and non-trading reflects the VaR associated with reclassified assets, money market business and the management of internal funds flow within the Group’s businesses.
As part of the strategic review, the designation of assets between Core and Non-Core divisions was completed during 2009. As the Non-Core division was not established until conclusion of the strategic review in the first quarter of 2009, constitution of the average, maximum and minimum VaR for Core and Non-Core has been prepared on a best efforts basis as these measures require daily data.
The Group calculates VaR using historical simulation models but does not make any assumption about the nature or type of underlying loss distribution other than implied by history. The methodology uses the previous 500 trading days of market data and calculates both general market risk (the risk due to movement in general market benchmarks) and idiosyncratic market risk (the risk due to movements in the value of securities by reference to specific issuers). The Group VaR should be interpreted in light of the limitations of the methodology used as follows:
• | Historical simulation VaR may not provide the best estimate of future market movements. It can only provide a prediction of the future based on events that occurred in the time series horizon. Therefore, events that are more severe than those in the historical data series cannot be predicted; |
• | VaR that uses a 99% confidence level does not reflect the extent of potential losses beyond that percentile; |
• | VaR that uses a one-day time horizon will not fully capture the profit and loss implications of positions that cannot be liquidated or hedged within one day; and |
• | The Group computes the VaR of trading portfolios at the close of business. Positions may change substantially during the course of the trading day and intra-day profit and losses will be incurred. |
A ‘Risks not in VaR’ framework has been developed to address those market risks not adequately captured by the market standard VaR methodology. Where risks are not included in the model, various non-VaR controls (for example, position monitoring, sensitivity limits, triggers or stress limits) are in place.
These limitations mean that the Group cannot guarantee that losses will not exceed the VaR.
Traded portfolios
The primary focus of the Group’s trading activities is client facilitation. The Group also undertakes activities within the Core division of the wholesale bank, built around clients in chosen markets, including:
• | Market making – quoting firm bid (buy) and offer (sell) prices with the intention of profiting from the spread between the quotes. |
• | Arbitrage – entering into offsetting positions in different, but closely related markets in order to profit from market imperfections. |
• | Proprietary activity – taking positions in financial instruments as principal in order to take advantage of anticipated market conditions. |
Financial instruments held in the Group’s trading portfolios include, but are not limited to: debt securities, loans, deposits, equities, securities sale and repurchase agreements and derivative financial instruments (futures, forwards, swaps and options).
The Group participates in exchange traded and over-the-counter (OTC) derivatives markets. The Group buys and sells financial instruments that are traded or cleared on an exchange, including interest rate swaps, futures and options. Holders of exchange traded instruments provide daily margins with cash or other security at the exchange, to which the holders look for ultimate settlement.
The Group also buys and sells financial instruments that are traded OTC, rather than on a recognised exchange. These instruments range from commoditised transactions in derivative markets, to trades where the specific terms are tailored to the requirements of the Group’s customers. In many cases, industry standard documentation is used, most commonly in the form of a master agreement, with individual transaction confirmations.
114
Business review continued
Market risk continued
Assets and liabilities in the trading book are measured at their fair value. Fair value is the amount at which the instrument could be exchanged in a current transaction between willing parties. The fair values are determined following IAS 39 guidance, which requires banks to use quoted market prices or valuation techniques (models) that make the maximum use of observable inputs. When marking to market using a model, the valuation methodologies are reviewed and approved by the market risk function. Group Risk provides an independent evaluation of the model for transactions deemed by the Group Model Product Review Committee (GMPRC) to be large, complex and/or innovative. Any profits or losses on the revaluation of positions are recognised in the daily profit and loss.
The VaR for the Group’s 2009 trading portfolios segregated by type of market risk exposure is shown below.
Daily VaR graph*
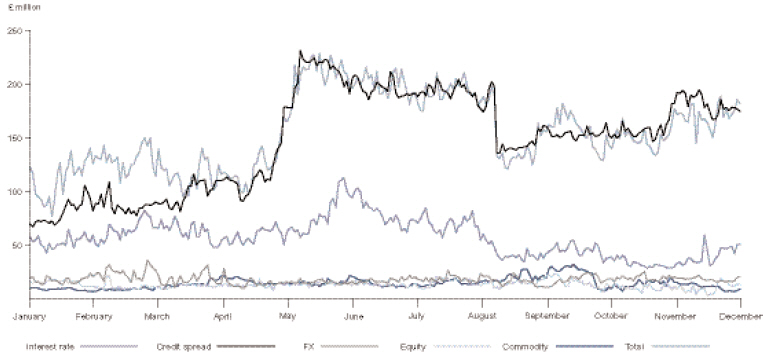
Note:
| (1) | The traded market risk VaR excludes super senior tranches of asset backed CDOs and credit derivative product company exposures. |
Key points
• | The average total VaR utilisation increased in 2009 compared with 2008 largely as a result of increased market volatility experienced since the credit crisis began in August 2007 being more fully incorporated into the two year time series used by the VaR model. This volatility had a marked impact on the credit spread VaR. This increase is partially off-set by a reduction in trading book exposure throughout the period, due to a reduction in the size of the inventory held on the balance sheet as a result of sales, reclassification of assets to the non-trading book and write-downs. |
• | The credit spread VaR increased significantly during May 2009 due to the purchasing of additional protection against the risk of counterparty failure on CDPCs exposures. As this counterparty risk is itself not in VaR these hedges have the effect of increasing the reported VaR. |
• | The credit spread VaR decreased significantly at the end of August 2009 due to the positions relating to CDPCs being capitalised under the Pillar II approach and hence excluded from the VaR measure from that date. |
* unaudited
115
Business review
Risk, capital and liquidity management
Market risk continued
Key points continued
• | The Counterparty Exposure Management (CEM) trading book exposure and the exposure of Core without CEM have been disclosed separately. CEM manages the OTC derivative counterparty credit risk in GBM, by actively controlling risk concentrations and reducing unwanted risk exposures. The hedging transactions CEM enters into are recorded in the trading book, and therefore contribute to the market risk VaR exposure of the Group. |
The counterparty exposures themselves are not captured in VaR for regulatory capital. In the interest of transparency CEM trading book exposure is disclosed separately.
• | The average total non-trading VaR utilisation was higher in 2009 at £207 million, compared with £15 million in 2008. This is primarily due to assets from the Group's now dissolved securitisation arbitrage conduit, which transferred from ABN AMRO to RBS, being included in the Group’s VaR measure from January 2009 and the increased market volatility being incorporated into the two year time series as previously noted. If both of these factors are excluded, the non-trading VaR would decrease to reflect actions taken through the course of the year to dynamically reduce the underlying risk sensitivity. |
| 2009 (99%ile) | 2008 (99%ile) | ||||||||||||||||||||||||||||||
Trading VaR Summary (2008 and 2009) | Average | Period end | Maximum | Minimum | Average | Period end | Maximum | Minimum | |||||||||||||||||||||||
| £m | £m | £m | £m | £m | £m | £m | £m | ||||||||||||||||||||||||
| Interest rate | 57.0 | 50.5 | 112.8 | 28.1 | 38.7 | 54.4 | 94.0 | 18.2 | |||||||||||||||||||||||
| Credit spread | 148.3 | 174.8 | 231.2 | 66.9 | 71.5 | 61.5 | 130.8 | 51.7 | |||||||||||||||||||||||
| Currency | 17.9 | 20.7 | 35.8 | 9.2 | 7.6 | 17.0 | 18.0 | 3.5 | |||||||||||||||||||||||
| Equity | 13.0 | 13.1 | 23.2 | 2.7 | 22.4 | 18.3 | 42.6 | 11.0 | |||||||||||||||||||||||
| Commodity | 14.3 | 8.9 | 32.1 | 6.5 | 9.9 | 10.0 | 25.8 | 0.2 | |||||||||||||||||||||||
| Diversification | — | (86.1 | ) | — | — | — | (52.4 | ) | — | — | |||||||||||||||||||||
| 155.2 | 181.9 | 229.0 | 76.8 | 82.3 | 108.8 | 155.7 | 49.3 | ||||||||||||||||||||||||
| Core | 101.5 | 127.3 | 137.8 | 54.8 | |||||||||||||||||||||||||||
| CEM | 29.7 | 38.6 | 41.3 | 11.5 | |||||||||||||||||||||||||||
| Core excluding CEM | 86.7 | 97.4 | 128.5 | 54.9 | |||||||||||||||||||||||||||
| Non-Core | 86.3 | 84.8 | 162.1 | 29.3 | |||||||||||||||||||||||||||
| 2007 (scaled to 99%ile) | 2007 (95%ile) | ||||||||||||||||||||||||||||||
| Trading VaR (2007) | Average | Period end | Maximum | Minimum | Average | Period end | Maximum | Minimum | |||||||||||||||||||||||
| £m | £m | £m | £m | £m | £m | £m | £m | ||||||||||||||||||||||||
| Interest rate | 17.7 | 21.2 | 30.9 | 10.8 | 12.5 | 15.0 | 21.8 | 7.6 | |||||||||||||||||||||||
| Credit spread | 26.6 | 59.3 | 63.9 | 17.8 | 18.8 | 41.9 | 45.2 | 12.6 | |||||||||||||||||||||||
| Currency | 3.7 | 4.2 | 9.8 | 1.6 | 2.6 | 3.0 | 6.9 | 1.1 | |||||||||||||||||||||||
| Equity | 7.6 | 19.8 | 31.1 | 2.0 | 5.4 | 14.0 | 22.0 | 1.4 | |||||||||||||||||||||||
| Commodity | 0.3 | 0.7 | 2.2 | — | 0.2 | 0.5 | 1.6 | — | |||||||||||||||||||||||
| Diversification | — | (40.6 | ) | — | — | — | (28.7 | ) | — | — | |||||||||||||||||||||
| 30.6 | 64.6 | 70.8 | 18.7 | 21.6 | 45.7 | 50.1 | 13.2 | ||||||||||||||||||||||||
| 2009 (99%ile) | 2008 (99%ile) | |||||||||||||||||||||||||||||||
| Non-trading VaR (2008 and 2009) | Average | Period end | Maximum | Minimum | Average | Period end | Maximum | Minimum | ||||||||||||||||||||||||
| £m | £m | £m | £m | £m | £m | £m | £m | |||||||||||||||||||||||||
| Interest rate | 15.5 | 16.5 | 26.1 | 9.5 | 10.6 | 24.4 | 32.9 | 5.2 | ||||||||||||||||||||||||
| Credit spread | 211.2 | 213.3 | 270.3 | 65.4 | 10.5 | 65.2 | 65.2 | 5.5 | ||||||||||||||||||||||||
| Currency | 1.4 | 0.6 | 7.0 | 0.2 | 0.6 | 2.2 | 5.7 | 0.1 | ||||||||||||||||||||||||
| Equity | 3.6 | 2.3 | 7.2 | 1.7 | 3.4 | 7.0 | 8.0 | 0.8 | ||||||||||||||||||||||||
| Diversification | — | (26.0 | ) | — | — | — | (22.7 | ) | — | — | ||||||||||||||||||||||
| 207.1 | 206.7 | 274.9 | 76.1 | 14.8 | 76.1 | 76.1 | 7.7 | |||||||||||||||||||||||||
| Core | 105.1 | 129.4 | 142.7 | 55.0 | ||||||||||||||||||||||||||||
| Non-Core | 112.6 | 87.6 | 145.3 | 20.2 | ||||||||||||||||||||||||||||
| 2007 (scaled to 99%ile) | 2007 (95%ile) | |||||||||||||||||||||||||||||||
| Non-trading VaR (2007) | Average | Period end | Maximum | Minimum | Average | Period end | Maximum | Minimum | ||||||||||||||||||||||||
| £m | £m | £m | £m | £m | £m | £m | £m | |||||||||||||||||||||||||
| Interest rate | 4.5 | 5.9 | 6.9 | 1.8 | 3.2 | 4.1 | 4.9 | 1.3 | ||||||||||||||||||||||||
| Credit spread | 2.5 | 6.3 | 7.3 | 0.5 | 1.8 | 4.5 | 5.1 | 0.4 | ||||||||||||||||||||||||
| Currency | 0.2 | 0.9 | 1.8 | — | 0.2 | 0.6 | 1.2 | — | ||||||||||||||||||||||||
| Equity | 0.1 | 0.9 | 1.1 | — | 0.1 | 0.6 | 0.8 | — | ||||||||||||||||||||||||
| Diversification | — | (6.1 | ) | — | — | — | (4.3 | ) | — | — | ||||||||||||||||||||||
| 5.2 | 7.9 | 9.1 | 1.9 | 3.7 | 5.5 | 6.4 | 1.3 | |||||||||||||||||||||||||
116
Business review continued
Market risk continued
The 2008 and 2009 data on trading VaR in the tables on the previous page excludes exposures to super-senior tranches of asset backed CDOs, as VaR does not produce an appropriate measure of risk for these exposures due to the illiquidity and opaqueness of the pricing of these instruments over an extended period. For these exposures, the maximum potential loss is equal to the aggregate net exposure, which was £910 million as at 31 December 2009.
The 2009 data in the tables on the previous page also excludes the exposures relating to CDPCs from the end of August 2009 when they were excluded from VaR and were capitalised under a Pillar II approach.
RBS Sempra Commodities LLP (Sempra), the commodities-marketing joint venture between RBS and Sempra Energy, was formed on 1 April 2008, and its trading risks were included in the disclosed VaR from that date. Sempra is designated as Non-Core in the 2009 data.
The trading and non-trading VaR for 2007 is shown on the basis it was previously disclosed at a 95% confidence level and using a normalised scaling factor to convert to 99% confidence level.
Non trading VaR in the tables on the previous page does not include structural interest rate risk which is covered on page 118.
Back-testing, stress testing and sensitivity analysis
The Group undertakes a programme of daily back-testing, which compares the actual profit or loss realised in trading activity to the VaR estimation. The results of the back-testing process are one of the methods by which the Group monitors the ongoing suitability of its VaR model.
The Group undertakes daily stress testing to identify the potential losses in excess of VaR. Stress testing is used to calculate a range of trading book exposures which result from exceptional, but plausible market events. Stress testing measures the impact of abnormal changes in market rates and prices on the fair value of the Group’s trading portfolios. The Group calculates historical stress tests and hypothetical stress tests.
Historical stress tests calculate the loss that would be generated if the market movements that occurred during historical market events were repeated. Hypothetical stress tests calculate the loss that would be generated if a specific set of adverse market movements were to occur.
Stress testing is also undertaken at key trading strategy level, for those strategies where the associated market risks are not adequately captured by VaR. Stress test exposures are discussed with senior management and are reported to GRC, ERF and the Board. Breaches in the Group’s market risk stress testing limits are monitored and reported.
In addition to VaR and stress testing, the Group calculates a wide range of sensitivity and position risk measures, for example interest rate ladders or option revaluation matrices. These measures provide valuable additional controls, often at individual desk or strategy level.
Model validation governance
Pricing models are developed and owned by the front office. Where pricing models are used as the basis of books and records valuations, they are all subject to independent review and sign-off. Models are assessed by GMPRC as having either immaterial or material model risk (valuation uncertainty arising from choice of modelling assumptions), the assessment being made on the basis of expert judgement.
Those models assessed by the GMPRC as having material model risk are prioritised for independent quantitative review. Independent quantitative review aims to quantify model risk (i.e. the impact of missing risk factors in the front office model or the possibility that we may be mismarking these products relative to other market participants who may be using an alternative model) by comparing model outputs against alternative independently developed models. The results of independent quantitative reviews are used by market risk to inform risk limits and by finance to inform reserves. Governance over this process is provided by GMPRC, a forum which brings together front office quantitative analysts, market risk, finance and QuaRC (Quantitative Research Centre, Group Risk’s independent quantitative model review function). Risk (market risk, incremental default risk, counterparty credit risk) models are developed both within business units and by Group functions. Risk models are also subject to independent review and sign-off. Meetings are held with the FSA every quarter to discuss the traded market risk, including changes in models, management, back testing results, other risks not included in the VaR framework and other model performance statistics.
Risk control
All divisions that are exposed to market risk in the course of their business are required to comply with the Group’s Market Risk Policy Standards (MRPS). The main risk management tools are delegated authorities, hard limits and discussion triggers, independent model valuation, a robust and efficient risk system and timely and accurate management information.
Limits form part of the dealing authorities and constitute one of the cornerstones of the market risk management framework. Upon notification of a limit breach, the appropriate body must take one of the following actions:
• | Instructions can be given to reduce positions so as to bring the Group within the agreed limits; |
• | A temporary increase in the limit can be granted to pursue an agreed short-term strategy; and |
• | A permanent increase in the limit can be granted if consistent with the strategy and supported by the business and Risk Management. |
Non-traded portfolios
Risks in non-traded portfolios mainly arise in retail and commercial banking assets and liabilities and financial investments designated as available-for-sale and held-to-maturity.
Group Treasury is responsible for setting and monitoring the adequacy and effectiveness of management, using a framework that identifies, measures, monitors and controls the underlying risk. GALCO approves the Group’s non-traded market risk appetite, expressed as statistical and non-statistical risk limits, which are delegated to the businesses responsible.
117
Business review
Risk, capital and liquidity management
Market risk continued
Non-traded portfolios continued
Various banking regulators review non-trading market risks as part of their regulatory oversight. As home country regulator, the FSA has responsibility for reviewing non-trading market risk at a Group consolidated level.
The Group is exposed to the following non-traded risks:
Interest Rate Risk in the Banking Book (IRRBB) represents exposures to instruments whose values vary with the level or volatility of interest rates. These instruments include, but are not limited to, loans, debt securities, equity shares, deposits, certificates of deposits, loan capital and derivatives. Hedging instruments used to mitigate these risks include related derivatives such as options, futures, forwards and swaps. Interest rate risk arises from the Group’s non-trading activities in four principal forms:
• | Re-pricing risk – arises from differences in the re-pricing terms of the Group’s assets and liabilities; |
• | Optionality – arises where a customer has an option to exit a deal early; |
• | Basis risk – arises, for example where liabilities, the interest on which is linked to LIBOR, is used to fund assets bearing interest linked to the base rate; and |
• | Yield curve risk – arises as a result of non-parallel changes in the yield curve. |
It is the Group’s policy to minimise the sensitivity to changes in interest rates in its retail and commercial businesses and, where interest rate risk is retained, to ensure that appropriate resources, measures and limits are applied.
Non-trading interest rate risk is calculated in each business on the basis of establishing the re-pricing behaviour of each asset, liability and off-balance sheet product. For many retail and commercial products, the actual interest rate re-pricing characteristics differ from the contractual re-pricing. In most cases, the re-pricing maturity is determined by the market interest rate that most closely fits the historical behaviour of the product interest rate. For non-interest bearing current accounts, the re-pricing maturity is determined by the stability of the portfolio. The re-pricing maturities used are approved by Group Treasury and divisional asset and liability committees at least annually. Key conventions are reviewed annually by GALCO.
Non-trading interest rate exposures are controlled by limiting repricing mismatches in the individual business balance sheets. Potential exposures to interest rate movements in the medium to long-term are measured and controlled using a version of the same VaR methodology that is used for the Group’s trading portfolios. Net accrual income exposures are measured and controlled in terms of sensitivity over time to movements in interest rates.
Risk is managed within VaR limits approved by GALCO, through the execution of cash and derivative instruments (see Note 13 on the accounts, on page 250). Execution of the hedging is carried out by the relevant division through the Group’s treasury functions. The residual risk position is reported to divisional asset and liability committees, GALCO and the Board.
Foreign Exchange Risk in the Banking Book (FXRBB) represents exposures to changes in the values of current holdings and future cash flows denominated in other currencies. Hedging instruments used to mitigate these risks include foreign currency options, currency swaps, futures, forwards and deposits. Foreign exchange risk results from the Group’s investments in overseas subsidiaries, associates and branches in three principal forms:
• | Structural foreign currency exposures that arise from net investment in overseas subsidiaries, associates and branches; |
• | Transactional/commercial foreign currency exposures that arise from mismatches in the currency balance sheet; and |
• | Foreign currency profit streams. |
Equity Risk in the Banking Book (ERBB) is defined as the potential variation in the Group’s non-trading income and reserves arising from changes in equity prices/income. This risk may crystallise during the course of normal business activities or in stressed market conditions. Equity positions in the Group’s banking book are retained to achieve strategic objectives, support venture capital transactions or in respect of customer restructuring arrangements.
The commercial decision to invest in equity holdings, including customer restructurings, is taken by authorised persons with delegated authority under the Group credit approval framework. Investments or disposals of a strategic nature are referred to the Group Acquisitions and Disposal Committee (ADCo), Group Executive Committee (ExCo) and where appropriate the Board for approval; those involving the purchase or sale by the Group of subsidiary companies also require Board approval, after consideration by ExCo and ADCo.
Structural interest rate risk
Non-trading interest rate VaR for the Group’s retail and commercial banking activities at a 99% confidence level was £101.3 million at 31 December 2009 (2008 – £76.7 million). During 2009, the maximum VaR was £123.2 million (2008 – £197.4 million), the minimum was £53.3 million (2008 – £76.7 million) and the average was £85.5 million (2008 – £130.0 million).
A breakdown of the Group’s non-trading VaR (including RFS Holdings minority interests) by currency is shown below.
2009 | 2008 | |||||||
| £m | £m | |||||||
| EUR | 32.2 | 30.9 | ||||||
| GBP | 111.2 | 26.0 | ||||||
| USD | 42.1 | 57.9 | ||||||
| Other | 9.0 | 14.0 | ||||||
| At year end the GBP VaR was increased by the impact of the B share issuance. | ||||||||
118
Business review continued
Market risk continued
Structural interest rate risk continued
Citizens Economic Value of Equity (EVE)*
Generally, Citizens is the main contributor to overall non-trading interest rate VaR. Citizens aims, through its management of market risk in non-trading portfolios, to mitigate the effect of prospective interest movements which could reduce future net interest income, whilst balancing the cost of such hedging activities on the current net revenue stream. To do so it uses a variety of income simulation and valuation risk measures that more effectively capture the risk to earnings due to mortgage prepayment and competitive deposit pricing behaviour than a VaR-based methodology. IRRBB is managed within approved limits on interest rate risk, liquidity and capitalisation, with a goal of optimising yield.
In addition to net interest income sensitivity Citizens also measures the sensitivity of the value of the net interest margin to changes in interest rates on a monthly basis. This measure is called EVE sensitivity. The table below details this sensitivity at the end of 2009 and the maximum and minimum month-end figures.
Percent increase/(decrease) in CFG EVE(1) | ||||||||
2% parallel upward | 2% parallel downward | |||||||
| Period end | (4.3 | ) | (23.4 | ) | ||||
| Maximum | (4.3 | ) | (24.6 | ) | ||||
| Minimum | 4.6 | (18.4 | ) | |||||
| Average | (0.8 | ) | (22.2 | ) | ||||
Notes:
(1) | Economic value of equity is the net present value (NPV) of assets and liabilities calculated by discounting expected cash flows of each instrument over its expected life. Risk to EVE is quantified by calculating the impact of interest rate changes on the net present value of equity and is expressed as a percentage of CFG regulatory capital. |
(2) | No negative rates allowed. |
Sensitivity of net interest income*
There have been no material changes to the Group’s measurement of, and management philosophy towards, sensitivity of net interest income to movement in interest rates. The Group aims to be relatively neutral to directional shifts in interest rates. It seeks to mitigate the effect of prospective interest movements which could reduce future net interest income, whilst balancing the cost of such hedging activities on the current net revenue stream.
The following table shows the sensitivity of net interest income over the next twelve months to an immediate up and down 1% change to all interest rates.
2009 £m | 2008 £m | |||||||
| + 100bp shift in yield curves | 510 | 139 | ||||||
| – 100bp shift in yield curves | (687 | ) | (234 | ) |
The base case projected net interest income is based on the Group’s current balance sheet, forwards rate paths implied by the yield curve as at 31 December 2009 and using contractual repricing dates. Where contractual repricing dates are not held an estimate of the likely timing and extent of any rate change is used. The projection also includes the expected effects of behavioural options such as the prepayment of residential mortgages.
The above sensitivities show how this projected net interest income would change in response to an immediate parallel shift to all market rates.
The scenarios used are simplified in that they assume all interest rates for all currencies and maturities move at the same time and by the same amount and therefore do not reflect the potential effect on net interest income of some rates changing whilst others remain the same. The scenarios also do not incorporate actions that would be taken by the business units to mitigate the effect of this interest rate risk.
The Group’s asset sensitive position has increased in 2009. The primary contributors to the change are enhanced modelling of embedded deposit floors, active position management to benefit from the impact of a tightening US monetary policy regime by Citizens Financial Group and the impact of not fully hedging the interest rate exposure related to the APS capital proceeds which were received in late December.
The projections do not take into account the effect on net interest income of anticipated differences in changes between interest rates and interest rates linked to other bases (such as central bank rates or product rates for which the entity has discretion over the timing and extent of rate changes). The projections make other simplifying assumptions, including that all positions run to maturity and that there are no negative interest rates.
* unaudited
119
Business review
Risk, capital and liquidity management
Market risk continued
Currency risk
The Group does not maintain material non-trading open currency positions other than the structural foreign currency translation exposures arising from its investments in foreign subsidiaries and associated undertakings and their related currency funding. The Group’s policy in relation to structural positions is to match fund the structural foreign currency exposure arising from net asset value, including goodwill in foreign subsidiaries, equity accounted investments and branches, except where doing so would materially increase the sensitivity of either the Group’s or the subsidiary’s regulatory capital ratios to currency movements. The policy requires structural foreign exchange positions to be reviewed regularly by the Group Asset and Liability Committee.
Foreign exchange differences arising on the translation of foreign operations are recognised directly in equity, together with the effective portion of foreign exchange differences arising on hedging instruments.
Equity classification of foreign currency denominated preference share issuances means that these shares are recorded on the balance sheet at historical cost. Consequently, these share issuances have the effect of increasing the Group’s structural foreign currency position.
The tables below set out the Group’s structural foreign currency exposures:
| 2009 | Net assets of | Minority interests | Net investments | Net investment | Structural foreign | |||||||||||||||
| US dollar | 15,589 | (2 | ) | 15,591 | (3,846 | ) | 11,745 | |||||||||||||
| Euro | 21,900 | 13,938 | 7,962 | (2,351 | ) | 5,611 | ||||||||||||||
| Other non-sterling | 5,706 | 511 | 5,195 | (4,001 | ) | 1,194 | ||||||||||||||
| 43,195 | 14,447 | 28,748 | (10,198 | ) | 18,550 | |||||||||||||||
| 2008 | ||||||||||||||||||||
| US dollar | 17,480 | (19 | ) | 17,499 | (3,659 | ) | 13,840 | |||||||||||||
| Euro | 26,943 | 15,431 | 11,512 | (7,461 | ) | 4,051 | ||||||||||||||
| Chinese Renminbi | 3,928 | 1,898 | 2,030 | (1,082 | ) | 948 | ||||||||||||||
| Other non-sterling | 5,088 | 621 | 4,467 | (3,096 | ) | 1,371 | ||||||||||||||
| 53,439 | 17,931 | 35,508 | (15,298 | ) | 20,210 | |||||||||||||||
| 2007 | ||||||||||||||||||||
| US dollar | 14,819 | 303 | 14,516 | (2,541 | ) | 11,975 | ||||||||||||||
| Euro | 46,629 | 28,647 | 17,982 | (8,818 | ) | 9,164 | ||||||||||||||
| Chinese Renminbi | 2,600 | — | 2,600 | (1,939 | ) | 661 | ||||||||||||||
| Brazilian Real | 3,755 | 3,755 | — | — | — | |||||||||||||||
| Other non-sterling | 3,905 | 519 | 3,386 | (1,219 | ) | 2,167 | ||||||||||||||
| 71,708 | 33,224 | 38,484 | (14,517 | ) | 23,967 |
Key points
• | Retranslation gains and losses on the Group’s net investment in operations together with those on instruments hedging these investments are recognised directly in equity. |
• | Changes in foreign currency exchange rates will affect equity in proportion to the structural foreign currency exposure. A 5% strengthening in foreign currencies against sterling would result in a gain of £980 million (2008 – £1,010 million) recognised in equity, while a 5% weakening in foreign currencies would result in a loss of £880 million (2008 – £960 million) recognised in equity. |
• | These movements in equity would off-set retranslation effects on the Group's foreign currency denominated RWAs, reducing the sensitivity of the Group's Tier 1 capital ratio to movements in foreign currency exchange rates. |
120
Business review continued
Market risk continued
Equity risk
Equity positions are measured at fair value. Fair value calculations are based on available market prices wherever possible. In the event that market prices are not available, fair value is based on appropriate valuation techniques or management estimates.
The types, nature and amounts of exchange-traded exposures, private equity exposures, and other exposures vary significantly. Such exposures may take the form of listed and unlisted equity shares, linked equity fund investments, private equity and venture capital investments, preference shares classified as equity and Federal Home Loan Stock.
The table below sets out the Group’s banking book equity exposures at 31 December 2009.
Equity exposures (1) | Listed | Unlisted | Total | |||||||||
| £m | £m | £m | ||||||||||
| Group before RFS Holdings minority interest | 401 | 2,388 | 2,789 | |||||||||
| RFS Holdings minority interest | 60 | 211 | 271 | |||||||||
| Group | 461 | 2,599 | 3,060 | |||||||||
Note:
(1) Excludes equity exposures held-for-trading purposes and by insurance/assurance entities.
Risk control*
The prime risk control mechanism for non-traded market risk exposures is the completion of monthly or quarterly IRRBB and quarterly FXRBB returns by the Group’s business units, collated as part of month-end reporting by Group Treasury to GALCO.
Financial control functions are required to confirm to Group Treasury that returns materially capture all balance sheet items and thus reconcile to core source systems.
Monthly or quarterly returns by the Group’s business units, collated as part of regular reporting by Group Treasury to GALCO, are used to build a Group IRRBB VaR position and to ensure businesses comply with materiality limits on a pre and post hedge basis for interest rates, as stipulated by Group Treasury. For FXRBB, the Group policy states that any foreign currency exposure is managed to de-minimus limits. Group Treasury monitors adherence to this policy by way of a quarterly return.
For both IRRBB and FXRBB, information is included in regulatory and statutory returns.
Group Market Risk exercise independent oversight and governance of the interest rate and foreign exchange exposures managed in Group Treasury by granting market risk limits in addition to authorising Group Treasury to deal in specific instruments for the purpose of managing the Group's non-trading interest rate and foreign exchange exposures. All market risk methodologies that relate to limits specified under this delegated authority are applied under the direction of Group Market Risk.
* unaudited
121
Business review
Risk, capital and liquidity management
Insurance risk*
All the disclosures in this section are unaudited and indicated with an asterisk (*). The Group is exposed to insurance risk directly through its general insurance and life insurance businesses.
Insurance risk arises through fluctuations in the timing, frequency and/or severity of insured events, relative to the expectations at the time of underwriting. Insurance risk is managed in four distinct ways:
• | Underwriting and pricing risk management: is managed through the use of underwriting guidelines which detail the class, nature and type of business that may be accepted, pricing policies by product line and brand and centralised control of wordings and any subsequent changes; |
• | Claims risk management: is handled using a range of automated controls and manual processes; |
• | Reserving risk management: is applied to ensure that sufficient funds have been retained to handle and pay claims as the amounts fall due, both in relation to those claims which have already occurred or will occur in future periods of insurance. Reserving risk is managed through detailed analysis of historical and industry claims data and robust control procedures around reserving models; and |
• | Reinsurance risk management: is used to protect against adverse claims experience on business which exceeds internal risk appetite. The Group uses various types of reinsurance to transfer risk that is outside the Group’s risk appetite, including individual risk excess of loss reinsurance, catastrophe excess of loss reinsurance and quota share reinsurance. |
Overall, insurance risk is predictable over time, given the large volumes of data. However, uncertainty does exist, especially around predictions such as the variations in weather for example. Risk is minimised through the application of documented insurance risk policies, coupled with risk governance frameworks and the purchase of reinsurance.
General insurance business
RBS Insurance underwrites retail and SME insurance with a focus on high volume, relatively straightforward products. The key insurance risks are as follows:
• | Motor insurance contracts (private and commercial): claims experience varies due to a range of factors, including age, gender and driving experience together with the type of vehicle and location; |
• | Property insurance contracts (residential and commercial): the major causes of claims for property insurance are weather (flood, storm), theft, fire, subsidence and various types of accidental damage; and |
• | Other commercial insurance contracts: risk arises from business interruption and loss arising from the negligence of the insured (liability insurance). |
Most general insurance contracts are written on an annual basis, which means that the Group’s liability extends for a twelve month period, after which the Group is entitled to decline to renew the policy or can impose renewal terms by amending the premium, terms and conditions.
An analysis of gross and net insurance claims can be found in the financial statements (see page 266).
Life assurance business
The Group’s three regulated life companies, National Westminster Life Assurance Limited, Royal Scottish Assurance plc and Direct Line Life Insurance Company Limited underwrite life insurance products within the UK retail insurance market. The key assurance risks are as follows:
• | Term assurance contracts: mortality claims experience varies due to a range of factors, including age, gender and smoker status. The key factors that increase the level of claims are disease pandemics and adverse lifestyle changes; and |
• | Critical illness insurance contracts: morbidity claims experience varies due to a range of factors, including age, gender and past medical history. The key factors that can increase the level of claims are adverse lifestyle changes and improvements in medical diagnosis methods. |
These are long-term contracts with long-term business provisions that are calculated in accordance with the UK accounting standard FRS 27 ‘Life Assurance’.
Estimations (assumptions) including future mortality, morbidity, persistency and levels of expenses are made in calculating reserves. The Group uses standard mortality and morbidity tables appropriate to the type of contract being written. These are adjusted as appropriate to reflect historical experience and future expectations. Sample mortality rates, expressed as deaths per million per annum, for term assurance products (age 40) are:
| 2009 | 2008 | |||||||
| Mortality (per million) | per annum | per annum | ||||||
| Male non-smoker | 674 | 723 | ||||||
| Male smoker | 1,542 | 1,590 | ||||||
| Female non-smoker | 497 | 568 | ||||||
| Female smoker | 1,136 | 1,277 |
* unaudited
122
Business review continued
Operational risk*
All the disclosures in this section (pages 123 to 125) are unaudited and indicated with an asterisk (*). Operational risk is the potential for financial loss, damage to reputation, or impact upon customers resulting from fraud; human error; ineffective or inadequately designed processes or systems; improper behaviour; or external events. Operational risk is an integral and unavoidable part of the Group’s business as it is inherent in the processes it operates to provide services to customers and generate profit for shareholders.
An objective of operational risk management is not to remove operational risk altogether, but to manage the risk to an acceptable level, taking into account the cost of minimising the risk as against the resultant reduction in exposure. Strategies to manage operational risk include avoidance, transfer, acceptance and mitigation by controls.
To ensure appropriate responsibility is allocated for the management, reporting and escalation of operational risk, the Group operates a three lines of defence model which outlines principles for the roles, responsibilities and accountabilities for operational risk management.
| Operational risk – three lines of defence model | ||
| 1st line of defence | 2nd line of defence | 3rd line of defence |
| The Business | Operational Risk | Group Internal Audit |
| Accountable for the ownership and | Responsible for the implementation and | Responsible for providing independent |
| day-to-day management and control of | maintenance of the operational risk | assurance on the design, adequacy |
| operational risk. | framework, tools and methodologies. | and effectiveness of the Group’s system |
| of internal controls. | ||
| Responsible for implementing processes | Responsible for oversight and challenge | |
| in compliance with Group policies. | on the adequacy of the risk and control | |
| processes operating in the business. | ||
| Responsible for testing key controls and | ||
| monitoring compliance with Group policies. | ||
The three lines of defence model and the Operational Risk Policy Standards apply throughout the Group and are implemented taking into account the nature and scale of the underlying business. The standards provide the direction for delivering effective operational risk management. They comprise principles and processes that enable the consistent identification, assessment, management, monitoring and reporting of operational risk across the Group. The objectives of the standards are to protect the Group from financial loss or damage to its reputation, its customers or staff and to ensure that it meets all necessary regulatory and legal requirements.
The Operational Risk Policy Standards are supported by the following key operational risk management techniques:
• | Risk and control assessments: business units identify and assess operational risks to ensure that they are effectively managed, prioritised, documented and aligned to risk appetite; |
• | Scenario analysis: scenarios for operational risk are used to assess the possible impact of extreme but plausible operational risk loss events. Scenario assessments provide a forward looking basis for managing exposures that are beyond the Group’s risk appetite; |
• | Loss data management: each business unit’s internal loss data management process captures all operational risk loss events above certain minimum thresholds. The data is used to enhance the adequacy and effectiveness of controls, identify opportunities to prevent or reduce the impact of recurrence, identify emerging themes, enable formal loss event reporting and inform risk and control assessments and scenario analysis. Escalation of individual events to senior management is determined by the seriousness of the event. Operational loss events are categorised under the following headings: |
– Clients, products and business practices;
– Technology and infrastructure failures;
– Employment practices and workplace safety;
– Internal fraud;
– External fraud;
– Execution, delivery and process management;
– Malicious damage; and
– Disaster and public safety.
• | Key risk indicators: business units monitor key risk indicators against their material risks. These indicators are used to monitor the operational risk profile and exposure to losses against thresholds which trigger risk management actions; |
* unaudited
123
Business review
Risk, capital and liquidity management
Operational risk* continued
• | New product approval process: this process ensures that all new products or significant variations to existing products are subject to a comprehensive risk assessment. Products are evaluated and approved by specialist areas and are subject to executive approval prior to launch; and |
• | Self Certification Process: this requires management to monitor and report regularly on the internal control framework for which they are responsible, confirming its adequacy and effectiveness. This includes certifying compliance with the requirements of Group policies. |
Each business unit must manage its operational risk exposure within an acceptable level, testing the adequacy and effectiveness of controls and other risk mitigants (for example, insurance) regularly and documenting the results. Where unacceptable control weaknesses are identified, action plans must be produced and tracked to completion.
The Group purchases insurance to provide the business with financial protection against specific losses and to comply with statutory or contractual requirements. Insurance is primarily used as an additional risk mitigation tool in controlling the Group’s exposures. However, insurance only provides protection against financial loss once a risk has crystallised.
Operational risk metrics
Reporting forms an integral part of operational risk management. The Group’s risk management processes are designed to ensure that issues are identified, escalated and managed on a timely basis. Exposures for each division are reported through monthly risk and control reports, which provide detail on the risk exposures and action plans.
Events that have a material, actual or potential impact on the Group’s finances, reputation or customers, are escalated and reported to divisional and Group executive.
Operational risk events by risk category – % of total risk events by count
The chart below shows that as at 31 December 2009 execution, delivery and process management, together with external fraud, accounted for circa 90% of losses by value during 2009.
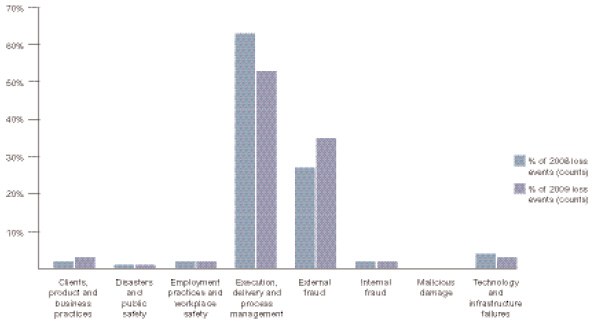
* unaudited
124
Business review continued
Operational risk* continued
Operational risk events by category – % of total by value
The charts below show a similar distribution of losses by value across the risk categories, captured at the date the event occurred and updated as losses crystallise.

Fraud prevention
Fraud remains a big challenge to the Group, and the rest of the financial services industry. The Group continues to respond to this threat, continually investing in people and processes for both detective and preventative measures, especially in relation to the impact of organised crime against the Group. Key initiatives are focused on solutions for payment fraud, ATM security, identification of counterfeit documentation and online banking protection for our customers. This has resulted in multi-million pound savings and, through close working ties with law enforcement agencies, handing down of significant custodial sentences.
Physical security
The Group has implemented strong measures to protect our customers, our staff and our assets from physical harm. These measures are kept under constant review in response to changing threats. In particular, in 2009 there has been a significant rise in demonstrations against the Group in relation to the increased media attention the Group has received. Robust processes are in place to ensure the safety of customers and staff during these demonstrations.
Information security
The Group is committed to protecting customer and Group information with regard to loss of confidentiality, integrity and availability. All employees and agents of the Group are responsible for the protection of Group assets, systems and information. All customer information is treated as confidential and appropriate security is applied to protect the information.
Additionally, the Group’s Information Security Policy is reviewed regularly and includes processes for managing and monitoring compliance with the policy. The same standards apply to information controlled by the Group or managed by authorised third parties. The Group continues to invest in programmes to enhance and maintain information security controls and systems. For example, during 2009, we completed security reviews on all of our high risk third parties as well as externally facing and hosted websites.
Business continuity
The need to ensure the continuity of business across the Group and the management of crisis situations is a key activity within the risk function.
Key risks and threats that the Group is consistently monitoring from a business continuity perspective include pandemics, terrorism, environmental impacts and technology disruptions. Business continuity plans are in place to ensure that the Group can continue key products, services, and operations.
A consistent crisis management framework has been developed that includes a six step methodology and allows incidents to be managed and resolved through skilled divisional, country, regional and global teams.
Other risks*
All the disclosures in this section (pages 125 to 126) are unaudited and indicated with an asterisk (*).
Regulatory risk
Regulatory risk is managed by designing, maintaining and implementing policies and systems in order to ensure effective compliance with all regulatory and legal requirements in all the jurisdictions in which the Group operates.
The Group’s approach to regulatory risk has three distinct elements:
• | The review of potential changes in regulation to ensure that the Group addresses the risks arising from such changes and responds appropriately; |
• | The monitoring of compliance with existing rules and regulations and the mitigation of the consequences of any inadvertent non-compliance; and |
• | The management of effective relationships with regulators to ensure constructive engagement. |
* unaudited
125
Business review
Risk, capital and liquidity management
Other risks* continued
Under a Group-wide framework of high-level policies, the Group and its subsidiaries engage co-operatively with all regulatory authorities in all the relevant jurisdictions, whether in response to regulatory change, ongoing supervisory requirements or regulatory investigations.
The scale and pace of regulatory change continues, focused across a range of topics, including Systemically Important Firms, Prudential (Basel Capital & Liquidity requirements) and Conduct issues. Of particular interest is the cumulative impact of proposals across the financial services industry. Globally, regulators have expanded their focus across a range of issues, notably strategic, governance, capital, liquidity, systems, people issues, remuneration, Anti Money Laundering/sanctions and terrorist financing and Treating Customers Fairly. This is particularly the case in the UK, where the FSA (as the Group’s lead regulator) has implemented an enhanced supervisory framework.
The Group has a well developed regulatory developments framework, which assigns Senior Executive responsibility for all material risks facing the Group on a global basis. The Group engages with standard setters, rule makers, regulators and trade bodies to deliver effective and proportionate rule making.
Reputation risk
Reputation is the body of perceptions and opinions held by the stakeholders of an organisation; customers, suppliers, employees, investors, interest groups, regulators and government. Reputation determines how stakeholders are likely to behave towards an organisation. Reputation risk arises from any activity that could have an adverse impact on the reputation of the Group.
There are several important drivers of the reputation of a company (and reputation risk) including: financial performance; corporate governance and quality of management; ethical, social and environmental performance; marketing, innovation and customer relationships; and regulatory compliance and litigation.
The Group protects its reputation by understanding and managing reputation risks, including failure to meet the expectations of stakeholders. The Group will only enter into a commercial transaction or customer relationship which is legal and complies with regulatory requirements, has economic substance or business purpose and is not designed or used for inappropriate accounting or tax purposes. The Group takes care to understand the issues that matter most to stakeholders, balance the views of all stakeholders and address them coherently. Risks to the reputation of the Group are identified, assessed, managed, monitored and reported. The Group pays particular attention to the reputation risks associated with the introduction of new products or customer relationships.
It is the responsibility of the management of all Group companies, acting through individual business units, to ensure that appropriate controls and procedures are in place to identify and manage the risks to the reputation of the Group arising from their activity.
The Board has ultimate responsibility for managing any impact on the reputation of the Group arising from its operations. The Group Corporate Sustainability Committee was established in January 2010, chaired by one of our Non-Executive Directors to enhance governance in this area. However, all parts of the Group take responsibility for reputation management.
Pension risk
The Group is exposed to risk to its defined benefit pension schemes as assets comprise investment portfolios which are held to meet projected liabilities to scheme members. Risk arises because returns from these investments may be less than expected or there may be greater than expected increases in the estimated value of the schemes’ liabilities. In such circumstances, the Group could be obliged, or may choose, to make additional contributions to the schemes.
The largest of the schemes, and the main source of pension obligation risk, is the RBS Group Pension Fund. In October 2006, this scheme was closed to new employees. In November 2009, the Group confirmed that it was making changes, proposed in August 2009, to the RBS Group Pension Fund and a number of other defined benefit schemes, with a view to controlling the cost and the risk of operating these pension plans. The main change was the introduction of a yearly limit of 2% (or inflation if lower) to the amount of any salary increase that will count for pension purposes.
Risk appetite and investment policy are agreed by the Board of Trustees with quantitative and qualitative input from the scheme actuaries and investment advisers. The Board of Trustees also consults with the Group to obtain its view on the appropriate level of risk within the pension fund.
The Group maintains an independent review of risk within the pension funds.
GALCO monitors pension obligation risk which is assessed by estimating the funding position of the scheme with a twelve month risk horizon, and with a number of different confidence levels. Monte Carlo simulations are used, based on assumptions of statistical distribution of future equity returns, future real and nominal interest rates, sensitivity of asset and liability values to changes in equity returns and real and nominal interest rates, the impact of an adverse change in longevity assumptions and mitigation available to the Group.
Every three years the Group and Trustees meet to formally agree the appropriate basis for calculating the funding valuation. The most recent funding valuation was carried out as at 31 March 2007. This showed the fund to be in surplus, and therefore there was no need in 2008 or 2009 for additional payments over and above the regular contributions.
The next valuation is due as at 31 March 2010 and the Group expects this valuation to show that liabilities exceed the value of the assets. Following this valuation the Group and the Trustees will agree the level of contributions to be paid to the scheme. This could result in the amount of contributions payable in 2010 and subsequent years being materially different from the current estimate for 2010.
* unaudited
126
Business review continued
Asset Protection Scheme*
All the disclosures in this section (pages 127 to 136) are unaudited and indicated with an asterisk (*). References to ‘Group’ in this section relate to ‘Group before RFS Holdings minority interest’.
Key aspects of the Scheme
On 22 December 2009, the Group acceded to the Asset Protection Scheme (‘APS’ or ‘the Scheme’) with HM Treasury (HMT) acting on behalf of the UK Government. Under the Scheme, the Group purchased credit protection over a portfolio of specified assets and exposures (“covered assets”) from HMT. The portfolio of covered assets had a par value of approximately £282 billion as at 31 December 2008 and the protection is subject to a first loss of £60 billion and covers 90% of subsequent losses. Once through the first loss, when a covered asset has experienced a trigger event(1) losses and recoveries in respect of that asset are included in the balance receivable under the APS. Receipts from HMT will, over time, amount to 90% of cumulative losses (net of cumulative recoveries) on the portfolio of covered assets less the first loss amount.
The Group has the right to terminate the Scheme at any time provided that the Financial Services Authority has confirmed in writing to HMT that it has no objection to the proposed termination. On termination, the Group is liable to pay HMT a termination fee. The termination fee would be the difference between £2.5 billion (or, if higher, a sum related to the economic benefit of regulatory capital relief obtained as a result of having entered the APS) and the aggregate fees paid. In addition, the Group would have to repay any amounts received from HMT under the terms of the APS (or as otherwise agreed with HMT). In consideration for the protection provided by the APS, the Group paid an initial premium of £1.4 billion on 31 December 2009 for the years 2009 and 2010. A further premium of £700 million is payable on 1 January 2011 and subsequently annual premiums of £500 million until the earlier of 31 December 2099 or the termination of the agreement.
The APS is a single contract providing credit protection in respect of a portfolio of financial assets: the unit of account is the contract as a whole. Under IFRS, credit protection is either treated as a financial guarantee contract (‘FGC’) or a derivative depending on the terms of the agreement and the nature of the protected assets and exposures. The portfolio contains more than an insignificant element of derivatives and limited recourse assets, and hence the contract does not meet the definition of an FGC. The APS contract is therefore treated as a derivative and is recognised at fair value, with changes in fair value recognised in profit or loss. The APS derivative did not have any effect on the Group’s 2009 income statement; however in future period’s changes in value of the APS derivative will have an effect on the Group’s profit or loss.
There is no change in the recognition and measurement of the covered assets as a result of the APS. Impairment provisions on covered assets measured at amortised cost are assessed and charged in accordance with the Group’s accounting policy; held-for-trading assets, assets designated at fair value and available-for-sale assets within the APS portfolio continue to be measured at fair value with no adjustments to reflect the protection provided by the APS. There is no change in how gains and losses on the covered assets are recognised in the income statement or in other comprehensive income.
Trigger events (subject to specific rules detailed in the terms of the APS) comprise:
| • | failure to pay: the counterparty to the covered asset has (subject to specified grace periods) failed to pay an amount due under the terms of its agreement with the Group. |
| • | bankruptcy: the counterparty is subject to a specified insolvency or bankruptcy-related event. |
| • | restructuring: a covered asset which is individually impaired and is subject to a restructuring. |
The selection of assets was carried out primarily between February and April 2009 and was driven by three principal criteria:
| (1) | Risk and degree of impairment in base case and stressed scenarios; |
| (2) | Liquidity of exposure; and |
| (3) | Capital intensity under procyclicality. |
* unaudited
127
Business review
Risk, capital and liquidity management
Asset Protection Scheme* continued
The approach for high volume commercial and retail exposures was on a portfolio basis. Selection for large corporates and GBM was at the counterparty/asset level. Set out below are the selection criteria for the contributing divisions.
Global Banking Markets (GBM) (1) | Banking book: selection by individual asset pool (corporate loans, real estate finance, and leveraged finance), Global Restructuring Group work-out unit counterparties/assets and high risk counterparties/assets. Additional counterparties/assets were selected through an individual risk review of the total portfolio. Trading book: selection by individual assets (monolines, derivatives, mortgage trading). |
UK Corporate (1) | Commercial & corporate real estate: all defaulted assets in the work-out/restructuring unit or in high risk bands. Corporate: all defaulted assets in the work-out/restructuring unit. Corporate banking clients in high risk sectors or with high concentration risk. Business Banking: portfolios in the work out/restructuring unit or in high risk bands. |
UK Retail (1) | Mortgages: assets with a higher loan-to-value (LTV) and in higher risk segments (e.g. LTV >97% on general book, LTV >85% on buy-to-let book), and those assets in arrears (at 31 December 2008). Loans and overdrafts: higher risk customers based on internal bandings, and those assets in arrears (at 31 December 2008). |
Ulster Bank (1) (Corporate & Retail) | Mortgages: assets with greater than 85% LTV, broker mortgages and interest only with a higher probability of default. Retail: portfolios of accounts in default, >1 month arrears, <2 years old and a higher probability of default. Corporate: counterparties/assets in work-out/restructuring groups or in high risk bands, and other assets identified as part of an individual review of cases. |
Note:
(1) Including assets transferred to Non-Core division.
Covered assets
Roll forward to 31 December 2009
The table below details the movement in covered assets in the year.
| £bn | ||||
| Covered assets at 31 December 2008 – at accession to the Scheme | 282.0 | |||
| Disposals | (3.0 | ) | ||
| Non-contractual early repayments | (8.9 | ) | ||
| Amortisations | (9.4 | ) | ||
| Maturities | (16.7 | ) | ||
| Rollovers and covered amount cap adjustments | (1.7 | ) | ||
| Effect of foreign currency movements | (11.8 | ) | ||
| Covered assets at 31 December 2009(1) | 230.5 | |||
Note:
| (1) | The covered amount at 31 December 2009 above includes approximately £2.1 billion of assets in the derivatives and structured finance asset classes which, for technical reasons, do not currently satisfy, or are anticipated at some stage not to satisfy, the eligibility requirements of the Scheme. HMT and the Group continue to negotiate in good faith whether (and, if so, to what extent) coverage should extend to these assets. Also, the Group and HMT are in discussion over the HMT classifications of some structured credit assets and this may result in adjustments to amounts for some asset classes; however underlying risks will be unchanged. |
Key points
| • | The majority of the reduction (68%) in the covered assets reflects repayments by customers. |
• | Additionally the Group took advantage of market conditions and executed a number of loan sales. |
* unaudited
128
Business review continued
Asset Protection Scheme* continued
Covered assets continued
Credit impairments and write downs
The table below analyses the cumulative credit impairment losses and adjustments to par value (including AFS reserves) relating to covered assets:
2009 £m | 2008 £m | |||||||
| Loans and advances | 14,240 | 7,705 | ||||||
| Debt securities | 7,816 | 7,942 | ||||||
| Derivatives | 6,834 | 6,575 | ||||||
| 28,890 | 22,222 | |||||||
| By division: | ||||||||
| UK Retail | 2,431 | 1,492 | ||||||
| UK Corporate | 1,007 | 285 | ||||||
| Global Banking & Markets | 1,628 | 1,640 | ||||||
| Ulster Bank | 486 | 234 | ||||||
| Non-Core | 23,338 | 18,571 | ||||||
| 28,890 | 22,222 |
Note:
| (1) | Total available-for-sale reserves on debt securities of £1,113 million at 31 December 2009 (£1,315 million as at 31 December 2008 was previously included in undrawn commitments and other adjustments). |
Key point
| • | Of the increase in cumulative losses of £6,668 million, the largest was loan impairments in Non-Core. |
First loss utilisation
The triggered amount is equivalent to the aggregate outstanding principal amount on the trigger date excluding interest, fees, premium or any other non-principal sum that is accrued or payable, except where it was capitalised on or before 31 December 2008. At the trigger date, in economic terms, there is an exchange of assets, with the Group receiving a two year interest bearing government receivable in exchange for the asset.
APS recoveries include any return of value on a triggered asset, although these are only recognised for Scheme reporting purposes when they are realised in cash. The net triggered amount at any point in time, only takes into account cash recoveries to date. The capturing of triggered amounts has required extensive new processes and controls to be put in place. These continue to be work in progress. Additionally, as with any bespoke and highly complex legal agreement there are various areas of interpretation which still need to be clarified and agreed between the Group and the Asset Protection Agency (‘APA’), some of which could have a material impact on the triggered amount identified to date. Also as part of the APS terms and conditions it was agreed to re-characterise certain assets and their closely related hedges under the scheme and the Group continues to negotiate with APA in good faith to finalise this.
The Scheme rules are designed to allow for data correction over the life of the Scheme, and the Group has a grace period during 2010 to implement processes to capture triggers and restate quarterly claims statements to HMT retrospectively.
* unaudited
129
Business review
Risk, capital and liquidity management
Asset Protection Scheme* continued
continued
First loss utilisation continued
The table below summarises the total triggered amount and related cash recoveries by division at 31 December 2009.
Triggered amount £m | Cash recoveries to date £m | Net triggered amount £m | ||||||||||
| UK Retail | 3,340 | 129 | 3,211 | |||||||||
| UK Corporate | 3,570 | 604 | 2,966 | |||||||||
| Global Banking & Markets | 1,748 | 108 | 1,640 | |||||||||
| Ulster Bank | 704 | 47 | 657 | |||||||||
| Non-Core | 18,905 | 777 | 18,128 | |||||||||
| 28,267 | 1,665 | 26,602 | ||||||||||
Note:
| (1) | The triggered amount on a covered asset is calculated when an asset is triggered (due to bankruptcy, failure to pay after a grace period, and restructuring with an impairment) and is the lower of the covered amount and the outstanding amount for each covered asset. Given the grace period for triggering assets, the Group expects additional assets to trigger based on the current risk rating and level of impairments on covered assets. |
Key points
| • | APS recoveries include almost any return of value on a triggered asset but are only recognised when they are realised in cash, hence there will be a time lag for the realisation of recoveries. |
| • | The Group expects recoveries on triggered amounts to be approximately 45% over the life of the relevant assets. |
| • | On this basis, expected loss on triggered assets at 31 December 2009 is approximately £15 billion (25%) of the £60 billion first loss threshold under the APS. |
| • | In case the net triggered amount exceeds a specified threshold level for each covered asset class, HMT retains step-in rights as defined in the Scheme rules. |
Risk-weighted assets
Risk-weighted assets were as follows:
2009 £bn | 2008 £bn | |||||||
| APS | 127.6 | 158.7 | ||||||
| Non-APS | 438.2 | 419.1 | ||||||
| Group before APS benefit | 565.8 | 577.8 | ||||||
| 2009 | ||||||||||||
| Risk-weighted assets by division | APS £bn | Non-APS £bn | Total £bn | |||||||||
| UK Retail | 16.3 | 35.0 | 51.3 | |||||||||
| UK Corporate | 31.0 | 59.2 | 90.2 | |||||||||
| Global Banking & Markets | 19.9 | 103.8 | 123.7 | |||||||||
| Ulster | 8.9 | 21.0 | 29.9 | |||||||||
| Non-Core | 51.5 | 119.8 | 171.3 | |||||||||
| Other divisions | n/a | 99.4 | 99.4 | |||||||||
| Group before APS benefit | 127.6 | 438.2 | 565.8 | |||||||||
Key point
| • | Over the year RWAs covered by the APS declined overall due to the restructuring of certain exposures, including monoline related assets, and decrease in the covered amount partly off-set by credit downgrade and procyclicality. |
* unaudited
130
Business review continued
Asset Protection Scheme* continued
Covered assets continued
Divisional analysis
The following table analyses covered assets by the asset classes defined by the Scheme conditions and by division:
UK Retail £m | UK Corporate £m | Global Banking & Markets £m | Ulster Bank £m | Non-Core £m | Covered amount £m | |||||||||||||||||||
| 2009 | ||||||||||||||||||||||||
| Residential mortgages | 9,646 | — | 113 | 2,512 | 1,934 | 14,205 | ||||||||||||||||||
| Consumer finance | 11,596 | 24,818 | — | 5,538 | 11,309 | 53,261 | ||||||||||||||||||
| Commercial real estate finance | — | 9,143 | — | 1,073 | 21,921 | 32,137 | ||||||||||||||||||
| Leveraged finance | — | 4,899 | 621 | 291 | 17,465 | 23,276 | ||||||||||||||||||
| Lease finance | — | 449 | — | — | 1,080 | 1,529 | ||||||||||||||||||
| Project finance | — | — | 255 | — | 1,562 | 1,817 | ||||||||||||||||||
| Structured finance | — | — | 4,114 | — | 11,061 | 15,175 | ||||||||||||||||||
| Loans | — | 9,918 | 25,815 | 2,237 | 16,972 | 54,942 | ||||||||||||||||||
| Bonds | — | — | 153 | — | 545 | 698 | ||||||||||||||||||
| Derivatives | — | — | 12,946 | 218 | 20,326 | 33,490 | ||||||||||||||||||
| 21,242 | 49,227 | 44,017 | 11,869 | 104,175 | 230,530 | |||||||||||||||||||
2008 | ||||||||||||||||||||||||
| Residential mortgages | 10,280 | — | 128 | 2,837 | 2,182 | 15,427 | ||||||||||||||||||
| Consumer finance | 11,609 | 25,031 | — | 5,776 | 12,127 | 54,543 | ||||||||||||||||||
| Commercial real estate finance | — | 12,436 | — | 1,268 | 26,146 | 39,850 | ||||||||||||||||||
| Leveraged finance | — | 4,978 | 993 | 329 | 21,434 | 27,734 | ||||||||||||||||||
| Lease finance | — | 594 | — | — | 1,844 | 2,438 | ||||||||||||||||||
| Project finance | — | — | 425 | — | 1,818 | 2,243 | ||||||||||||||||||
| Structured finance | — | — | 6,897 | - | 12,294 | 19,191 | ||||||||||||||||||
| Loans | — | 9,097 | 45,610 | 2,663 | 22,607 | 79,977 | ||||||||||||||||||
| Bonds | — | — | 455 | — | 1,108 | 1,563 | ||||||||||||||||||
| Derivatives | — | — | 16,349 | 229 | 22,415 | 38,993 | ||||||||||||||||||
| 21,889 | 52,136 | 70,857 | 13,102 | 123,975 | 281,959 | |||||||||||||||||||
Movements | ||||||||||||||||||||||||
| Residential mortgages | (634 | ) | — | (15 | ) | (325 | ) | (248 | ) | (1,222 | ) | |||||||||||||
| Consumer finance | (13 | ) | (213 | ) | — | (238 | ) | (818 | ) | (1,282 | ) | |||||||||||||
| Commercial real estate finance | — | (3,293 | ) | — | (195 | ) | (4,225 | ) | (7,713 | ) | ||||||||||||||
| Leveraged finance | — | (79 | ) | (372 | ) | (38 | ) | (3,969 | ) | (4,458 | ) | |||||||||||||
| Lease finance | — | (145 | ) | — | — | (764 | ) | (909 | ) | |||||||||||||||
| Project finance | — | — | (170 | ) | — | (256 | ) | (426 | ) | |||||||||||||||
| Structured finance | — | — | (2,783 | ) | — | (1,233 | ) | (4,016 | ) | |||||||||||||||
| Loans | — | 821 | (19,795 | ) | (426 | ) | (5,635 | ) | (25,035 | ) | ||||||||||||||
| Bonds | — | — | (302 | ) | — | (563 | ) | (865 | ) | |||||||||||||||
| Derivatives | — | — | (3,403 | ) | (11 | ) | (2,089 | ) | (5,503 | ) | ||||||||||||||
| (647 | ) | (2,909 | ) | (26,840 | ) | (1,233 | ) | (19,800 | ) | (51,429 | ) | |||||||||||||
Notes:
| (1) | Per the Scheme rules, the definition of consumer finance includes personal loans, as well as business and commercial loans to SMEs. |
| (2) | UK Corporate leveraged finance does not include lending to sponsors but, reflects certain loans to corporate customers per Scheme rules. |
| (3) | The net increase in UK Corporate loans reflects transfers of shipping assets from GBM. |
| (4) | There have been some minor divisional refinements to 31 December 2008 data, primarily between Core businesses and Non-Core division. |
* unaudited
131
Business review
Risk, capital and liquidity management
Asset Protection Scheme* continued
Covered assets continued
Asset classes
The following tables detail the balances by asset classes, as defined by the Scheme, with underlying product categories.
| 2009 | Carrying value (2) £m (a) | Provisions and adjustments to par value (3) £m (b) | Par value (4) £m (a)+(b)=(c) | Undrawn commitments and other adjustments (5) £m (d) | Covered amount £m (c)+(d)=(e) | ||||||||||||||||
| Residential mortgages | 14,092 | 253 | 14,345 | (140 | ) | 14,205 | |||||||||||||||
| Consumer finance | 38,101 | 4,574 | 42,675 | 10,586 | 53,261 | ||||||||||||||||
| personal loans | 7,986 | 2,610 | 10,596 | 2,613 | 13,209 | ||||||||||||||||
| business and commercial loans | 30,115 | 1,964 | 32,079 | 7,973 | 40,052 | ||||||||||||||||
| Commercial real estate finance | 28,777 | 1,656 | 30,433 | 1,704 | 32,137 | ||||||||||||||||
| Leveraged finance | 16,045 | 4,425 | 20,470 | 2,806 | 23,276 | ||||||||||||||||
| Lease finance | 1,229 | 232 | 1,461 | 68 | 1,529 | ||||||||||||||||
| Project finance | 1,601 | 44 | 1,645 | 172 | 1,817 | ||||||||||||||||
| Structured finance | 6,884 | 7,677 | 14,561 | 614 | 15,175 | ||||||||||||||||
| structured loans | 625 | 17 | 642 | 29 | 671 | ||||||||||||||||
| RMBS | 1,251 | 1,657 | 2,908 | 55 | 2,963 | ||||||||||||||||
| CMBS | 1,281 | 466 | 1,747 | (6 | ) | 1,741 | |||||||||||||||
| CDOs & CLOs | 1,568 | 4,641 | 6,209 | 119 | 6,328 | ||||||||||||||||
| other ABS | 2,159 | 896 | 3,055 | 417 | 3,472 | ||||||||||||||||
| Loans | 34,375 | 3,039 | 37,414 | 17,528 | 54,942 | ||||||||||||||||
Bonds (6) | 545 | 156 | 701 | (3 | ) | 698 | |||||||||||||||
| Derivatives | 12,510 | 6,834 | 19,344 | 14,146 | 33,490 | ||||||||||||||||
| monoline insurers | 2,607 | 6,335 | 8,942 | 10,852 | 19,794 | ||||||||||||||||
| other counterparties | 9,903 | 499 | 10,402 | 3,294 | 13,696 | ||||||||||||||||
| 154,159 | 28,890 | 183,049 | 47,481 | 230,530 | |||||||||||||||||
| Further analysed: | |||||||||||||||||||||
| Loans and advances | 134,845 | 14,240 | 149,085 | 32,753 | 181,838 | ||||||||||||||||
| Debt securities | 6,804 | 7,816 | 14,620 | 582 | 15,202 | ||||||||||||||||
| Derivatives | 12,510 | 6,834 | 19,344 | 14,146 | 33,490 | ||||||||||||||||
| 154,159 | 28,890 | 183,049 | 47,481 | 230,530 | |||||||||||||||||
By division: | |||||||||||||||||||||
| UK Retail | 16,599 | 2,431 | 19,030 | 2,212 | 21,242 | ||||||||||||||||
| UK Corporate | 37,710 | 1,007 | 38,717 | 10,510 | 49,227 | ||||||||||||||||
| Global Banking & Markets | 26,141 | 1,628 | 27,769 | 16,248 | 44,017 | ||||||||||||||||
| Ulster Bank | 10,152 | 486 | 10,638 | 1,231 | 11,869 | ||||||||||||||||
| Non-Core | 63,557 | 23,338 | 86,895 | 17,280 | 104,175 | ||||||||||||||||
| 154,159 | 28,890 | 183,049 | 47,481 | 230,530 | |||||||||||||||||
132
Business review continued
Asset Protection Scheme* continued
Covered assets continued
Asset classes continued
| 2008 | Carrying value (2) £m (a) | Provisions and adjustments to par value (3) £m (b) | Par value (4) £m (a)+(b)=(c) | Undrawn commitments and other adjustments (5) £m (d) | Covered amount £m (c)+(d)=(e) | |||||||||||||||
| Residential mortgages | 15,283 | 144 | 15,427 | — | 15,427 | |||||||||||||||
| Consumer finance | 45,691 | 2,346 | 48,037 | 6,506 | 54,543 | |||||||||||||||
| personal loans | 10,267 | 1,687 | 11,954 | 1,440 | 13,394 | |||||||||||||||
| business and commercial loans | 35,424 | 659 | 36,083 | 5,066 | 41,149 | |||||||||||||||
| Commercial real estate finance | 32,131 | 847 | 32,978 | 6,872 | 39,850 | |||||||||||||||
| Leveraged finance | 19,792 | 2,875 | 22,667 | 5,067 | 27,734 | |||||||||||||||
| Lease finance | 2,012 | 138 | 2,150 | 288 | 2,438 | |||||||||||||||
| Project finance | 1,761 | 58 | 1,819 | 424 | 2,243 | |||||||||||||||
| Structured finance | 10,370 | 8,012 | 18,382 | 809 | 19,191 | |||||||||||||||
| structured loans | 2,761 | 155 | 2,916 | 597 | 3,513 | |||||||||||||||
| RMBS | 1,232 | 1,547 | 2,779 | — | 2,779 | |||||||||||||||
| CMBS | 1,481 | 371 | 1,852 | — | 1,852 | |||||||||||||||
| CDOs & CLOs | 2,390 | 5,168 | 7,558 | 212 | 7,770 | |||||||||||||||
| other ABS | 2,506 | 771 | 3,277 | — | 3,277 | |||||||||||||||
| Loans | 50,563 | 1,142 | 51,705 | 28,272 | 79,977 | |||||||||||||||
Bonds (6) | 1,467 | 85 | 1,552 | 11 | 1,563 | |||||||||||||||
| Derivatives | 21,093 | 6,575 | 27,668 | 11,325 | 38,993 | |||||||||||||||
| monoline insurers | 5,620 | 5,892 | 11,512 | 10,758 | 22,270 | |||||||||||||||
| other counterparties | 15,473 | 683 | 16,156 | 567 | 16,723 | |||||||||||||||
| 200,163 | 22,222 | 222,385 | 59,574 | 281,959 | ||||||||||||||||
| Further analysed: | ||||||||||||||||||||
| Loans and advances | 169,994 | 7,705 | 177,699 | 48,026 | 225,725 | |||||||||||||||
| Debt securities | 9,076 | 7,942 | 17,018 | 223 | 17,241 | |||||||||||||||
| Derivatives | 21,093 | 6,575 | 27,668 | 11,325 | 38,993 | |||||||||||||||
| 200,163 | 22,222 | 222,385 | 59,574 | 281,959 | ||||||||||||||||
| By division: | ||||||||||||||||||||
| UK Retail | 18,982 | 1,492 | 20,474 | 1,415 | 21,889 | |||||||||||||||
| UK Corporate | 39,608 | 285 | 39,893 | 12,243 | 52,136 | |||||||||||||||
| Global Banking & Markets | 47,230 | 1,640 | 48,870 | 21,987 | 70,857 | |||||||||||||||
| Ulster Bank | 11,705 | 234 | 11,939 | 1,163 | 13,102 | |||||||||||||||
| Non-Core | 82,638 | 18,571 | 101,209 | 22,766 | 123,975 | |||||||||||||||
| 200,163 | 22,222 | 222,385 | 59,574 | 281,959 | ||||||||||||||||
Notes:
| (1) | The balances at 31 December 2008 and 31 December 2009 within specific asset classes reflect the Group’s application of the asset class definitions in the Scheme rules, particularly in relation to consumer finance, commercial real estate finance and loans. |
| (2) | Carrying value represents the amounts recorded on the balance sheet and includes assets classified as loans and receivables (LAR), fair value through profit or loss (FVTPL) and available-for-sale (AFS). |
| (3) | Provisions and adjustments to par value comprise: |
• | impairments on LAR and AFS debt securities; |
• | credit valuation adjustments relating to derivatives; |
• | adjustment to par value on other FVTPL assets; |
• | add-back of write-offs of £6,079 million, as these are covered by the Scheme rules; and |
• | available-for-sale reserves on debt securities of £1,113 million (2008 – £1,315 million). |
| (4) | Undrawn commitments and other adjustments include: |
• | undrawn commitments and other contingent liabilities; |
• | potential future exposures and other adjustments to covered amount relating to derivative contracts; and |
• | adjustments to covered amount in accordance with the Scheme rules (restriction of cover for rollovers (loans and commercial real estate), maintenance of covered amount as at 31 December 2008 for two years (consumer finance); |
| (5) | Comprises non asset-backed securities. |
* unaudited
133
Business review
Risk, capital and liquidity management
Asset Protection Scheme* continued
Covered assets continued
Sector analysis
The table below analyses covered assets by sector and division; and by sector and HMT asset class at 31 December 2009 and 31 December 2008.
| 2009 | ||||||||||||||||||||||||||||
UK Retail £m | UK Corporate £m | GBM £m | Ulster Bank £m | Non-Core £m | Covered amount £m | Covered amount 2008 £m | ||||||||||||||||||||||
| Financial institutions | — | 1,427 | 11,303 | 35 | 35,985 | 48,750 | 64,027 | |||||||||||||||||||||
| Manufacturing | — | 1,673 | 6,849 | 230 | 8,127 | 16,879 | 20,053 | |||||||||||||||||||||
| Natural resources | — | 629 | 2,530 | 45 | 2,117 | 5,321 | 8,122 | |||||||||||||||||||||
| Property | — | 9,990 | 8,349 | 1,550 | 27,931 | 47,820 | 60,217 | |||||||||||||||||||||
| Retail and leisure | — | 4,292 | 4,608 | 964 | 4,305 | 14,169 | 17,975 | |||||||||||||||||||||
| Services | — | 1,885 | 1,159 | 324 | 2,689 | 6,057 | 8,484 | |||||||||||||||||||||
| TMT | — | 608 | 3,985 | 263 | 5,852 | 10,708 | 14,535 | |||||||||||||||||||||
| Transport | — | �� | 3,962 | 5,118 | 116 | 3,579 | 12,775 | 15,726 | ||||||||||||||||||||
| Personal and SME | 21,242 | 24,761 | 116 | 8,342 | 13,590 | 68,051 | 72,820 | |||||||||||||||||||||
| 21,242 | 49,227 | 44,017 | 11,869 | 104,175 | 230,530 | 281,959 | ||||||||||||||||||||||
| 2009 | Residential mortgages £m | Consumer finance £m | Commercial real estate £m | Leveraged finance £m | Lease finance £m | Project finance £m | Structured finance £m | Loan £m | Bonds £m | Derivative £m | Covered amount £m | |||||||||||||||||||||||||||||||||
| Financial institutions | — | — | 818 | 1,620 | 18 | — | 13,769 | 9,741 | 337 | 22,447 | 48,750 | |||||||||||||||||||||||||||||||||
| Manufacturing | — | — | — | 5,906 | 120 | 6 | 6 | 9,782 | 48 | 1,011 | 16,879 | |||||||||||||||||||||||||||||||||
| Natural resources | — | — | — | 1,260 | 41 | 1,065 | 9 | 2,458 | 46 | 442 | 5,321 | |||||||||||||||||||||||||||||||||
| Property | — | — | 30,636 | 1,810 | 564 | 298 | 486 | 9,058 | 53 | 4,915 | 47,820 | |||||||||||||||||||||||||||||||||
| Retail and leisure | — | — | 616 | 3,510 | 40 | 142 | 369 | 7,819 | 74 | 1,599 | 14,169 | |||||||||||||||||||||||||||||||||
| Services | — | — | 29 | 3,213 | 320 | 104 | 191 | 1,572 | 6 | 622 | 6,057 | |||||||||||||||||||||||||||||||||
| TMT | — | — | — | 5,490 | 9 | — | 3 | 3,908 | 11 | 1,287 | 10,708 | |||||||||||||||||||||||||||||||||
| Transport | — | — | 35 | 465 | 273 | 202 | 342 | 10,171 | 123 | 1,164 | 12,775 | |||||||||||||||||||||||||||||||||
| Personal and SME | 14,205 | 53,261 | 3 | 2 | 144 | — | — | 433 | — | 3 | 68,051 | |||||||||||||||||||||||||||||||||
| 14,205 | 53,261 | 32,137 | 23,276 | 1,529 | 1,817 | 15,175 | 54,942 | 698 | 33,490 | 230,530 | ||||||||||||||||||||||||||||||||||
| 2008 | ||||||||||||||||||||||||||||||||||||||||||||
| Financial Institutions | — | — | 638 | 4,196 | 28 | 138 | 17,288 | 15,478 | 514 | 25,747 | 64,027 | |||||||||||||||||||||||||||||||||
| Manufacturing | — | — | — | 4,895 | 196 | 14 | 7 | 13,233 | 60 | 1,648 | 20,053 | |||||||||||||||||||||||||||||||||
| Natural resources | — | — | — | 1,484 | 60 | 1,261 | 11 | 4,699 | 53 | 554 | 8,122 | |||||||||||||||||||||||||||||||||
| Property | — | — | 38,467 | 2,188 | 876 | 388 | 550 | 12,289 | 128 | 5,331 | 60,217 | |||||||||||||||||||||||||||||||||
| Retail and leisure | — | — | 679 | 4,067 | 63 | 151 | 443 | 10,417 | 165 | 1,990 | 17,975 | |||||||||||||||||||||||||||||||||
| Services | — | — | 31 | 3,773 | 556 | 66 | 519 | 2,832 | 13 | 694 | 8,484 | |||||||||||||||||||||||||||||||||
| TMT | — | — | — | 6,591 | 13 | — | 3 | 5,918 | 406 | 1,604 | 14,535 | |||||||||||||||||||||||||||||||||
| Transport | — | — | 35 | 537 | 369 | 225 | 370 | 12,619 | 149 | 1,422 | 15,726 | |||||||||||||||||||||||||||||||||
| Personal and SME | 15,427 | 54,543 | — | 3 | 277 | — | — | 2,492 | 75 | 3 | 72,820 | |||||||||||||||||||||||||||||||||
| 15,427 | 54,543 | 39,850 | 27,734 | 2,438 | 2,243 | 19,191 | 79,977 | 1,563 | 38,993 | 281,959 | ||||||||||||||||||||||||||||||||||
* unaudited
134
Business review continued
Asset Protection Scheme* continued
Covered assets continued
Geographical breakdown
The table below provides a geographical breakdown of covered assets, based on the country of domicile or incorporation of the obligor, and by HMT asset class.
Residential mortgages £m | Consumer finance £m | Commercial real estate £m | Leveraged finance £m | Lease finance £m | Project finance £m | Structured finance £m | Loan £m | Bonds £m | Derivative £m | Covered amount £m | ||||||||||||||||||||||||||||||||||
| 2009 | ||||||||||||||||||||||||||||||||||||||||||||
| UK | 10,102 | 46,027 | 15,285 | 8,406 | 997 | 167 | 2,433 | 15,879 | 53 | 8,379 | 107,728 | |||||||||||||||||||||||||||||||||
| Western Europe | 3,971 | 6,814 | 12,080 | 9,448 | 485 | 904 | 2,963 | 21,273 | 105 | 2,369 | 60,412 | |||||||||||||||||||||||||||||||||
| North America | 118 | 46 | 1,702 | 4,039 | 2 | 228 | 3,406 | 8,019 | 25 | 17,325 | 34,910 | |||||||||||||||||||||||||||||||||
| Latin America | 1 | 282 | 2,042 | 476 | 17 | 40 | 5,628 | 2,593 | 7 | 4,068 | 15,154 | |||||||||||||||||||||||||||||||||
| Other | 13 | 92 | 1,028 | 907 | 28 | 478 | 745 | 7,178 | 508 | 1,349 | 12,326 | |||||||||||||||||||||||||||||||||
| 14,205 | 53,261 | 32,137 | 23,276 | 1,529 | 1,817 | 15,175 | 54,942 | 698 | 33,490 | 230,530 | ||||||||||||||||||||||||||||||||||
| 2008 | ||||||||||||||||||||||||||||||||||||||||||||
| UK | 10,799 | 46,459 | 20,127 | 9,617 | 1,537 | 264 | 2,778 | 21,050 | 115 | 10,074 | 122,820 | |||||||||||||||||||||||||||||||||
| Western Europe | 4,468 | 7,654 | 13,848 | 11,685 | 845 | 1,004 | 4,226 | 31,461 | 370 | 3,231 | 78,792 | |||||||||||||||||||||||||||||||||
| North America | 139 | 46 | 2,381 | 4,880 | 4 | 261 | 4,187 | 12,493 | 499 | 19,567 | 44,457 | |||||||||||||||||||||||||||||||||
| Latin America | 1 | 287 | 2,201 | 601 | 19 | 45 | 6,550 | 4,365 | 18 | 4,486 | 18,573 | |||||||||||||||||||||||||||||||||
| Other | 20 | 97 | 1,293 | 951 | 33 | 669 | 1,450 | 10,608 | 561 | 1,635 | 17,317 | |||||||||||||||||||||||||||||||||
| 15,427 | 54,543 | 39,850 | 27,734 | 2,438 | 2,243 | 19,191 | 79,977 | 1,563 | 38,993 | 281,959 | ||||||||||||||||||||||||||||||||||
Currency breakdown
The table below shows the currency breakdown of covered assets.
2009 £m | 2008 £m | ||
| GBP | 107,731 | 121,440 | |
| Euro | 56,586 | 72,989 | |
| USD | 58,489 | 77,298 | |
| AUD | 3,276 | 3,981 | |
| JPY | 1,725 | 2,157 | |
| Other | 2,723 | 4,094 | |
| 230,530 | 281,959 |
The analysis by currency does not reflect hedges that the Group may have in place.
* unaudited
135
Business review
Risk, capital and liquidity management
Asset Protection Scheme* continued
Covered assets continued
Risk elements in lending (REIL) and potential problem loans (PPL)
REIL and PPL for the Group and the amount relating to assets in the Scheme are set out below.
| 2009 | 2008 | |||||||||||||||
| Group | APS | Group | APS | |||||||||||||
| £m | £m | £m | £m | |||||||||||||
| Non-performing loans | 31,811 | 22,335 | 17,082 | 12,679 | ||||||||||||
| Other REIL | 3,178 | 2,092 | 1,709 | 1,498 | ||||||||||||
| Total REIL | 34,989 | 24,427 | 18,791 | 14,177 | ||||||||||||
| PPL | 924 | 580 | 226 | 187 | ||||||||||||
| REIL and PPL | 35,913 | 25,007 | 19,017 | 14,364 | ||||||||||||
| Core | 12,361 | 7,170 | ||||||||||||||
| Non-Core | 23,552 | 17,837 | ||||||||||||||
| 35,913 | 25,007 | |||||||||||||||
Credit quality of loans
The table below analyses the credit quality of the Group’s credit risk assets by risk bands and the proportion relating to assets in the Scheme.
| 2009 | 2008 | ||||||||||||||||||
| Asset quality band | Probability of default | Group £bn | % relating to assets in scheme | Group £bn | % relating to assets in scheme | ||||||||||||||
| AQ1 | 0% – 0.034% | 95 | 2 | % | 127 | 3 | % | ||||||||||||
| AQ2 | 0.034% – 0.048% | 12 | 9 | % | 26 | 16 | % | ||||||||||||
| AQ3 | 0.048% – 0.095% | 29 | 7 | % | 38 | 17 | % | ||||||||||||
| AQ4 | 0.095% – 0.381% | 97 | 12 | % | 150 | 15 | % | ||||||||||||
| AQ5 | 0.381% – 1.076% | 130 | 24 | % | 148 | 28 | % | ||||||||||||
| AQ6 | 1.076% – 2.153% | 95 | 28 | % | 103 | 36 | % | ||||||||||||
| AQ7 | 2.153% – 6.089% | 55 | 37 | % | 46 | 52 | % | ||||||||||||
| AQ8 | 6.089% - 17.222% | 23 | 44 | % | 26 | 46 | % | ||||||||||||
| AQ9 | 17.222% - 100% | 15 | 66 | % | 12 | 69 | % | ||||||||||||
| AQ10 | 100% | 38 | 76 | % | 18 | 72 | % | ||||||||||||
Other (1) | 41 | 5 | % | 41 | 8 | % | |||||||||||||
| 630 | 23 | % | 735 | 24 | % | ||||||||||||||
Notes:
| (1) | ‘Other’ largely comprises assets covered by the standardised approach for which a probability of default (PD) equivalent to those assigned to assets covered by the internal ratings based approach is not available. |
| (2) | Reverse repurchase agreements, carrying value relating to net derivative positions and debt securities are excluded from both Group numbers and APS covered assets above. |
* unaudited
136
Business review continued
Market turmoil exposures
All the disclosures in this section (pages 137 to 159) are audited unless otherwise indicated with an asterisk (*).
Explanatory note
These disclosures provide information on certain elements of the Group’s business activities affected by the unprecedented market events of the second half of 2007 and through 2008 and 2009, the majority of which reside within Non-Core and, to a lesser extent, Global Banking & Markets (‘GBM’), US Retail & Commercial and Group Treasury. For certain disclosures the information presented has been analysed into the Group’s Core and Non-Core businesses.
Definitions of acronyms used in this section are explained in the Glossary of terms on page 355 to 359.
Asset-backed securities
The Group structures, originates, distributes and trades debt in the form of loan, bond and derivative instruments in all major currencies and debt capital markets in North America, Western Europe, Asia and major emerging markets. The carrying value of the Group’s debt securities at 31 December 2009 was £249.1 billion (2008 – £253.2 billion). This comprised:
| 2009 | 2008 | 2007 | ||||||||||||||||||
Group before RFS Holdings minority interest £bn | Group £bn | Group before RFS Holdings minority interest £bn | Group £bn | Group £bn | ||||||||||||||||
| Securities issued by central and local governments | 134.1 | 146.9 | 95.1 | 105.8 | 122.8 | |||||||||||||||
| Asset-backed securities | 87.6 | 88.1 | 111.1 | 111.1 | 100.1 | |||||||||||||||
| Securities issued by corporates, US federal agencies and other entities | 13.4 | 14.4 | 24.3 | 26.2 | 43.5 | |||||||||||||||
| Securities issued by banks and building societies | 14.0 | 17.8 | 22.7 | 24.4 | 28.2 | |||||||||||||||
| Total debt securities | 249.1 | 267.2 | 253.2 | 267.5 | 294.6 | |||||||||||||||
This section focuses on asset-backed securities, an area of interest following the market dislocations in 2007 and 2008. Asset-backed securities (ABS) are securities with an interest in an underlying pool of referenced assets. The risks and rewards of the referenced pool are passed onto investors by the issue of securities with varying seniority, by a special purpose entity.
The Group has exposures to ABS which are predominantly debt securities but can also be held in derivative form. These positions had been acquired primarily through the Group’s activities in the US leveraged finance market which expanded during 2007. These include residential mortgage backed securities (RMBS), commercial mortgage backed securities (CMBS), ABS collateralised debt obligations (CDOs) and collateralised loan obligations (CLOs) and other ABS. In many cases the risk on these assets is hedged by way of credit derivative protection purchased over the specific asset or relevant ABS indices. The counterparty to some of these hedge transactions are monoline insurers (see monoline insurers on page 147).
The following table summarises the gross and net exposures and carrying values of these securities by geography – US, UK, other Europe and rest of the world (RoW) and by the measurement classification – held-for-trading (HFT), available-for-sale (AFS), loans and receivables (LAR) and designated at fair value through profit or loss (DFV) – of the underlying assets at 31 December 2009.
137
Business review
Risk, capital and liquidity management
Market turmoil exposures continued
Asset-backed securities by geography and measurement classification
| Other | ||||||||||||||||||||||||||||||||||||
| US | UK | Europe (4) | RoW | Total | HFT | AFS | LAR | DFV | ||||||||||||||||||||||||||||
2009 | £m | £m | £m | £m | £m | £m | £m | £m | £m | |||||||||||||||||||||||||||
Gross exposure: (1) | ||||||||||||||||||||||||||||||||||||
RMBS: G10 governments (2) | 26,693 | 314 | 16,594 | 94 | 43,695 | 13,536 | 30,159 | — | — | |||||||||||||||||||||||||||
RMBS: prime (4) | 2,965 | 5,276 | 4,567 | 222 | 13,030 | 6,274 | 5,761 | 848 | 147 | |||||||||||||||||||||||||||
RMBS: non-conforming | 1,341 | 2,138 | 128 | — | 3,607 | 635 | 1,498 | 1,474 | — | |||||||||||||||||||||||||||
RMBS: sub-prime | 1,668 | 724 | 195 | 561 | 3,148 | 1,632 | 1,020 | 479 | 17 | |||||||||||||||||||||||||||
CMBS | 3,422 | 1,781 | 1,420 | 75 | 6,698 | 2,936 | 1,842 | 1,711 | 209 | |||||||||||||||||||||||||||
CDOs | 12,382 | 329 | 571 | 27 | 13,309 | 9,080 | 3,923 | 305 | 1 | |||||||||||||||||||||||||||
CLOs | 9,092 | 166 | 2,169 | 1,173 | 12,600 | 5,346 | 6,581 | 673 | — | |||||||||||||||||||||||||||
Other ABS | 3,587 | 1,980 | 5,031 | 1,569 | 12,167 | 2,912 | 5,252 | 3,985 | 18 | |||||||||||||||||||||||||||
| 61,150 | 12,708 | 30,675 | 3,721 | 108,254 | 42,351 | 56,036 | 9,475 | 392 | ||||||||||||||||||||||||||||
Carrying value: | ||||||||||||||||||||||||||||||||||||
RMBS: G10 governments (2) | 27,034 | 305 | 16,183 | 33 | 43,555 | 13,397 | 30,158 | — | — | |||||||||||||||||||||||||||
RMBS: prime (4) | 2,697 | 4,583 | 4,009 | 212 | 11,501 | 5,133 | 5,643 | 583 | 142 | |||||||||||||||||||||||||||
RMBS: non-conforming | 958 | 1,957 | 128 | — | 3,043 | 389 | 1,180 | 1,474 | — | |||||||||||||||||||||||||||
RMBS: sub-prime | 977 | 314 | 146 | 387 | 1,824 | 779 | 704 | 324 | 17 | |||||||||||||||||||||||||||
CMBS | 3,237 | 1,305 | 924 | 43 | 5,509 | 2,279 | 1,638 | 1,377 | 215 | |||||||||||||||||||||||||||
CDOs | 3,275 | 166 | 400 | 27 | 3,868 | 2,064 | 1,600 | 203 | 1 | |||||||||||||||||||||||||||
CLOs | 6,736 | 112 | 1,469 | 999 | 9,316 | 3,296 | 5,500 | 520 | — | |||||||||||||||||||||||||||
Other ABS | 2,886 | 1,124 | 4,369 | 1,187 | 9,566 | 1,483 | 4,621 | 3,443 | 19 | |||||||||||||||||||||||||||
| 47,800 | 9,866 | 27,628 | 2,888 | 88,182 | 28,820 | 51,044 | 7,924 | 394 | ||||||||||||||||||||||||||||
Net exposure: (3) | ||||||||||||||||||||||||||||||||||||
RMBS: G10 governments (2) | 27,034 | 305 | 16,183 | 33 | 43,555 | 13,397 | 30,158 | — | — | |||||||||||||||||||||||||||
RMBS: prime (4) | 2,436 | 3,747 | 3,018 | 172 | 9,373 | 3,167 | 5,480 | 584 | 142 | |||||||||||||||||||||||||||
RMBS: non-conforming | 948 | 1,957 | 128 | — | 3,033 | 379 | 1,180 | 1,474 | — | |||||||||||||||||||||||||||
RMBS: sub-prime | 565 | 305 | 137 | 290 | 1,297 | 529 | 427 | 324 | 17 | |||||||||||||||||||||||||||
CMBS | 2,245 | 1,228 | 595 | 399 | 4,467 | 1,331 | 1,556 | 1,377 | 203 | |||||||||||||||||||||||||||
CDOs | 743 | 124 | 382 | 26 | 1,275 | 521 | 550 | 203 | 1 | |||||||||||||||||||||||||||
CLOs | 1,636 | 86 | 1,104 | 39 | 2,865 | 673 | 1,672 | 520 | — | |||||||||||||||||||||||||||
Other ABS | 2,117 | 839 | 4,331 | 1,145 | 8,432 | 483 | 4,621 | 3,309 | 19 | |||||||||||||||||||||||||||
| 37,724 | 8,591 | 25,878 | 2,104 | 74,297 | 20,480 | 45,644 | 7,791 | 382 | ||||||||||||||||||||||||||||
| Notes: |
(1) | Gross exposures represent the principal amounts relating to asset-backed securities. | |
(2) | RMBS: G10 government securities comprise securities that are: | |
(a) | Guaranteed or effectively guaranteed by the US government, by way of its support for US federal agencies and government sponsored enterprises (GSEs); | |
(b) | Guaranteed by the Dutch government; and | |
(c) | Covered bonds, referencing primarily Dutch and Spanish government-backed loans. | |
(3) | Net exposures represent the carrying value after taking account of hedge protection purchased from monoline insurers and other counterparties but exclude the effect of counterparty credit valuation adjustments. The hedges provide credit protection of principal and interest cash flows in the event of default by the counterparty. The value of this protection is based on the underlying instrument being protected. | |
(4) | Includes prime RMBS in RFS Holdings minority interests at 31 December 2009 comprising gross exposure: £558 million, carrying value: £579 million, and net exposure: £579 million. There was no ABS in RFS Holdings minority interest at 31 December 2008 or 2007. |
138
Business review continued
Market turmoil exposures continued
Asset-backed securities continued
Asset-backed securities by geography and measurement classification continued
The table below summarises the gross and net exposures and balance sheet carrying values of asset-backed securities by the geography of the underlying assets and between Core and Non-Core, at 31 December 2009.
| Other | ||||||||||||||||||||||||||||||||||||||||
| US | UK | Europe (4) | RoW | Total | ||||||||||||||||||||||||||||||||||||
Non- | Non- | Non- | Non- | Non- | ||||||||||||||||||||||||||||||||||||
| Core | Core | Core | Core | Core | Core | Core | Core | Core | Core | |||||||||||||||||||||||||||||||
2009 | £m | £m | £m | £m | £m | £m | £m | £m | £m | £m | ||||||||||||||||||||||||||||||
Gross exposure (1): | ||||||||||||||||||||||||||||||||||||||||
RMBS: G10 governments (2) | 26,644 | 49 | 17 | 297 | 2,679 | 13,357 | 94 | — | 29,434 | 13,703 | ||||||||||||||||||||||||||||||
RMBS: prime | 2,873 | 92 | 3,787 | 1,489 | 1,200 | 3,367 | 177 | 45 | 8,037 | 4,993 | ||||||||||||||||||||||||||||||
RMBS: non-conforming | 1,166 | 175 | 2,108 | 30 | — | 128 | — | — | 3,274 | 333 | ||||||||||||||||||||||||||||||
RMBS: sub-prime | 820 | 848 | 516 | 208 | 128 | 67 | 8 | 553 | 1,472 | 1,676 | ||||||||||||||||||||||||||||||
CMBS | 2,685 | 737 | 905 | 876 | 774 | 646 | — | 75 | 4,364 | 2,334 | ||||||||||||||||||||||||||||||
CDOs | 339 | 12,043 | 143 | 186 | 289 | 282 | — | 27 | 771 | 12,538 | ||||||||||||||||||||||||||||||
CLOs | 358 | 8,734 | 102 | 64 | 969 | 1,200 | — | 1,173 | 1,429 | 11,171 | ||||||||||||||||||||||||||||||
Other ABS | 1,712 | 1,875 | 1,626 | 354 | 1,780 | 3,251 | 1,224 | 345 | 6,342 | 5,825 | ||||||||||||||||||||||||||||||
| 36,597 | 24,553 | 9,204 | 3,504 | 7,819 | 22,298 | 1,503 | 2,218 | 55,123 | 52,573 | |||||||||||||||||||||||||||||||
Carrying value: | ||||||||||||||||||||||||||||||||||||||||
RMBS: G10 governments (2) | 26,984 | 50 | 17 | 288 | 2,632 | 12,972 | 33 | — | 29,666 | 13,310 | ||||||||||||||||||||||||||||||
RMBS: prime | 2,626 | 71 | 3,567 | 1,016 | 987 | 3,022 | 170 | 42 | 7,350 | 4,151 | ||||||||||||||||||||||||||||||
RMBS: non-conforming | 946 | 12 | 1,928 | 29 | — | 128 | — | — | 2,874 | 169 | ||||||||||||||||||||||||||||||
RMBS: sub-prime | 703 | 274 | 237 | 77 | 101 | 45 | 6 | 381 | 1,047 | 777 | ||||||||||||||||||||||||||||||
CMBS | 2,660 | 577 | 623 | 682 | 502 | 422 | — | 43 | 3,785 | 1,724 | ||||||||||||||||||||||||||||||
CDOs | 6 | 3,269 | 71 | 95 | 195 | 205 | — | 27 | 272 | 3,596 | ||||||||||||||||||||||||||||||
CLOs | 282 | 6,454 | 66 | 46 | 564 | 905 | — | 999 | 912 | 8,404 | ||||||||||||||||||||||||||||||
Other ABS | 1,435 | 1,451 | 831 | 293 | 1,168 | 3,201 | 936 | 251 | 4,370 | 5,196 | ||||||||||||||||||||||||||||||
| 35,642 | 12,158 | 7,340 | 2,526 | 6,149 | 20,900 | 1,145 | 1,743 | 50,276 | 37,327 | |||||||||||||||||||||||||||||||
Net exposure (3): | ||||||||||||||||||||||||||||||||||||||||
RMBS: G10 governments (2) | 26,984 | 50 | 17 | 288 | 2,632 | 12,972 | 33 | — | 29,666 | 13,310 | ||||||||||||||||||||||||||||||
RMBS: prime | 2,433 | 3 | 3,518 | 229 | 484 | 2,534 | 169 | 3 | 6,604 | 2,769 | ||||||||||||||||||||||||||||||
RMBS: non-conforming | 946 | 2 | 1,928 | 29 | — | 128 | — | — | 2,874 | 159 | ||||||||||||||||||||||||||||||
RMBS: sub-prime | 450 | 115 | 236 | 69 | 92 | 45 | 6 | 284 | 784 | 513 | ||||||||||||||||||||||||||||||
CMBS | 2,193 | 52 | 622 | 606 | 394 | 201 | — | 399 | 3,209 | 1,258 | ||||||||||||||||||||||||||||||
CDOs | 165 | 578 | 71 | 53 | 194 | 188 | — | 26 | 430 | 845 | ||||||||||||||||||||||||||||||
CLOs | 217 | 1,419 | 65 | 21 | 564 | 540 | — | 39 | 846 | 2,019 | ||||||||||||||||||||||||||||||
Other ABS | 1,301 | 816 | 623 | 216 | 1,169 | 3,162 | 916 | 229 | 4,009 | 4,423 | ||||||||||||||||||||||||||||||
| 34,689 | 3,035 | 7,080 | 1,511 | 5,529 | 19,770 | 1,124 | 980 | 48,422 | 25,296 | |||||||||||||||||||||||||||||||
| Notes: |
| (1) | Gross exposures represent the principal amounts relating to asset-backed securities. | |
| (2) | RMBS: G10 government securities comprise securities that are: | |
| (a) | Guaranteed or effectively guaranteed by the US government, by way of its support for US federal agencies and GSEs; | |
| (b) | Guaranteed by the Dutch government; and | |
| (c) | Covered bonds, referencing primarily Dutch and Spanish government-backed loans. | |
| (3) | Net exposures represent the carrying value after taking account of hedge protection purchased from monoline insurers and other counterparties but exclude the effect of counterparty credit valuation adjustments. The hedges provide credit protection of principal and interest cash flows in the event of default by the counterparty. The value of this protection is based on the underlying instrument being protected. | |
| (4) | The table excludes RFS Holdings minority interest. |
139
Business review
Risk, capital and liquidity management
| Other | ||||||||||||||||||||||||||||||||||||
| US | UK | Europe (3) | RoW | Total | HFT | AFS | LAR | DFV | ||||||||||||||||||||||||||||
2008 | £m | £m | £m | £m | £m | £m | m | £m | £m | |||||||||||||||||||||||||||
Carrying value: | ||||||||||||||||||||||||||||||||||||
RMBS: G10 governments (1) | 33,508 | 321 | 17,682 | 46 | 51,557 | 18,631 | 32,926 | — | — | |||||||||||||||||||||||||||
RMBS: prime | 5,623 | 4,754 | 6,154 | 246 | 16,777 | 7,272 | 8,769 | 570 | 166 | |||||||||||||||||||||||||||
RMBS: non-conforming | 1,111 | 2,906 | — | — | 4,017 | 352 | 2,183 | 1,482 | — | |||||||||||||||||||||||||||
RMBS: sub-prime | 1,824 | 445 | 439 | 381 | 3,089 | 1,594 | 913 | 566 | 16 | |||||||||||||||||||||||||||
CMBS | 2,145 | 1,395 | 1,646 | 141 | 5,327 | 2,751 | 1,126 | 1,437 | 13 | |||||||||||||||||||||||||||
CDOs | 8,275 | 259 | 441 | 45 | 9,020 | 4,389 | 4,280 | 351 | — | |||||||||||||||||||||||||||
CLOs | 6,428 | 329 | 2,605 | 255 | 9,617 | 3,385 | 5,299 | 933 | — | |||||||||||||||||||||||||||
Other ABS | 3,582 | 1,622 | 5,098 | 1,437 | 11,739 | 1,505 | 6,572 | 3,621 | 41 | |||||||||||||||||||||||||||
| 62,496 | 12,031 | 34,065 | 2,551 | 111,143 | 39,879 | 62,068 | 8,960 | 236 | ||||||||||||||||||||||||||||
Net exposure: (2) | ||||||||||||||||||||||||||||||||||||
RMBS: G10 governments (1) | 33,508 | 321 | 17,682 | 46 | 51,557 | 18,631 | 32,926 | — | — | |||||||||||||||||||||||||||
RMBS: prime | 5,548 | 3,667 | 5,212 | 215 | 14,642 | 5,138 | 8,768 | 570 | 166 | |||||||||||||||||||||||||||
RMBS: non-conforming | 1,106 | 2,906 | — | — | 4,012 | 346 | 2,184 | 1,482 | — | |||||||||||||||||||||||||||
RMBS: sub-prime | 358 | 408 | 380 | 313 | 1,459 | 346 | 571 | 526 | 16 | |||||||||||||||||||||||||||
CMBS | 1,147 | 1,225 | 1,095 | 79 | 3,546 | 1,178 | 918 | 1,437 | 13 | |||||||||||||||||||||||||||
CDOs | 2,402 | 127 | 311 | — | 2,840 | 1,618 | 873 | 349 | — | |||||||||||||||||||||||||||
CLOs | 874 | 259 | 2,139 | 171 | 3,443 | 845 | 1,665 | 933 | — | |||||||||||||||||||||||||||
Other ABS | 3,507 | 1,367 | 4,299 | 1,256 | 10,429 | 196 | 6,572 | 3,621 | 40 | |||||||||||||||||||||||||||
| 48,450 | 10,280 | 31,118 | 2,080 | 91,928 | 28,298 | 54,477 | 8,918 | 235 | ||||||||||||||||||||||||||||
2007 | ||||||||||||||||||||||||||||||||||||
Carrying value: | ||||||||||||||||||||||||||||||||||||
RMBS: G10 governments (1) | 26,044 | 390 | 13,833 | — | 40,267 | 15,627 | 24,640 | — | — | |||||||||||||||||||||||||||
RMBS: prime | 2,739 | 3,357 | 9,488 | 391 | 15,975 | 13,666 | 2,237 | — | 72 | |||||||||||||||||||||||||||
RMBS: non-conforming | 2,829 | 881 | — | 68 | 3,778 | 2,913 | 865 | — | — | |||||||||||||||||||||||||||
RMBS: sub-prime | 4,277 | 180 | 324 | 454 | 5,235 | 5,073 | 138 | 5 | 19 | |||||||||||||||||||||||||||
CMBS | 3,286 | 1,149 | 956 | 164 | 5,555 | 3,916 | 976 | 626 | 37 | |||||||||||||||||||||||||||
CDOs | 9,873 | 212 | 1,793 | 122 | 12,000 | 9,825 | 2,153 | — | 22 | |||||||||||||||||||||||||||
CLOs | 4,214 | 574 | 683 | 205 | 5,676 | 5,653 | 20 | — | 3 | |||||||||||||||||||||||||||
Other ABS | 4,942 | 1,483 | 4,567 | 603 | 11,595 | 5,758 | 5,579 | 72 | 186 | |||||||||||||||||||||||||||
| 58,204 | 8,226 | 31,644 | 2,007 | 100,081 | 62,431 | 36,608 | 703 | 339 | ||||||||||||||||||||||||||||
Net exposure: (2) | ||||||||||||||||||||||||||||||||||||
RMBS: G10 governments (1) | 26,045 | 385 | 13,834 | — | 40,264 | 15,903 | 24,361 | — | — | |||||||||||||||||||||||||||
RMBS: prime | 2,739 | 3,029 | 9,214 | 392 | 15,374 | 12,792 | 2,510 | — | 72 | |||||||||||||||||||||||||||
RMBS: non-conforming | 2,829 | 881 | — | 68 | 3,778 | 2,913 | 865 | — | — | |||||||||||||||||||||||||||
RMBS: sub-prime | 2,953 | 180 | 321 | 205 | 3,659 | 3,497 | 139 | 5 | 18 | |||||||||||||||||||||||||||
CMBS | 2,186 | 1,143 | 896 | 174 | 4,399 | 2,749 | 977 | 626 | 47 | |||||||||||||||||||||||||||
CDOs | 3,732 | 212 | 1,337 | 123 | 5,404 | 3,229 | 2,155 | — | 20 | |||||||||||||||||||||||||||
CLOs | 2,812 | 574 | 537 | 158 | 4,081 | 4,058 | 20 | — | 3 | |||||||||||||||||||||||||||
Other ABS | 2,881 | 1,402 | 4,500 | 533 | 9,316 | 3,480 | 5,578 | 72 | 186 | |||||||||||||||||||||||||||
| 46,177 | 7,806 | 30,639 | 1,653 | 86,275 | 48,621 | 36,605 | 703 | 346 | ||||||||||||||||||||||||||||
Notes:
| (1) | RMBS: G10 government securities comprise securities that are: | |
| (a) | Guaranteed or effectively guaranteed by the US government, by way of its support for US federal agencies and GSEs; | |
| (b) | Guaranteed by the Dutch government; and | |
| (c) | Covered bonds, referencing primarily Dutch and Spanish government-backed loans. | |
| (2) | Net exposures represent the carrying value after taking account of hedge protection purchased from monoline insurers and other counterparties but exclude the effect of counterparty credit valuation adjustments. The hedges provide credit protection of principal and interest cash flows in the event of default by the counterparty. The value of this protection is based on the underlying instrument being protected. | |
| (3) | Includes prime RMBS in RFS Holdings minority interests at 31 December 2009 comprising gross exposure: £558 million, carrying value: £579 million, and net exposure: £579 million. There was no ABS in RFS Holdings minority interest at 31 December 2008 or 2007. |
140
Business review continued
Market turmoil exposures continued
Asset-backed securities continued
Asset-backed securities by geography and measurement classification continued
The table below summarises the ratings and valuation hierarchy levels of ABS carrying values:
| Ratings (1) | Of which carried at fair value (2) | |||||||||||||||||||||||||||||||
BBB- | Non- | Not | ||||||||||||||||||||||||||||||
| AAA | rated and | investment | publicity | |||||||||||||||||||||||||||||
| rated (1) | above (1) | grade | rated | Total | Level 2 | Level 3 | Total | |||||||||||||||||||||||||
2009 | £m | £m | £m | £m | £m | £m | £m | £m | ||||||||||||||||||||||||
RMBS: G10 governments | 43,005 | 550 | — | — | 43,555 | 43,555 | — | 43,555 | ||||||||||||||||||||||||
RMBS: prime | 9,211 | 1,731 | 558 | 1 | 11,501 | 10,696 | 221 | 10,917 | ||||||||||||||||||||||||
RMBS: non-conforming | 1,980 | 467 | 594 | 2 | 3,043 | 1,549 | 21 | 1,570 | ||||||||||||||||||||||||
RMBS: sub-prime | 578 | 514 | 579 | 153 | 1,824 | 1,371 | 128 | 1,499 | ||||||||||||||||||||||||
CMBS | 3,440 | 1,920 | 147 | 2 | 5,509 | 4,000 | 134 | 4,134 | ||||||||||||||||||||||||
CDOs | 616 | 2,141 | 849 | 262 | 3,868 | 2,640 | 1,025 | 3,665 | ||||||||||||||||||||||||
CLOs | 2,718 | 5,232 | 636 | 730 | 9,316 | 7,978 | 818 | 8,796 | ||||||||||||||||||||||||
Other ABS | 4,099 | 4,516 | 152 | 799 | 9,566 | 5,177 | 946 | 6,123 | ||||||||||||||||||||||||
| 65,647 | 17,071 | 3,515 | 1,949 | 88,182 | 76,966 | 3,293 | 80,259 | |||||||||||||||||||||||||
2008 | ||||||||||||||||||||||||||||||||
RMBS: G10 governments | 51,548 | — | — | 9 | 51,557 | 51,322 | 235 | 51,557 | ||||||||||||||||||||||||
RMBS: prime | 15,252 | 1,417 | 106 | 2 | 16,777 | 16,061 | 146 | 16,207 | ||||||||||||||||||||||||
RMBS: non-conforming | 3,532 | 337 | 146 | 2 | 4,017 | 2,486 | 50 | 2,536 | ||||||||||||||||||||||||
RMBS: sub-prime | 1,362 | 936 | 790 | 1 | 3,089 | 2,459 | 64 | 2,523 | ||||||||||||||||||||||||
CMBS | 3,702 | 1,586 | 38 | 1 | 5,327 | 3,315 | 574 | 3,889 | ||||||||||||||||||||||||
CDOs | 4,510 | 2,041 | 2,088 | 381 | 9,020 | 6,922 | 1,748 | 8,670 | ||||||||||||||||||||||||
CLOs | 7,299 | 1,601 | 268 | 449 | 9,617 | 7,721 | 963 | 8,684 | ||||||||||||||||||||||||
Other ABS | 6,649 | 3,519 | 242 | 1,329 | 11,739 | 6,676 | 1,442 | 8,118 | ||||||||||||||||||||||||
| 93,854 | 11,437 | 3,678 | 2,174 | 111,143 | 96,962 | 5,222 | 102,184 | |||||||||||||||||||||||||
2007 | ||||||||||||||||||||||||||||||||
RMBS: G10 governments | 40,142 | — | — | 125 | 40,267 | 40,267 | — | 40,267 | ||||||||||||||||||||||||
RMBS: prime | 15,242 | 575 | 27 | 131 | 15,975 | 15,975 | — | 15,975 | ||||||||||||||||||||||||
RMBS: non-conforming | 2,958 | 530 | 146 | 144 | 3,778 | 3,598 | 180 | 3,778 | ||||||||||||||||||||||||
RMBS: sub-prime | 1,929 | 2,478 | 637 | 191 | 5,235 | 5,171 | 59 | 5,230 | ||||||||||||||||||||||||
CMBS | 4,286 | 1,212 | 35 | 22 | 5,555 | 4,929 | — | 4,929 | ||||||||||||||||||||||||
CDOs | 10,069 | 823 | 989 | 119 | 12,000 | 10,334 | 1,666 | 12,000 | ||||||||||||||||||||||||
CLOs | 4,157 | 704 | 93 | 722 | 5,676 | 5,593 | 83 | 5,676 | ||||||||||||||||||||||||
Other ABS | 8,568 | 1,285 | 177 | 1,565 | 11,595 | 11,391 | 130 | 11,521 | ||||||||||||||||||||||||
| 87,351 | 7,607 | 2,104 | 3,019 | 100,081 | 97,258 | 2,118 | 99,376 | |||||||||||||||||||||||||
| Notes: |
(1) | Credit ratings are based on those from rating agency Standard & Poor’s (S&P). Moody’s and Fitch have been mapped onto the S&P scale. |
(2) | Fair value hierarchy levels 2 and 3 as defined by IFRS. |
141
Business review
Risk, capital and liquidity management
| Key points |
| • | Total asset-backed securities decreased from £111.1 billion at 31 December 2008 to £88.2 billion at 31 December 2009, due principally to exchange rate movements and the significant sell-down activity which took place in the first half of the year. In addition, credit spreads widened in the first half of the year, further reducing carrying values, although this was off-set to some extent by spreads tightening in the second half of the year. Sales have been limited in the second half of the year, however maturities have continued to reduce the balance sheet exposures. |
| • | Life-to-date net valuation losses on ABS held at 31 December 2009, including impairment provisions, were £20.1 billion comprising: |
| – | RMBS: £3.6 billion, of which £0.7 billion was in US sub-prime and £2.3 billion in European assets; |
| – | CMBS: £1.2 billion; |
| – | CDOs: £9.4 billion and CLOs: £3.3 billion, significantly all in Non-Core; and |
| – | Other ABS: £2.6 billion. |
| • | The majority of the Group’s exposure to ABS is through government-backed RMBS, amounting to £43.6 billion at 31 December 2009 (2008 – £51.6 billion), and includes: |
| – | US government-backed securities, comprising mainly current year vintage positions, were £27.0 billion (2008 – £33.5 billion). Due to the US government backing, explicit or implicit, for these securities, the counterparty credit risk exposure is low. This is comprised of: |
| – | HFT securities of £13.4 billion (2008 – £18.6 billion). These securities are actively transacted and possess a high degree of liquidity. Trading in this portfolio has shifted to more recent vintages; |
| – | AFS securities of £13.6 billion (2008 – £14.9 billion) relating to liquidity portfolios held by US Retail & Commercial; and |
| – | The decrease in exposure over the year was due to foreign exchange movements driven by the strengthening of sterling against the US dollar in the first half of the year and a decrease in the balances in the second half of the year. |
| – | Other European government-backed exposures of £16.2 billion. This largely comprises liquidity portfolios of £15.6 billion held by Group Treasury (2008 – £17.7 billion) in European government-backed RMBS, referencing primarily Dutch and Spanish government-backed loans and covered mortgage bonds. The portfolio reduced during the year, driven primarily by exchange rate movements, partially offset by improved prices, mainly during the second half of the year. |
| • | The Group has other portfolios of RMBS from secondary trading activities, warehoused positions previously acquired with the intention of securitisation, and a portfolio of assets from the unwinding of the Group’s securities arbitrage conduit in 2008. |
| • | Material disposals of prime RMBS occurred in the first half of the year, in particular £1.5 billion of 2005 vintage US securities, £0.5 billion of Spanish and Portuguese mortgages and £0.6 billion of positions which were hedged. |
| • | CDOs decreased from £9.0 billion at 31 December 2008 to £3.9 billion at 31 December 2009, driven primarily by significant declines in prices, together with foreign exchange movements, in the first half of the year. |
| • | Subprime balances decreased across ratings, geographies and vintages, due to pay-downs, maturities and sales during the year, while non-conforming exposures fell mainly due to UK AAA-rated AFS redemptions. During the third quarter, improved prices off-set the effect of redemptions in some portfolios. |
| • | US Mortgage trading in GBM, US Retail and Commercial are in Core. |
| • | Many of the assets, primarily CDOs and CLOs, in Non-Core Trading have market hedges in place which gives rise to a significant difference between the carrying value and the net exposure. |
| • | AAA-rated assets decreased from £93.9 billion at 31 December 2008 to £65.6 billion at 31 December 2009 primarily as a result of the sell-down activity of prime and government-backed securities. |
| • | There was no significant change in the percentage of asset-backed securities classified as level 2 and level 3 assets year-on-year (2009 –87% and 4% respectively, 2008 – 87% and 5% respectively). |
| • | There were significant downgrades of AAA-rated CLOs to BBB during the year. |
The remainder of this section provides additional information and analysis of specific ABS portfolios.
Residential mortgage-backed securities (RMBS)
RMBS are securities that represent an interest in a portfolio of residential mortgages. Repayments made on the underlying mortgages are used to make payments to holders of the RMBS. The risk of the RMBS will vary primarily depending on the quality and geographic region of the underlying mortgage assets and the credit enhancement of the securitisation structure. Several tranches of notes are issued, each secured against the same portfolio of mortgages, but providing differing levels of seniority to match the risk appetite of investors. The most junior (or equity) notes will suffer early capital and interest losses experienced by the referenced mortgage collateral, with each more senior note benefiting from the protection provided by the subordinated notes below. Additional credit enhancements may be provided to the holder of senior RMBS notes, including guarantees over the value of the exposures, often provided by monoline insurers.
The main categories of mortgages that serve as collateral to RMBS held by the Group are described below. The US market has more established definitions of differing underlying mortgage quality and these are used as the basis for the Group’s RMBS categorisation.
142
Business review continued
Market turmoil exposures continued
Asset-backed securities continued
Residential mortgage-backed securities (RMBS) continued
RMBS: G10 government securities comprise securities that are:
| · | Guaranteed or effectively guaranteed by the US government, by way of its support for US federal agencies and GSEs; |
| · | Guaranteed by the Dutch government; and |
| · | Covered bonds, referencing primarily Dutch and Spanish government-backed loans. |
Guaranteed or effectively guaranteed mortgages are mortgages that form part of a mortgage-backed security issuance by a government agency, or in the US an entity that benefits from a guarantee (direct or indirect) provided by the US government. For US RMBS, this category includes RMBS issued by Ginnie Mae, Freddie Mac and Fannie Mae. European RMBS includes mortgages guaranteed by the Dutch Government.
Covered mortgage bonds are debt instruments that have recourse to a pool of mortgage assets, where investors have a preferred claim if a default occurs. These underlying assets are segregated from the other assets held by the issuing entity.
Prime mortgages are those of a higher credit quality than nonconforming and sub-prime mortgages, and exclude guaranteed and covered bond mortgages.
Non-conforming mortgages (or ‘Alt-A’ used for US exposure) have a higher credit quality than sub-prime mortgages, but lower than prime borrowers. Within the US mortgage industry, non-conforming mortgages are those that do not meet the lending criteria for US agency mortgages (described below). For non-US mortgages, judgement is applied in identifying loans with similar characteristics to US non-conforming loans and also includes self-certified loans. Alt-A describes a category of mortgages in which lenders consider the risk to be greater than prime mortgages though less than sub-prime. The offered interest rate is usually representative of the associated risk level.
Sub-prime mortgages are loans to sub-prime borrowers typically having weakened credit histories that include payment delinquencies and potentially more severe problems such as court judgements and bankruptcies. They may also display reduced repayment capacity as measured by credit scores, high debt-to-income ratios, or other criteria indicating heightened risk of default.
The table below analyses the vintage of the Group’s holdings of RMBS portfolios (carrying value) by geography. |
| Other | G10 | Non- | ||||||||||||||||||||||||||||||||||
| US | UK | Europe | RoW | Total | governments | Prime | conforming | Sub-prime | ||||||||||||||||||||||||||||
2009 | £m | £m | £m | £m | £m | £m | £m | £m | £m | |||||||||||||||||||||||||||
| 2004 and earlier | 8,505 | 293 | 1,760 | 33 | 10,591 | 8,703 | 1,461 | 99 | 328 | |||||||||||||||||||||||||||
| 2005 | 4,221 | 783 | 4,252 | 74 | 9,330 | 6,383 | 2,173 | 510 | 264 | |||||||||||||||||||||||||||
| 2006 | 1,847 | 3,116 | 7,449 | 216 | 12,628 | 6,826 | 4,514 | 690 | 598 | |||||||||||||||||||||||||||
| 2007 and later | 17,093 | 2,967 | 7,005 | 309 | 27,374 | 21,643 | 3,353 | 1,744 | 634 | |||||||||||||||||||||||||||
| 31,666 | 7,159 | 20,466 | 632 | 59,923 | 43,555 | 11,501 | 3,043 | 1,824 | ||||||||||||||||||||||||||||
2008 | ||||||||||||||||||||||||||||||||||||
| 2004 and earlier | 6,839 | 887 | 2,122 | 102 | 9,950 | 6,661 | 2,507 | 122 | 660 | |||||||||||||||||||||||||||
| 2005 | 9,666 | 1,694 | 5,265 | 65 | 16,690 | 10,172 | 4,794 | 1,371 | 353 | |||||||||||||||||||||||||||
| 2006 | 3,136 | 3,273 | 9,139 | 234 | 15,782 | 8,274 | 5,376 | 872 | 1,260 | |||||||||||||||||||||||||||
| 2007 and later | 22,425 | 2,572 | 7,749 | 272 | 33,018 | 26,450 | 4,100 | 1,652 | 816 | |||||||||||||||||||||||||||
| 42,066 | 8,426 | 24,275 | 673 | 75,440 | 51,557 | 16,777 | 4,017 | 3,089 | ||||||||||||||||||||||||||||
2007 | ||||||||||||||||||||||||||||||||||||
| 2004 and earlier | 3,848 | 946 | 2,420 | 243 | 7,457 | 3,492 | 2,750 | 187 | 1,028 | |||||||||||||||||||||||||||
| 2005 | 4,988 | 523 | 5,257 | 252 | 11,020 | 6,486 | 2,910 | 448 | 1,176 | |||||||||||||||||||||||||||
| 2006 | 9,496 | 1,416 | 9,540 | 311 | 20,763 | 11,151 | 6,244 | 1,351 | 2,017 | |||||||||||||||||||||||||||
| 2007 and later | 17,557 | 1,923 | 6,428 | 107 | 26,015 | 19,138 | 4,071 | 1,792 | 1,014 | |||||||||||||||||||||||||||
| 35,889 | 4,808 | 23,645 | 913 | 65,255 | 40,267 | 15,975 | 3,778 | 5,235 | ||||||||||||||||||||||||||||
Key point
| · | The change in vintage composition is a result of the balance sheet sell-down as well as the US Mortgage trading activity. |
143
Market turmoil exposures continued
Asset-backed securities continued
Commercial mortgage-backed securities (CMBS)
CMBS are securities that are secured by mortgage loans on commercial land and buildings. The securities are structured in the same way as RMBS but typically the underlying assets referenced will be of greater individual value. The performance of the securities is highly dependent upon the sector of commercial property referenced and the geographical region.
The Group accumulated CMBS for the purpose of securitisation and secondary trading. The largest holding of CMBS arose as a result of the Group’s purchase of senior tranches in mezzanine and high grade CMBS structures from third parties. These securities are predominantly hedged with monoline insurers. As a result, the Group’s risk is limited to the counterparty credit risk exposure to the hedge. The Group also holds CMBS arising from securitisations of European commercial mortgages it originated.
The following table shows the composition of the Group’s CMBS portfolios (carrying value) by geography and sector.
| 2009 | 2008 | |||||||||||||||||||||||||||||||||||||||
| Other | Other | |||||||||||||||||||||||||||||||||||||||
| US | UK | Europe | RoW | Total | US | UK | Europe | RoW | Total | |||||||||||||||||||||||||||||||
| £m | £m | £m | £m | £m | £m | £m | £m | £m | £m | |||||||||||||||||||||||||||||||
US federal agency | 1,438 | — | — | — | 1,438 | 649 | — | — | — | 649 | ||||||||||||||||||||||||||||||
Office | 557 | 696 | 231 | — | 1,484 | 428 | 915 | 402 | — | 1,745 | ||||||||||||||||||||||||||||||
Retail | 507 | 112 | 64 | 33 | 716 | 295 | 43 | 2 | 49 | 389 | ||||||||||||||||||||||||||||||
Mixed use | 28 | 145 | 558 | 10 | 741 | 20 | 99 | 975 | 45 | 1,139 | ||||||||||||||||||||||||||||||
Multi-family | 221 | 130 | 26 | — | 377 | 159 | 143 | — | — | 302 | ||||||||||||||||||||||||||||||
Hotel | 166 | 36 | — | — | 202 | 40 | 35 | — | — | 75 | ||||||||||||||||||||||||||||||
Healthcare | 55 | 90 | 24 | — | 169 | 24 | 13 | 81 | — | 118 | ||||||||||||||||||||||||||||||
Other | 265 | 96 | 21 | — | 382 | 530 | 147 | 186 | 47 | 910 | ||||||||||||||||||||||||||||||
| 3,237 | 1,305 | 924 | 43 | 5,509 | 2,145 | 1,395 | 1,646 | 141 | 5,327 | |||||||||||||||||||||||||||||||
| Key points |
| · | CMBS carrying values declined due to foreign exchange movements driven by the strengthening of sterling against the US dollar and the euro, as well as modest pay downs, sales and write-downs. This was more than off-set by revised asset classifications, including US federal agency issued ABS, previously classified as US government debt securities. |
| · | There were no material acquisitions of CMBS by the Group in 2009. Where exposures within CMBS types have increased, this was due to a change of sector exposure from permitted substitutions, particularly within US structures, and revised sector classifications. |
144
Business review continued
Market turmoil exposures continued
Asset-backed securities continued
Collateralised debt and loan obligations
Collateralised debt obligations (CDO) are securities whose performance is dependent on a portfolio of referenced underlying securitised assets. The referenced assets generally consist of ABS, but may also include other classes of assets. Collateralised loan obligations (CLO) represent securities in special purpose entities, the assets of which are primarily cash flows from underlying leveraged loans. Some of the Group’s holdings of asset-backed securities were originated for CDO structures. These CDO structures include off-balance sheet ABS with hedges to provide net super senior CDO exposures.
The Group retained significant holdings of super senior positions in CDOs. These positions represent the most senior positions in the CDO and, at the time of structuring, were senior to tranches rated AAA by independent rating agencies. However, since the inception of these transactions, the subordinate tranches have diminished significantly in value such that, at 31 December 2009, there was no significant value in any of the subordinate positions related to the Group’s open super senior positions in ABS CDOs. The net exposure on the open positions at 31 December 2009 is £910 million (2008 – £1,182 million). Net exposure represents the value after taking account of hedge protection purchased from monolines and other counterparties but excludes the effect of credit valuation adjustments.
Other asset-backed securities
Other asset-backed securities are securities issued from securitisation vehicles, similar to those in RMBS and CMBS structures, which reference cash flow generating assets other than mortgages. The wide variety of referenced underlying assets results in diverse asset performance levels.
The Group has accumulated these assets from a range of trading and funding activities. The carrying value of the Group’s other asset-backed securities by underlying asset type and geographical region is shown below.
| 2009 | 2008 | |||||||||||||||||||||||||||||||||||||||
| Other | Other | |||||||||||||||||||||||||||||||||||||||
| US | UK | Europe | RoW | Total | US | UK | Europe | RoW | Total | |||||||||||||||||||||||||||||||
| £m | £m | £m | £m | £m | £m | £m | £m | £m | £m | |||||||||||||||||||||||||||||||
Covered bonds | — | — | 2,200 | — | 2,200 | — | — | 3,301 | — | 3,301 | ||||||||||||||||||||||||||||||
Consumer | 346 | 351 | 1,050 | 528 | 2,275 | 956 | 408 | 118 | 729 | 2,211 | ||||||||||||||||||||||||||||||
Student loans | 731 | — | — | — | 731 | 953 | — | — | — | 953 | ||||||||||||||||||||||||||||||
Other leases | 27 | 491 | 279 | — | 797 | 1 | 492 | 455 | — | 948 | ||||||||||||||||||||||||||||||
Aircraft leases | 382 | 17 | — | 61 | 460 | 459 | 23 | — | 273 | 755 | ||||||||||||||||||||||||||||||
Auto and equipment | 78 | 26 | 384 | 308 | 796 | 160 | 30 | 466 | 29 | 685 | ||||||||||||||||||||||||||||||
Utilities and energy | 104 | 37 | 159 | 32 | 332 | 47 | 19 | 48 | 143 | 257 | ||||||||||||||||||||||||||||||
Film/entertainment | 12 | — | 1 | — | 13 | 86 | — | — | — | 86 | ||||||||||||||||||||||||||||||
Other | 1,206 | 202 | 296 | 258 | 1,962 | 920 | 650 | 710 | 263 | 2,543 | ||||||||||||||||||||||||||||||
| 2,886 | 1,124 | 4,369 | 1,187 | 9,566 | 3,582 | 1,622 | 5,098 | 1,437 | 11,739 | |||||||||||||||||||||||||||||||
| Key points |
| · | The reduction in carrying value of the Group’s Other ABS exposures reflects asset disposals and foreign exchange movements. There were no material acquisitions of other ABS by the Group in the year. Where exposures within specific asset types have increased, this is due to a combination of permitted substitutions within structures and revised sector classifications, particularly in relation to consumer positions. |
| · | The covered bonds comprise asset-backed securities issued primarily by Spanish financial institutions. These securities benefit from credit enhancement provided by the issuing institutions. |
145
Market turmoil exposures continued
Asset-backed securities continued
Credit valuation adjustments (CVA)
CVA represent an estimate of the adjustment to arrive at fair value that a market participant would make to incorporate the credit risk inherent in counterparty derivative exposures. The Group makes such credit adjustments to derivative exposures it has to counterparties, as well as debit valuation adjustments (DVA) to liabilities issued by the Group. The Group’s methodology used for deriving DVA is different to that used for CVA and is discussed within Note 11 Financial instruments – own credit on page 237.
The Group has purchased protection from monoline insurers (‘monolines’), credit derivative product companies (CDPCs) and other counterparties. The Group makes CVAs to exposures it has to these counterparties. The CVAs at 31 December 2009 are set out below.
| 2009 | 2008 | 2007 | ||||||||||
| £m | £m | £m | ||||||||||
Monoline insurers | 3,796 | 5,988 | 862 | |||||||||
CDPCs | 499 | 1,311 | 44 | |||||||||
Other counterparties | 1,588 | 1,738 | 263 | |||||||||
Total CVA adjustments | 5,883 | 9,037 | 1,169 | |||||||||
| Key points |
| · | During 2009, there was a significant reduction in the level of CVA held against exposures to monoline insurers and CDPCs, primarily driven by a reduction in the gross exposures to these counterparties due to a combination of restructuring certain trades and higher prices of underlying reference instruments. |
| · | The reduction in CVA held against exposures to other counterparties was primarily driven by a reduction in counterparty risk due to the tightening of credit spreads. |
146
Market turmoil exposures continued
Credit valuation adjustments continued
Monoline insurers
The Group has purchased protection from monolines, mainly against specific asset-backed securities. Monolines specialise in providing credit protection against the principal and interest cash flows due to the holders of debt instruments in the event of default by the debt instrument counterparty. This protection is typically held in the form of derivatives such as credit default swaps (CDSs) referencing underlying exposures held directly or synthetically by the Group.
The gross mark-to-market of the monoline protection depends on the value of the instruments against which protection has been bought. A positive fair value, or a valuation gain, in the protection is recognised if the fair value of the instrument it references decreases. For the majority of trades the gross mark-to-market of the monoline protection is determined directly from the fair value price of the underlying reference instrument. For the remainder of the trades the gross mark-to-market is determined using industry standard models.
The methodology employed to calculate the monoline CVA uses CDS spreads and recovery levels to determine the market’s implied level of expected loss on monoline exposures of different maturities. CVA is calculated at a trade level by applying the expected loss corresponding to each trade’s expected maturity to the gross mark-to-market of the monoline protection. The expected maturity of each trade reflects the scheduled notional amortisation of the underlying reference instruments and whether payments due from the monoline insurer are received at the point of default or over the life of the underlying reference instruments.
The table below summarises the Group’s exposure to monolines; all of which are in the Non-Core division.
| 2009 | 2008 | 2007 | ||||||||||
| £m | £m | £m | ||||||||||
Gross exposure to monolines | 6,170 | 11,581 | 3,409 | |||||||||
Hedges with financial institutions | (531 | ) | (789 | ) | — | |||||||
Credit valuation adjustment | (3,796 | ) | (5,988 | ) | (862 | ) | ||||||
Net exposure to monolines | 1,843 | 4,804 | 2,547 | |||||||||
CVA as a % of gross exposure | 62% | 52% | 25% | |||||||||
| Key points |
| · | The exposure to monoline insurers has decreased considerably during 2009 due to a combination of restructuring certain exposures and higher prices of underlying reference instruments. The trades with monoline insurers are predominantly denominated in US dollars, and the strengthening of sterling against the US dollar during 2009 has further reduced the exposure. |
| · | The overall level of CVA has decreased, in line with the reduction in exposure to these counterparties. However, relative to the exposure to monoline counterparties, the CVA has increased from 52% to 62% due to a combination of wider credit spreads and lower recovery rates. These moves have been driven by deterioration in the credit quality of the monoline insurers as evidenced by rating downgrades (as shown in the table on the following page, together with the Group’s exposure to monoline insurers by asset category). |
RWAs*
Counterparty and credit RWAs relating to risk structures incorporating gross monoline exposures increased from £7.3 billion to £13.7 billion over the year. The increase was driven by revised credit risk assessments of these counterparties in the first nine months of the year, partially off-set by reductions in the last quarter due to restructuring.
| * unaudited |
147
Market turmoil exposures continued
Credit valuation adjustments continued
Monoline insurers continued
The table below summarises monoline exposures by rating.
| Notional amount: | Fair value: | Credit | Net exposure | |||||||||||||||||||||
| protected | protected | Gross | valuation | to monoline | ||||||||||||||||||||
| assets | assets | exposure | adjustment | Hedges | insurers | |||||||||||||||||||
2009 | £m | £m | £m | £m | £m | £m | ||||||||||||||||||
AA rated | 7,143 | 5,875 | 1,268 | 378 | — | 890 | ||||||||||||||||||
Sub-investment grade | 12,598 | 7,696 | 4,902 | 3,418 | 531 | 953 | ||||||||||||||||||
| 19,741 | 13,571 | 6,170 | 3,796 | 531 | 1,843 | |||||||||||||||||||
Of which: | ||||||||||||||||||||||||
CDOs | 2,284 | 797 | 1,487 | 1,059 | ||||||||||||||||||||
RMBS | 82 | 66 | 16 | 2 | ||||||||||||||||||||
CMBS | 4,253 | 2,034 | 2,219 | 1,562 | ||||||||||||||||||||
CLOs | 10,007 | 8,584 | 1,423 | 641 | ||||||||||||||||||||
Other ABS | 2,606 | 1,795 | 811 | 410 | ||||||||||||||||||||
Other | 509 | 295 | 214 | 122 | ||||||||||||||||||||
| 19,741 | 13,571 | 6,170 | 3,796 | |||||||||||||||||||||
2008 | ||||||||||||||||||||||||
AA rated | 8,937 | 6,537 | 2,400 | 1,067 | — | 1,333 | ||||||||||||||||||
BBB rated | 16,895 | 8,396 | 8,499 | 4,426 | 768 | 3,305 | ||||||||||||||||||
Sub-investment grade | 2,188 | 1,506 | 682 | 495 | 21 | 166 | ||||||||||||||||||
| 28,020 | 16,439 | 11,581 | 5,988 | 789 | 4,804 | |||||||||||||||||||
Of which: | ||||||||||||||||||||||||
CDOs | 5,779 | 1,395 | 4,384 | 2,201 | ||||||||||||||||||||
RMBS | 93 | 65 | 28 | 10 | ||||||||||||||||||||
CMBS | 4,849 | 2,388 | 2,461 | 1,429 | ||||||||||||||||||||
CLOs | 12,865 | 9,673 | 3,192 | 1,556 | ||||||||||||||||||||
Other ABS | 3,666 | 2,460 | 1,206 | 617 | ||||||||||||||||||||
Other | 768 | 458 | 310 | 175 | ||||||||||||||||||||
| 28,020 | 16,439 | 11,581 | 5,988 | |||||||||||||||||||||
2007 | ||||||||||||||||||||||||
AAA rated | 23,596 | 20,913 | 2,683 | 243 | — | 2,440 | ||||||||||||||||||
AA rated | 300 | 193 | 107 | — | — | 107 | ||||||||||||||||||
BBB rated | — | — | — | — | — | — | ||||||||||||||||||
Sub-investment grade | 1,072 | 453 | 619 | 619 | — | — | ||||||||||||||||||
| 24,968 | 21,559 | 3,409 | 862 | — | 2,547 | |||||||||||||||||||
Of which: | ||||||||||||||||||||||||
CDOs | 5,894 | 3,459 | 2,435 | 615 | ||||||||||||||||||||
RMBS | 73 | 73 | — | — | ||||||||||||||||||||
CMBS | 3,731 | 3,421 | 310 | 34 | ||||||||||||||||||||
CLOs | 9,941 | 9,702 | 239 | 44 | ||||||||||||||||||||
Other ABS | 4,553 | 4,388 | 165 | 14 | ||||||||||||||||||||
Other | 776 | 516 | 260 | 155 | ||||||||||||||||||||
| 24,968 | 21,559 | 3,409 | 862 | |||||||||||||||||||||
Credit ratings are based on those from rating agencies Standard & Poor’s (S&P) and Moody’s. Where the ratings differ, the lower of the two is taken.
Key points
| · | The majority of the current exposure is to sub-investment grade monoline counterparties. Nearly all such counterparties were down-graded during the year. |
| · | The main exposure relates to CMBS, CDOs and CLOs. |
| · | CDO and CLO prices improved during the year, mostly in the last quarter, whilst CMBS deteriorated slightly overall during the year, with a slight improvement in Q4. |
148
Market turmoil exposures continued
Credit valuation adjustments continued
Monoline insurers continued
A number of debt instruments with monoline protection were reclassified from held-for-trading to available-for-sale with effect from 1 July 2008. Changes in the fair value since the reclassification are only recognised in the income statement to the extent that they are considered impairments. Changes in the fair value of the related monoline protection continues to be recorded in the income statement. Higher prices of these debt securities in 2009 gave rise to net losses from the corresponding decrease in the gross mark-to-market of the related monoline protection. The reclassification gave rise to profits in 2008.
A summary of the reclassified debt securities held at 31 December 2009 are shown in the table below:
| £m | ||||
Fair value at 1 July 2008 (1) | 6,248 | |||
Fair value at 31 December 2009 (2) | 5,022 |
Notes:
(1) | Represents the fair value of the reclassified debt securities, adjusted for principal based cash flows between 1 July 2008 and 31 December 2009. |
(2) | Of the net change in fair value, fair value losses of £563 million have not been recognised in the income statement. |
If the debt securities had not been reclassified, all changes in fair value would have been recognised in the income statement and would be offset by changes in the fair value of the related monoline CDS. The extent to which the level of impairments recorded differs from the fair value changes gives rise to a net profit or loss that, but for the reclassification, would have been recorded for accounting purposes.
The net income statement effect relating to monoline exposures is shown below.
| £m | ||||
Credit valuation adjustment at 1 January 2009 | (5,988 | ) | ||
Credit valuation adjustment at 31 December 2009 | (3,796 | ) | ||
Decrease in credit valuation adjustment | 2,192 | |||
Net debit relating to realisation, hedges, foreign exchange and other movements | (3,290 | ) | ||
Net debit relating to reclassified debt securities | (1,468 | ) | ||
Net debit to income statement (1) | (2,566 | ) |
Note:
| (1) | Comprises a loss of £2,387 million recorded as income from trading activities, £239 million of impairment losses and £60 million of other income relating to reclassified debt securities. |
Key points
| · | Realised losses arising from restructuring certain exposures, together with the impact of the US dollar weakening against sterling, are the primary components of the £3.3 billion above. |
| · | The net loss arising from the reclassification of debt securities is due to the difference between impairment losses on these available-for-sale securities and the gains that would have been reported in the income statement if these assets had continued to be accounted for as held-for- trading. |
The Group also has indirect exposures to monoline insurers through wrapped securities and other assets with credit enhancement provided by monoline insurers. These securities are traded with the benefit of this credit enhancement. Any deterioration in the credit rating of the monoline is reflected in the fair value of these assets. |
149
Market turmoil exposures continued
Credit valuation adjustments continued
Credit derivative product companies (CDPC)
A CDPC is a company that sells protection on credit derivatives. CDPCs are similar to monoline insurers, however, they are not regulated as insurers.
The Group has purchased credit protection from CDPCs through tranched and single name credit derivatives. The Group’s exposure to CDPCs is predominantly due to tranched credit derivatives (tranches). A tranche references a portfolio of loans and bonds and provides protection against total portfolio default losses exceeding a certain percentage of the portfolio notional (the attachment point) up to another percentage (the detachment point). The Group has predominantly traded senior tranches with CDPCs, the average attachment and detachment points are 15% and 51% respectively (2008 – 16% and 50% respectively), and the majority of the loans and bonds in the reference portfolios are investment grade.
The gross mark-to-market of the CDPC protection is determined using industry standard models. The methodology employed to calculate the CDPC CVA is different to that outlined above for monolines, as there are no market observable credit spreads and recovery levels for these entities. The level of expected loss on CDPC exposures is estimated by analysing the underlying trades and the cost of hedging expected default losses in excess of the capital available in each vehicle.
A summary of the Group’s exposure to CDPCs is detailed below:
| 2009 | 2008 | 2007 | ||||||||||
| £m | £m | £m | ||||||||||
Gross exposure to CDPCs | 1,275 | 4,776 | 863 | |||||||||
Credit valuation adjustment | (499 | ) | (1,311 | ) | (44 | ) | ||||||
Net exposure to CDPCs | 776 | 3,465 | 819 | |||||||||
CVA as a % of gross exposure | 39 | % | 27 | % | 5 | % | ||||||
| Key points |
| · | The exposure to CDPCs reduced significantly during the year mainly due to a combination of tighter credit spreads of the underlying reference loans and bonds, and a decrease in the relative value of senior tranches compared with the underlying reference portfolios. The trades with CDPCs are predominantly US and Canadian dollar denominated, and the strengthening of sterling against the US dollar has further reduced the exposure, partially off-set by the weakening of sterling against the Canadian dollar. |
| · | The overall level of CVA decreased, in line with the reduction in exposure to these counterparties, however on a relative basis the CVA increased from 27% to 39%. This reflects the perceived deterioration of the credit quality of the CDPCs as reflected by ratings down-grades. Further analysis of the Group’s exposure to CDPCs by counterparty credit rating is shown in the following table. |
RWAs*
Counterparty and credit RWAs relating to gross CDPC exposures increased from £5.0 billion to £7.5 billion over the year. In addition regulatory capital deductions of £347 million were taken at the end of the year (2008 – nil).
| * unaudited |
150
Market turmoil exposures continued Credit valuation adjustments continued Credit derivative product companies (CDPC) continued The table below summarises CDPC exposures by rating. |
| Notional | Fair value: | |||||||||||||||||||
| amount: | protected | Credit | Net | |||||||||||||||||
| protected | reference | Gross | valuation | exposure to | ||||||||||||||||
| assets | assets | exposure | adjustment | CDPCs | ||||||||||||||||
2009 | £m | £m | £m | £m | £m | |||||||||||||||
AAA rated | 1,658 | 1,637 | 21 | 5 | 16 | |||||||||||||||
BBB rated | 1,070 | 1,043 | 27 | 9 | 18 | |||||||||||||||
Sub-investment grade | 17,696 | 16,742 | 954 | 377 | 577 | |||||||||||||||
Rating withdrawn | 3,926 | 3,653 | 273 | 108 | 165 | |||||||||||||||
| 24,350 | 23,075 | 1,275 | 499 | 776 | ||||||||||||||||
2008 | ||||||||||||||||||||
AAA rated | 6,351 | 4,780 | 1,571 | 314 | 1,257 | |||||||||||||||
AA rated | 12,741 | 10,686 | 2,055 | 594 | 1,461 | |||||||||||||||
A rated | 1,546 | 1,321 | 225 | 79 | 146 | |||||||||||||||
BBB rated | 4,601 | 3,676 | 925 | 324 | 601 | |||||||||||||||
| 25,239 | 20,463 | 4,776 | 1,311 | 3,465 | ||||||||||||||||
2007 | ||||||||||||||||||||
AAA rated | 20,605 | 19,742 | 863 | 44 | 819 | |||||||||||||||
| Key points |
| · | Nearly all of the current exposure is to CDPCs that are either sub-investment grade or have had their rating withdrawn in 2009. The majority of CDPC counterparties suffered rating downgrades during the year. |
| · | £750 million of the net exposure at 31 December 2009 is in the Non-Core division, including all of the sub-investment grade exposure. |
| The net income statement effect arising from CDPC exposures is shown in the table below. |
| £m | ||||
Credit valuation adjustment at 1 January 2009 | (1,311 | ) | ||
Credit valuation adjustment at 31 December 2009 | (499 | ) | ||
Decrease in credit valuation adjustment | 812 | |||
Net debit relating to hedges, foreign exchange and other movements | (1,769 | ) | ||
Net debit to income statement (income from trading activities) | (957 | ) |
| Key points |
| · | The Group has additional hedges in place which effectively cap the exposure to CDPCs where the Group has significant risk. As the exposure to these CDPCs has reduced, losses have been incurred on the additional hedges. |
| · | These losses, together with losses arising on trades hedging CVA, are the primary components of the £1.8 billion above. |
151
Market turmoil exposures continued
Credit valuation adjustments continued
CVA attributable to other counterparties
The CVA for all other counterparties is calculated on a portfolio basis reflecting an estimate of the amount a third party would charge to assume the credit risk.
Expected losses are determined from the market implied probability of defaults and internally assessed recovery levels. The probability of default is calculated with reference to observable credit spreads and observable recovery levels. For counterparties where observable data do not exist, the probability of default is determined from the average credit spreads and recovery levels of baskets of similarly rated entities. A weighting of 50% to 100% is applied to arrive at the CVA. The weighting reflects portfolio churn and varies according to the counterparty credit quality.
Expected losses are applied to estimated potential future exposures which are modelled to reflect the volatility of the market factors which drive the exposures and the correlation between those factors. Potential future exposures arising from vanilla products (including interest rate and foreign exchange derivatives) are modelled jointly using the Group’s core counterparty risk systems. At 31 December 2009, over 75% of the Group’s CVA held in relation to other counterparties arises on these vanilla products. The exposures arising from all other product types are modelled and assessed individually. The potential future exposure to each counterparty is the aggregate of the exposures arising on the underlying product types.
Correlation between exposure and counterparty risk is also incorporated within the CVA calculation where this risk is considered significant. The risk primarily arises on trades with emerging market counterparties where the gross mark-to-market value of the trade, and therefore the counterparty exposure, increases as the strength of the local currency declines.
Collateral held under a credit support agreement is factored into the CVA calculation. In such cases where the Group holds collateral against counterparty exposures, CVA is held to the extent that residual risk remains.
CVA is held against exposures to all counterparties with the exception of the CDS protection that the Group has purchased from HMT, as part of its participation in the APS, due to the unique features of this derivative.
The net income statement effect arising from the change in level of CVA for all other counterparties and related trades is shown in the table below.
| £m | ||||
Credit valuation adjustment at 1 January 2009 | (1,738 | ) | ||
Credit valuation adjustment at 31 December 2009 | (1,588 | ) | ||
Decrease in credit valuation adjustment | 150 | |||
Net debit relating to hedges, foreign exchange and other movements | (841 | ) | ||
Net debit to income statement (income from trading activities) | (691 | ) |
| Key points |
| • | Losses arose on trades hedging the CVA held against other counterparties due to the tightening of credit spreads. These losses, together with realised losses from counterparty defaults, are the primary cause of the loss arising on foreign exchange, hedges, realisations and other movements. |
| • | The net income statement effect was driven by updates to the CVA methodology, hedges and realised defaults off-setting CVA movements. |
| – | The primary update applied to the CVA methodology reflected a market wide shift in the approach to pricing and managing counterparty risk. The methodology change related to the calculation of the probability of default. The basis for this calculation moved from a blended market implied and historic measure to the market implied methodology set out above. Other updates to the methodology were made to reflect the correlation between exposure and counterparty risk. |
| – | Prior to the update to the CVA methodology, CVA moves driven by changes to the historic element of the blended measure were not hedged, resulting in losses during the year arising from related CVA increases. |
| – | The CVA is calculated on a portfolio basis and reflects an estimate of the losses that will arise across the portfolio due to counterparty defaults. It is not possible to perfectly hedge the risks driving the CVA and this leads to differences between CVA and hedge movements. Differences also arise between realised default losses and the proportion of CVA held in relation to individual counterparties. |
152
Market turmoil exposures continued
Leveraged finance
Leveraged finance is commonly employed to facilitate corporate finance transactions, such as acquisitions or buy-outs, and is so called due to the high ratio of debt to equity (leverage) common in such transactions. A bank acting as a lead manager for a leveraged finance transaction will typically underwrite a loan, alone or with others, and then syndicate the loan to other participants. The Group typically held a portion of these loans as part of its long-term portfolio once primary syndication is completed (‘hold portfolio’). Most of the leveraged finance loans held as part of the syndicated lending portfolio were reclassified from held-for-trading to loans and receivables with effect from 1 July 2008.
Leveraged finance provided by the Group that has been drawn down by the counterparty is reported on the balance sheet in loans and advances. Undrawn amounts of the facility provided to the borrower are reported in memorandum items – commitments to lend.
The table below shows the Group’s global markets sponsor-led leveraged finance exposures by industry and geography. The gross exposure represents the total amount of leveraged finance committed by the Group (drawn and undrawn). The net exposure represents the balance sheet carrying values of drawn leveraged finance and the total undrawn amount. The difference between gross and net exposures is principally due to the cumulative effect of impairment provisions and historic write-downs on assets prior to reclassification.
| 2009 | 2008 | |||||||||||||||||||||||||||||||||||||||
| Other | Other | |||||||||||||||||||||||||||||||||||||||
| Americas | UK | Europe | RoW | Total | Americas | UK | Europe | RoW | Total | |||||||||||||||||||||||||||||||
| £m | £m | £m | £m | £m | £m | £m | £m | £m | £m | |||||||||||||||||||||||||||||||
Gross exposure: | ||||||||||||||||||||||||||||||||||||||||
TMT (2) | 1,781 | 1,656 | 1,081 | 605 | 5,123 | 2,507 | 1,484 | 2,001 | 535 | 6,527 | ||||||||||||||||||||||||||||||
Industrial | 1,584 | 1,523 | 1,781 | 207 | 5,095 | 1,686 | 1,612 | 1,924 | 188 | 5,410 | ||||||||||||||||||||||||||||||
Retail | 17 | 476 | 1,354 | 71 | 1,918 | 268 | 1,285 | 1,440 | 89 | 3,082 | ||||||||||||||||||||||||||||||
Other | 244 | 1,527 | 1,168 | 191 | 3,130 | 487 | 1,391 | 1,282 | 126 | 3,286 | ||||||||||||||||||||||||||||||
| 3,626 | 5,182 | 5,384 | 1,074 | 15,266 | 4,948 | 5,772 | 6,647 | 938 | 18,305 | |||||||||||||||||||||||||||||||
Net exposure: | ||||||||||||||||||||||||||||||||||||||||
TMT (2) | 1,502 | 1,532 | 1,045 | 590 | 4,669 | 2,247 | 1,385 | 1,982 | 534 | 6,148 | ||||||||||||||||||||||||||||||
Industrial | 524 | 973 | 1,594 | 205 | 3,296 | 607 | 1,157 | 1,758 | 186 | 3,708 | ||||||||||||||||||||||||||||||
Retail | 17 | 445 | 1,282 | 68 | 1,812 | 223 | 978 | 1,424 | 89 | 2,714 | ||||||||||||||||||||||||||||||
Other | 244 | 1,461 | 1,147 | 191 | 3,043 | 484 | 1,307 | 1,281 | 127 | 3,199 | ||||||||||||||||||||||||||||||
| 2,287 | 4,411 | 5,068 | 1,054 | 12,820 | 3,561 | 4,827 | 6,445 | 936 | 15,769 | |||||||||||||||||||||||||||||||
Of which: | ||||||||||||||||||||||||||||||||||||||||
Drawn | 1,944 | 3,737 | 3,909 | 950 | 10,540 | 2,511 | 4,125 | 5,159 | 824 | 12,619 | ||||||||||||||||||||||||||||||
Undrawn | 343 | 674 | 1,159 | 104 | 2,280 | 1,050 | 702 | 1,286 | 112 | 3,150 | ||||||||||||||||||||||||||||||
| 2,287 | 4,411 | 5,068 | 1,054 | 12,820 | 3,561 | 4,827 | 6,445 | 936 | 15,769 | |||||||||||||||||||||||||||||||
| Notes: |
(1) | All the above exposures are in Non-Core. |
(2) | Telecommunications, media and technology. |
(3) | There were no held-for-trading exposures at 31 December 2009 (2008 – £102 million). |
At 31 December 2007 the carrying value of the Group’s syndicated loan book was £14,582 million, comprised of £12,041 million of held-for-trading positions and £2,541 million classified as loans and receivables. Of this balance, £8,874 million was drawn and £5,708 million was undrawn. |
153
Business review
Risk, capital and liquidity management
Market turmoil exposures continued
Leveraged finance continued
The table below analyses the movements in leveraged finance exposures for the year.
| Drawn | Undrawn | Total | ||||||||||
| £m | £m | £m | ||||||||||
| Balance at 1 January 2009 | 12,619 | 3,150 | 15,769 | |||||||||
| Transfers in (from credit trading business) | 563 | 41 | 604 | |||||||||
| Sales | (247 | ) | (144 | ) | (391 | ) | ||||||
| Repayments and facility reductions | (934 | ) | (392 | ) | (1,326 | ) | ||||||
| Funded deals | 166 | (166 | ) | — | ||||||||
| Lapsed/collapsed deals | — | (19 | ) | (19 | ) | |||||||
| Changes in fair value | (31 | ) | — | (31 | ) | |||||||
| Accretion of interest | 100 | — | 100 | |||||||||
| Impairment provisions | (1,041 | ) | — | (1,041 | ) | |||||||
| Exchange and other movements | (655 | ) | (190 | ) | (845 | ) | ||||||
| Balance at 31 December 2009 | 10,540 | 2,280 | 12,820 | |||||||||
Key points
| · | Since the beginning of the credit market dislocation in the second half of 2007, investor appetite for leveraged loans and similar risky assets has fallen dramatically, with higher perceived risk of default due to the leverage involved. Furthermore, secondary prices of leveraged loans traded fell due to selling pressure and margins increasing, as well as reduced activity in the primary market. |
| · | During 2009 the Group’s sterling exposure has declined, largely as a result of the weakening of the US dollar and euro against sterling during the period. |
| · | There have also been a number of credit impairments and write-offs during 2009, including some names which the Group previously held as part of its syndicate portfolio. |
| · | Early repayments as a result of re-financings have further reduced the exposure. |
Not included in the table above are:
| · | UK Corporate leveraged finance net exposures of £7.1 billion at 31 December 2009 (2008 – £6.9 billion) related to debt and banking facilities provided to UK mid-corporates. Of this, £1.4 billion related to facilities provided to client in the retail sector and £2.1 billion to the industrial sector (2008 – £1.4 billion and £2.5 billion respectively). |
| · | Ulster Bank leveraged finance net exposures of £0.6 billion at 31 December 2009 (2008 – £0.7 billion). |
Special purpose entities (SPEs)
The Group arranges securitisations to facilitate client transactions and undertakes securitisations to sell financial assets or to fund specific portfolios of assets. The Group also acts as an underwriter and depositor in securitisation transactions involving both client and proprietary transactions. In a securitisation, assets, or interests in a pool of assets, are transferred generally to a special purpose entity (SPE) which then issues liabilities to third party investors. SPEs are vehicles established for a specific, limited purpose, usually do not carry out a business or trade and typically have no employees. They take a variety of legal forms –trusts, partnerships and companies – and fulfil many different functions. As well as being a key element of securitisations, SPEs are also used in fund management activities to segregate custodial duties from the fund management advice provided by the Group.
It is primarily the extent of risks and rewards assumed that determines whether these entities are consolidated in the Group’s financial statements. The following section aims to address the significant exposures which arise from the Group’s activities through specific types of SPEs.
The Group sponsors and arranges own-asset securitisations, whereby the sale of assets or interests in a pool of assets into an SPE is financed by the issuance of securities to investors. The pool of assets held by the SPE may be originated by the Group, or (in the case of whole loan programmes) purchased from third parties, and may be of varying credit quality. Investors in the debt securities issued by the SPE are rewarded through credit-linked returns, according to the credit rating of their securities. The majority of securitisations are supported through liquidity facilities, other credit enhancements and derivative hedges extended by financial institutions, some of which offer protection against initial defaults in the pool of assets. Thereafter, losses are absorbed by investors in the lowest ranking notes in the priority of payments. Investors in the most senior ranking debt securities are typically shielded from loss, since any subsequent losses may trigger repayment of their initial principal.
154
Business review continued
Market turmoil exposures continued
Special purpose entities continued
The Group also employs synthetic structures, where assets are not sold to the SPE, but credit derivatives are used to transfer the credit risk of the assets to an SPE. Securities may then be issued by the SPE to investors, on the back of the credit protection sold to the Group by the SPE.
Residential and commercial mortgages and credit card receivables form the types of assets generally included in cash securitisations, while corporate loans and commercial mortgages typically serve as reference obligations in synthetic securitisations.
The Group sponsors own-asset securitisations as a way of diversifying funding sources, managing specific risk concentrations, and achieving capital efficiency. The Group purchases the securities issued in own-asset securitisations. During 2008, the Group was able to pledge AAA-rated asset-backed securities as collateral for repurchase agreements with major central banks under schemes such as the Bank of England’s Special Liquidity Scheme, launched in April 2008, which allowed banks to temporarily swap high-quality mortgage-backed and other securities for liquid UK treasury bills. This practice has contributed to the Group’s sources of funding during 2008 and 2009 in the face of the contraction in the UK market for inter-bank lending and the investor base for securitisations.
The Group typically does not retain the majority of risks and rewards of own-asset securitisations set up for the purposes of risk diversification and capital efficiency, where the majority of investors tend to be third parties. Therefore, the Group typically does not consolidate the related SPEs.
The Group has also established whole loan securitisation programmes in the US and UK where assets originated by third parties are warehoused by the Group for securitisation. The majority of these vehicles are not consolidated by the Group, as it is not exposed to the risks and rewards of ownership.
The table below sets out the asset categories together with the carrying amount of the assets and associated liabilities for those securitisations and other asset transfers, other than conduits (discussed below), where the assets continue to be recorded on the Group’s balance sheet.
| 2009 | 2008 | 2007 | ||||||||||||||||||||||
| Assets | Liabilities | Assets | Liabilities | Assets | Liabilities | |||||||||||||||||||
| £m | £m | £m | £m | £m | £m | |||||||||||||||||||
| Residential mortgages | 69,927 | 15,937 | 55,714 | * | 20,075 | 23,652 | 23,436 | |||||||||||||||||
| Credit card receivables | 2,975 | 1,592 | 3,004 | 3,197 | 2,948 | 2,664 | ||||||||||||||||||
| Other loans | 36,448 | 1,010 | 1,679 | 1,071 | 1,703 | 1,149 | ||||||||||||||||||
| Finance lease receivables | 597 | 597 | 1,077 | 857 | 1,038 | 823 | ||||||||||||||||||
| * revised | ||||||||||||||||||||||||
Key points
| · | The increase in both residential mortgages and other loan assets in the year principally relates to assets securitised to facilitate access to central bank liquidity schemes. |
| · | As all notes issued by own-asset securitisation SPEs are purchased by Group companies, assets are significantly greater than securitised liabilities. |
Conduits
The Group sponsors and administers a number of asset-backed commercial paper (ABCP) conduits. A conduit is an SPE that issues commercial paper and uses the proceeds to purchase or fund a pool of assets. The commercial paper is secured on the assets and is redeemed either by further commercial paper issuance, repayment of assets or funding from liquidity facilities. Commercial paper is typically short-dated, usually up to three months.
Group-sponsored conduits can be divided into multi-seller conduits and own-asset conduits. The Group consolidates both types of conduit where the substance of the relationship between the Group and the conduit vehicle is such that the vehicle is controlled by the Group. The total assets held by Group-sponsored conduits were £27.4 billion at 31 December 2009 (2008 – £49.9 billion). Liquidity commitments from the Group to the conduit exceed the nominal amount of assets funded by the conduit as liquidity commitments are sized to cover the funding cost of the related assets.
Group-sponsored multi-seller conduits
The multi-seller conduits were established by the Group for the purpose of providing its clients with access to diversified and flexible funding sources. A multi-seller conduit typically purchases or funds assets originated by the banks’ clients. The multi-seller conduits account for 43% of the total liquidity and credit enhancements committed by the Group at 31 December 2009 (2008 – 69.4%).
The Group sponsors six multi-seller conduits which finance assets from Europe, North America and Asia-Pacific. Assets purchased or financed by the multi-seller conduits include auto loans, residential mortgages, credit card receivables, consumer loans and trade receivables.
155
Business review
Risk, capital and liquidity management
Market turmoil exposures continued
Special purpose entities continued
Conduits continued
The third-party assets financed by the conduits receive credit enhancement from the originators of the assets. This credit enhancement, which is specific to each transaction can take the form of over-collateralisation, excess spread or subordinated loan, and typically ensures the asset acquired by the conduit has a rating equivalent to at least a single-A credit. In addition, in line with general market practice, the Group provides a small second-loss layer of programme-wide protection to the multi-seller conduits. Given the nature and investment grade equivalent quality of the first loss enhancement provided by the originators of the assets, the Group has only a minimal risk of loss on its programme-wide exposure. The issued ABCP is rated A-1/P-1 by Moody’s and Standard & Poor’s.
The Group provides liquidity back-up facilities to the conduits it sponsors. The conduits are able to draw funding under these facilities in the event of a disruption in the ABCP market, or when certain trigger events prevent the issue of ABCP.
Key points
| · | The maturity of commercial paper issued by the Group’s conduits is managed to mitigate the short-term contingent liquidity risk of providing back-up facilities. The Group’s limits sanctioned for such liquidity facilities at 31 December 2009 totalled approximately £25.0 billion (2008 – £42.9 billion). For a very small number of transactions within one multi-seller conduit the liquidity facilities have been provided by third-party banks. This typically occurs on transactions where the third-party bank does not use, or have, its own conduit vehicles. |
| · | The Group’s maximum exposure to loss on its multi-seller conduits is £25.2 billion (2008 – £43.2 billion), being the total amount of the Group’s liquidity commitments plus the extent of programme-wide credit enhancements of conduit assets for which liquidity facilities were provided by third parties. |
| · | The Group’s multi-seller conduits have continued to fund the vast majority of their assets solely through ABCP issuance. There have been no significant systemic failures within the financial markets similar to that experienced in the second half of 2008 following Lehman Brothers bankruptcy filing in September 2008. The improvement in market conditions has allowed these conduits to move towards more normal ABCP funding and reduced the need for backstop funding from the Group. |
Group-sponsored own-asset conduits
The Group’s own-asset conduit programmes have been established to diversify the Group’s funding sources. The conduits allow the Group to access central government funding schemes and the ABCP market.
The Group holds three own-asset conduits which have assets that have previously been funded by the Group. These vehicles represent 56% (2008 – 25%) of the Group’s conduit business (as a percentage of the total liquidity and credit enhancements committed by the Group), with £7.7 billion of ABCP outstanding at 31 December 2009 (2008 – £14.8 billion). The Group’s maximum exposure to loss on its own-asset conduits is £34.2 billion (2008 – £15.9 billion), being the total drawn and undrawn amount of the Group’s liquidity commitments to these conduits. This comprises committed liquidity of $40.8 billion (£25.1 billion) to an own-asset conduit established to access the Bank of England’s open market operations and £9.1 billion to other own-asset conduits. As the first of these conduits was established for contingent funding and at 31 December 2009 it had no commercial paper outstanding, the Group’s liquidity commitment to this conduit is not included in the table below.
Group exposure to consolidated conduits
The exposure to conduits which are consolidated by the Group is set out below.
| 2009 | ||||||||||||||||||||
| Core | Non-Core | Total | 2008 | 2007 | ||||||||||||||||
| £m | £m | £m | £m | £m | ||||||||||||||||
| Total assets held by the conduits | 23,409 | 3,957 | 27,366 | 49,857 | 48,070 | |||||||||||||||
| Commercial paper issued | 22,644 | 2,939 | 25,583 | 48,684 | 46,532 | |||||||||||||||
| Liquidity and credit enhancements: | ||||||||||||||||||||
| Deal specific liquidity: | ||||||||||||||||||||
| drawn | 738 | 1,059 | 1,797 | 1,172 | 1,537 | |||||||||||||||
| undrawn | 28,628 | 3,852 | 32,480 | 57,929 | 61,347 | |||||||||||||||
| Programme-wide liquidity: undrawn | — | — | — | — | 75 | |||||||||||||||
| PWCE (1) | 1,167 | 341 | 1,508 | 2,391 | 3,096 | |||||||||||||||
| 30,533 | 5,252 | 35,785 | 61,492 | 66,055 | ||||||||||||||||
| Maximum exposure to loss (2) | 29,365 | 4,911 | 34,276 | 59,101 | 62,959 | |||||||||||||||
Notes:
| (1) | Programme-wide credit enhancement. |
| (2) | Maximum exposure to loss is determined as the Group’s total liquidity commitments to the conduits and additionally programme-wide credit support which would absorb first loss on transactions where liquidity support is provided by a third party. Third party maximum exposure to loss is reduced by repo trades conducted with an external counterparty. |
156
Business review continued
Market turmoil exposures continued
Special purpose entities continued
Conduits continued
During the period both multi-seller and own asset conduit assets have been reduced in line with the wider Group balance sheet management.
Collateral analysis, profile, credit ratings and weighted average lives relating to the Group’s consolidated conduits are detailed below.
| Funded assets | ||||||||||||||||||||||||
| Liquidity for | Total | |||||||||||||||||||||||
| Loan | Securities | Total | Undrawn | third parties | exposure | |||||||||||||||||||
| 2009 | £m | £m | £m | £m | £m | £m | ||||||||||||||||||
| Auto loans | 4,293 | 356 | 4,649 | 2,526 | — | 7,175 | ||||||||||||||||||
| Corporate loans | 106 | 7,695 | 7,801 | 161 | — | 7,962 | ||||||||||||||||||
| Credit card receivables | 4,083 | — | 4,083 | 1,058 | — | 5,141 | ||||||||||||||||||
| Trade receivables | 806 | — | 806 | 1,351 | — | 2,157 | ||||||||||||||||||
| Student loans | 915 | — | 915 | 263 | (132 | ) | 1,046 | |||||||||||||||||
| Consumer loans | 1,686 | — | 1,686 | 222 | — | 1,908 | ||||||||||||||||||
| Mortgages: | ||||||||||||||||||||||||
| Prime | 2,739 | 3 | 2,742 | 750 | — | 3,492 | ||||||||||||||||||
| Non-conforming | 1,548 | — | 1,548 | 193 | — | 1,741 | ||||||||||||||||||
| Commercial | 413 | 458 | 871 | 155 | (22 | ) | 1,004 | |||||||||||||||||
| Other | 872 | 1,393 | 2,265 | 232 | (12 | ) | 2,485 | |||||||||||||||||
| 17,461 | 9,905 | 27,366 | 6,911 | (166 | ) | 34,111 | ||||||||||||||||||
| 2008 | ||||||||||||||||||||||||
| Auto loans | 9,924 | 383 | 10,307 | 1,871 | — | 12,178 | ||||||||||||||||||
| Corporate loans | 430 | 11,042 | 11,472 | 534 | — | 12,006 | ||||||||||||||||||
| Credit card receivables | 5,844 | — | 5,844 | 922 | — | 6,766 | ||||||||||||||||||
| Trade receivables | 2,745 | — | 2,745 | 1,432 | (71 | ) | 4,106 | |||||||||||||||||
| Student loans | 2,555 | — | 2,555 | 478 | (132 | ) | 2,901 | |||||||||||||||||
| Consumer loans | 2,371 | — | 2,371 | 409 | — | 2,780 | ||||||||||||||||||
| Mortgages: | ||||||||||||||||||||||||
| Prime | 4,416 | 2,250 | 6,666 | 1,188 | — | 7,854 | ||||||||||||||||||
| Non-conforming | 2,181 | — | 2,181 | 727 | — | 2,908 | ||||||||||||||||||
| Commercial | 1,228 | 507 | 1,735 | 66 | (23 | ) | 1,778 | |||||||||||||||||
| Other | 1,851 | 2,130 | 3,981 | 1,615 | — | 5,596 | ||||||||||||||||||
| 33,545 | 16,312 | 49,857 | 9,242 | (226 | ) | 58,873 | ||||||||||||||||||
| 2007 | ||||||||||||||||||||||||
| Auto loans | 8,066 | 578 | 8,644 | 3,701 | (102 | ) | 12,243 | |||||||||||||||||
| Corporate loans | 36 | 8,927 | 8,963 | 1,390 | — | 10,353 | ||||||||||||||||||
| Credit card receivables | 5,104 | 90 | 5,194 | 1,206 | — | 6,400 | ||||||||||||||||||
| Trade receivables | 3,068 | 320 | 3,388 | 2,386 | — | 5,774 | ||||||||||||||||||
| Student loans | 335 | 262 | 597 | 1,082 | (132 | ) | 1,547 | |||||||||||||||||
| Consumer loans | 1,886 | — | 1,886 | 403 | — | 2,289 | ||||||||||||||||||
| Mortgages: | ||||||||||||||||||||||||
| Prime | 4,424 | 2,263 | 6,687 | 664 | — | 7,351 | ||||||||||||||||||
| Non-conforming | 2,343 | 234 | 2,577 | 740 | — | 3,317 | ||||||||||||||||||
| Sub-prime | 9 | 117 | 126 | 363 | — | 489 | ||||||||||||||||||
| Commercial | 799 | 1,094 | 1,893 | 168 | (23 | ) | 2,038 | |||||||||||||||||
Buy-to-let | — | 61 | 61 | 8 | — | 69 | ||||||||||||||||||
| CDOs | — | 2,129 | 2,129 | 268 | — | 2,397 | ||||||||||||||||||
| Other | 2,976 | 2,947 | 5,923 | 2,433 | — | 8,356 | ||||||||||||||||||
| 29,046 | 19,022 | 48,068 | 14,812 | (257 | ) | 62,623 | ||||||||||||||||||
157
Business review
Risk, capital and liquidity management
Market turmoil exposures continued
Special purpose entities continued
Conduits continued
Group exposure to consolidated conduits
| CP funded assets | ||||||||||||||||||||||||||||||||||||||||||||
| Geographic distribution | Credit ratings (S&P equivalent) | |||||||||||||||||||||||||||||||||||||||||||
| Other | Weighted | Below | ||||||||||||||||||||||||||||||||||||||||||
| UK | Europe | US | RoW | Total | average | AAA | AA | A | BBB | BBB | ||||||||||||||||||||||||||||||||||
| 2009 | £m | £m | £m | £m | £m | life years | £m | £m | £m | £m | £m | |||||||||||||||||||||||||||||||||
| Auto loans | 476 | 982 | 2,621 | 570 | 4,649 | 1.8 | 2,965 | 1,547 | 137 | — | — | |||||||||||||||||||||||||||||||||
| Corporate loans | 312 | 5,213 | 1,411 | 865 | 7,801 | 1.0 | 7,584 | 111 | 106 | — | — | |||||||||||||||||||||||||||||||||
| Credit card receivables | 177 | — | 3,823 | 83 | 4,083 | 0.8 | 2,781 | 759 | 420 | 123 | — | |||||||||||||||||||||||||||||||||
| Trade receivables | — | 334 | 438 | 34 | 806 | 0.7 | 446 | 266 | 60 | 34 | — | |||||||||||||||||||||||||||||||||
| Student loans | 117 | — | 798 | — | 915 | 0.7 | 798 | 117 | — | — | — | |||||||||||||||||||||||||||||||||
| Consumer loans | 733 | 800 | 153 | — | 1,686 | 1.5 | 68 | 50 | 1,553 | 15 | — | |||||||||||||||||||||||||||||||||
| Mortgages: | ||||||||||||||||||||||||||||||||||||||||||||
| Prime | 138 | — | — | 2,604 | 2,742 | 3.1 | 949 | 1,746 | 28 | 3 | 16 | |||||||||||||||||||||||||||||||||
| Non-conforming | 599 | 949 | — | — | 1,548 | 3.7 | 1,070 | 379 | 99 | — | — | |||||||||||||||||||||||||||||||||
| Sub-prime | — | — | — | — | — | — | — | — | — | — | — | |||||||||||||||||||||||||||||||||
| Commercial | 641 | 194 | — | 36 | 871 | 14.7 | 25 | 3 | 840 | — | 3 | |||||||||||||||||||||||||||||||||
| Other | 121 | 670 | 298 | 1,176 | 2,265 | 2.3 | 170 | 249 | 950 | 896 | — | |||||||||||||||||||||||||||||||||
| 3,314 | 9,142 | 9,542 | 5,368 | 27,366 | 1.9 | 16,856 | 5,227 | 4,193 | 1,071 | 19 | ||||||||||||||||||||||||||||||||||
| 2008 | ||||||||||||||||||||||||||||||||||||||||||||
| Auto loans | 801 | 1,706 | 7,402 | 398 | 10,307 | 1.7 | 6,075 | 883 | 3,349 | — | — | |||||||||||||||||||||||||||||||||
| Corporate loans | 1,714 | 4,347 | 3,289 | 2,122 | 11,472 | 4.9 | 10,767 | 132 | 573 | — | — | |||||||||||||||||||||||||||||||||
| Credit card receivables | 633 | — | 4,999 | 212 | 5,844 | 0.7 | 3,465 | 62 | 2,171 | 146 | — | |||||||||||||||||||||||||||||||||
| Trade receivables | 68 | 922 | 1,371 | 384 | 2,745 | 0.7 | 120 | 1,025 | 1,600 | — | — | |||||||||||||||||||||||||||||||||
| Student loans | 144 | — | 2,411 | — | 2,555 | 0.3 | 2,296 | 144 | 115 | — | — | |||||||||||||||||||||||||||||||||
| Consumer loans | 708 | 1,195 | 468 | — | 2,371 | 1.7 | 387 | 993 | 923 | 68 | — | |||||||||||||||||||||||||||||||||
| Mortgages: | ||||||||||||||||||||||||||||||||||||||||||||
| Prime | — | 2,244 | — | 4,422 | 6,666 | 2.8 | 2,675 | 3,876 | 115 | — | — | |||||||||||||||||||||||||||||||||
| Non-conforming | 960 | 1,221 | — | — | 2,181 | 4.6 | 351 | 368 | 475 | 987 | — | |||||||||||||||||||||||||||||||||
| Commercial | 713 | 453 | 74 | 495 | 1,735 | 11.0 | 274 | 518 | 474 | 469 | — | |||||||||||||||||||||||||||||||||
| Other | 166 | 1,198 | 684 | 1,933 | 3,981 | 1.2 | 3 | 958 | 2,786 | 234 | — | |||||||||||||||||||||||||||||||||
| 5,907 | 13,286 | 20,698 | 9,966 | 49,857 | 3.0 | 26,413 | 8,959 | 12,581 | 1,904 | — | ||||||||||||||||||||||||||||||||||
| 2007 | �� | |||||||||||||||||||||||||||||||||||||||||||
| Auto loans | 2,250 | 1,259 | 4,793 | 341 | 8,643 | 1.9 | 1,457 | 3,184 | 3,940 | 62 | — | |||||||||||||||||||||||||||||||||
| Corporate loans | 1,127 | 1,551 | 4,658 | 1,627 | 8,963 | 6.5 | 8,838 | 15 | 110 | — | — | |||||||||||||||||||||||||||||||||
| Credit card receivables | 654 | — | 4,402 | 138 | 5,194 | 1.0 | 1,286 | 913 | 2,848 | 147 | — | |||||||||||||||||||||||||||||||||
| Trade receivables | 299 | 816 | 1,965 | 309 | 3,389 | 0.9 | 187 | 732 | 2,183 | 236 | 51 | |||||||||||||||||||||||||||||||||
| Student loans | 140 | — | 457 | — | 597 | 1.6 | 270 | 311 | 16 | — | — | |||||||||||||||||||||||||||||||||
| Consumer loans | 648 | 724 | 514 | — | 1,886 | 1.2 | 1,018 | 473 | 395 | — | — | |||||||||||||||||||||||||||||||||
| Mortgages: | ||||||||||||||||||||||||||||||||||||||||||||
| Prime | 276 | 565 | 983 | 4,863 | 6,687 | 3.3 | 1,896 | 2,181 | 2,610 | — | — | |||||||||||||||||||||||||||||||||
| Non-conforming | 1,675 | 833 | — | 69 | 2,577 | 5.1 | 268 | 1,596 | 713 | — | — | |||||||||||||||||||||||||||||||||
| Sub-prime | — | — | 9 | 117 | 126 | 0.2 | 117 | — | 9 | — | — | |||||||||||||||||||||||||||||||||
| Commercial | 1,023 | 233 | 198 | 439 | 1,893 | 9.6 | 746 | 630 | 401 | 116 | — | |||||||||||||||||||||||||||||||||
Buy-to-let | 61 | — | — | — | 61 | — | 37 | 24 | — | — | — | |||||||||||||||||||||||||||||||||
| CDOs | 137 | 520 | 1,473 | — | 2,130 | 2.7 | 2,115 | 15 | — | — | — | |||||||||||||||||||||||||||||||||
| Other | 579 | 1,071 | 1,950 | 2,323 | 5,923 | 2.8 | 2,362 | 784 | 2,652 | 125 | — | |||||||||||||||||||||||||||||||||
| 8,869 | 7,572 | 21,402 | 10,226 | 48,069 | 3.3 | 20,597 | 10,858 | 15,877 | 686 | 51 | ||||||||||||||||||||||||||||||||||
158
Business review continued
Market turmoil exposures continued
Special purpose entities continued
Third party sponsored conduits
The Group also extends liquidity commitments to multi-seller conduits sponsored by other banks, but typically does not consolidate these entities as the Group does not retain the majority of risks and rewards.
The Group’s exposure from third-party conduits is analysed below.
| 2009 | ||||||||||||||||||||
| Core | Non-Core | Total | 2008 | 2007 | ||||||||||||||||
| £m | £m | £m | £m | £m | ||||||||||||||||
| Liquidity and credit enhancements: | ||||||||||||||||||||
| Deal specific liquidity: | ||||||||||||||||||||
| drawn | 223 | 120 | 343 | 3,078 | 2,280 | |||||||||||||||
| undrawn | 206 | 38 | 244 | 198 | 490 | |||||||||||||||
| Programme-wide liquidity: | ||||||||||||||||||||
| drawn | — | — | — | 102 | 250 | |||||||||||||||
| undrawn | — | — | — | 504 | 899 | |||||||||||||||
| 429 | 158 | 587 | 3,882 | 3,919 | ||||||||||||||||
| Maximum exposure to loss (1) | 429 | 158 | 587 | 3,882 | 3,919 | |||||||||||||||
Note:
(1) | Maximum exposure to loss is determined as the Group’s total liquidity commitments to the conduits and additionally programme-wide credit support which would absorb first loss on transactions where liquidity support is provided by a third party. |
Structured investment vehicles*
The Group does not sponsor any structured investment vehicles.
Investment funds set up and managed by the Group*
The Group has established and manages a number of money market funds for its customers. When a new money market fund is launched, the Group typically provides a limited amount of seed capital to the funds. The Group has investments in these funds of £776 million at 31 December 2009 (2008 – £107 million). The investors in both money market and non-money market funds have recourse to the assets of the funds only. These funds are not consolidated by the Group.
At 31 December 2009 the Group had exposure to one fund amounting to £145 million (2008 – £144 million).
Money market funds
The Group’s money market funds held assets of £9.6 billion at 31 December 2009 (2008 – £13.6 billion). The sub-categories of money market funds are:
| · | £8.0 billion (2008 – £8.0 billion) in money market funds managed by the Group denominated in sterling, US dollars and euro. The funds invest in short-dated, highly rated money market securities with the objective of ensuring stability of capital and net asset value per share, appropriate levels of liquid assets, together with an income which is comparable to the short dated money market interest rate in the relevant currency. |
| · | £0.4 billion (2008 – £0.7 billion) in money market ‘Plus’ funds managed by the Group denominated in sterling, US dollars and euro. The funds invest in longer-dated, highly rated securities with the objective of providing enhanced returns over the average return on comparable cash deposits. |
| · | £1.2 billion (2008 – £4.9 billion) in third party multi-manager money market funds denominated in sterling, US dollars and euro. The funds invest in short dated, highly rated securities with the objective of maximising current income consistent with the preservation of capital and liquidity. |
Non-money market funds
The Group has also established a number of non-money market funds to enable investors to invest in a range of assets including bonds, equities, hedge funds, private equity and real estate. The Group’s non-money market funds had total assets of £14.9 billion at 31 December 2009 (2008 – £18.7 billion). The sub-categories of non-money market funds are:
| · | £1.1 billion (2008 – £1.6 billion) in committed capital to generate returns from equity and equity-like investments in private companies. |
| · | £13.4 billion (2008 – £16.0 billion) in third party, multi-manager funds. These funds offer multi-manager and fund of funds’ products across bond, equity, hedge fund, private equity and real estate asset classes. In January 2010, the Group entered into a sale agreement with Aberdeen Asset Management plc for assets of £13.3 billion in these funds. |
| · | £0.4 billion (2008 – £1.1 billion) in various derivative instruments with the objective of providing returns linked to the performance of underlying equity indices. |
* unaudited
159
Governance
Contents
| 161 | Board of directors and secretary |
| 163 | Report of the directors |
| 169 | Corporate governance |
| 179 | Letter from the Chairman of the Remuneration Committee |
| 181 | Directors’ remuneration report |
| 193 | Directors’ interests in shares |
| 194 | Statement of directors’ responsibilities |
160
Chairman
Philip Hampton (age 56)
N (Chairman)
Appointed to the Board on 19 January 2009 and as Chairman on 3 February 2009. Philip Hampton was previously chairman of J Sainsbury plc and group finance director of Lloyds TSB Group plc, BT Group plc, BG Group plc, British Gas and British Steel plc, an executive director of Lazards and a non-executive director of RMC Group plc. He is also former chairman of UK Financial Investments Limited, the company established to manage the UK Government's shareholding in banks subscribing to its recapitalisation fund, and is a non-executive director of Belgacom SA. Philip joined the Board of Anglo American plc as a non-executive director on 9 November 2009.
Executive directors
Stephen Hester (age 49)
Group Chief Executive
Appointed to the Board on 1 October 2008 and as Group Chief Executive on 21 November 2008, Stephen Hester was chief executive of The British Land Company PLC. He was previously chief operating officer of Abbey National plc and prior to that he held positions with Credit Suisse First Boston including Chief Financial Officer, Head of Fixed Income and co-Head of European Investment Banking. Between February and October 2008, he was non-executive deputy chairman of Northern Rock plc. He is also a trustee of The Foundation and Friends of the Royal Botanical Gardens, Kew.
Gordon Pell (age 60)
FCIBS, FCIB
Deputy Group Chief Executive
Appointed to the Board in March 2000, Gordon Pell was formerly group director of Lloyds TSB UK Retail Banking before joining National Westminster Bank Plc as a director in February 2000 and then becoming Chief Executive, Retail Banking. He is also a director of Race for Opportunity and a member of the FSA Practitioner Panel. He was appointed chairman of the Business Commission on Racial Equality in the Workplace in July 2006 and deputy chairman of the Board of the British Bankers Association in September 2007. He retired from the Board on 31 March 2010.
Bruce Van Saun (age 53)
Group Finance Director
Appointed to the Board on 1 October 2009, Bruce Van Saun has more than 25 years financial services experience. From 1997 to 2008 he held a number of senior positions with Bank of New York and later Bank of New York Mellon, most recently as vice chairman and chief financial officer and before that he was responsible for the Asset Management and Market Related businesses. Prior to that, he held senior positions with Deutsche Bank, Wasserstein Perella Group and Kidder Peabody & Co. He has served on several corporate boards as a non-executive director and has been active in numerous community organisations.
Group General Counsel and Group Secretary
Miller McLean (age 60)
FCIBS, FIB
Miller McLean was appointed Group Secretary in August 1994. He is a trustee of the Industry and Parliament Trust, non-executive chairman of The Whitehall and Industry Group, and immediate past president of the Chartered Institute of Bankers in Scotland. He will retire from the Group on 30 April 2010.
161
Non-executive directors
Colin Buchan* (age 55)
A, N, R (Chairman), Ri
Appointed to the Board in June 2002, Colin Buchan was educated in South Africa and spent the early part of his career in South Africa and the Far East. He has considerable international investment banking experience, as well as experience in very large risk management in the equities business. He was formerly a member of the group management board of UBS AG and head of equities of UBS Warburg, and was the former chairman of UBS Securities Canada Inc. He is chairman of Standard Life Investments Limited and a director of Standard Life plc and Black Rock World Mining Trust Plc. Colin is a fellow of the Chartered Institute of Bankers of Scotland.
Sandy Crombie* (age 61)
Senior Independent Director N, R, Ri
Appointed to the Board in June 2009, Sandy Crombie retired from his position as Group Chief Executive of Standard Life Plc on 31 December 2009. He has previously served as a director of the Association of British Insurers and a member of the Chancellor of the Exchequer’s High Level Group. In 2007, he was the Prince of Wales’ Ambassador for Corporate Social Responsibility in Scotland. He currently serves as Chairman of the Edinburgh UNESCO City of Literature Trust, as Vice Chairman of the Royal Scottish Academy of Music and Drama, and President of The Cockburn Association.
Penny Hughes* (age 50)
N, R
Penny Hughes joined the Board on 1 January 2010 and is currently a non-executive director of Home Retail Group plc and Cable & Wireless plc. Penny joined the board of Wm Morrisons Supermarkets plc on 1 January 2010. She is a former non-executive director of Gap Inc, Vodafone PLC and Reuters PLC. Penny chairs the Remuneration Committee of Home Retail Group. Penny was a director and chairman of the Remuneration Committee of Skandinaviska Enskilda Banken AB until she stepped down on 20 October 2009. Penny spent the majority of her executive career at Coca-Cola where she held a number of leadership positions. In 1992, she was appointed as President, Coca-Cola Great Britain and Ireland. She is also a Trustee of the British Museum and President of the Advertising Association.
Archie Hunter* (age 66)
A (Chairman), N, Ri
Appointed to the Board in September 2004, Archie Hunter is a chartered accountant. He was Scottish senior partner of KPMG between 1992 and 1999 and president of The Institute of Chartered Accountants of Scotland in 1997/98. He has extensive professional experience in the UK and North and South America. He is currently chairman of Macfarlane Group plc, a director of Edinburgh US Tracker Trust plc and a governor of the Beatson Institute for Cancer Research. He will retire from the Board with effect from the conclusion of the Group's Annual General Meeting on 28 April 2010.
Joe MacHale* (age 58)
A, N, Ri
Appointed to the Board in September 2004, Joe MacHale is currently a non-executive director and chairman of the remuneration committee of Brit Insurance Holdings plc, and a trustee and treasurer of MacMillan Cancer Support. He held a number of senior executive positions with J P Morgan between 1979 and 2001 and was latterly chief executive of J P Morgan Europe, Middle East and Africa Region. He is a fellow of the Institute of Chartered Accountants and the Chairman of Prytania Holdings LLP.
John McFarlane* (age 62)
N, R
Appointed to the Board on 1 October 2008, John McFarlane is former chief executive officer of Australia and New Zealand Banking Group Limited. Previously he was a group executive director of Standard Chartered and was head of Citicorp/Citibank in the UK and Ireland. He is currently a non-executive director of Westfield Holdings Limited and a director of Old Oak Holdings Limited. He is a former president of the International Monetary Conference and a former chairman of the Australian Bankers Association. He has previously served as a director of the London Stock Exchange and a member of the Auditing Practices Board.
Brendan Nelson* (age 60)
A, Ri, N
Brendan Nelson was appointed to the Board on 1 April 2010. Brendan became Global Chairman, Banking for KPMG in 1999 and became Global Chairman, Financial Services in 2002. He has held a range of senior leadership roles within KPMG including as a member of the KPMG UK board from 1999 until 2006 and as Vice Chairman from 2006. Brendan had overall responsibility for the Financial Services practice worldwide, which is the largest specialised industry group with KPMG and provides audit, tax, consulting and regulatory advisory services for a large range of organisations in every sector of the financial services industry. He has been a Board member of the Financial Services Skills Council since 2008 and was Chairman of the Audit Committee of the Institute of Chartered Accountants of Scotland from 2005 until 2008.
Arthur ‘Art’ Ryan* (age 67)
N
Appointed to the Board on 1 October 2008, Art Ryan is the former chairman, chief executive officer and president of Prudential Financial Inc. Previously he held senior positions with Chase Manhattan Bank NA. He is currently a non-executive director of Regeneron Pharmaceuticals Inc. and an active member of numerous community boards. He was a founding member of the Financial Services Forum.
Philip Scott* (age 55)
A, N, Ri (Chairman)
Appointed to the Board on 1 November 2009, Philip Scott has wide-ranging experience of financial services and risk management, including previous responsibility for Aviva's continental European and international life and long-term savings businesses. He has held a number of senior executive positions during his career at Aviva, including his role as Group Finance Director until January 2010. Philip is also an experienced non-executive director and is currently on the board of Diageo plc.
Abbreviations
A member of the Group Audit Committee
N member of the Nominations Committee
R member of the Remuneration Committee
Ri member of the Board Risk Committee
* independent non-executive director
162
Report of the directors
For certain developments relating to matters discussed in the Report of the directors, which is dated 24 February 2010, please see the “Recent developments” section of this document on page 6.
The directors present their report together with the audited accounts for the year ended 31 December 2009.
Capital restructuring
In November 2008, HM Treasury announced the establishment of UK Financial Investments Limited (UKFI), a company wholly owned by the UK Government which will manage, on an arms-length basis, the UK Government’s shareholding in the company and other banks that subscribed to the government’s recapitalisation fund.
On 19 January 2009 the company announced, in conjunction with HM Treasury and UKFI, that the £5 billion non-cumulative sterling preference shares held by HM Treasury would be replaced with new ordinary shares. Eligible shareholders were able to apply to subscribe for approximately £5 billion of new ordinary shares pro rata to their existing shareholdings at a fixed price of 31.75 pence per share by way of an open offer. Any shares not taken up by shareholders in the open offer (or otherwise placed on behalf of the company) were subscribed for by HM Treasury at a fixed price of 31.75 pence per share and the aggregate proceeds of the open offer were used to fund the redemption of the preference shares held by HM Treasury, together with the redemption premium on the preference shares, accrued dividend, and commissions payable to HM Treasury on the offer. The preference shares were redeemed on 14 April 2009 at 101% of their issue price. This resulted in HM Treasury’s shareholding increasing by 16,791,036,376 ordinary shares to 70.3% of the enlarged ordinary share capital of the company.
On 27 November 2009 the company announced, in conjunction with HM Treasury and UKFI, that it would issue £25.5 billion of new capital to HM Treasury. This new capital, issued on 22 December 2009, took the form of B shares, which do not generally carry voting rights at meetings of ordinary shareholders but which are convertible into ordinary shares and count as Core Tier 1 capital. Whilst the B shares themselves are entitled to the same dividends as ordinary shares, a Dividend Access Share was issued in conjunction with them. The combined effect is that HM Treasury will enjoy preferential but non-transferable dividend rights on the new capital it provides. Although the capital issue of £25.5 billion is expected to be sufficient to provide RBS with robust capital ratios according to the Group’s current base case forecasts, the FSA also requires banks to have enough capital to maintain a minimum Core Tier 1 ratio of at least 4 per cent. even in a severely stressed scenario in which economic conditions deteriorate well beyond consensus forecasts. To enable RBS to meet this test, HM Treasury has agreed to subscribe for up to an additional £8 billion of capital (in the form of additional B shares) if RBS’s Core Tier 1 ratio falls below 5 per cent. (the ‘‘Contingent Subscription”). This Contingent Subscription will enable RBS to maintain its capital resilience even if such a severely stressed scenario were to occur.
Following approval at the General Meeting held on 15 December 2009, RBS joined the Asset Protection Scheme, set up by HM Treasury, which provides additional protection to the Group’s capital ratio and financial position.
Results and dividends
The loss attributable to the ordinary and B shareholders of the company for the year ended 31 December 2009 amounted to £3,607 million compared with a loss of £24,306 million for the year ended 31 December 2008, as set out in the consolidated income statement on page 197.
The company did not pay a dividend on ordinary shares in 2009.
The Group has undertaken that, unless otherwise agreed with the European Commission, neither the company nor any of its direct or indirect subsidiaries (excluding companies in the ABN AMRO Group) will pay external investors any dividends or coupons on existing hybrid capital instruments (including preference shares, B shares and upper and lower tier 2 instruments) from a date starting not later than 30 April 2010 and for a period of two years thereafter (“the deferral period”), or exercise any call rights in relation to these capital instruments between 24 November 2009 and the end of the deferral period, unless there is a legal obligation to do so. Hybrid capital instruments issued after 24 November 2009 will generally not be subject to the restriction on dividend or coupon payments or call options.
Business review
Activities
The company is a holding company owning the entire issued ordinary share capital of The Royal Bank of Scotland plc, the principal direct operating subsidiary undertaking of the company. The “Group” comprises the company and all its subsidiary and associated undertakings, including the Royal Bank and NatWest. Details of the principal subsidiary undertakings of the company are shown in Note 16 on the accounts.
The Group is engaged principally in providing a wide range of banking, insurance and other financial services. Further details of the organisational structure and business overview of the Group, including the products and services provided by each of its divisions and the competitive markets in which they operate, is contained in the Business review on pages 5 and 6.
Following the conclusion of a strategic review, the Group has realigned its Core divisions, in particular the separation of RBS UK into UK Retail and UK Corporate. A Non-Core division has also been established to manage and run off or dispose of a number of assets and businesses that do not meet the Group’s target criteria.
163
Governance
Risk factors
The Group’s future performance and results could be materially different from expected results depending on the outcome of certain potential risks and uncertainties. Details of the principal risk factors the Group faces are given in the Business review on pages 7 to 22.
The reported results of the Group are also sensitive to the accounting policies, assumptions and estimates that underlie the preparation of its financial statements. Details of the Group’s critical accounting policies and key sources of accounting judgments are included in the Accounting policies on pages 211 to 213.
The Group’s approach to risk management, including its financial risk management objectives and policies and information on the Group’s exposure to price, credit, liquidity and cash flow risk, is discussed in the Risk, capital and liquidity management section of the Business review on pages 70 to 159.
Financial performance
A review of the Group’s performance during the year ended 31 December 2009, including details of each division, and the Group’s financial position as at that date is contained in the Business review on pages 38 to 64.
Business developments
RFS Holdings B.V., a company jointly owned by the company, the State of the Netherlands and Banco Santander and controlled by the company, is implementing an orderly separation of the business units of ABN AMRO with the company retaining the following ABN AMRO business units:
| · | Continuing businesses of Business Unit North America; |
| · | Business Unit Global Clients and wholesale clients in the Netherlands (including former Dutch wholesale clients) and Latin America (excluding Brazil); |
| · | Business Unit Asia (excluding Saudi Hollandi); and |
| · | Business Unit Europe (excluding Antonveneta). |
On 6 February 2010, the businesses of ABN AMRO acquired by the Dutch State were legally demerged from the RBS acquired businesses. As a result, there are now two separate banks within ABN AMRO Holding N.V., The Royal Bank of Scotland N.V. and the new entity named ABN AMRO Bank N.V., each licensed separately by the Dutch National Bank. Both banks will be governed by the current managing and supervisory boards of ABN AMRO Holding N.V. until the legal separation of the new ABN AMRO Bank N.V. from ABN AMRO Holding N.V., which is expected to take place within two months of the legal demerger and is subject to approval by the Dutch Central Bank. From that point RBS will cease to consolidate the Consortium Members’ interest in ABN AMRO in its statutory results.
Employees
As at 31 December 2009, the Group employed over 160,000 employees (full-time equivalent basis) throughout the world. Details of employee related costs are included in Note 3 on the accounts on page 217.
The Group offers an appropriate remuneration and benefits package to all employees which seeks to balance the interests of employees, shareholders and the long-term needs of the businesses and reflects banking bonus reforms.
The Group is committed to leading the way in implementing reforms to bank remuneration as agreed by the G20 in Pittsburgh and is implementing enhancements in disclosure, deferral and clawback of bonus awards with effect from 1 January 2010 for the performance year 2009. A large amount of focus has been placed on achieving compliance with the emerging regulatory developments on a global scale. This has had a large impact on the Group's culture, and changes have affected all levels of the organisation.
Employee learning and development
The Group maintains a strong commitment to creating and providing learning opportunities for all its employees through a variety of personal development and training programmes and learning networks. Employees are encouraged to do voluntary work with community partners.
Employee communication
Employee engagement is encouraged through a range of communication channels, at both a divisional and Group level. These channels provide access to news and information in a number of ways, including the intranet, magazines, video, team meetings led by line managers, briefings held by senior managers and regular dialogue with employees and employee representatives.
The Group Chief Executive and other senior Group executives regularly communicate with employees across a range of channels.
Employee consultation
Each year, all employees are invited to complete the global employee opinion survey. The survey is confidential and independently managed by Towers Perrin-ISR (now Towers Watson). The survey provides a channel for employees to express their views and opinions about the Group on a range of key issues.
The 2009 survey took place in September 2009 and the final response rate was 87%. This represents over 144,000 employees participating in the survey, from more than 50 countries.
The Group recognises employee representative organisations such as trade unions and work councils in a number of businesses and countries. The Group has two European Employee Forums that provide elected representatives with an opportunity to understand better its European operations. Engagement with its employees and such bodies remains important to the Group.
164
Report of the directors continued
Diversity and inclusion
The Group renewed its commitment to the principles of diversity and inclusion during 2009. The Group recognises that the diversity of its workforce is a considerable asset to the business and believes that an inclusive environment will enable all employees to develop to their full potential and enable RBS to attract and retain the best talent.
The Group already has a range of policies and processes that extend through the employee life-cycle including recruitment, flexible working and support for ill-health and disability-related absence. Diversity performance is monitored and reviewed at Group and divisional executive level. This commitment extends beyond the Group as part of the community support and supplier relationships.
Safety, health and wellbeing
The Group recognises that performance in safety, health and wellbeing adds value to employees and to the Group’s businesses globally. Industry leading expertise, innovative tools, products and services and a practical approach to implementation are combined to ensure improved performance continues to be delivered.
During 2009, the Group continued to focus on compliance, governance and managing risk across all jurisdictions. Enhanced mechanisms were implemented to support the health and wellbeing of employees, particularly given the impact of the economic environment.
Pre-employment screening
The Group has a comprehensive pre-employment screening process to guard against possible infiltration and employee-related fraud for all direct and non-direct staff engaged on Group business.
Code of conduct
The Code of conduct applies to all employees globally and to all those engaged by the Group, but who are not employees, such as contractors and those engaged through external agencies.
The Code exists to promote honest and ethical conduct, including the handling of actual or apparent conflicts of interest between personal and professional relationships. The Group recognises that personal conduct, business integrity and the Group's security are crucial, and the Code serves to inform employees of the Group's expectations of their behaviour and practices.
Corporate sustainability
Sustainability sits at the heart of how the Group is being re-shaped and RBS maintains a strong commitment to meeting high standards of environmental, social and ethical responsibility.
Corporate sustainability issues are governed by the Group Corporate Sustainability Committee (GCSC), which was established in 2009. The GCSC is supported by the executive-led Environment Working Group which has representatives from across the Group and reports to the GCSC. The Environment Working Group monitors environmental risk, commercial opportunities, operational impacts and communications and engagement.
The Microfinance Advisory Board comprises senior members from a range of stakeholder groups and provides independent oversight and support for the Microfinance and Supporting Enterprise programmes across the Group’s international business.
Throughout the development of ’MoneySense’, RBS has continuously sought independent counsel. This has now been formalised through the formation of the MoneySense Advisory Board which draws on the skills of independent, impartial experts, to provide strategic input to the MoneySense programme.
Further details of the Group’s Corporate Sustainability policies are available on www.rbs.com/sustainability and in the annual Corporate Sustainability Report.
BBA draft disclosure code
In October 2009, the British Bankers’ Association (BBA) published a draft code for Financial Reporting Disclosure. The draft code sets out five disclosure principles together with supporting guidance. The principles are that the Group and other major UK banks will provide high quality, meaningful and decision-useful disclosures; review and enhance their financial instrument disclosures for key areas of interest to market participants; assess the applicability and relevance of good practice recommendations to their disclosures acknowledging the importance of such guidance; seek to enhance the comparability of financial statement disclosures across the UK banking sector and clearly differentiate in their annual reports between information that is audited and information that is unaudited.
The Group and other major UK banks have voluntarily adopted the draft code in their 2009 financial statements. The Group’s 2009 financial statements have therefore been prepared in compliance with the draft code’s principles.
165
Governance
Going concern
The Group’s business activities and financial position, the factors likely to affect its future development and performance and its objectives and policies in managing the financial risks to which it is exposed and its capital are discussed in the Business review. The risk factors which could materially affect the Group’s future results are set out on pages 7 to 22. The Group’s regulatory capital resources and significant developments in 2009 and anticipated future developments are detailed on pages 73 to 79. Pages 107 to 113 describe the Group’s funding and liquidity profile, including changes in key metrics, the build up of liquidity reserves and the outlook for 2010.
Having reviewed the Group’s forecasts, projections and other relevant evidence, the directors have a reasonable expectation that the Group and the company will continue in operational existence for the foreseeable future. Accordingly, the financial statements of the Group and of the company have been prepared on a going concern basis.
Corporate governance
The company is committed to high standards of corporate governance. Details are given on pages 169 to 176. The Corporate governance statement forms part of this Report of the directors.
Ordinary share capital
In April 2009, the company issued 16,909,716,385 ordinary shares of 25p by way of a placing and open offer on the basis of three new shares for every seven existing shares, raising £5.37 billion.
In December 2009, the company issued 51 billion B shares of 1p to HM Treasury at 50p per share, raising £25.5 billion.
During 2009 any option exercises were satisfied using market purchase shares. Therefore there was no increase to the ordinary share capital in respect of any option exercises.
Details of the authorised and issued ordinary share capital at 31 December 2009 are shown in Note 27 on the accounts.
Preference share capital
Following the placing and open offer in April 2009, the company redeemed the five million non-cumulative sterling preference shares of £1 issued at £1,000 each (£5 billion in total) held by HM Treasury at 101 per cent of their issue price, the dividend accrued on the preference shares from 1 December 2008 to the date of redemption and the commissions payable to HM Treasury under the Second Placing and Open Offer Agreement.
Details of the authorised and issued preference share capital at 31 December 2009 are shown in Note 27 on the accounts.
Additional information
Where not provided previously in the Report of the directors, the following provides the additional information required to be disclosed by Part 6 of Schedule 7 to the Report and Accounts Regulations 2008.
The rights and obligations attaching to the company’s ordinary shares and preference shares are set out in the company’s Articles of Association, copies of which can be obtained from Companies House in the UK or at www.rbs.com.
On a show of hands at a general meeting of the company every holder of ordinary shares and cumulative preference shares present in person or by proxy and entitled to vote shall have one vote. On a poll, every holder of ordinary shares present in person or by proxy and entitled to vote shall have one vote for every share held. On a poll, holders of cumulative preference shares present in person or by proxy and entitled to vote shall have four votes for every share held. The Notices of Annual General Meetings and General Meetings specify the deadlines for exercising voting rights and appointing a proxy or proxies to vote in relation to resolutions to be passed at the meeting.
The cumulative preference shares represent less than 0.01% of the total voting rights of the company, the remainder being represented by the ordinary shares.
There are no restrictions on the transfer of ordinary shares in the company other than certain restrictions which may from time to time be imposed by laws and regulations (for example, insider trading laws). Pursuant to the Listing Rules of the Financial Services Authority, certain employees of the company require the approval of the company to deal in the company’s shares.
A number of the company’s share plans include restrictions on transfers of shares while the shares are subject to the plans, in particular the Employee Share Ownership Plan.
The rights and obligations of holders of non-cumulative preference shares are set out in Note 27 on the accounts on pages 281 and 283.
Except in relation to the Dividend Access Share, the company is not aware of any agreements between shareholders that may result in restrictions on the transfer of securities and/or voting rights. There are no persons holding securities carrying special rights with regard to control of the company.
Under the rules of certain employee share plans, eligible employees are entitled to acquire shares in the company, and shares are held in trust for participants by The Royal Bank and Ulster Bank Dublin Trust Company as Trustees. Voting rights are exercised by the Trustees on receipt of participants’ instructions. If a participant does not submit an instruction to the Trustee no vote is registered.
The Royal Bank of Scotland plc 1992 Employee Share Trust, The Royal Bank of Scotland Group plc 2001 Employee Share Trust and The Royal Bank of Scotland Group plc 2007 US Employee Share Trust hold shares on behalf of the Group’s employee share plans. The voting rights are exercisable by the Trustees, however, in accordance with investor protection guidelines, the Trustees abstain from voting. The Trustees would take independent advice before accepting any offer in respect of their shareholdings for the company in a takeover bid situation.
Awards granted under the company’s employee share plans may be met through a combination of newly issued shares and shares acquired in the market by the company’s employee benefit trusts.
166
Report of the directors continued
The rules governing the appointment of directors are set out in the Corporate governance section on page 170. The company’s Articles of Association may only be amended by a special resolution at a general meeting of shareholders.
A change of control of the company following a takeover bid may cause a number of agreements to which the company is party to take effect, alter or terminate. In addition, a number of executive directors’ service agreements may be affected on a change of control. All of the company’s employee share plans contain provisions relating to a change of control. Outstanding awards and options may vest and become exercisable on change of control, subject where appropriate to the satisfaction of any performance conditions at that time and prorating of awards. In the context of the company as a whole, these agreements are not considered to be significant.
Directors
The names and brief biographical details of the directors are shown on pages 161 and 162.
Colin Buchan, Stephen Hester, Archie Hunter, Joe MacHale and Gordon Pell served throughout the year and to the date of signing of the financial statements.
Philip Hampton was appointed as a director and Chairman-designate on 19 January 2009 and as Chairman on 3 February 2009.
Sir Tom McKillop ceased to be Chairman on 3 February 2009.
Jim Currie, Bill Friedrich, Bud Koch, Janis Kong, Sir Steve Robson, Bob Scott and Peter Sutherland all ceased to be directors on 6 February 2009.
Sandy Crombie was appointed as Senior Independent Director on 1 June 2009.
Guy Whittaker ceased to be a director on 30 September 2009.
Bruce Van Saun was appointed as a director on 1 October 2009.
Philip Scott was appointed as a director on 1 November 2009.
Penny Hughes was appointed as a director on 1 January 2010.
Gordon Pell will retire from the Board on 31 March 2010.
Sandy Crombie, Penny Hughes, Philip Scott and Bruce Van Saun, all of whom have been appointed since the 2009 Annual General Meeting, will offer themselves for election at the forthcoming Annual General Meeting. In addition, Philip Hampton and Joe MacHale will retire and offer themselves for re-election at the Annual General Meeting.
Archie Hunter, who has served as a director since September 2004 and chairman of the Group Audit Committee since April 2005, will retire from the Board at the end of his existing term at the conclusion of the Group’s Annual General Meeting in April 2010.
The appointment of a successor to Archie Hunter as chairman of the Group Audit Committee is well advanced and is subject to final regulatory approval. An announcement will be made in due course.
Group General Counsel and Group Secretary
Miller McLean will retire as Group General Counsel and Group Secretary on 30 April 2010, after 40 years with the Group.
Directors’ interests
The interests of the directors in the shares of the company at 31 December 2009 are shown on page 193. None of the directors held an interest in the loan capital of the company or in the shares or loan capital of any of the subsidiary undertakings of the company, during the period from 1 January 2009 to 24 February 2010.
Directors’ indemnities
In terms of section 236 of the Companies Act 2006, Qualifying Third Party Indemnity Provisions have been issued by the company to directors, members of the Executive and Management Committees of the Group and FSA Approved Persons.
In terms of section 236 of the Companies Act 2006, Qualifying Pension Scheme Indemnity Provisions have been issued to all pension trustees of the Group’s pension schemes during 2009.
Directors’ disclosure to auditors
Each of the directors at the date of approval of this report confirms that:
| (a) | so far as the director is aware, there is no relevant audit information of which the company’s auditors are unaware; and |
| (b) | the director has taken all the steps that he/she ought to have taken as a director to make himself/herself aware of any relevant audit information and to establish that the company’s auditors are aware of that information. |
This confirmation is given and should be interpreted in accordance with the provisions of section 418 of the Companies Act 2006.
Post balance sheet events
There have been no significant events between the year end and the date of approval of these accounts which would require a change to or disclosure in the accounts.
167
Governance
Shareholdings
The table below shows the shareholders that have notified the Group that they hold more than 3% of the voting rights in the undernoted classes of shares as at 31 December 2009.
| Number of shares | % held | Number of shares | % held | ||||||||||||||
| Ordinary shares | 5 1/2% cumulative preference shares | ||||||||||||||||
| Solicitor For The Affairs of | Mr P S and Mrs J M Allen, | ||||||||||||||||
| Her Majesty’s Treasury | Miss C L Allen and Miss J C Allen | 112,949 | 28.23 | ||||||||||||||
| As Nominee for | Commercial Union Assurance plc | 91,429 | 22.86 | ||||||||||||||
| Her Majesty’s Treasury | 39,644,835,194 | 70.33 | Bassett-Patrick Securities Limited (1) | 46,255 | 11.56 | ||||||||||||
| B shares | E M Behrens Charitable Trust | 20,000 | 5.00 | ||||||||||||||
| Solicitor For The Affairs of | Trustees of The Stephen Cockburn | ||||||||||||||||
| Her Majesty’s Treasury | Limited Pension Scheme | 19,879 | 4.97 | ||||||||||||||
| As Nominee for | Mrs Gina Wild | 19,800 | 4.95 | ||||||||||||||
| Her Majesty’s Treasury | 51,000,000,000 | 100.00 | Miss Elizabeth Hill | 16,124 | 4.03 | ||||||||||||
| 11% cumulative preference shares | Mr W T Hardison Jr. | 13,532 | 3.38 | ||||||||||||||
| Guardian Royal Exchange Assurance plc | 129,830 | 25.97 | |||||||||||||||
| Windsor Life Assurance Company Limited | 51,510 | 10.30 | |||||||||||||||
| Cleaning Tokens Limited | 25,500 | 5.10 | |||||||||||||||
| Mr S J and Mrs J A Cockburn | 15,520 | 3.10 | |||||||||||||||
| Mr Stephen J Cockburn | 15,290 | 3.06 | |||||||||||||||
Note:
| (1) | Notification has been received on behalf of Mr A W R Medlock and Mrs H M Medlock that they each have an interest in the holding of 5 1/2 % cumulative preference shares registered in the name of Bassett-Patrick Securities Limited noted above and that there are further holdings of 5,300 and 5,000 shares, respectively, of that class registered in each of their names. |
Charitable contributions
In 2009 the Group’s overall community contribution was £63.9 million (2008 – £66.3 million). The total amount given for charitable purposes by the company and its subsidiary undertakings during the year ended 31 December 2009 was £34.7 million (2008 – £24.8 million).
To ensure it makes its community investments as effective as possible, the Group’s policy is to focus its resources on a small number of substantial strategic programmes. These are issues most relevant to a financial institution and relate broadly to financial education, supporting enterprise and microfinance and the charitable endeavours of employees.
Political donations
At the Annual General Meeting in 2006, shareholders gave authority, for a period of four years, for the company to make political donations and incur political expenditure up to a maximum aggregate sum of £500,000 as a precautionary measure in light of the wide definitions in the Political Parties, Elections and Referendums Act 2000, the provisions of which are largely restated in the Companies Act 2006. This authority has not been used and will be refreshed at the forthcoming Annual General Meeting.
No EU political donations were made, nor EU political expenditure incurred, during the year and it is not proposed that the Group’s longstanding policy of not making contributions to any political party be changed.
Policy and practice on payment of creditors
The Group is committed to maintaining a sound commercial relationship with its suppliers. Consequently, it is the Group’s policy to negotiate and agree terms and conditions with its suppliers, which includes the giving of an undertaking to pay suppliers within 30 days of receipt of a correctly prepared invoice submitted in accordance with the terms of the contract or such other payment period as may be agreed.
At 31 December 2009, the Group’s trade creditors represented 30 days (2008 – 30 days) of amounts invoiced by suppliers.
Auditors
The auditors, Deloitte LLP, have indicated their willingness to continue in office. A resolution to re-appoint Deloitte LLP as the company’s auditors will be proposed at the forthcoming Annual General Meeting.
By order of the Board
Miller McLean
Secretary
24 February 2010
The Royal Bank of Scotland Group plc
is registered in Scotland No. 45551.
168
Corporate governance
The company is committed to high standards of corporate governance, business integrity and professionalism in all its activities.
Throughout the year ended 31 December 2009, the company has complied with all of the provisions of the Combined Code issued by the Financial Reporting Council in June 2008 (the “Code”) except in the following respects:
| · | First, in relation to the provision that the Remuneration Committee should have delegated responsibility for setting remuneration for the Chairman and executive directors, the company considers that this is a matter which should rightly be reserved for the Board. No director is involved in decisions regarding his or her own remuneration. |
| · | Secondly, during the period from 6 February 2009 to 1 June 2009, the company did not have a senior independent director and from 6 February 2009 to 4 August 2009, the Remuneration Committee comprised two independent non-executive directors and the Chairman of the Board, not the three independent non-executive directors required by the Code. Since the appointment of Sandy Crombie as Senior Independent Director on 1 June 2009 and as a member of the Remuneration Committee on 4 August 2009, at which time the Chairman of the Board stepped down from the Remuneration Committee, the company has been compliant with both of these provisions of the Code. |
The company has also complied with the Financial Reporting Council Guidance on Audit Committees issued in October 2008 in all material respects.
Under the US Sarbanes-Oxley Act of 2002 (the “Act”), specific standards of corporate governance and business and financial disclosures apply to companies with securities registered in the US. The company complies with all applicable sections of the Act.
The company supports and has engaged fully with the review of governance in banks and financial institutions undertaken by Sir David Walker and has taken various steps, as described throughout this report to implement the recommendations of the Walker review, details of which can be found in the ‘Recent Publications’ section at www.hm-treasury.gov.uk.
The New York Stock Exchange
As a foreign issuer with American Depositary Shares (ADS) representing ordinary shares, preference shares and debt securities listed on the New York Stock Exchange (NYSE), the company must disclose any significant ways in which its corporate governance practices differ from those followed by US companies under the NYSE corporate governance listing standards. In addition, the company must comply fully with the provisions of the listing standards that relate to the composition, responsibilities and operation of audit committees. These provisions incorporate the relevant rules concerning audit committees of the US Securities Exchange Act of 1934.
The company has reviewed its corporate governance arrangements and is satisfied that these are consistent with the NYSE’s corporate governance listing practices, with the exception that the Chairman of the Board is Chairman of the Nominations Committee and was a member of the Remuneration Committee until 4 August 2009, both of which are permitted by the Code (since the Chairman was considered independent on appointment). The company’s Audit, Nominations, Risk and Remuneration Committees are otherwise composed solely of non-executive directors deemed by the Board to be independent. The NYSE corporate governance listing standards also require that a compensation committee has direct responsibility to review and approve Group Chief Executive remuneration. As disclosed already, in the case of the company, the Board, rather than the Remuneration Committee, reserves the authority to make the final determination of the remuneration of the Group Chief Executive.
The Group Audit Committee complies with the provisions of the NYSE corporate governance listing standards that relate to the composition, responsibilities and operation of audit committees. In May 2009, the company submitted its required annual written affirmation to the NYSE confirming its full compliance with those and other applicable provisions. More detailed information about the Audit Committee and its work during 2009 is set out in the Audit Committee Report on pages 173 to 175.
Board of directors
The Board is the main decision-making forum for the company. It has overall responsibility for management of the business and affairs of the Group, the establishment of Group strategy and capital raising and allocation, and is accountable to shareholders for financial and operational performance. The Board considers strategic issues and ensures the Group manages risk effectively through approving and monitoring the Group’s risk appetite, considering Group stress scenarios and agreed mitigants and identifying longer term strategic threats to the Group’s business operations. The Board has a formal schedule of matters detailing key aspects of the company’s affairs reserved to it for its decision. This schedule is reviewed annually.
The roles of Chairman and Group Chief Executive are distinct and separate, with a clear division of responsibilities. The Chairman leads the Board and ensures the effective engagement and contribution of all executive and non-executive directors. The Group Chief Executive has responsibility for all Group businesses and acts in accordance with the authority delegated by the Board. Responsibility for the development of policy and strategy and operational management is delegated to the Group Chief Executive and other executive directors.
All directors participate in discussing strategy, performance and the financial and risk management of the company. Meetings of the Board are structured to allow open discussion.
At the beginning of the year, a number of Board meetings are scheduled. For 2009, ten Board meetings were scheduled. The directors were supplied with comprehensive papers in advance of each Board meeting covering the Group’s principal business activities. The Group Chief Executive provides a written report on business activities at each Board meeting. Members of executive management attend and make regular presentations at meetings of the Board. The Chairman and the non-executives meet at least once per year without executives present.
169
Governance
The Board is aware of the other commitments of its directors and has established procedures for ensuring that the Board’s powers for authorising directors’ conflicts of interest are being operated effectively. With effect from 1 October 2008, the Companies Act 2006 introduced a statutory duty on directors to avoid conflicts of interest. Since that date, the Board has considered, and where appropriate authorised, any actual or potential conflicts of interests that directors may have. The Walker review recommends that the Chairman should be expected to commit a proportion of his time, probably not less than two thirds, to the business. In November 2009, Philip Hampton joined the Board of Anglo American plc as a non-executive director. This appointment was fully disclosed to the Board and it was satisfied that there were no issues in relation to his time commitment to RBS. Philip Hampton has confirmed that RBS remains his priority.
Board balance and independence
The Board currently comprises the Chairman, two executive directors and nine independent non-executive directors. The Board functions effectively and efficiently and is considered to be of an appropriate size. The directors provide the Group with the knowledge, mix of skills, experience and networks of contacts required. The Board Committees comprise directors with a variety of relevant skills and experience so that no undue reliance is placed on any individual.
The non-executive directors combine broad business and commercial experience with independent and objective judgement. The balance between non-executive and executive directors enables the Board to provide clear and effective leadership and maintain the highest standards of integrity across the company’s business activities. The names and biographies of all Board members are set out on pages 161 and 162.
The Board considers that the Chairman was independent on appointment and all non-executive directors are independent for the purposes of the Code. The standard terms and conditions of the appointment of non-executive directors are available on the Group website (www.rbs.com) and copies are available on request.
Re-election of directors
Directors must stand for re-election by shareholders at least once every three years. Any non-executive directors who have served for more than nine years will also stand for annual re-election and the Board will consider their independence at that time.
The names of directors standing for election at the 2010 Annual General Meeting are included on page 167 and further information is given in the Chairman’s letter to shareholders in relation to the company’s Annual General Meeting.
Information, induction and professional development
All directors receive accurate, timely and clear information on all relevant matters, and have access to the advice and services of the Group General Counsel and Group Secretary who is responsible to the Board for ensuring that Board procedures are followed and that applicable rules and regulations are complied with. In addition, all directors are able, if necessary, to obtain independent professional advice at the company’s expense.
Each new director receives a formal induction on joining the Board, including visits to the Group’s major businesses and meetings with directors and senior management. The induction is tailored to the director’s specific requirements. Directors are advised of appropriate training and professional development opportunities and undertake the training and professional development they consider necessary in assisting them to carry out their duties as a director.
In line with recommendations of the Walker review, the company is currently undertaking a comprehensive review of its Board induction and continuing development programme for directors. As a result, the induction programme has recently been expanded to include sessions with external advisers as well as the heads of key business areas.
Performance evaluation
Following the Board evaluation last year, a number of initiatives were implemented in 2009 aimed at improving the overall performance and effectiveness of the Board, including further Board appointments, restructuring Board agendas and papers and allowing more time at Board meetings to consider strategic issues. In addition, reporting to the Board on risk matters, capital, liquidity and funding was enhanced.
The Board has again undertaken a formal and rigorous evaluation of its own performance and that of its committees and individual directors.
In 2009, this process was independently facilitated by Spencer Stuart*, using a detailed framework of questions which was used to structure the individual meetings held with each director. Amongst the areas reviewed were the role and organisation of the Board and its Committees, Board composition and the staffing of Committees, Board processes, the structure and frequency of meetings, Board and Committee reporting, and external relationships including those with shareholders and regulators. The Board has considered and discussed reports on the outcomes of the evaluations and is satisfied with the way in which the evaluations have been conducted.
The evaluation concluded that the Board is operating effectively and has benefited from the reduction in size and changes in composition which have been successfully implemented during 2009. The composition of the Board and staffing of key Committees, along with the shape of Board agendas and meeting formats are under continual review to build on this and further increase effectiveness. The separation of responsibilities between the Audit Committee and the newly formed Board Risk Committee to meet the recommendations of the Walker review will assist the Group in focusing on risk management as a whole and continuing to improve on areas such as risk analysis and reporting.
Separately, the Senior Independent Director canvassed the views of the executive directors and met with the non-executive directors individually and as a group, without the Chairman present, to consider his performance. The Senior Independent Director also canvassed views from UKFI, the FSA and the Association of British Insurers. The results of this were then shared with the Chairman.
* The Board is satisfied that no potential conflict of interest exists between conducting this board evaluation and the other executive search services which Spencer Stuart has provided for the Group in 2009 in its operating divisions.
170
Corporate governance continued
Board Committees
In order to provide effective oversight and leadership, the Board has established a number of Board Committees with particular responsibilities. The Committee chairmanship and membership are reviewed on a regular basis. The names and biographies of all Board Committee members are set out on pages 161 to 162.
In accordance with the recommendations of the Walker review, the company has established a Board Risk Committee to advise the Board on risk issues.
The terms of reference of the undernoted committees are available on the Group’s website (www.rbs.com) and copies are available on request.
Audit Committee
All members of the Audit Committee are independent non-executive directors. The Audit Committee holds six scheduled meetings each year. In 2009, the Audit Committee held four additional meetings. The Audit Committee’s report is set out on pages 173 to 175. The Audit Committee is responsible for assisting the Board in carrying out its responsibilities relating to accounting policies, internal control and financial reporting.
Remuneration Committee
The Remuneration Committee is comprised of independent non-executive directors. The Remuneration Committee holds at least four scheduled meetings each year. The Remuneration Committee held an additional 16 meetings in 2009. The Remuneration Committee is responsible for the overview of the Group’s policy on remuneration, as well as considering executive remuneration and, as required, making recommendations to the Group Board in respect of the remuneration arrangements of the executive directors. It is also responsible for setting the remuneration arrangements of the Executive Committee and Management Committee and any employees falling within the definition of principle 8 of the FSA Code on Remuneration.
The Directors’ remuneration report is contained on pages 181 to 192.
Board Risk Committee
The Board Risk Committee is comprised of at least three independent non-executive directors, one of whom is the Chairman of the Audit Committee. A minimum of six meetings will be held each year. The Board Risk Committee is responsible for providing oversight and advice to the Board in relation to current and potential future risk exposures of the Group and future risk strategy, promoting a risk awareness culture within the Group, reporting to the Board, as well as identifying any matters within its remit in respect of which it considers that action or improvement is needed and making recommendations as to the steps to be taken. The Board Risk Committee’s report is set out on page 178.
Nominations Committee
The Nominations Committee comprises independent non-executive directors, under the chairmanship of the Chairman of the Board. The Nominations Committee meets as required.
The Nominations Committee is responsible for assisting the Board in the formal selection and appointment of directors having regard to the overall balance of skills, knowledge and experience on the Board. The committee engages with external consultants, considers potential candidates and recommends appointments of new directors to the Board. The appointments are based on merit against objective criteria, including the time available of the potential director and the commitment which will be required. In addition, the Nominations Committee considers succession planning for the Chairman, Group Chief Executive and non-executive directors. The Nominations Committee takes into account the knowledge, mix of skills, experience and networks of contacts which are anticipated to be needed on the Board in the future. The Chairman, Group Chief Executive and non-executive directors meet to consider executive succession planning. No director is involved in decisions regarding his or her own succession.
Group Corporate Sustainability Committee
The Group Corporate Sustainability Committee is chaired by the Senior Independent Director and attended by the Group Chairman and members of the Group executive and senior management. It reports into the Board and is responsible for setting and reviewing the Group’s overall sustainability strategy, values and policies. It receives reports from the Environment Working Group and other relevant internal programmes.
171
Governance
Meetings
The number of scheduled meetings of the Board and the Audit, Remuneration and Nominations Committees and individual attendance of these scheduled meetings by members in 2009 is shown below.
In addition to scheduled meetings, 39 ad-hoc meetings of the Board and Committees of the Board were held during 2009, many of which related to the Second Placing and Open Offer, and the Group’s participation in the Asset Protection Scheme. There were also four additional meetings of the Group Audit Committee during the year held to consider the Group Interim Management Statements and accession to the Asset Protection Scheme. There were 16 additional meetings of the Remuneration Committee during 2009, reflecting the increased focus on remuneration, introduction of the FSA Code, senior recruitment and the development of the new deferral plan and long-term incentive plans.
| Board | Audit | Remuneration | Nominations* | |||||||||||||
| Total number of scheduled | ||||||||||||||||
| meetings in 2009 | 10 | 6 | 4 | — | ||||||||||||
| Number of meetings | ||||||||||||||||
| attended in 2009: | ||||||||||||||||
Philip Hampton (1, 2) | 10 | — | 3 | 3 | ||||||||||||
| Stephen Hester | 10 | — | — | — | ||||||||||||
Colin Buchan (1) | 9 | 5 | 4 | 3 | ||||||||||||
Sandy Crombie (3) | 3 | — | 1 | 2 | ||||||||||||
Penny Hughes (4) | — | — | — | — | ||||||||||||
Archie Hunter (5) | 10 | 6 | — | 5 | ||||||||||||
Joe MacHale (1) | 10 | 6 | — | 3 | ||||||||||||
John McFarlane (1,6) | 10 | — | 3 | 3 | ||||||||||||
| Gordon Pell | 10 | — | — | — | ||||||||||||
Art Ryan (1) | 10 | — | — | 3 | ||||||||||||
Philip Scott (7) | 1 | — | — | — | ||||||||||||
Bruce Van Saun (8) | 3 | — | — | — | ||||||||||||
| Former directors | ||||||||||||||||
Sir Tom McKillop (9) | 1 | — | 1 | 2 | ||||||||||||
Guy Whittaker (10) | 8 | — | — | — | ||||||||||||
Dr Currie (11) | 2 | — | 1 | — | ||||||||||||
Bill Friedrich (11) | 2 | 1 | — | — | ||||||||||||
Bud Koch (11) | 2 | — | — | — | ||||||||||||
Janis Kong (11) | 2 | — | 1 | — | ||||||||||||
Sir Steve Robson (11) | 2 | 1 | — | — | ||||||||||||
Bob Scott (11) | 2 | — | 1 | 2 | ||||||||||||
Peter Sutherland (11) | 2 | — | 1 | 2 | ||||||||||||
* Meetings not scheduled, but held as required
Notes:
| (1) | Became a member of the Nominations Committee on 6 February 2009. |
| (2) | Ceased to be a member of the Remuneration Committee on 4 August 2009. |
| (3) | Appointed as a director on 1 June 2009. Became a member of the Remuneration Committee on 4 August 2009. |
| (4) | Appointed as a director on 1 January 2010. |
| (5) | Was a member of the Nominations Committee throughout 2009. |
| (6) | Became a member of the Remuneration Committee on 6 February 2009. |
| (7) | Appointed as a director on 1 November 2009. |
| (8) | Appointed as a director on 1 October 2009. |
| (9) | Ceased to be a director on 3 February 2009. |
| (10) | Ceased to be a director on 30 September 2009. |
| (11) | Ceased to be a director on 6 February 2009. |
Relations with shareholders
The company communicates with shareholders through the Annual Report and Accounts and by providing information in advance of the Annual General Meeting. Individual shareholders can raise matters relating to their shareholdings and the business of the Group at any time throughout the year primarily by letter, telephone or email via the Group’s website (www.rbs.com/ir).
Shareholders are given the opportunity to ask questions at the Annual General Meeting or submit written questions in advance. The chairmen of the Audit, Remuneration, Nominations and Board Risk Committees are available to answer questions at the Annual General Meeting.
Communication with the company’s largest institutional shareholders is undertaken as part of the Investor Relations programme:
| · | The Group Chief Executive meets regularly with UKFI, the organisation set up to manage the Government's investments in financial institutions, to discuss the strategy and financials of the Group. He also undertakes an annual programme of meetings with the company’s largest institutional shareholders, as does the Group Finance Director. |
| · | The Chairman independently meets with the Group’s largest institutional shareholders annually to hear their feedback on management, strategy, business performance and corporate governance. |
| · | The Senior Independent Director joined the Group in June 2009 and will be available if any shareholder has concerns that they feel are not being addressed through the normal channels. |
Throughout the year, the Chairman, Group Chief Executive and Group Finance Director communicate shareholder feedback to the Board and the directors receive independent analyst notes and a monthly report reviewing share price movements and the Group’s performance against the sector. Detailed market and shareholder feedback is also provided to the Board after major public announcements such as earnings releases.
The arrangements used to ensure that directors develop an understanding of the views of major shareholders are considered as part of the annual Board performance evaluation.
172
Governance
Audit Committee Report
The current members of the Group Audit Committee are Archie Hunter (Chairman), Colin Buchan, Joe MacHale and Philip Scott. All served throughout 2009 with the exception of Philip Scott who became a member of the Committee with effect from 19 January 2010. All members of the Group Audit Committee are independent non-executive directors. Art Ryan has been a regular attendee since August 2009 and has fully participated in the activity of the Committee.
The Audit Committee holds at least six scheduled meetings each year. A meeting is held immediately prior to submission of the interim and annual financial statements to the Board and the quarterly Interim Management Statements. This core programme is supplemented by additional meetings as required. A total of ten meetings were held in 2009. Audit Committee meetings are attended by relevant executive directors, the internal and external auditors and finance and risk management executives. At least twice per annum the Audit Committee meets privately with the external auditors. Since 2000, the Audit Committee has undertaken an annual programme of visits to the Group's business divisions and control functions. The object of the programme is to allow the Audit Committee to gain a better understanding of the Group and an invitation to attend is extended to all non-executive directors. The programme of future visits is considered annually and the norm is for two to three visits to be undertaken each year. The Group Audit Committee undertook three visits in 2009.
The Board is satisfied that all the Audit Committee members have recent and relevant financial experience. Although the Board has determined that each member of the Audit Committee is an ‘Audit Committee Financial Expert’ and is independent, each as defined in the SEC rules under the US Securities Exchange Act of 1934 and related guidance, the members of the Audit Committee are selected with a view to the expertise and experience of the Audit Committee as a whole, and the Audit Committee reports to the Board as a single entity. The designation of a director or directors as an ‘Audit Committee Financial Expert’ does not impose on any such director, any duties, obligations or liability that are greater than the duties, obligations and liability imposed on such director as a member of the Audit Committee and Board in the absence of such a designation. Nor does the designation of a director as an ‘Audit Committee Financial Expert’ affect the duties, obligations or liability of any other member of the Board.
The Audit Committee is responsible for:
| · | assisting the Board in discharging its responsibilities and in making all relevant disclosures in relation to the financial affairs of the Group; |
| · | reviewing accounting and financial reporting and regulatory compliance; |
| · | reviewing the Group’s systems of internal control; and |
| · | monitoring the Group’s processes for internal audit and external audit. |
In addition the Committee had responsibility for the consideration of risk issues throughout 2009.
Following publication of the Walker review initial recommendations in July 2009, the Group Board approved the creation of a Board Risk Committee. The Group Audit Committee will be informed of risk issues through appropriate representation at the Board Risk Committee. Revised terms of reference for the Group Audit Committee and terms of reference for the Board Risk Committee were approved by the Board on 28 October 2009.
The terms of reference of the Audit Committee are available at www.rbs.com and these are considered annually by the Group Audit Committee and approved by the Board.
The Audit Committee has adopted a policy on the engagement of the external auditors to supply audit and non-audit services, which takes into account relevant legislation regarding the provision of such services by an external audit firm. The Audit Committee reviews the policy annually and prospectively approves the provision of audit services and certain non-audit services by the external auditors.
Annual audit services include all services detailed in the annual engagement letter including the annual audit and interim reviews (including US reporting requirements), periodic profit verifications and reports to regulators including skilled persons reports commissioned by the Financial Services Authority (e.g. Reporting Accountants Reports).
Annual audit services also include statutory or non-statutory audits required by any Group companies that are not incorporated in the UK. Terms of engagement for these audits are agreed separately with management, and are consistent with those set out in the audit engagement letter insofar as local regulations permit.
The prospectively approved non-audit services include the following classes of service:
| · | capital raising, including consents, comfort letters and relevant reviews of registration statements; |
| · | provision of accounting opinions relating to the financial statements of the Group; |
| · | provision of reports that, according to law or regulation, must be rendered by the external auditors; |
| · | tax compliance services; |
| · | corporate finance services relative to companies that will remain outside the Group; |
| · | restructuring services relating to the Group’s customers; and |
| · | reports providing assurance to third parties over certain of the Group’s internal controls prepared under US Statement of Auditing Standards 70 or similar auditing standards in other jurisdictions. |
173
Corporate governance continued
For all other permitted non-audit services, Audit Committee approval must be sought, on a case by case basis, before the provision of the service commences. In addition, the Audit Committee reviews and monitors the independence and objectivity of the external auditors when it approves non-audit work to be carried out by them, taking into consideration relevant legislation, ethical guidance and the level of non-audit services relative to audit services. The approval process is rigorously applied to prevent the auditors from functioning in the role of management, auditing their own work, or serving in an advocacy role. Information on the audit and non-audit services carried out by the external auditors is detailed in Note 5 to the Group’s accounts.
The Group Audit Committee was pleased to note progress towards meeting the Group’s strategic plan in 2009. However, ongoing economic uncertainty continued to affect the Group throughout the period and it has recorded significant asset write-downs in its 2009 financial statements.
In these circumstances, particular attention of the Audit Committee was focused on a number of salient judgments involved in the preparation of the accounts:
| · | valuation methodologies and assumptions for financial instruments carried at fair value including the Group’s credit market exposures and the disclosures provided; |
| · | claims reserves in the Group’s general insurance business; |
| · | the accounting treatment of bonus tax; |
| · | accounting issues relating to the Asset Protection Scheme; |
| · | actuarial assumptions for the Group Pension Fund; |
| · | impairment losses in the Group’s portfolio of loans and advances and available-for-sale securities; |
| · | carrying value of the deferred tax asset; and |
| · | impairment of goodwill and other purchased intangible assets. |
In its consideration of each of these issues, the aims of the Audit Committee have been to:
| · | understand and challenge the valuation and other accounting judgments made by management; |
| · | review the conclusions of the external auditors and, where applicable, other experts and to understand how they came to their conclusions; and |
| · | satisfy itself that the disclosures in the financial statements about these estimates and valuations are transparent and appropriate. |
Also addressed by the Audit Committee, given the current economic environment, was management's going concern assessment. In particular, the Committee reviewed the evidence to demonstrate that the Group had access to sufficient funding and capital over the next 12 months. The Committee reviewed and challenged the assumptions underlying the analysis and discussed with the external auditors its review of management's analysis and conclusions.
The Committee also dedicated a significant proportion of time and attention during 2009 to the consideration and approval of the Group’s accession to the Asset Protection Scheme (“the Scheme”). A specific meeting, which was attended by the majority of the Group Board, was held to consider the Scheme and its impact on the Group.
In response to the economic crisis the Group Audit Committee formally commissioned an independent report on risk reporting within the organisation. As a result, the format and content of risk reporting has undergone significant development during 2009.
As far as it can determine, the Group Audit Committee received all the information and material it required to allow it to meet its obligations in respect of the 2009 financial statements.
During 2009, the Group Audit Committee regularly reviewed the work of the Group’s risk management and internal audit functions. Additional sessions of the Group Audit Committee were held in 2009 that focused solely on risk and audit issues.
The Audit Committee undertakes an annual evaluation to assess the independence and objectivity of the external auditors and the effectiveness of the audit process, taking into consideration relevant professional and regulatory requirements. The outcomes of this evaluation are considered by the Board together with the Group Audit Committee’s recommendation on the re-appointment of the external auditors or whether to commence an audit tender process. The annual evaluation is carried out following completion of the annual accounts and audit.
Deloitte LLP have been the company’s auditors since March 2000. The external auditors are required to rotate the lead audit partner responsible for the audit every five years. The current lead audit partner has completed his fifth year and accordingly, a new audit partner will lead the audits for the year ending 31 December 2010. There are no contractual obligations restricting the company’s choice of external auditor.
174
Governance
The Audit Committee is responsible for making recommendations to the Board, for it to submit the Audit Committee’s recommendations to shareholders for their approval at the Annual General Meeting in relation to the appointment, reappointment and removal of the external auditors. The Board has endorsed the Audit Committee’s recommendation that shareholders be requested to approve the reappointment of Deloitte LLP as external auditors at the Annual General Meeting in April 2010.
The Audit Committee also fixes the remuneration of the external auditors as authorised by shareholders at the Annual General Meeting.
The Audit Committee approves the terms of engagement of the external auditors.
It is intended that there will be an external review of the effectiveness of Group Internal Audit every three to five years, in line with best practice, with internal reviews continuing in the intervening years. Ernst and Young will conduct an external review of the 2009 performance of Group Internal Audit in 2010. Internal reviews were undertaken of 2008 and 2009 performance, both of which concluded that the function operated effectively and the Board agreed with the Audit Committee findings.
It is also intended that there will be an external review of the effectiveness of the Audit Committee every three to five years, with internal reviews by the Board continuing in the intervening years.
PricewaterhouseCoopers conducted an external review of the effectiveness of the Audit Committee in 2005. In 2009, the Group Audit Committee performance evaluation was conducted externally by Spencer Stuart as part of the Board and Senior Committee evaluation process. The evaluation used detailed questionnaires and individual meetings were held with each member. Amongst the areas reviewed were the role of the Board and Committees, composition, meetings and processes, performance and reporting, and external relationships. The Board has considered and discussed reports on the outcomes of the evaluations and is satisfied with the way in which the evaluations have been conducted, the conclusions and the actions being progressed.
Since 2005, divisional audit committees have been responsible for reviewing each division’s business. During 2009, the divisional audit committee structure was revised to reflect organisational changes including the creation of the Non-Core Division. The divisional audit committees report to the Audit Committee and the Audit Committee is satisfied that these committees continue to discharge their terms of reference.
Archie Hunter
Chairman of the Audit Committee
24 February 2010
175
Internal Control
Management of The Royal Bank of Scotland Group (“the Group”) is responsible for the Group’s system of internal control that is designed to facilitate effective and efficient operations and to ensure the quality of internal and external reporting and compliance with applicable laws and regulations. In devising internal controls, the Group has regard to the nature and extent of the risk, the likelihood of it crystallising and the cost of controls. A system of internal control is designed to manage, but not eliminate, the risk of failure to achieve business objectives and can only provide reasonable, and not absolute, assurance against the risk of material misstatement, fraud or losses.
Management’s report on internal control over financial reporting
Management of the Group is responsible for establishing and maintaining adequate internal control over financial reporting for the Group.
The Group’s internal control over financial reporting is a component of an overall system of internal control. The Group’s internal control over financial reporting is a process designed to provide reasonable assurance regarding the preparation, reliability and fair presentation of financial statements for external purposes in accordance with International Financial Reporting Standards (“IFRS”) and it includes:
| • | Policies and procedures that relate to the maintenance of records that, in reasonable detail, fairly and accurately reflect the transactions and disposition of assets. |
| • | Controls providing reasonable assurance that transactions are recorded as necessary to permit the preparation of financial statements in accordance with IFRS, and that receipts and expenditures are being made only as authorised by management. |
| • | Controls providing reasonable assurance regarding prevention or timely detection of unauthorised acquisition, use or disposition of assets that could have a material effect on the financial statements. |
Because of its inherent limitations, internal control over financial reporting may not prevent or detect misstatements. In addition, projections of any evaluation of effectiveness to future periods are subject to the risk that controls may become inadequate because of changes in conditions or because the degree of compliance with policies or procedures may deteriorate.
Management assessed the effectiveness of the Group’s internal control over financial reporting as of 31 December 2009 based on the criteria set forth by the Committee of Sponsoring Organizations of the Treadway Commission in “Internal Control – Integrated Framework”.
Based on its assessment, management believes that, as of 31 December 2009, the Group’s internal control over financial reporting is effective.
The effectiveness of the Group’s internal control over financial reporting as of 31 December 2009 has been audited by Deloitte LLP, the Group’s independent registered public accounting firm. The report of the independent registered public accounting firm to the directors of the Royal Bank of Scotland Group plc expresses an unqualified opinion on the effectiveness of the Group’s internal control over financial reporting as of 31 December 2009.
Disclosure controls and procedures
As required by US regulations, the effectiveness of the company’s disclosure controls and procedures (as defined in the rules under the US Securities Exchange Act of 1934) have been evaluated. This evaluation has been considered and approved by the Board which has instructed the Group Chief Executive and the Group Finance Director to certify that, as at 31 December 2009, the company’s disclosure controls and procedures were adequate and effective and designed to ensure that material information relating to the company and its consolidated subsidiaries would be made known to them by others within those entities.
Changes in internal control
There was no change in the company’s internal control over financial reporting that occurred during the period covered by this report that has materially affected, or is reasonably likely to materially affect, the company’s internal control over financial reporting.
176
Corporate governance continued
We have audited the internal control over financial reporting of The Royal Bank of Scotland Group plc and subsidiaries (“the Group”) as of 31 December 2009, based on criteria established in Internal Control—Integrated Framework issued by the Committee of Sponsoring Organizations of the Treadway Commission.
The Group's management is responsible for maintaining effective internal control over financial reporting and for assessing its effectiveness as described in Management’s Report on Internal Control Over Financial Reporting. Our responsibility is to express an opinion on the Group's internal control over financial reporting based on our audit.
We conducted our audit in accordance with the standards of the Public Company Accounting Oversight Board (United States). Those standards require that we plan and perform the audit to obtain reasonable assurance about whether effective internal control over financial reporting was maintained in all material respects. Our audit included obtaining an understanding of internal control over financial reporting, assessing the risk of whether a material weakness existed, testing and evaluating the design and operating effectiveness of internal control based on the assessed risk, and performing such other procedures as we considered necessary in the circumstances. We believe that our audit provides a reasonable basis for our opinion.
A company's internal control over financial reporting is a process designed by, or under the supervision of, the company's principal executive and principal financial officers, or persons performing similar functions, and effected by the company's board of directors, management, and other personnel to provide reasonable assurance regarding the reliability of financial reporting and the preparation of financial statements for external purposes in accordance with generally accepted accounting principles. A company's internal control over financial reporting includes those policies and procedures that (1) pertain to the maintenance of records that, in reasonable detail, accurately and fairly reflect the transactions and dispositions of the assets of the company; (2) provide reasonable assurance that transactions are recorded as necessary to permit preparation of financial statements in accordance with generally accepted accounting principles, and that receipts and expenditures of the company are being made only in accordance with authorisations of management and directors of the company; and (3) provide reasonable assurance regarding prevention or timely detection of unauthorised acquisition, use, or disposition of the company's assets that could have a material effect on the financial statements.
Because of the inherent limitations of internal control over financial reporting, including the possibility of collusion or improper management override of controls, material misstatements due to error or fraud may not be prevented or detected on a timely basis. Also, projections of any evaluation of the effectiveness of the internal control over financial reporting to future periods are subject to the risk that the controls may become inadequate because of changes in conditions, or that the degree of compliance with the policies or procedures may deteriorate.
In our opinion, the Group maintained, in all material respects, effective internal control over financial reporting as of 31 December 2009, based on the criteria established in Internal Control—Integrated Framework issued by the Committee of Sponsoring Organizations of the Treadway Commission.
We have also audited, in accordance with the standards of the Public Company Accounting Oversight Board (United States), the consolidated financial statements as at and for the year ended 31 December 2009 of the Group and our report dated 24 February 2010 (31 March 2010 as to the consolidating financial information included in Note 43 of the financial statements) expressed an unqualified opinion on those financial statements.
/s/ DELOITTE LLP
Edinburgh, United Kingdom
24 February 2010
177
Corporate governance continued
Board Risk Committee Report
Following publication of the Walker review’s initial recommendations in July 2009, the Board approved the creation of a Board Risk Committee. Terms of Reference for the Board Risk Committee, which are compliant with the final Walker review recommendations published on 26 November 2009, are available at www.rbs.com. The terms of reference will be considered annually by the Board Risk Committee and approved by the Board.
The current members of the Board Risk Committee are Philip Scott (Chairman), Colin Buchan, Sandy Crombie, Archie Hunter and Joe MacHale. All members of the Board Risk Committee are independent non-executive directors.
The Board Risk Committee will hold at least six scheduled meetings each year. The Board Risk Committee held its first meeting on 19 January 2010 and a second on 22 February 2010. Meetings are held as soon as practicable prior to Group Audit Committee meetings to ensure that the work of the two Committees is coordinated and consistent. A meeting will be held immediately prior to submission of the interim and annual financial statements to the Board and the quarterly Interim Management Statements. This core programme will be supplemented by additional meetings as required. Board Risk Committee meetings will be attended by relevant executive directors, risk management, finance executives and the internal auditors. External advice may be sought by the Board Risk Committee where considered appropriate. The Board Risk Committee has not sought external advice to date.
The Board Risk Committee is responsible for:
| · | providing oversight and advice to the Board in relation to current and potential future risk exposures of the Group and risk strategy, including determination of risk appetite and tolerance; |
| · | assisting the Board on such other matters as may be referred to it by the Board; |
| · | promoting a risk awareness culture within the Group; and |
| · | reporting to the Board, identifying any matters within its remit in respect of which it considers that action or improvement is needed and making recommendations as to the steps to be taken. |
Qualitative and quantitative information regarding the risks arising from the Group’s financial instruments required under International Financial Reporting Standard (IFRS) 7, are incorporated within the financial statements and Business review.
The Board Risk Committee will play a key role in the review, design and implementation of risk management and measurement strategies and risk management policy across the Group.
The Board Risk Committee will consider the Group’s risk profile relative to current and future Group Strategy. The Committee will report to the Board following each meeting on its consideration of the risk profile of the Group and any longer term macro or perceived strategic threats to the Group and will make recommendations as appropriate.
The Group risk appetite framework remains under development and work continues on enhancing risk limits and key risk measures. Risk appetite will be regularly reviewed by the Committee and the Committee will make recommendations to the Board as to risk appetite and tolerance as part of this ongoing process.
The Committee will also consider the Group’s exposure to country, single name and sector concentration risk and will ensure rigorous stress and scenario testing of the Group’s business is undertaken. The output of this testing will be reviewed by the Committee with a view to ensuring appropriate actions are taken where necessary. In due course it will make recommendations to the Group Board regarding related authorities, limits and mandates.
As required under the Walker review, the Committee will meet as required to review the due diligence of any proposed strategic transaction (involving a merger, acquisition or disposal) prior to the Group Board approval of the transaction.
The Committee will approve the operational plan for RBS Risk Management. It will consider the adequacy and effectiveness of resource and the scope and nature of the work undertaken by the function.
The Committee will consider the adequacy and effectiveness of the technology infrastructure supporting the finance and risk management framework.
The Committee will review the risk input to divisional bonus pools and will provide advice to the Remuneration Committee on risk weightings to be applied to performance objectives which are incorporated within the incentive structure for the Group’s senior executives.
The Committee will ensure that it has substantial oversight of the work being undertaken within the divisions through the existing Divisional Audit Committee structure, in conjunction with the Group Audit Committee.
Philip Scott
Chairman of the Board Risk Committee
24 February 2010
178
Governance
Letter from the Chairman of the Remuneration Committee
Dear shareholder,
Remuneration is one of the most challenging issues currently facing RBS. The Remuneration Committee has sought to reflect public sentiment on this issue and the Group’s results, balanced with the need to remain competitive and retain individuals that are central to the future success of the Group. We are especially conscious of the public hostility to some of the higher levels of banking pay and the special scrutiny in such cases as RBS which is reporting an overall loss. We are trying to react to this responsibly, but if the staff needed to restore the Group’s fortunes feel they will be treated worse than at competitors, we will fail to retain or recruit and thereby fail in our turnaround goals for RBS. Those responsible for the major failings have left. Our remaining staff are performing well in profitable businesses or engaged in the challenging task of turning around our more difficult legacy cases.
The principles I outlined to you in my letter last year connected the long-term interests of shareholders and customers with the performance of staff. These principles were the beginning of a fundamental reform of remuneration within the Group. During 2009, a thorough review of remuneration policies, processes and governance at RBS was undertaken. We have committed to positioning the Group at the leading edge of the financial services sector reform of remuneration and the changes we are making will help us reach this position. The framework that the Remuneration Committee has established has strengthened both the performance management processes and the link between risk and reward. The basis of the framework is:
| · | a performance management process which ensures all employees know what is expected of them and includes a rigorous review of their achievements; |
| · | pay for performance – all annual and longer term awards are subject to challenging and measurable performance criteria directly linked to the Group’s strategic plan; |
| · | deferral – a significant proportion of annual awards are deferred and longer term awards are subject to a three year performance period; |
| · | clawback – awards can be subject to clawback and may be withheld if the results later turn out not to reflect sustained longer term performance; and |
| · | use of shares for bonuses to align interests of employees with shareholders. |
The Remuneration Committee appreciates that this has been another difficult year for our staff and their families as we restructure the business. The reality is that it is the hard work of our staff over many years that has resulted in a core set of resilient and valuable businesses that will drive our recovery. The performance of the core business remains strong due to the incredible focus our employees have maintained on our customers. It is for that reason we continue to create an environment in which our staff can meet their ambitions as we work with them to restore and then transform the Group into one of the world’s most admired, valued and stable banks.
The Remuneration Committee is acutely aware of the additional responsibilities it carries as a consequence of the support RBS has received from the UK Government. RBS fully intends to be a responsible steward of this investment. The Board believes that pay must be both appropriately restrained but commercial and fair. Our plans take account of the need for a careful balance to be struck reflecting competitor positions, the UK bonus tax, the overall results of RBS and the capital support the Group has received.
The Remuneration Committee reviewed remuneration policies, processes and practices across the Group to ensure that they support the strategic goals of RBS which are to serve institutions well, to return to standalone strength, to return shareholder value, and to reflect best practice and regulatory requirements. We have taken into account the recommendations on remuneration made by the G20, the FSA and the Walker review and we are working towards implementation. The Remuneration Committee very much hopes that the implementation of these recommendations creates a level playing field for all banks internationally. We cannot set remuneration policy in isolation as to do so would neither reflect the competitive environment nor enable us to attract and retain employees of the calibre necessary to rebuild the Group and deliver long- term shareholder value.
During the year, the Remuneration Committee’s activities have focused on:
| · | ensuring that the Group’s remuneration policies, procedures and practices are effective and promote the highest possible standards of risk management; |
| · | designing policies to ensure that remuneration is appropriately competitive in the markets, sectors and geographies in which RBS operates, and is related to individual, business unit and Group performance; |
| · | strengthening the link between remuneration and risk taken and taking advice from the newly-formed Board Risk Committee; |
| · | developing and implementing a rigorous approach to performance management, using appropriate risk-adjusted performance measures and taking into account the full costs and capital allocated to individual businesses; |
179
Letter from the Chairman of the Remuneration Committee continued
| · | reviewing the remuneration of employees who have a material impact on Group performance. This includes new processes for reviewing remuneration for newly recruited senior individuals, who are critical to the long-term success of RBS; and |
| · | reviewing and providing a strategic overview of all bonus and long-term incentive plans operating in RBS to ensure their compliance with shareholder interests, best industry practice and the requirements of the FSA’s Code of Practice on Remuneration. |
The outcome of the Remuneration Committee’s review has included:
| · | a clear governance framework for incentive plans across the Group, involving the Risk and HR functions at all key decision points; |
| · | a structure of deferment for incentives for up to three years, with the ability to claw back any that are shown to have been based on misstated or misleading results; |
| · | agreement with the Group’s major shareholder, UKFI, on the overall level of bonuses in respect of 2009 performance and the arrangements for their deferment in stages to 2012; and |
| · | a new long-term incentive plan which is being submitted to shareholders for approval at the Annual General Meeting following a comprehensive consultation with major institutional shareholders. This plan includes a new approach to performance measures to ensure that awards vest only if the Remuneration Committee is satisfied that the performance achieved is in line with the Board’s risk policies and that a balanced performance has been achieved across a number of risk adjusted metrics. |
During the year the terms of reference of the Remuneration Committee were broadened to include oversight of remuneration policies for all employees across the Group. To reflect its work, the report of the Remuneration Committee contains not only information on executive remuneration, but also a statement of the remuneration policies which will apply across the whole of the Group.
The remuneration environment is evolving and while I acknowledge there is still more work to be done, we have already made significant changes and continue to be one of the leaders in the sector in the reform of our remuneration policies. The Remuneration Committee has made significant progress in overseeing the development of policies, processes and practices that will ensure that employee remuneration at RBS is properly controlled and fully aligns sustainable performance with the long term interests of shareholders and customers.
Colin A. M. Buchan
Chairman of the Remuneration Committee
24 February 2010
180
Governance
Directors’ remuneration report
The Remuneration Committee
The current members of the Remuneration Committee are Colin Buchan (committee Chairman since February 2009), Sandy Crombie, Penny Hughes and John McFarlane. The members of the Remuneration Committee are all independent non-executive directors. Attendance of each member at meetings of the Remuneration Committee in 2009 is shown on page 172.
Jim Currie, Janis Kong, Sir Tom McKillop, Bob Scott and Peter Sutherland were members of the Committee until February 2009 when they ceased to be directors.
Philip Hampton was a member of the Remuneration Committee until 4 August 2009, when he was replaced as a member by Sandy Crombie.
The Remuneration Committee is responsible for the overview of the Group’s Policy on Remuneration, as well as considering executive remuneration and, as required, making recommendations to the Group Board in respect of the remuneration arrangements of the executive directors of the Group. The Board as a whole reserves the authority to make the final determination of the remuneration of directors as it considers that this two-stage process allows greater consideration and evaluation and is consistent with the unitary nature of the Board. No director is included in decisions regarding his or her own remuneration.
The Remuneration Committee is also responsible for setting the remuneration arrangements for members of the Group Executive Committee and Management Committee and any employees falling within the definition of principle 8 of the FSA Code. Details of the FSA Code can be found at www.fsa.gov.uk.
The terms of reference for the Remuneration Committee have been reviewed. The revised terms of reference extend the remit of the Committee to oversight of Group-wide remuneration policy to ensure that the Group’s remuneration arrangements are consistent with and promote effective risk management. The Committee will undertake a regular review of the adequacy and effectiveness of the remuneration policy to ensure it is fully aligned with the Group’s long-term objectives. The Committee receives a number of reports to assist it in its oversight of remuneration policy, such as on risk and management performance across the Group.
During the year, the Remuneration Committee received advice from Watson Wyatt (now Towers Watson) on matters relating to directors’ remuneration in the UK, together with advice from the Group Director, Human Resources and the Group General Counsel and Group Secretary on general remuneration matters. In addition, the Remuneration Committee has taken account of the views of the Group Chief Executive on performance assessment of the executive directors and members of the Group Executive Committee and Management Committee.
Towers Watson are signatories to the voluntary Code of Conduct in relation to executive remuneration consulting in the UK. The relationship between the Remuneration Committee and Towers Watson takes account of this code.
Towers Watson also provided professional services in the ordinary course of business, including actuarial advice and benefits administration services to subsidiaries of the Group and investment consulting and actuarial advice to the trustees of some of the Group’s pension funds. The advisers to the Remuneration Committee are appointed independently by the Committee, which reviews its selection of advisers annually. The Committee is satisfied that the consultants from Towers Watson who advise the Committee operate independently of the consulting teams undertaking other work with the Group.
Group-wide remuneration policy
The objective of the Group’s remuneration policy is to provide, in the context of the Group’s business strategy, remuneration in form and amount which will attract, retain, motivate and reward high calibre employees to deliver superior long-term business performance within acceptable risk parameters. The remuneration policy is designed to ensure that the Group’s metrics, reward structures and governance processes as a whole provide comprehensive coverage of the key risks in an appropriate way.
An overarching set of principles has been implemented which provides a framework for the design of reward programmes across the Group. Policy standards ensure reward, benefits and support packages are provided which are aligned to business objectives and which are market facing and appropriately aligned with shareholders’ long term interests. The aspirations of the Group must be supported by reward programmes that recognise the capabilities and achievements of individual employees and that reward significant and sustained individual and business unit performance.
The key aspects of the remuneration policy are as set out below:
Pay-for-performance
| · | The pay-for-performance systems should be underpinned by a robust performance management system. |
| · | Reward should be linked to business performance and appropriate account should be taken of risk factors associated with that business. |
Market facing
| · | Reward offerings in the markets where the Group operates should be understood and reward programmes should be designed and developed that offer value for money. |
| · | Total compensation (comprising base pay progression and variable pay), benefits and long-term incentives should generally target a market position consistent with ensuring competitiveness and which allows a higher positioning for the highest performers. |
Allow for customisation
| · | The composition of reward should allow for customisation through individual choice. |
| · | Reward should support the diversity of the Group’s employees. |
181
Directors’ remuneration report continued
Compliance and governance
Reward design and delivery should comply with appropriate policy, standards, be aligned to industry best practice, meet relevant regulators’ criteria and be consistent with effective risk management and the long term interests of shareholders.
The remuneration policy as regards individual elements of employees’ remuneration packages are as follows:
Base salary
Base salaries are generally set around market median competitiveness, in the context of competitive annual compensation and total compensation. Base salaries are appropriate in the specific market for the business in which an individual works and for the talents, skills and competencies that the individual brings to the Group. The level of fixed pay should be sufficient so that inappropriate risk-taking is not encouraged.
Short-term incentives
The policy in respect of short-term incentives is to reward good financial and non-financial performance that supports the business strategy, taking into account the Group’s risk appetite and personal contribution in a clear and reasonable way against targets that are specific, measurable, set at the beginning of the year and communicated to the employees.
Specific design principles for short-term incentives are in place, with strict governance procedures that ensure that all existing and future incentive schemes support the Group’s business strategy and risk appetite. All short-term incentives are subject to appropriate governance, including review by the risk management, finance and human resources functions.
The way in which expenditure on short term incentives is linked to business performance has been significantly amended to take account of FSA principles in both design and delivery to individual employees. Expenditure will be reviewed by the Remuneration Committee, against the context of a range of performance metrics. The key metric that will be considered is risk-adjusted profit in excess of the cost of capital, with the cost of liquidity and all of the risks associated with the underlying business performance also taken into account. Where risk factors do not readily lend themselves to quantitative analysis then these may be factored in as adjustments, on the recommendation of Group Risk Management. The Board Risk Committee will also provide assurance, on an arms-length basis, as to the appropriateness of the proposed adjustments for these additional risk factors. Allocation of the expenditure will depend on individual performance and on each employees’ performance rating. Ratings are based on an assessment of performance during a single year, against a full range of measures including both financial and non-financial measures which take risk into account. The Group discourages the use of guaranteed bonuses and will not agree to any that span longer than a single financial year.
Performance awards for 2009 to those earning over £39,000 will be deferred and paid in three tranches over the period to June 2012.
Selected senior individuals in Global Banking & Markets will receive part of their awards for performance in 2009 in shares which require to be held by recipients until January 2015. Participants will be able to sell sufficient shares to cover their tax liabilities which are incurred on vesting, but conditions remain on any further sales before 2015. In order for any further sales to occur prior to 2015, participants would need to hold shares under Group Schemes to at least the gross value of their awards.
Deferred award
The purpose of deferred awards is to support a performance culture where employees recognise the importance of sustainable Group, business and individual performance. A significant proportion when compared with the fixed component of selected individual awards will be deferred over a three year period.
A new deferral plan was approved by shareholders on 15 December 2009. Under the new plan, short-term incentives will be deferred into bonus awards vesting over a three year period in the form of RBS shares for the outer years. Deferral into shares helps to align the reward of participants with the long-term interests of shareholders. The terms of the deferral plan provides for “clawback” which allows the Remuneration Committee retrospectively to limit any compensation at the time of vesting if it considers that the performance factors on which reward decisions were based have later turned out not to reflect the corresponding performance in the longer term. The intention is to allow the Group to adjust historic compensation for unforeseen issues arising during the deferral period, particularly those that do not easily lend themselves to quantitative measurement.
Long-term incentive plans
The Group provides employees in senior roles (executive level and senior managers by nomination) the opportunity to receive annual awards of long-term incentives. The objective is to encourage the creation of value over the long term and to align the rewards of the participants with the returns to shareholders.
Shareholder approval will be sought at the Annual General Meeting on 28 April 2010 for a new long term incentive plan, which will replace the existing Medium Term Performance Plan and Executive Share Option Plan. The key design features of the new long term incentive plan are:
| · | awards will be structured as performance-vesting deferred shares; |
| · | at the discretion of the Remuneration Committee recipients will be able to elect whether they receive their award in the form of shares, or convert a portion of their award into market-value share options with the same performance conditions. The conversion rate between shares an d options will be set so as to be broadly cost neutral. It is not the intention of the Remuneration Committee to offer this choice to participants for the initial award; |
182
Governance
| · | the primary requirement for awards to vest is that the Remuneration Committee should be satisfied that risk management during the performance period has been effective at a Group and division/ functional level. The Remuneration Committee’s determination will be informed by input from the Group’s Board Risk Committee and the Chief Risk Officer. Specifically, prior to vesting, the Remuneration Committee will have regard to risk and compliance across the Group divisions and make an assessment of future risks as appropriate. It will also review whether there are any individual or more general cases where clawback should be operated; | |
| · | for participants below Board level, vesting of share and option awards will be based on delivery of the strategic plan. Performance be considered against metrics that reflect the five strategic tests in the strategic plan including: | |
| - | risk measures | |
- | returns | |
- | efficiency | |
- | growth | |
- | customer franchise measure | |
For the most senior roles, vesting will be based partly on divisional or functional performance and partly on performance across RBS Group. From a behavioural perspective, the Remuneration Committee must also be satisfied that financial results have been achieved without excessive risk. The Remuneration Committee will consider both the financial performance and risk information and assess whether it considers that the outcome driven by the metrics on which vesting of share awards depends is appropriate against this context; | ||
| · | for awards granted in 2010, performance will be measured over a year period, and the Remuneration Committee will review this for future years’ awards; and | |
| · | clawback will apply to all awards. This allows the Remuneration to retrospectively limit any compensation at the time of were based have later turned out not to reflect the performance in the long-term. | |
Pension arrangements
The Group provides competitive retirement benefits in a manner that does not create an unacceptable level of risk for the Group. New employees are eligible for a cash allowance in lieu of pension provision and the facility to choose to have part of their remuneration in the form of contributions to The Royal Bank of Scotland Group Retirement Savings Plan.
Some employees continue to participate in defined benefit arrangements. The following two changes have been made to the main defined benefit pension plans:
| · | a yearly limit on the amount of any salary increase that will count for pension purposes; and |
| · | a reduction in the severance lump sum for those who take an immediate undiscounted pension for redundancy. |
Executive remuneration policy
Components of executive directors’ remuneration 2010
Salary
Base salaries of executive directors are reviewed annually. It has been agreed that no increases in base salaries will be made as part of the 2010 review.
Benefits
Executive directors are eligible to receive various employee benefits or a cash equivalent from a flexible benefits account, on a similar basis to other employees.
Details of pension arrangements of directors are shown on page 192. Executive directors also receive death-in-service cover.
For all executive directors joining on or after 1 October 2006, pension provision is in the form of a pension allowance which may be used to participate in The Royal Bank of Scotland Group Retirement Savings Plan which is open to all employees, or to invest in alternative pension arrangements, or to take all or some of the allowance in cash. In addition, as employees, executive directors are eligible to participate in Sharesave and Buy As You Earn Plans. These plans are not subject to performance conditions since they are operated on an all-employee basis.
The 2008 Report and Accounts reported on the pension paid to the former Group Chief Executive, Sir Fred Goodwin, on his retirement from the Group on 31 January 2009. Following discussions between Sir Fred and the Group, he volunteered to make a substantial reduction to his pension to the level of £342,500 a year.
Gordon Pell will retire from the Group and the Board on 31 March 2010, shortly after his normal pension age of 60. Details of his pension are shown in this report. As agreed by the Board in 2005 his pension is based on his 39 years of service with Lloyds TSB and the Group, part of which has been funded by a transfer payment from a Lloyds TSB pension plan.
Following Gordon Pell’s retirement, no current director will be a member of one of the Group’s final salary pension plans. The RBS Group Pension Fund is closed to employees, including executive directors, joining the Group after 30 September 2006. Any new executive director would only be a member if he or she is already a current employee who is a member of the plan. The provision for an undiscounted pension on early retirement at employer request would not apply to any executive director appointed in the future.
183
Directors’ remuneration report continued
Annual incentives
Annual incentives awarded to executive directors in respect of 2009 performance will be granted under the terms of the new deferral plan which was approved by shareholders in December 2009. In respect of 2009, the Remuneration Committee reviewed the annual incentive payments for executive directors, taking into account performance against targets for the year and targets relating to the strategic plan. As a result, the Remuneration Committee proposed annual incentive payments for Stephen Hester, Gordon Pell and Bruce Van Saun.
The Group Chief Executive, Stephen Hester, has declined his annual performance bonus for 2009 in the light of the public controversy currently prevailing on pay and the potential impediment taking such an award might have on support for the RBS turnaround which he was hired 15 months ago to lead. The Remuneration Committee, considers that Stephen Hester significantly outperformed the targets he was set for 2009 and intended to award a bonus commensurate with that view. In the light of Stephen Hester’s request, but mindful of the importance of the turnaround plan delivery that he was hired to achieve, no bonus will be awarded to him in respect of 2009. However, it remains the Board’s intention over the course of the recovery period to reward the Group Chief Executive fairly, appropriately and at market levels for achievement against the targets we have published to make the bank safe, successful and valuable again.
The Deputy Group Chief Executive, Gordon Pell, has also requested to waive his annual bonus for 2009, and in light of his request the Board has agreed that no bonus will be awarded to him in respect of 2009 performance.
Executive directors have a normal maximum annual incentive opportunity of between 160% and 200% of salary (with an exceptional maximum opportunity of 200-250% of salary). The on-target opportunity is 107% to 133% of salary.
Any incentive payments to executive directors in 2010 will reflect performance across five performance categories: Strategic Direction, Finance and Operations, Stakeholders, Risk, Efficiency and Control and Capability and Development. Group business unit and functional performance will be considered as appropriate. Clawback provisions will apply.
Long-term incentives
The Group provides long-term incentives which are designed to link reward with the long-term success of the RBS Group. The awards are a significant investment in individuals by the RBS Group, and recognise the responsibility those participants have in driving its future success and for delivering share price growth.
In 2009, executive directors received long-term incentives under two plans, the Medium Term Performance Plan (MPP) and the Executive Share Option Plan (ESOP). Both plans contain clawback provisions that allow the Remuneration Committee to exercise its discretion over the vesting of awards made in 2009. More information on both of the plans can be found on pages 189 to 191.
Shareholder approval will be sought at the Annual General Meeting on 28 April 2010 for a new long-term incentive plan, to replace the above plans. The key design features of this plan are outlined on pages 182 and 183.
For executive directors, the proposed performance conditions focus on shareholder value, while factoring in the growing regulatory emphasis on risk-adjusted financial metrics. The proposal for awards in 2010 is that 50% of each award vesting is based on improvement in economic profit, 25% is based on relative Total Shareholder Return (TSR) and 25% is based on absolute TSR. There will also be an underpin whereby vesting levels may be adjusted depending on risk performance and achievements related to the strategic plan objectives.
It is anticipated that awards under the new long-term incentive plan will be made to executive directors following shareholder approval of the plan. Awards to executive directors will have a normal maximum limit of 400% of salary. In the event of exceptional circumstances and if the award policy for executive directors were to be increased from this level, shareholder consultation would be undertaken.
Shareholding guidelines
The Group operates shareholding guidelines for executive directors. The target shareholding level is 200% of gross annual salary for the Group Chief Executive and 100% of gross annual salary for executive directors. Executive directors have a period of five years in which to build up their shareholdings to meet the guideline levels.
Chairman – Philip Hampton
Following consultation with UKFI and other major shareholders, it was agreed that Philip Hampton would receive a one-off restricted stock award on his appointment as Chairman. This award is in the form of nil priced shares. The award was made on 27 February 2009 over 5,172,413 shares. These will vest, subject to the satisfaction of performance conditions, on the third anniversary of the date of grant. The performance conditions include measures on effective governance and stewardship of RBS, relationships with key stakeholders and delivery of value and return to shareholders.
In assessing performance to determine the vesting of this award, the Remuneration Committee will consider a number of factors which demonstrate whether Philip Hampton has led the successful and sustainable rebuilding of the Group. The Committee will also require to be satisfied that the vesting level is commensurate with the underlying financial performance of the Group.
Philip Hampton has voluntarily agreed that he will retain at least half of the vested shares for a further period of 12 months after the vesting date. This reflects his personal commitment to driving the Group’s performance over the longer term.
184
Governance
Group Chief Executive – Stephen Hester
Stephen Hester received certain share awards on appointment as Group Chief Executive and share awards to replace bonus and share awards he forfeited on leaving The British Land Company PLC. He was granted conditional share awards over a total of 10,407,081 shares. Subject to their terms, the majority of these awards vest between February 2009 and the third anniversary of his appointment as Group Chief Executive.
In 2009, Stephen Hester received an award over 4,800,000 shares under the MPP and options over 9,550,000 shares under the ESOP. The performance conditions attached to the vesting of these awards are based on absolute and relative Total Shareholder Return metrics as described on page 191. Before the Remuneration Committee will permit any of Stephen Hester’s shares to vest, it will consider underlying financial performance of the Group and whether this performance is delivered in a way which is consistent with effective risk management.
Stephen Hester has voluntarily agreed to retain any shares that he receives under the MPP in 2009 for a further two years past the vesting date. This reflects his personal commitment to driving the Group’s performance over the longer term.
Group Finance Director – Bruce Van Saun
On joining the Group, Bruce Van Saun was made a conditional share award of 1,810,611 shares under the MPP and options over 905,306 shares under the ESOP. Both awards will vest on 8 September 2012, the third anniversary of him joining the Group, and are subject to performance conditions.
The ESOP and MPP awards made to Bruce Van Saun are subject to the same absolute and relative TSR targets that apply to Stephen Hester’s awards, including the performance underpin allowing the Remuneration Committee to adjust awards if the vesting outcome does not reflect the Group’s underlying performance and management of risk.
UK-based executive directors’ remuneration balance
Executive director (including Chief Executive) pay mix
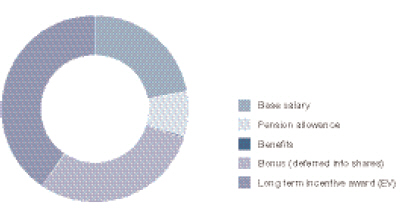
The chart above shows the make up of remuneration opportunity for on-target annual performance, and with long term incentive awards shown at their fair value at the date of grant. Short term incentive payments earned in relation to 2010 performance will be deferred and will vest, subject to satisfactory performance. The actual value of the long term incentive awards will depend on performance over the period 2010 to 2012 and the share price at the time the awards vest.
Non-executive directors
The level of remuneration for non-executive directors reflects the responsibility and time commitment of directors and the level of fees paid to non-executive directors of comparable major UK companies. Non-executive directors do not participate in any incentive or performance plan. Non-executive director fees are reviewed regularly. There was no change in fees during 2009.
Total shareholder return performance
The performance graphs below illustrate the performance of the company over the past five years in terms of total shareholder return compared with that of the companies comprising the FTSE 100 Index. This Index has been selected because it represents a cross-section of leading UK companies. The total shareholder return for FTSE banks for the same period has been added for comparison. The total shareholder return for the company and the indices have been rebased to 100 for 2004.

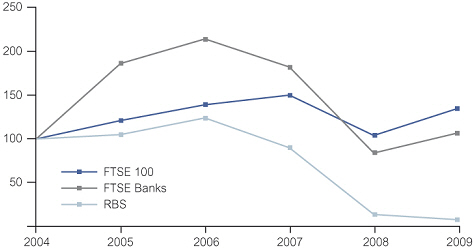
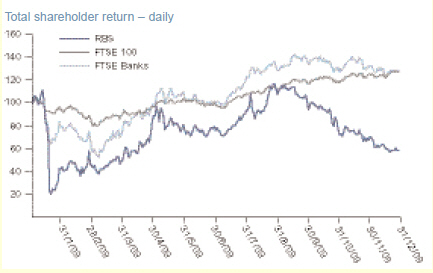
185
Directors’ remuneration report continued
Service contracts
The company’s policy in relation to the duration of contracts with directors is that executive directors’ contracts generally continue until termination by either party, subject to the required notice, or until retirement. The notice period under the service contracts of executive directors will not normally exceed 12 months. In relation to newly recruited executive directors, subject to the prior approval of the Remuneration Committee, the notice period may be extended beyond 12 months if there is a clear case for this. Where a longer period of notice is initially approved on appointment, it will normally be structured such that it will automatically reduce to 12 months in due course.
All new service contracts for executive directors are subject to approval by the Remuneration Committee. Those contracts normally include standard clauses covering the performance review process, the company’s normal disciplinary procedure, and terms for dismissal in the event of failure to perform or in situations involving actions in breach of the Group’s policies and standards.
Any compensation payment made in connection with the departure of an executive director will be subject to approval by the Remuneration Committee, having regard to the terms of the service contract and the reasons for termination. Any Board members who leave the company in the future will receive a severance package which is reasonable and perceived as fair.
No compensation payment was made to Guy Whittaker in respect of his ceasing to be a director.
Information regarding directors’ service contracts is shown below:
| Date of | Notice period – | Notice period – | |
| current contract | from company | from executive | |
| Executive directors | |||
| Stephen Hester | 4 November 2008 | 12 months | 12 months |
| Gordon Pell | 20 February 2006 | 12 months | 6 months |
Bruce Van Saun (1) | 8 September 2009 | 12 months | 12 months |
| Former executive directors | |||
Guy Whittaker (2) | 19 December 2005 | 12 months | 12 months |
Notes:
| (1) | Appointed as a director on 1 October 2009. |
| (2) | Ceased to be a director on 30 September 2009. |
Except as noted below, in the event of severance where any contractual notice period is not worked, the employing company may pay a sum to the executive in lieu of the notice period. In the event of situations involving breach of the employing company’s policies resulting in dismissal, reduced or no payments may be made to the executive. Depending on the circumstances of the termination of employment, the executive may be entitled, or the Remuneration Committee may exercise its discretion to allow, the executive to exercise outstanding awards under long-term incentive arrangements subject to the rules of the relevant plan.
Stephen Hester
In the event that Stephen Hester’s employment is terminated by the company (other than by reason of his personal underperformance), the following will apply. First, he will be entitled to receive a payment in lieu of notice to the value of base salary, bonus and benefits (including pension contributions). Secondly, any share awards granted to him to replace bonus and share awards he forfeited on leaving The British Land Company PLC will vest immediately on such termination.
If Stephen Hester’s employment is terminated by reason of his personal underperformance, the company is entitled to terminate by giving written notice with immediate effect and without making any payment in lieu thereof and Stephen Hester will forfeit any unvested stock awards. If he resigns voluntarily and the company does not require him to work out his notice period, Stephen Hester may receive a payment in lieu of notice based on salary only (i.e. no bonus or benefits) and he will also forfeit any unvested stock awards.
Gordon Pell
Gordon Pell will retire from employment of the Group on 31 March 2010. In the event that Gordon Pell’s employment has been terminated by notice, any payment in lieu of notice would have been based on salary only (i.e. not bonus or benefits). Gordon Pell is a member of The Royal Bank of Scotland Group Pension Fund (the RBS Fund) and is contractually entitled to receive all pension benefits in accordance with its terms which apply to all members. The RBS Fund rules allow all members, including executive directors, who retire early at the request of their employer to receive a pension based on accrued service with no discount applied for early retirement. Gordon Pell attained his normal pension age of 60, according to the rules of the Group Pension Fund, on 23 February 2010 and from that date, no discount applies on payment of his pension.
Bruce Van Saun
In the event Bruce Van Saun’s employment is terminated by reason of his personal underperformance, the company is entitled to terminate by giving written notice with immediate effect and without making any payment in lieu of notice. Any payment in lieu of notice that may be made to Bruce Van Saun would be based on salary only (i.e. not bonus or benefits).
The company has agreed that, provided certain conditions are met, on leaving employment, Bruce Van Saun will not forfeit awards under the rules of the Deferral Plan, the MPP and the ESOP.
186
Governance
Chairman and non-executive directors
The original dates of appointment as directors of the company and the dates for the Chairman and non-executive directors next election or re-election are as follows:
| Date for election | |||
| Date first appointed | or next re-election | ||
| Philip Hampton | 19 January 2009 | 2010 | (1) |
| Colin Buchan | 1 June 2002 | 2011 | |
| Sandy Crombie | 1 June 2009 | 2010 | |
| Penny Hughes | 1 January 2010 | 2010 | |
| Archie Hunter | 1 September 2004 | 2010 | (2) |
| Joe MacHale | 1 September 2004 | 2010 | |
| John McFarlane | 1 October 2008 | 2012 | |
| Art Ryan | 1 October 2008 | 2012 | |
| Philip Scott | 1 November 2009 | 2010 |
Notes:
| (1) | In accordance with the Walker review recommendations and with effect from the 2010 Annual General Meeting the Chairman will propose himself for re-election annually. |
| (2) | Will not seek re-election at the 2010 Annual General Meeting. |
Under the company’s Articles of Association, all directors must retire and seek re-election by shareholders at least every three years. The dates in the table above reflect the latest date for election or re-election.
The non-executive directors do not have service contracts or notice periods although they have letters of engagement reflecting their responsibilities and commitments. These letters make clear to non-executive directors the time commitment they are expected to give to their Board duties. Philip Scott’s and Penny Hughes’ letters clearly state that the time commitment should be in line with the Walker review. No compensation would be paid to any non-executive director in the event of termination.
Philip Hampton is entitled to receive a cash payment in lieu of notice if his appointment is terminated as result of the Group’s majority shareholder seeking to effect the termination of his appointment. The applicable notice period is 12 months. In the event that the company terminates Philip Hampton’s appointment without good reason, or his re-election is not approved by shareholders in General Meeting resulting in the termination of his appointment, he will be entitled to receive a cash payment in lieu of notice of 12 months’ fees.
187
Directors’ remuneration report continued
Directors’ remuneration
The tables and explanatory notes on pages 188 to 192 report the remuneration of each director for the year ended 31 December 2009 and have been audited by the company’s auditors, Deloitte LLP.
| Salary/ | Performance | 2009 | 2008 | |||||||||||||||||
| fees | bonus(1) | Benefits | Total | Total | ||||||||||||||||
| £000 | £000 | £000 | £000 | £000 | ||||||||||||||||
| Chairman | ||||||||||||||||||||
| Philip Hampton | 700 | — | — | 700 | — | |||||||||||||||
| Executive directors | ||||||||||||||||||||
| Stephen Hester | 1,220 | — | 7 | 1,227 | 164 | |||||||||||||||
| Gordon Pell | 932 | — | 1 | 933 | 909 | |||||||||||||||
Bruce Van Saun (2) | 333 | 363 | 4 | 700 | — | |||||||||||||||
| Former Chairman and executive directors | ||||||||||||||||||||
Sir Tom McKillop (3,5) | 72 | — | — | 72 | 787 | |||||||||||||||
Guy Whittaker (4,5) | 635 | — | 3 | 638 | 833 | |||||||||||||||
Notes:
| (1) | Performance bonus payable in respect of performance during 2009 which will be awarded under the 2010 deferral plan and deferred until 2012. The performance bonus for Bruce Van Saun reflects his performance since joining the Group in October 2009, including completion of the APS, year end budget, capital planning and preparation for disposals. |
| (2) | Appointed as a director on 1 October 2009. |
| (3) | Appointed to the Board in September 2005 and retired as Chairman and as a director on 3 February 2009. |
| (4) | Ceased to be a director on 30 September 2009. |
| (5) | No payment for loss of office was made to Sir Tom McKillop or Guy Whittaker. |
| Board | ||||||||||||||||
| Board | committee | 2009 | 2008 | |||||||||||||
| fees | fees | Total | Total | |||||||||||||
| £000 | £000 | £000 | £000 | |||||||||||||
| Non-executive directors | ||||||||||||||||
| Colin Buchan | 73 | 79 | 152 | 130 | ||||||||||||
Sandy Crombie (1) | 88 | — | 88 | — | ||||||||||||
| Archie Hunter | 73 | 93 | 166 | 174 | ||||||||||||
| Joe MacHale | 73 | 38 | 111 | 106 | ||||||||||||
| John McFarlane | 73 | 20 | 93 | 18 | ||||||||||||
| Art Ryan | 73 | 19 | 92 | 18 | ||||||||||||
Philip Scott (2) | 25 | — | 25 | — | ||||||||||||
| Former non-executive directors | ||||||||||||||||
Dr Currie (3) | 8 | 2 | 10 | 89 | ||||||||||||
Bill Friedrich (3) | 8 | 4 | 12 | 106 | ||||||||||||
Bud Koch (3) | 8 | — | 8 | 73 | ||||||||||||
Janis Kong (3) | 8 | 2 | 10 | 89 | ||||||||||||
Sir Steve Robson (3) | 8 | 3 | 11 | 106 | ||||||||||||
Bob Scott (3, 4) | 18 | — | 18 | 174 | ||||||||||||
| Peter Sutherland | 8 | 3 | 11 | 102 | ||||||||||||
Notes:
(1) | Appointed as Senior Independent Director on 1 June 2009. His fee is inclusive and covers all Board and Board Committee work. |
(2) | Appointed as a director on 1 November 2009. |
(3) | Retired as a director on 6 February 2009. No compensation for loss of office was made. |
(4) | Fee is inclusive and covered all Board and Board Committee work. |
No director received any expense allowances chargeable to UK income tax or compensation for loss of office/termination payment. The non-executive directors did not receive any bonus payments or benefits.
188
Governance
Share options
The Executive Share Option Plan (ESOP) was approved by shareholders at the company’s 2007 Annual General Meeting. In 2009, options were granted to executive directors under the ESOP over shares worth between one and a half times salary and three times salary.
Options to subscribe for ordinary shares of 25p each in the company granted to, and exercised by, directors during the year ended 31 December 2009 are shown in the table below.
The intention is that no further awards will be made under the ESOP. Instead, awards will be made under the new long term incentive plan, if approved by shareholders. Details of the long-term incentive plan can be found on pages 182 and 183.
| Options exercised in 2009 | |||||||||||||
| Market | |||||||||||||
| price | |||||||||||||
| Options | at date of | Options | |||||||||||
| Options held at | granted in | exercise | lapsed in | Option price | Options held at 31 December 2009 | ||||||||
| 1 January 2009 | 2009 | Number | £ | 2009 | £ | Number | Exercise period | ||||||
| Stephen Hester | — | 9,550,000 | 0.37 | 9,550,000 | 22.06.12 – 21.06.19 | ||||||||
| Gordon Pell | 104,252 | 4.80 | 104,252 | 14.08.04 – 13.08.11 | |||||||||
| 98,879 | 5.07 | 98,879 | 14.03.05 – 13.03.12 | ||||||||||
| 178,412 | 3.45 | 178,412 | 13.03.06 – 12.03.13 | ||||||||||
| 169,158 | 4.84 | 169,158 | 11.03.07 – 10.03.14 | ||||||||||
| 181,304 | 4.83 | 181,304 | 10.03.08 – 09.03.15 | ||||||||||
| 223,428 | 223,428 | 5.17 | — | lapsed | |||||||||
| 310,364 | 4.70 | 310,364 | 16.08.10 – 15.08.17 | ||||||||||
| 640,871 | 2.97 | 640,871 | 06.03.11 – 05.03.18 | ||||||||||
| 1,906,668 | 223,428 | 1,683,240 | |||||||||||
Guy Whittaker (2) | 203,113 | 203,113 | 5.17 | — | lapsed | ||||||||
| 335,269 | 335,269 | 4.70 | — | lapsed | |||||||||
| 582,803 | 582,803 | 2.97 | — | lapsed | |||||||||
| 9,218 | (1) | 9,218 | (1) | 1.89 | — | lapsed | |||||||
| 45,592 | (1) | 45,592 | (1) | 0.38 | — | lapsed | |||||||
| 1,130,403 | 45,592 | 1,175,995 | — | ||||||||||
Bruce Van Saun (3) | — | 905,306 | 0.57 | 905,306 | 08.09.12 – 07.09.19 | ||||||||
Notes:
(1) | Options held under the sharesave schemes, which are not subject to performance conditions. |
(2) | Options held at 30 September 2009 when Guy Whittaker ceased to be a director. All outstanding awards lapsed following cessation of employment. |
(3) | Awards granted on 8 September 2009 when Bruce Van Saun joined the Group. He was appointed as a director on 1 October 2009. |
No options had their terms and conditions varied during the year ended 31 December 2009. No payment is required on the award of an option.
The plan was amended to introduce a clawback provisions for grants made in 2009.
In respect of the grant of options in 2009, the performance conditions for executive directors are based on a combination of relative and absolute Total Shareholder Return (TSR) measures. Further details can be found on page 191.
The market price of the company’s ordinary shares at 31 December 2009 was 29.2p and the range during the year ended 31 December 2009 was 10.3p to 57.7p.
In the ten year period to 31 December 2009, awards made that could require new issue shares under the company’s share plans represented 4.1% of the company’s issued ordinary share capital, leaving an available dilution headroom of 5.9%. The company meets its employee share plan obligations through a combination of new issue shares and market purchase shares.
189
Directors’ remuneration report continued
Medium Term Performance Plan (MPP)
The MPP was approved by shareholders in April 2001. Key executives (Management Committee members and above) are eligible for an annual award under the plan in the form of share or share equivalent awards. Whilst the rules of the plan allow awards over shares worth up to one and a half times earnings, the Remuneration Committee has adopted a policy of granting awards based on a multiple of salary. No changes will be made to this policy without prior consultation with shareholders. The intention is that no further awards will be made under the MPP, instead awards will be made under the new long term incentive plan, if approved by shareholders. Details of the long-term incentive plan can be found on pages 182 and 183.
| Market | Scheme interests | End of period | ||||||||||||||||||||||||||
| Scheme interests | Awards | price on | Awards | Awards | (share | for qualifying | ||||||||||||||||||||||
| (share equivalents) at | granted | award | vested in | exercised | equivalents) at | conditions to | ||||||||||||||||||||||
| 1 January 2009 | in 2009 | £2009 | in 2009 | 31 December 2009 | be fulfilled | |||||||||||||||||||||||
| Stephen Hester | — | 4,800,000 | 0.37 | 4,800,000 | 22.06.12 | |||||||||||||||||||||||
| Gordon Pell | 138,384 | 5.85 | — | lapsed | ||||||||||||||||||||||||
| 305,177 | 2.97 | 305,177 | 31.12.10 | |||||||||||||||||||||||||
| 443,561 | 305,177 | |||||||||||||||||||||||||||
Guy Whittaker (1) | 128,134 | 5.85 | — | lapsed | ||||||||||||||||||||||||
| 277,525 | 2.97 | — | lapsed | |||||||||||||||||||||||||
| 405,659 | — | |||||||||||||||||||||||||||
Bruce Van Saun (2) | — | 1,810,611 | 0.57 | 1,810,611 | 22.06.12 | (3) | ||||||||||||||||||||||
Notes:
(1) | Awards held at 30 September 2009 when Guy Whittaker ceased to be a director. All outstanding awards lapsed following cessation of employment. |
(2) | Awards granted on 8 September 2009 when Bruce Van Saun joined the Group. He was appointed as a director on 1 October 2009. |
(3) | End of qualifying period 22 June 2012, however award unavailable for exercise until 8 September 2012, 3 years from date of award. |
For any awards that have vested, participants holding option-based awards can exercise their right over the underlying share equivalents at any time up to ten years from the date of grant.
No variation was made to any of the terms of the plan during the year other than introducing a clawback provision for awards made in 2009.
190
Governance
Performance criteria for ESOP and MPP awards granted to executive directors in 2009
Awards are subject to relative and absolute TSR measures, both weighted equally. The performance measures apply to both ESOP and MPP awards made in 2009.
The relative TSR measure compares the Group’s performance against a basket of banks from the UK and overseas, weighted towards those companies most similar to the Group
| Comparator companies | Weighting | |
| 1. | Lloyds Banking Group | 200% |
| 2. | Barclays | |
| 3. | Banco Santander | 150% |
| 4. | HSBC | |
| 5. | Standard Chartered | |
| 6. | Citigroup | 100% |
| 7. | Deutsche Bank | |
| 8. | J. P. Morgan Chase | |
| 9. | BNP Paribas | 50% |
| 10. | Bank of America | |
| 11. | Societe Generale | |
| 12. | Credit Agricole | |
| 13. | Credit Suisse Group | |
| 14. | Royal Bank of Canada | |
| 15. | Wells Fargo | |
| 16. | National Australia Bank | |
| 17. | BBVA | |
| 18. | UBS | |
| 19. | The Toronto Dominion Bank | |
| 20. | Unicredito Italiano | |
To receive any of the shares and options subject to this performance measure, the Group’s performance must be at least as good as the median of the comparator companies, with vesting as follows:
| · | To receive 100% of the shares and options, RBS would need to be in the top quartile of its relative TSR group. |
| · | To receive 25% of the shares and options, RBS would need to be at the median of its relative TSR group. |
The absolute TSR measure is based on the achievement of share price targets by the end of the performance period. In respect of this performance measure, vesting is determined as follows:
| · | To receive 100% of the shares and options the share price would need to reach 70 pence or more. |
| · | To receive 50% of the shares and options the share price would need to reach 55 pence or more. |
| · | To receive 25% of the shares and options the share price would need to reach 40 pence. |
In addition, if the Group’s Remuneration Committee consider that the vesting outcome calibrated in line with the performance conditions outlined above does not reflect the Group’s underlying financial results or if the Committee considers that the financial results have been achieved with excessive risk, then the terms of the awards allow for an underpin to be used to reduce vesting of an award, or to allow the award to lapse in its entirety.
Restricted Share Award
| End of the | ||||||||||||||||
| Market | Market | Value of | Awards | period for | ||||||||||||
| Awards held | Awards | price on | Awards | price on | awards | held at | qualifying | |||||||||
| at 1 January | granted in | award | vested in | vesting | vested | 31 December | conditions to | |||||||||
| 2009 | 2009 | £ | 2009 | £ | £ | 2009 | be fulfilled | |||||||||
| Stephen Hester | 7,997,055 | (1) | 0.48 | 1,502,291 | 0.285 | 428,153 | 5,506,987 | 21.11.08 – 29.05.11 | ||||||||
| 608,805 | 0.4015 | 244,435 | ||||||||||||||
| 378,972 | 0.463 | 175,464 | ||||||||||||||
| 1,832,062 | (2) | 0.48 | 610,688 | 0.375 | 229,008 | 1,221,374 | 21.11.09 – 21.11.11 | |||||||||
| 9,829,117 | 3,100,756 | 1,077,060 | 6,728,361 | |||||||||||||
Guy Whittaker (3) | 90,718 | 5.41 | 90,718 | 0.285 | 25,854 | — | 01.02.09 | |||||||||
| 44,500 | 5.41 | — | lapsed | |||||||||||||
| 135,218 | 90,718 | 25,854 | — | |||||||||||||
Philip Hampton (4) | — | 5,172,413 | 0.29 | 5,172,413 | 27.02.12 | |||||||||||
Notes:
(1) | Awards to replace bonus and share awards Stephen Hester forfeited on leaving The British Land Company PLC, which reflect the vesting dates of the original awards. Initially he was awarded 10,407,081 restricted shares on joining the Group and 577,964 vested during 2008. |
(2) | These awards vest as to 1/3 on each of the first, second and third anniversary of award, subject to their terms. |
(3) | Awards were granted to Guy Whittaker in lieu of unvested share awards from his previous employer. He ceased to be a director on 30 September 2009 and the outstanding award lapsed following cessation of employment. |
(4) | Details of the restricted share award to Philip Hampton are outlined on page 184. The Remuneration Committee can amend this award as it considers appropriate. However, shareholder approval will be required to amend certain provisions to Philip Hampton’s advantage. These provisions relate to the basis for determining his entitlement to, and the terms of shares or other benefits and for the adjustment thereof (if any) if there is a capitalisation issue, rights issue or open offer, sub-division or consolidation of shares or reduction of capital or any other variation of capital and the amendment power itself. The Remuneration Committee may, without shareholder approval, make minor amendments to facilitate the administration of the award, to comply with or take account of any proposed or existing legislation or to obtain or maintain favourable tax, exchange control or regulatory treatment for Philip Hampton or his employer. The benefit of the award is not pensionable. |
191
Directors’ remuneration report continued
Directors’ pension arrangements
During 2009 Gordon Pell accrued pensionable service in The Royal Bank of Scotland Group Pension Fund (the “RBS Fund”). The RBS Fund is a defined benefit fund registered with HM Revenue & Customs under the Finance Act 2004.
Gordon Pell is provided with additional pension benefits on a defined benefit basis outwith the RBS Fund. The figures shown below include the accrual in respect of these arrangements.
Disclosure of these benefits has been made in accordance with the United Kingdom Listing Authority’s Listing Rules and with the Large and Medium-sized Companies and Groups (Accounts and Reports) Regulations 2008.
| Transfer value | ||||||||||||||||
| Additional | Additional | for the additional | ||||||||||||||
| pension | pension | Increase | pension | |||||||||||||
| earned | earned | in transfer | earned | |||||||||||||
| Accrued | during the | during the | Transfer | Transfer | value during | during the | ||||||||||
| entitlement at | year ended | year ended | value as at | value as at | year ended | year ended | ||||||||||
| Age at | 31 December | 31 December | 31 December | 31 December | 31 December | 31 December | 31 December | |||||||||
| 31 December | 2009 | 2009 | 2009 | * | 2009 | 2008 | 2009 | 2009* | ||||||||
| Defined benefit arrangements | 2009 | £000 p.a. | £000 p.a. | £000p.a. | £000 | £000 | £000 | £000 | ||||||||
| Gordon Pell | 59 | 582 | 65 | 40 | 13,581 | 9,831 | 3,750 | 923 |
*Net of statutory revaluation applying to deferred pensions.
Gordon Pell will retire from the Group at the end of March, shortly after his normal pension age of 60, and the pension value above has been calculated on this basis. His pension at retirement will be based on his 39 years of service with Lloyds TSB and with the Group, part of which has been funded by a transfer payment from a Lloyds TSB pension plan.
There is a significant difference in the form of disclosure required by the Listing Rules and the Large and Medium-sized Companies and Groups (Accounts and Reports) Regulations 2008. The former requires disclosure of the additional pension earned during the year and the transfer value equivalent to this pension based on financial conditions at the end of the year. The latter requires the disclosure of the difference between the transfer value at the start and end of the year and is therefore dependent on the change in financial conditions over the course of the year. During 2009, the real discount rate used to calculate all transfer values fell from 2.8% to 1.5%. As a result, Gordon Pell’s transfer value increased to a greater extent than the amount of his pension. There has been no augmentation to his pension during 2009 or as a result of his retirement.
The transfer values disclosed above do not represent a sum paid or payable to the individual director. Instead they represent a potential liability of the Group’s pension schemes.
The proportion of benefits represented by funded pension schemes for Gordon Pell is 43%.
Stephen Hester and Bruce Van Saun are, and Guy Whittaker was, provided with a cash allowance in place of pension benefits as detailed below:
| 2009 | 2008 | ||||
| Cash allowances in place of pension | £000 | £000 | |||
| Executive directors | |||||
| Stephen Hester | 420 | 52 | |||
| Bruce Van Saun | 80 | — | |||
| Former executive director | |||||
| Guy Whittaker | 217 | 282 | |||
Colin A. M. Buchan
Chairman of the Remuneration Committee
24 February 2010
192
Governance
Directors’ interests in shares
| Shares | ||||||||||||
| beneficially | ||||||||||||
| owned at | ||||||||||||
| 1 January 2009 | 31 December 2009 | |||||||||||
| or date of | Shares | |||||||||||
| appointment, | beneficially | Value(1) | ||||||||||
| Executive directors | if later | owned | £ | |||||||||
| Stephen Hester | 340,524 | 2,167,419 | 632,886 | |||||||||
| Gordon Pell | 611,927 | 611,927 | 178,683 | |||||||||
Note:
| (1) | The value is based on the share price at 31 December 2009, which was 29.2p. During the year ended 31 December 2009 the share price ranged from 10.3p to 57.7p. |
| Shares | ||||||||||||
| beneficially | ||||||||||||
| owned at | ||||||||||||
| 1 January | ||||||||||||
| 2009 | 31 December 2009 | |||||||||||
| or date of | Shares | |||||||||||
| appointment, | beneficially | Value(1) | ||||||||||
| Non-executive directors | if later | owned | £ | |||||||||
| Colin Buchan | 157,515 | 157,515 | 45,994 | |||||||||
Sandy Crombie (2) | — | 200,000 | 58,400 | |||||||||
Penny Hughes (3) | 8,175 | 8,175 | 2,387 | |||||||||
| Archie Hunter | 41,344 | 41,344 | 12,072 | |||||||||
| John McFarlane | — | 50,000 | 14,600 | |||||||||
| Joe MacHale | 284,317 | 284,317 | 83,021 | |||||||||
| Art Ryan | 50,000 | 50,000 | 14,600 | |||||||||
Philip Scott (4) | 500,000 | 500,000 | 146,000 | |||||||||
| Chairman | ||||||||||||
Philip Hampton (5) | 26,312 | 276,312 | 80,683 | |||||||||
Notes:
(1) | The value is based on the share price at 31 December 2009, which was 29.2p. During the year ended 31 December 2009 the share price ranged from 10.3p to 57.7p. |
(2) | Appointed as a director on 1 June 2009. |
(3) | Appointed as a director on 1 January 2010. |
(4) | Appointed as a director on 1 November 2009. |
(5) | Appointed as a director on 19 January 2009. |
No other director had an interest in the company’s ordinary shares during the year or held a non-beneficial interest in the shares of the company at 31 December 2009, at 1 January 2009 or date of appointment if later. The interests shown above include the connected persons of the directors.
As at 24 February 2010 there were no changes to the directors’ interests in shares shown in the tables above.
193
Statement of directors’ responsibilities
The directors are required by Article 4 of the IAS Regulation (European Commission Regulation No 1606/2002) to prepare Group accounts, and as permitted by the Companies Act 2006 have elected to prepare company accounts, for each financial year in accordance with International Financial Reporting Standards as adopted by the European Union. They are responsible for preparing accounts that present fairly the financial position, financial performance and cash flows of the Group and the company. In preparing those accounts, the directors are required to:
| · | select suitable accounting policies and then apply them consistently; |
| · | make judgements and estimates that are reasonable and prudent; and |
| · | state whether applicable accounting standards have been followed, subject to any material departures disclosed and explained in the accounts. |
The directors are responsible for keeping proper accounting records which disclose with reasonable accuracy at any time the financial position of the Group and to enable them to ensure that the Annual Report and Accounts complies with the Companies Act 2006. They are also responsible for safeguarding the assets of the Group and hence for taking reasonable steps for the prevention and detection of fraud and other irregularities.
By order of the Board
Miller McLean
Secretary
24 February 2010
We, the directors listed below, confirm that to the best of our knowledge:
| · | the financial statements, prepared in accordance with International Financial Reporting Standards, give a true and fair view of the assets, liabilities, financial position and profit or loss of the company and the undertakings included in the consolidation taken as a whole; and |
| · | the Business review, which is incorporated into the Directors’ report, includes a fair review of the development and performance of the business and the position of the company and the undertakings included in the consolidation taken as a whole, together with a description of the principal risks and uncertainties that they face. |
By order of the Board
| Philip Hampton | Stephen Hester | Bruce Van Saun |
| Chairman | Group Chief Executive | Group Finance Director |
| 24 February 2010 | ||
| Board of directors | ||
| Chairman | Executive directors | Non-executive directors |
| Philip Hampton | Stephen Hester | Colin Buchan |
| Gordon Pell | Sandy Crombie | |
| Bruce Van Saun | Penny Hughes | |
| Archie Hunter | ||
| Joe MacHale | ||
| John McFarlane | ||
| Arthur ‘Art’ Ryan | ||
| Philip Scott | ||
194
Financial statements
Contents
| 196 | Independent auditors’ report |
| 197 | Consolidated income statement |
| 198 | Consolidated statement of comprehensive income |
| 199 | Balance sheets |
| 200 | Statements of changes in equity |
| 203 | Cash flow statements |
| 204 | Accounting policies |
| 215 | Notes on the accounts |
| 1 | Net interest income | 215 |
| 2 | Non-interest income | 216 |
| (excluding insurance premium income) | ||
| 3 | Operating expenses | 217 |
| 4 | Pension costs | 219 |
| 5 | Auditors’ remuneration | 222 |
| 6 | Tax | 223 |
| 7 | Profit attributable to preference shareholders | |
| and paid-in equity holders | 223 | |
| 8 | Ordinary dividends | 224 |
| 9 | Profit dealt with in the accounts of the company | 224 |
| 10 | Earnings per ordinary and B share | 225 |
| 11 | Financial instruments | 226 |
| 12 | Financial assets – impairments | 248 |
| 13 | Derivatives | 250 |
| 14 | Debt securities | 253 |
| 15 | Equity shares | 255 |
| 16 | Investments in Group undertakings | 256 |
| 17 | Intangible assets | 257 |
| 18 | Property, plant and equipment | 260 |
| 19 | Prepayments, accrued income and other assets | 262 |
| 20 | Discontinued operations and assets and | 262 |
| liabilities of disposal groups | ||
| 21 | Settlement balances and short positions | 264 |
| 22 | Accruals, deferred income and other liabilities | 264 |
| 23 | Deferred taxation | 265 |
| 24 | Insurance business | 266 |
| 25 | Subordinated liabilities | 273 |
| 26 | Minority interests | 280 |
| 27 | Share capital | 281 |
| 28 | Reserves | 284 |
| 29 | Leases | 284 |
| 30 | Collateral and securitisations | 286 |
| 31 | Capital resources | 287 |
| 32 | Memorandum items | 288 |
| 33 | Net cash (outflow)/inflow from operating activities | 293 |
| 34 | Analysis of the net investment in business | 294 |
| interests and intangible assets | ||
| 35 | Interest received and paid | 295 |
| 36 | Analysis of changes in financing during the year | 296 |
| 37 | Analysis of cash and cash equivalents | 296 |
| 38 | Segmental analysis | 297 |
| 39 | Directors’ and key management remuneration | 302 |
| 40 | Transactions with directors and key management | 303 |
| 41 | Related parties | 303 |
| 42 | Post balance sheet events | 304 |
| 43 | Consolidating financial information | 305 |
195
Independent auditors’ report to the members of The Royal Bank of Scotland Group plc
We have audited the accompanying consolidated Balance Sheets of The Royal Bank of Scotland Group plc and its subsidiaries (together “the Group”) as of 31 December 2009 which comprise the accounting policies, the consolidated balance sheets as at 31 December 2009, 2008 and 2007, the consolidated income statements, the consolidated statements of comprehensive income, the consolidated statement of changes in equity and the consolidated cash flow statements for each of the three years in the period ended 31 December 2009, the related notes 1 to 43 and the information identified as ‘audited’ in the Risk, capital and liquidity management section of the business review. These financial statements are the responsibility of the Group’s directors. Our responsibility is to express an opinion on the Group's internal control over financial reporting based on our audits.
We conducted our audit in accordance with the standards of the Public Company Accounting Oversight Board (United States). Those standards require that we plan and perform the audit to obtain reasonable assurance about whether the financial statements are free of material misstatement. An audit includes examining, on a test basis, evidence supporting the amounts and disclosures in the financial statements. An audit also includes assessing the accounting principles used and significant estimates made by management, as well as evaluating the overall financial statement presentation. We believe that our audit provides a reasonable basis for our opinion.
In our opinion, such consolidated financial statements present fairly, in all material aspects, the financial position of the Group as at 31 December 2009, 2008 and 2007, and the results of its operations and its cash flows for each of the three years in the period ended 31 December 2009, in conformity with International Financial Reporting Standards (“IFRS”) as adopted for use in the European Union and IFRS as issued by the International Accounting Standards Board.
The consolidated financial statements for the year ended 31 December 2008 were restated for the matters disclosed in Note 1 of the Accounting Policies. Note 43 to the financial statements was added for the inclusion of consolidating financial information in respect of The Royal Bank of Scotland plc in accordance with Regulation S-X Rule 3-10.
We have also audited, in accordance with the standards of the Public Company Accounting Oversight Board (United States), the Group’s internal control over financial reporting as of 31 December 2009 based on the criteria established in Internal Control-Integrated Framework issued by the Committee of Sponsoring Organisations of the Treadway Commission. Our report dated 24 February 2010 expressed an unqualified opinion on the effectiveness of the Group’s internal control over financial reporting.
/s/ DELOITTE LLP
Edinburgh, United Kingdom
24 February 2010 (31 March 2010 for the consolidating financial information included in Note 43)
196
Financial statements
Consolidated income statement
for the year ended 31 December 2009
| Restated | ||||||||||||||||
| 2009 | 2008 | 2007 | ||||||||||||||
| Note | £m | £m | £m | |||||||||||||
| Interest receivable | 33,836 | 49,522 | 32,252 | |||||||||||||
| Interest payable | (17,332 | ) | (30,847 | ) | (20,183 | ) | ||||||||||
| Net interest income | 1 | 16,504 | 18,675 | 12,069 | ||||||||||||
| Fees and commissions receivable | 2 | 9,831 | 9,831 | 8,278 | ||||||||||||
| Fees and commissions payable | 2 | (2,822 | ) | (2,386 | ) | (2,193 | ) | |||||||||
| Income/(loss) from trading activities | 2 | 3,881 | (8,477 | ) | 1,292 | |||||||||||
| Gain on redemption of own debt | 2 | 3,790 | — | — | ||||||||||||
| Other operating income (excluding insurance premium income) | 2 | 1,962 | 1,899 | 4,833 | ||||||||||||
| Insurance net premium income | 24 | 5,544 | 6,326 | 6,087 | ||||||||||||
| Non-interest income | 22,186 | 7,193 | 18,297 | |||||||||||||
| Total income | 38,690 | 25,868 | 30,366 | |||||||||||||
| Staff costs – excluding curtailment gains | (11,783 | ) | (10,410 | ) | (7,338 | ) | ||||||||||
| – pension schemes curtailment gains | 2,148 | — | — | |||||||||||||
| Premises and equipment | (3,087 | ) | (2,593 | ) | (1,703 | ) | ||||||||||
| Other administrative expenses | (5,584 | ) | (5,464 | ) | (2,969 | ) | ||||||||||
| Depreciation and amortisation | (2,809 | ) | (3,154 | ) | (1,932 | ) | ||||||||||
| Write-down of goodwill and other intangible assets | (363 | ) | (32,581 | ) | — | |||||||||||
| Operating expenses | 3 | (21,478 | ) | (54,202 | ) | (13,942 | ) | |||||||||
| Profit/(loss) before other operating charges and impairment losses | 17,212 | (28,334 | ) | 16,424 | ||||||||||||
| Insurance net claims | 24 | (4,857 | ) | (4,430 | ) | (4,624 | ) | |||||||||
| Impairment losses | 12 | (14,950 | ) | (8,072 | ) | (1,968 | ) | |||||||||
| Operating (loss)/profit before tax | (2,595 | ) | (40,836 | ) | 9,832 | |||||||||||
| Tax credit/(charge) | 6 | 371 | 2,323 | (2,044 | ) | |||||||||||
| (Loss)/profit from continuing operations | (2,224 | ) | (38,513 | ) | 7,788 | |||||||||||
| (Loss)/profit from discontinued operations, net of tax | 20 | (99 | ) | 3,971 | (76 | ) | ||||||||||
| (Loss)/profit for the year | (2,323 | ) | (34,542 | ) | 7,712 | |||||||||||
| (Loss)/profit attributable to: | ||||||||||||||||
| Minority interests | 349 | (10,832 | ) | 163 | ||||||||||||
| Preference shareholders | 7 | 878 | 536 | 246 | ||||||||||||
| Paid-in equity holders | 7 | 57 | 60 | — | ||||||||||||
| Ordinary and B shareholders | (3,607 | ) | (24,306 | ) | 7,303 | |||||||||||
| (2,323 | ) | (34,542 | ) | 7,712 | ||||||||||||
| Per ordinary and B share (1) : | ||||||||||||||||
| Basic (loss)/earnings from continuing operations | 10 | (6.3 p | ) | (146.2 p | ) | 64.0 | p | |||||||||
| Diluted (loss)/earnings from continuing operations | 10 | (6.3 p | ) | (146.2 p | ) | 63.4 | p | |||||||||
| Basic loss from discontinued operations | 10 | (0.1 p | ) | (0.5 p | ) | — | ||||||||||
| Diluted loss from discontinued operations | 10 | (0.1 p | ) | (0.5 p | ) | — | ||||||||||
| Dividends | 8 | — | 19.3 | p | 27.0 | p | ||||||||||
The accompanying notes on pages 215 to 309, the accounting policies on pages 204 to 214 and the audited sections of the Business review: Risk, capital and liquidity management on pages 70 to 159 form an integral part of these financial statements.
Note:
| (1) | B shares rank pari-passu with ordinary shares. |
197
Consolidated statement of comprehensive income
for the year ended 31 December 2009
| Restated | ||||||||||||||||
| 2009 | 2008 | 2007 | ||||||||||||||
| Note | £m | £m | £m | |||||||||||||
| (Loss)/profit for the year | (2,323 | ) | (34,542 | ) | 7,712 | |||||||||||
| Other comprehensive income: | ||||||||||||||||
| Available-for-sale financial assets | 2,016 | (7,406 | ) | (1,289 | ) | |||||||||||
| Cash flow hedges | 684 | (1,456 | ) | (564 | ) | |||||||||||
| Currency translation | (3,300 | ) | 15,425 | 2,210 | ||||||||||||
| Actuarial (losses)/gains on defined benefit plans | 4 | (3,665 | ) | (2,287 | ) | 2,189 | ||||||||||
| Other comprehensive (loss)/income before tax | (4,265 | ) | 4,276 | 2,546 | ||||||||||||
| Tax | 430 | 2,786 | (170 | ) | ||||||||||||
| Other comprehensive (loss)/income after tax | (3,835 | ) | 7,062 | 2,376 | ||||||||||||
| Total comprehensive (loss)/income for the year | (6,158 | ) | (27,480 | ) | 10,088 | |||||||||||
| Total comprehensive (loss)/income recognised in the statement of changes in equity is attributable as follows: | ||||||||||||||||
| Minority interests | (1,346 | ) | (4,332 | ) | 1,478 | |||||||||||
| Preference shareholders | 878 | 536 | 246 | |||||||||||||
| Paid-in equity holders | 57 | 60 | — | |||||||||||||
| Ordinary and B shareholders | (5,747 | ) | (23,744 | ) | 8,364 | |||||||||||
| (6,158 | ) | (27,480 | ) | 10,088 | ||||||||||||
The accompanying notes on pages 215 to 309, the accounting policies on pages 204 to 214 and the audited sections of the Business review: Risk, capital and liquidity management on pages 70 to 159 form an integral part of these financial statements.
198
Financial statements
Balance sheets
at 31 December 2009
| Group | Company | ||||||||||||||||||||||||||||
| 2009 | 2008 | 2007 | 2009 | 2008 | 2007 | ||||||||||||||||||||||||
| Note | £m | £m | £m | £m | £m | £m | |||||||||||||||||||||||
| Assets | |||||||||||||||||||||||||||||
| Cash and balances at central banks | 11 | 52,261 | 12,400 | 17,866 | — | — | — | ||||||||||||||||||||||
| Loans and advances to banks | 11 | 91,753 | 138,197 | 219,460 | 31,238 | 27,031 | 7,686 | ||||||||||||||||||||||
| Loans and advances to customers | 11 | 728,393 | 874,722 | 828,538 | 2,777 | — | 307 | ||||||||||||||||||||||
| Debt securities subject to repurchase agreements | 30 | 66,883 | 80,576 | 107,651 | — | — | — | ||||||||||||||||||||||
| Other debt securities | 200,371 | 186,973 | 187,005 | 1,286 | — | — | |||||||||||||||||||||||
| Debt securities | 14 | 267,254 | 267,549 | 294,656 | 1,286 | — | — | ||||||||||||||||||||||
| Equity shares | 15 | 19,528 | 26,330 | 53,026 | — | — | — | ||||||||||||||||||||||
| Investments in Group undertakings | 16 | — | — | — | 64,766 | 42,196 | 43,542 | ||||||||||||||||||||||
| Settlement balances | 12,033 | 17,832 | 16,589 | 11 | — | — | |||||||||||||||||||||||
| Derivatives | 13 | 441,454 | 992,559 | 277,402 | 1,169 | 1,168 | 173 | ||||||||||||||||||||||
| Intangible assets | 17 | 17,847 | 20,049 | 49,916 | — | — | — | ||||||||||||||||||||||
| Property, plant and equipment | 18 | 19,397 | 18,949 | 18,745 | — | — | — | ||||||||||||||||||||||
| Deferred taxation | 23 | 7,039 | 7,082 | 3,119 | 2 | 3 | — | ||||||||||||||||||||||
| Prepayments, accrued income and other assets | 19 | 20,985 | 24,402 | 15,662 | 43 | 489 | 127 | ||||||||||||||||||||||
| Assets of disposal groups | 20 | 18,542 | 1,581 | 45,850 | — | — | — | ||||||||||||||||||||||
| Total assets | 1,696,486 | 2,401,652 | 1,840,829 | 101,292 | 70,887 | 51,835 | |||||||||||||||||||||||
| Liabilities | |||||||||||||||||||||||||||||
| Deposits by banks | 11 | 142,144 | 258,044 | 312,294 | 93 | 1,802 | 5,572 | ||||||||||||||||||||||
| Customer accounts | 11 | 614,202 | 639,512 | 682,363 | 13,264 | 26 | — | ||||||||||||||||||||||
| Debt securities in issue | 11 | 267,568 | 300,289 | 274,172 | 11,788 | 14,179 | 13,453 | ||||||||||||||||||||||
| Settlement balances and short positions | 21 | 50,876 | 54,277 | 91,021 | — | — | — | ||||||||||||||||||||||
| Derivatives | 13 | 424,141 | 971,364 | 272,052 | 446 | 361 | 179 | ||||||||||||||||||||||
| Accruals, deferred income and other liabilities | 22 | 30,327 | 31,482 | 34,208 | 1,357 | 47 | 8 | ||||||||||||||||||||||
| Retirement benefit liabilities | 4 | 2,963 | 2,032 | 460 | — | — | — | ||||||||||||||||||||||
| Deferred taxation | 23 | 2,811 | 4,165 | 5,400 | — | — | 3 | ||||||||||||||||||||||
| Insurance liabilities | 24 | 10,281 | 9,976 | 10,162 | — | — | — | ||||||||||||||||||||||
| Subordinated liabilities | 25 | 37,652 | 49,154 | 38,043 | 8,762 | 10,314 | 7,743 | ||||||||||||||||||||||
| Liabilities of disposal groups | 20 | 18,890 | 859 | 29,228 | — | — | — | ||||||||||||||||||||||
| Total liabilities | 1,601,855 | 2,321,154 | 1,749,403 | 35,710 | 26,729 | 26,958 | |||||||||||||||||||||||
| Minority interests | 26 | 16,895 | 21,619 | 38,388 | — | — | — | ||||||||||||||||||||||
| Equity owners | 27, 28 | 77,736 | 58,879 | 53,038 | 65,582 | 44,158 | 24,877 | ||||||||||||||||||||||
| Total equity | 94,631 | 80,498 | 91,426 | 65,582 | 44,158 | 24,877 | |||||||||||||||||||||||
| Total liabilities and equity | 1,696,486 | 2,401,652 | 1,840,829 | 101,292 | 70,887 | 51,835 | |||||||||||||||||||||||
The accompanying notes on pages 215 to 309, the accounting policies on pages 204 to 214 and the audited sections of the Business review: Risk, capital and liquidity management on pages 70 to 159 form an integral part of these financial statements.
The accounts were approved by the Board of directors and authorised for issue on 24 February 2010 and signed on its behalf by:
| Philip Hampton | Stephen Hester | Bruce Van Saun |
| Chairman | Group Chief Executive | Group Finance Director |
The Royal Bank of Scotland Group plc Registered No. SC45551
199
Statements of changes in equity
for the year ended 31 December 2009
Group | Company | |||||||||||||||||||||||
| Restated | ||||||||||||||||||||||||
| 2009 | 2008 | 2007 | 2009 | 2008 | 2007 | |||||||||||||||||||
| £m | £m | £m | £m | £m | £m | |||||||||||||||||||
| Called-up share capital | ||||||||||||||||||||||||
| At 1 January | 9,898 | 2,530 | 815 | 9,898 | 2,530 | 815 | ||||||||||||||||||
| Ordinary shares issued in respect of placing and open offers | 4,227 | 5,728 | — | 4,227 | 5,728 | — | ||||||||||||||||||
| Ordinary shares issued in respect of rights issue | — | 1,531 | — | — | 1,531 | — | ||||||||||||||||||
| Ordinary shares issued in respect of capitalisation issue | — | 101 | — | — | 101 | — | ||||||||||||||||||
| B shares issued | 510 | — | — | 510 | — | — | ||||||||||||||||||
| Preference shares issued in respect of placing and open offer | — | 5 | — | — | 5 | — | ||||||||||||||||||
| Other shares issued during the year | — | 3 | 139 | — | 3 | 139 | ||||||||||||||||||
| Bonus issue of ordinary shares | — | — | 1,576 | — | — | 1,576 | ||||||||||||||||||
| Preference shares redeemed during the year | (5 | ) | — | — | (5 | ) | — | — | ||||||||||||||||
| At 31 December | 14,630 | 9,898 | 2,530 | 14,630 | 9,898 | 2,530 | ||||||||||||||||||
| Paid-in equity | ||||||||||||||||||||||||
| At 1 January | 1,073 | 1,073 | — | 1,073 | 1,073 | — | ||||||||||||||||||
| Securities (redeemed)/issued during the year | (308 | ) | — | 1,073 | (308 | ) | — | 1,073 | ||||||||||||||||
| Transfer to retained earnings | (200 | ) | — | — | (200 | ) | — | — | ||||||||||||||||
| At 31 December | 565 | 1,073 | 1,073 | 565 | 1,073 | 1,073 | ||||||||||||||||||
| Share premium account | ||||||||||||||||||||||||
| At 1 January | 27,471 | 17,322 | 12,482 | 27,471 | 17,322 | 12,482 | ||||||||||||||||||
Ordinary shares issued in respect of placing and open offer, net of £95 million expenses | 1,047 | — | — | 1,047 | — | — | ||||||||||||||||||
Ordinary shares issued in respect of rights issue, net of £246 million expenses | — | 10,469 | — | — | 10,469 | — | ||||||||||||||||||
| Ordinary shares issued in respect of capitalisation issue | — | (101 | ) | — | — | (101 | ) | — | ||||||||||||||||
| Expenses of placing and open offer | — | (265 | ) | — | — | (265 | ) | — | ||||||||||||||||
| Other shares issued during the year | — | 46 | 6,257 | — | 46 | 6,257 | ||||||||||||||||||
| Bonus issue of ordinary shares | — | — | (1,576 | ) | — | (1,576 | ) | |||||||||||||||||
| Preference shares redeemed during the year | (4,995 | ) | — | 159 | (4,995 | ) | — | 159 | ||||||||||||||||
| At 31 December | 23,523 | 27,471 | 17,322 | 23,523 | 27,471 | 17,322 | ||||||||||||||||||
| Merger reserve | ||||||||||||||||||||||||
| At 1 January | 10,881 | 10,881 | 10,881 | — | — | — | ||||||||||||||||||
| Issue of B shares, net of £399 million expenses | 24,591 | — | — | 24,591 | — | — | ||||||||||||||||||
| Placing and open offer | — | 14,273 | — | — | 14,273 | — | ||||||||||||||||||
| Transfer to retained earnings | (9,950 | ) | (14,273 | ) | — | (9,950 | ) | (14,273 | ) | — | ||||||||||||||
| At 31 December | 25,522 | 10,881 | 10,881 | 14,641 | — | — | ||||||||||||||||||
| Available-for-sale reserve | ||||||||||||||||||||||||
| At 1 January | (3,561 | ) | 1,032 | 1,528 | — | — | — | |||||||||||||||||
| Unrealised gains/(losses) in the year | 1,202 | (6,808 | ) | (191 | ) | — | — | — | ||||||||||||||||
| Realised losses/(gains) in the year | 981 | 842 | (513 | ) | — | — | — | |||||||||||||||||
| Taxation | (377 | ) | 1,373 | 208 | — | — | — | |||||||||||||||||
| At 31 December | (1,755 | ) | (3,561 | ) | 1,032 | — | — | — | ||||||||||||||||
| Cash flow hedging reserve | ||||||||||||||||||||||||
| At 1 January | (876 | ) | (555 | ) | (149 | ) | (4 | ) | (5 | ) | (7 | ) | ||||||||||||
| Amount recognised in equity during the year | 380 | (603 | ) | (460 | ) | — | — | — | ||||||||||||||||
| Amount transferred from equity to earnings in the year | 513 | 198 | (138 | ) | 3 | 2 | 3 | |||||||||||||||||
| Taxation | (269 | ) | 84 | 192 | — | (1 | ) | (1 | ) | |||||||||||||||
| At 31 December | (252 | ) | (876 | ) | (555 | ) | (1 | ) | (4 | ) | (5 | ) | ||||||||||||
| Foreign exchange reserve | ||||||||||||||||||||||||
| At 1 January | 6,385 | (426 | ) | (872 | ) | — | — | — | ||||||||||||||||
| Retranslation of net assets | (2,322 | ) | 11,970 | 1,339 | — | — | — | |||||||||||||||||
| Foreign currency gains/(losses) on hedges of net assets | 456 | (5,801 | ) | (963 | ) | — | — | — | ||||||||||||||||
| Taxation | 9 | 642 | 70 | — | — | — | ||||||||||||||||||
| At 31 December | 4,528 | 6,385 | (426 | ) | — | — | — | |||||||||||||||||
200
Financial statements
Group | Company | |||||||||||||||||||||||
| Restated | ||||||||||||||||||||||||
| 2009 | 2008 | 2007 | 2009 | 2008 | 2007 | |||||||||||||||||||
| £m | £m | £m | £m | £m | £m | |||||||||||||||||||
| Capital redemption reserve | ||||||||||||||||||||||||
| At 1 January and 31 December | 170 | 170 | 170 | 170 | 170 | 170 | ||||||||||||||||||
| Contingent capital reserve | ||||||||||||||||||||||||
| At 1 January | — | — | — | — | — | — | ||||||||||||||||||
| Contingent capital agreement – consideration payable | (1,208 | ) | — | — | (1,208 | ) | — | — | ||||||||||||||||
| At 31 December | (1,208 | ) | — | — | (1,208 | ) | — | — | ||||||||||||||||
| Retained earnings | ||||||||||||||||||||||||
| At 1 January | 7,542 | 21,072 | 15,487 | 5,550 | 3,787 | 4,737 | ||||||||||||||||||
| (Loss)/profit attributable to ordinary and B shareholders | ||||||||||||||||||||||||
| and other equity owners | (2,672 | ) | (23,710 | ) | 7,549 | (1,503 | ) | (9,602 | ) | 2,499 | ||||||||||||||
| Ordinary dividends paid | — | (2,312 | ) | (3,044 | ) | — | (2,312 | ) | (3,044 | ) | ||||||||||||||
| Equity preference dividends paid | (878 | ) | (536 | ) | (246 | ) | (878 | ) | (536 | ) | (246 | ) | ||||||||||||
| Paid-in equity dividends paid, net of tax | (57 | ) | (60 | ) | — | (57 | ) | (60 | ) | — | ||||||||||||||
| Transfer from paid-in equity | 200 | — | — | 200 | — | — | ||||||||||||||||||
| Equity owners gain on withdrawal of minority interest | ||||||||||||||||||||||||
| – gross | 629 | — | — | — | — | — | ||||||||||||||||||
| – taxation | (176 | ) | — | — | — | — | — | |||||||||||||||||
| Redemption of preference shares classified as debt | — | — | (159 | ) | — | — | (159 | ) | ||||||||||||||||
| Transfer from merger reserve | 9,950 | 14,273 | — | 9,950 | 14,273 | — | ||||||||||||||||||
| Actuarial (losses)/gains recognised in retirement benefit schemes | ||||||||||||||||||||||||
| – gross | (3,756 | ) | (1,807 | ) | 2,164 | — | — | — | ||||||||||||||||
| – taxation | 1,043 | 472 | (647 | ) | — | — | — | |||||||||||||||||
| Net cost of shares bought and used to satisfy share-based payments | (16 | ) | (19 | ) | (40 | ) | — | — | — | |||||||||||||||
| Share-based payments | ||||||||||||||||||||||||
| – gross | 325 | 177 | 65 | — | — | — | ||||||||||||||||||
| – taxation | — | (8 | ) | (57 | ) | — | — | — | ||||||||||||||||
| At 31 December | 12,134 | 7,542 | 21,072 | 13,262 | 5,550 | 3,787 | ||||||||||||||||||
| Own shares held | ||||||||||||||||||||||||
| At 1 January | (104 | ) | (61 | ) | (115 | ) | — | — | — | |||||||||||||||
| Shares purchased during the year | (33 | ) | (64 | ) | (65 | ) | — | — | — | |||||||||||||||
| Shares issued under employee share schemes | 16 | 21 | 119 | — | — | — | ||||||||||||||||||
| At 31 December | (121 | ) | (104 | ) | (61 | ) | — | — | — | |||||||||||||||
| Owners’ equity at 31 December | 77,736 | 58,879 | 53,038 | 65,582 | 44,158 | 24,877 | ||||||||||||||||||
201
Statements of changes in equity
for the year ended 31 December 2009 continued
Group | Company | |||||||||||||||||||||||
| Restated | ||||||||||||||||||||||||
| 2009 | 2008 | 2007 | 2009 | 2008 | 2007 | |||||||||||||||||||
| £m | £m | £m | £m | £m | £m | |||||||||||||||||||
| Minority interests | ||||||||||||||||||||||||
| At 1 January | 21,619 | 38,388 | 5,263 | — | — | — | ||||||||||||||||||
| Currency translation adjustments and other movements | (1,434 | ) | 9,256 | 1,834 | — | — | — | |||||||||||||||||
| Acquisition of ABN AMRO | — | 356 | 32,245 | — | — | — | ||||||||||||||||||
| Profit/(loss) attributable to minority interests | 349 | (10,832 | ) | 163 | — | — | — | |||||||||||||||||
| Dividends paid | (313 | ) | (285 | ) | (121 | ) | — | — | — | |||||||||||||||
| Available-for-sale financial assets | ||||||||||||||||||||||||
| – unrealised gains/(losses) in the year | 299 | (1,288 | ) | — | — | — | — | |||||||||||||||||
| – realised gains in the year | (466 | ) | (152 | ) | (585 | ) | — | — | — | |||||||||||||||
| – taxation | (36 | ) | (7 | ) | 21 | — | — | — | ||||||||||||||||
| Cash flow hedging reserve | ||||||||||||||||||||||||
| – amount recognised in equity during the year | (209 | ) | (1,015 | ) | — | — | — | — | ||||||||||||||||
| – amount transferred from equity to earnings in the year | — | (36 | ) | 34 | — | — | — | |||||||||||||||||
| – taxation | 59 | 220 | (8 | ) | — | — | — | |||||||||||||||||
| Actuarial gains/(losses) recognised in retirement benefit schemes | ||||||||||||||||||||||||
| – gross | 91 | (480 | ) | 25 | — | — | — | |||||||||||||||||
| – taxation | 1 | 2 | (6 | ) | — | — | — | |||||||||||||||||
| Equity raised | 9 | 1,071 | 76 | — | — | — | ||||||||||||||||||
| Equity withdrawn and disposals | (2,445 | ) | (13,579 | ) | (553 | ) | — | — | — | |||||||||||||||
| Transfer to retained earnings | (629 | ) | — | — | — | — | — | |||||||||||||||||
| At 31 December | 16,895 | 21,619 | 38,388 | — | — | — | ||||||||||||||||||
| Total equity at 31 December | 94,631 | 80,498 | 91,426 | 65,582 | 44,158 | 24,877 | ||||||||||||||||||
Total comprehensive income recognised in the statement of changes in equity is attributable as follows:
| Minority interests | (1,346 | ) | (4,332 | ) | 1,478 | — | — | — | ||||||||||||||||
| Preference shareholders | 878 | 536 | 246 | 878 | 536 | 246 | ||||||||||||||||||
| Paid-in equity holders | 57 | 60 | �� | — | 57 | 60 | — | |||||||||||||||||
| Ordinary and B shareholders | (5,747 | ) | (23,744 | ) | 8,364 | (2,435 | ) | (10,197 | ) | 2,255 | ||||||||||||||
| (6,158 | ) | (27,480 | ) | 10,088 | (1,500 | ) | (9,601 | ) | 2,501 | |||||||||||||||
The accompanying notes on pages 215 to 309, the accounting policies on pages 204 to 214 and the audited sections of the Business review: Risk, capital and liquidity management on pages 70 to 159 form an integral part of these financial statements.
202
Financial statements
Cash flow statements
for the year ended 31 December 2009
Group | Company | |||||||||||||||||||||||||||
| Restated | ||||||||||||||||||||||||||||
| 2009 | 2008 | 2007 | 2009 | 2008 | 2007 | |||||||||||||||||||||||
| Note | £m | £m | £m | £m | £m | £m | ||||||||||||||||||||||
| Operating activities | ||||||||||||||||||||||||||||
| Operating (loss)/profit before tax | (2,595 | ) | (40,836 | ) | 9,832 | (1,286 | ) | (10,017 | ) | 2,372 | ||||||||||||||||||
| Operating (loss)/profit before tax on discontinued activities | (101 | ) | 4,208 | 68 | — | — | — | |||||||||||||||||||||
| Adjustments for: | ||||||||||||||||||||||||||||
| Depreciation and amortisation | 2,809 | 3,154 | 1,932 | — | — | — | ||||||||||||||||||||||
| Write-down of goodwill and other intangible assets | 363 | 32,581 | — | — | — | — | ||||||||||||||||||||||
| Write-down of investment in subsidiaries | — | — | — | 5,139 | 14,321 | — | ||||||||||||||||||||||
| Interest on subordinated liabilities | 1,490 | 2,144 | 1,518 | 537 | 499 | 470 | ||||||||||||||||||||||
| Charge for defined benefit pension schemes | 659 | 490 | 489 | — | — | — | ||||||||||||||||||||||
| Pension scheme curtailment gains | (2,148 | ) | — | — | — | — | — | |||||||||||||||||||||
| Cash contribution to defined benefit pension schemes | (1,153 | ) | (810 | ) | (599 | ) | — | — | — | |||||||||||||||||||
| Gain on redemption of own debt | (3,790 | ) | — | — | (238 | ) | — | — | ||||||||||||||||||||
| Elimination of non-cash items on discontinued activities | — | 592 | 62 | — | — | — | ||||||||||||||||||||||
| Elimination of foreign exchange differences | 12,217 | (41,874 | ) | (10,282 | ) | (753 | ) | 1,778 | (58 | ) | ||||||||||||||||||
| Other non-cash items | 7,940 | 8,772 | (3,235 | ) | 20 | (478 | ) | 1 | ||||||||||||||||||||
| Net cash inflow/(outflow) from trading activities | 15,691 | (31,579 | ) | (215 | ) | 3,419 | 6,103 | 2,785 | ||||||||||||||||||||
| Changes in operating assets and liabilities | (15,964 | ) | (42,219 | ) | 28,261 | 12,537 | (22,254 | ) | 15,562 | |||||||||||||||||||
| Net cash flows from operating activities before tax | (273 | ) | (73,798 | ) | 28,046 | 15,956 | (16,151 | ) | 18,347 | |||||||||||||||||||
| Income taxes (paid)/received | (719 | ) | (1,540 | ) | (2,442 | ) | 409 | 119 | 6 | |||||||||||||||||||
| Net cash flows from operating activities | 33 | (992 | ) | (75,338 | ) | 25,604 | 16,365 | (16,032 | ) | 18,353 | ||||||||||||||||||
| Investing activities | ||||||||||||||||||||||||||||
| Sale and maturity of securities | 76,492 | 53,390 | 63,007 | — | — | — | ||||||||||||||||||||||
| Purchase of securities | (73,593 | ) | (55,229 | ) | (61,020 | ) | — | — | — | |||||||||||||||||||
| Investment in subsidiaries | — | — | — | (23,902 | ) | (10,349 | ) | (18,510 | ) | |||||||||||||||||||
| Disposal of subsidiaries | — | — | — | 7,908 | 700 | 6 | ||||||||||||||||||||||
| Sale of property, plant and equipment | 1,948 | 2,228 | 5,786 | — | — | — | ||||||||||||||||||||||
| Purchase of property, plant and equipment | (4,898 | ) | (5,757 | ) | (5,080 | ) | — | — | — | |||||||||||||||||||
| Proceeds on disposal of discontinued activities | — | 20,113 | (334 | ) | — | — | — | |||||||||||||||||||||
| Net investment in business interests and intangible assets | 34 | 105 | 2,252 | 13,640 | — | — | — | |||||||||||||||||||||
| Repayments from subsidiaries | — | — | — | 274 | — | 469 | ||||||||||||||||||||||
| Net cash flows from investing activities | 54 | 16,997 | 15,999 | (15,720 | ) | (9,649 | ) | (18,035 | ) | |||||||||||||||||||
| Financing activities | ||||||||||||||||||||||||||||
| Issue of ordinary shares | — | 49 | 77 | — | 49 | 77 | ||||||||||||||||||||||
| Placing and open offer | 5,274 | 19,741 | — | 5,274 | 19,741 | — | ||||||||||||||||||||||
| Rights issue | — | 12,000 | — | — | 12,000 | — | ||||||||||||||||||||||
| Issue of B shares | 25,101 | — | — | 12,801 | — | — | ||||||||||||||||||||||
| Issue of other equity interests | — | — | 3,600 | — | — | 3,600 | ||||||||||||||||||||||
| Issue of paid-in equity | — | — | 1,073 | — | — | 1,073 | ||||||||||||||||||||||
| Issue of subordinated liabilities | 2,309 | 2,413 | 1,018 | — | — | — | ||||||||||||||||||||||
| Proceeds of minority interests issued | 9 | 1,427 | 31,095 | — | — | — | ||||||||||||||||||||||
| Redemption of paid-in equity | (308 | ) | — | — | (308 | ) | — | — | ||||||||||||||||||||
| Redemption of preference shares | (5,000 | ) | — | — | (5,000 | ) | — | — | ||||||||||||||||||||
| Redemption of minority interests | (422 | ) | (13,579 | ) | (545 | ) | — | — | — | |||||||||||||||||||
| Shares purchased by employee trusts | (33 | ) | (64 | ) | (65 | ) | — | — | — | |||||||||||||||||||
| Shares issued under employee share schemes | — | 2 | 79 | — | — | — | ||||||||||||||||||||||
| Repayment of subordinated liabilities | (5,145 | ) | (1,727 | ) | (1,708 | ) | (458 | ) | — | (469 | ) | |||||||||||||||||
| Dividends paid | (1,248 | ) | (3,193 | ) | (3,411 | ) | (935 | ) | (2,908 | ) | (3,290 | ) | ||||||||||||||||
| Interest on subordinated liabilities | (1,746 | ) | (1,967 | ) | (1,522 | ) | (557 | ) | (466 | ) | (455 | ) | ||||||||||||||||
| Net cash flows from financing activities | 18,791 | 15,102 | 29,691 | 10,817 | 28,416 | 536 | ||||||||||||||||||||||
| Effects of exchange rate changes on cash and cash equivalents | (8,592 | ) | 29,209 | 6,010 | (83 | ) | 761 | 62 | ||||||||||||||||||||
| Net increase/(decrease) in cash and cash equivalents | 9,261 | (14,030 | ) | 77,304 | 11,379 | 3,496 | 916 | |||||||||||||||||||||
| Cash and cash equivalents at 1 January | 134,925 | 148,955 | 71,651 | 5,069 | 1,573 | 657 | ||||||||||||||||||||||
| Cash and cash equivalents at 31 December | 144,186 | 134,925 | 148,955 | 16,448 | 5,069 | 1,573 | ||||||||||||||||||||||
The accompanying notes on pages 215 to 309, the accounting policies on pages 204 to 214 and the audited sections of the Business review: Risk, capital and liquidity management on pages 70 to 159 form an integral part of these financial statements.
203
Accounting policies
1. Presentation of accounts
The accounts are prepared on a going concern basis (see page 166 of the Report of the directors) and in accordance with International Financial Reporting Standards issued by the International Accounting Standards Board (IASB) and interpretations issued by the International Financial Reporting Interpretations Committee of the IASB as adopted by the European Union (EU) (together IFRS). The EU has not adopted the complete text of IAS 39 ‘Financial Instruments: Recognition and Measurement’; it has relaxed some of the Standard’s hedging requirements. The Group has not taken advantage of this relaxation and has adopted IAS 39 as issued by the IASB: the Group’s financial statements are prepared in accordance with IFRS as issued by the IASB.
IAS 1 (Revised 2007) ‘Presentation of Financial Statements’ has introduced a number of changes in the format and content of the Group’s financial statements including a statement of changes in equity (showing the components of changes in equity for the period) as a primary financial statement and a statement of comprehensive income immediately following the income statement. Additionally, the revised standard has required the Group to present a third balance sheet (31 December 2007) as a result of the restatement of the Group’s 2008 income statement following the amendment to IFRS 2 (see below).
The IASB issued an amendment, 'Vesting Conditions and Cancellations', to IFRS 2 'Share-based Payment' in January 2008 that changed the accounting for share awards that have non-vesting conditions. The fair value of these awards did not take account of the effect of non-vesting conditions and where such conditions were not subsequently met, costs recognised up to the date of cancellation were reversed. The amendment requires costs not recognised up to the date of cancellation to be recognised immediately. Retrospective application of the amendment caused a restatement of 2008 results for the Group, reducing profit by £169 million with no material effect on earlier periods; there was no effect on the balance sheet. There was no material effect on the company.
The Group has adopted ‘Improving Disclosures about Financial Instruments (Amendments to IFRS 7 Financial Instruments: Disclosures)’. These amendments expand the disclosures required about fair value measurement and liquidity risk.
The company is incorporated in the UK and registered in Scotland. The accounts are prepared on the historical cost basis except that the following assets and liabilities are stated at their fair value: derivative financial instruments, held-for-trading financial assets and financial liabilities, financial assets and financial liabilities that are designated as at fair value through profit or loss, available-for-sale financial assets and investment property. Recognised financial assets and financial liabilities in fair value hedges are adjusted for changes in fair value in respect of the risk that is hedged.
The company accounts are presented in accordance with the Companies Act 2006.
2. Basis of consolidation
The consolidated financial statements incorporate the financial statements of the company and entities (including certain special purpose entities) that are controlled by the Group. Control exists where the Group has the power to govern the financial and operating policies of the entity; generally conferred by holding a majority of voting rights. On acquisition of a subsidiary, its identifiable assets, liabilities and contingent liabilities are included in the consolidated accounts at their fair value. Any excess of the cost (the fair value of assets given, liabilities incurred or assumed and equity instruments issued by the Group plus any directly attributable costs) of an acquisition over the fair value of the net assets acquired is recognised as goodwill. The interest of minority shareholders is stated at their share of the fair value of the subsidiary’s net assets.
The results of subsidiaries acquired are included in the consolidated income statement from the date control passes up until the Group ceases to control them through a sale or significant change in circumstances.
All intra-group balances, transactions, income and expenses are eliminated on consolidation. The consolidated accounts are prepared using uniform accounting policies.
3. Revenue recognition
Interest income on financial assets that are classified as loans and receivables, available-for-sale or held-to-maturity and interest expense on financial liabilities other than those at fair value through profit or loss are determined using the effective interest method. The effective interest method is a method of calculating the amortised cost of a financial asset or financial liability (or group of financial assets or liabilities) and of allocating the interest income or interest expense over the expected life of the asset or liability. The effective interest rate is the rate that exactly discounts estimated future cash flows to the instrument’s initial carrying amount. Calculation of the effective interest rate takes into account fees payable or receivable, that are an integral part of the instrument’s yield, premiums or discounts on acquisition or issue, early redemption fees and transaction costs. All contractual terms of a financial instrument are considered when estimating future cash flows.
Financial assets and financial liabilities held-for-trading or designated as at fair value through profit or loss are recorded at fair value. Changes in fair value are recognised in profit or loss together with dividends and interest receivable and payable.
Commitment and utilisation fees are determined as a percentage of the outstanding facility. If it is unlikely that a specific lending arrangement will be entered into, such fees are taken to profit or loss over the life of the facility otherwise they are deferred and included in the effective interest rate on the advance.
Fees in respect of services are recognised as the right to consideration accrues through the provision of the service to the customer. The arrangements are generally contractual and the cost of providing the service is incurred as the service is rendered. The price is usually fixed and always determinable. The application of this policy to significant fee types is outlined below.
Payment services: this comprises income received for payment services including cheques cashed, direct debits, Clearing House Automated Payments (the UK electronic settlement system) and BACS payments (the automated clearing house that processes direct debits and direct credits). These are generally charged on a per transaction basis. The income is earned when the payment or transaction occurs. Charges for payment services are usually debited to the customer’s account monthly or quarterly in arrears. Accruals are raised for services provided but not charged at period end.
204
Financial statements
Card related services: fees from credit card business include:
| · | Commission received from retailers for processing credit and debit card transactions: income is accrued to the income statement as the service is performed; |
| · | Interchange received: as issuer, the Group receives a fee (interchange) each time a cardholder purchases goods and services. The Group also receives interchange fees from other card issuers for providing cash advances through its branch and Automated Teller Machine networks. These fees are accrued once the transaction has taken place; and |
| · | An annual fee payable by a credit card holder is deferred and taken to profit or loss over the period of the service i.e. 12 months. |
Insurance brokerage: this is made up of fees and commissions received from the agency sale of insurance. Commission on the sale of an insurance contract is earned at the inception of the policy, as the insurance has been arranged and placed. However, provision is made where commission is refundable in the event of policy cancellation in line with estimated cancellations.
Investment management fees: fees charged for managing investments are recognised as revenue as the services are provided. Incremental costs that are directly attributable to securing an investment management contract are deferred and charged as expense as the related revenue is recognised.
Insurance premiums: see accounting policy 12.
4. Assets held for sale and discontinued operations
A non-current asset (or disposal group) is classified as held for sale if the Group will recover the carrying amount principally through a sale transaction rather than through continuing use. A non-current asset (or disposal group) classified as held for sale is measured at the lower of its carrying amount and fair value less costs to sell. If the asset (or disposal group) is acquired as part of a business combination it is initially measured at fair value less costs to sell. Assets and liabilities of disposal groups classified as held for sale and non-current assets classified as held for sale are shown separately on the face of the balance sheet.
The results of discontinued operations are shown as a single amount on the face of the income statement comprising the post-tax profit or loss of discontinued operations and the post-tax gain or loss recognised either on measurement to fair value less costs to sell or on the disposal of the discontinued operation. A discontinued operation is a cash-generating unit or a group of cash-generating units that either has been disposed of, or is classified as held for sale, and (a) represents a separate major line of business or geographical area of operations, (b) is part of a single co-ordinated plan to dispose of a separate major line of business or geographical area of operations or (c) is a subsidiary acquired exclusively with a view to resale.
5. Pensions and other post-retirement benefits
The Group provides post-retirement benefits in the form of pensions and healthcare plans to eligible employees.
For defined benefit schemes, scheme liabilities are measured on an actuarial basis using the projected unit credit method and discounted at a rate that reflects the current rate of return on a high quality corporate bond of equivalent term and currency to the scheme liabilities. Scheme assets are measured at their fair value. Any surplus or deficit of scheme assets over liabilities is recognised in the balance sheet as an asset (surplus) or liability (deficit). The current service cost, curtailments and any past service costs together with the expected return on scheme assets less the unwinding of the discount on the scheme liabilities is charged to operating expenses. Actuarial gains and losses are recognised in full in the period in which they occur outside profit or loss and presented in the consolidated statement of comprehensive income. Contributions to defined contribution pension schemes are recognised in the income statement when payable.
6. Intangible assets and goodwill
Intangible assets that are acquired by the Group are stated at cost less accumulated amortisation and impairment losses. Amortisation is charged to profit or loss over the assets’ estimated economic lives using methods that best reflect the pattern of economic benefits and is included in depreciation and amortisation. The estimated useful economic lives are as follows:
| Core deposit intangibles | 6 to 10 years |
| Other acquired intangibles | 5 to 10 years |
| Computer software | 3 to 5 years |
Expenditure on internally generated goodwill and brands is written-off as incurred. Direct costs relating to the development of internal-use computer software are capitalised once technical feasibility and economic viability have been established. These costs include payroll, the costs of materials and services, and directly attributable overheads. Capitalisation of costs ceases when the software is capable of operating as intended. During and after development, accumulated costs are reviewed for impairment against the projected benefits that the software is expected to generate. Costs incurred prior to the establishment of technical feasibility and economic viability are expensed as incurred as are all training costs and general overheads. The costs of licences to use computer software that are expected to generate economic benefits beyond one year are also capitalised.
Acquired goodwill, being the excess of the cost of an acquisition over the Group’s interest in the net fair value of the identifiable assets, liabilities and contingent liabilities of the subsidiary, associate or joint venture acquired, is initially recognised at cost and subsequently at cost less any accumulated impairment losses. Goodwill arising on the acquisition of subsidiaries and joint ventures is included in the balance sheet category ‘Intangible assets’ and that on associates within their carrying amounts. The gain or loss on the disposal of a subsidiary, associate or joint venture includes the carrying value of any related goodwill.
205
Accounting policies continued
7. Property, plant and equipment
Items of property, plant and equipment (except investment property –see accounting policy 9) are stated at cost less accumulated depreciation and impairment losses. Where an item of property, plant and equipment comprises major components having different useful lives, they are accounted for separately.
Depreciation is charged to profit or loss on a straight-line basis so as to write-off the depreciable amount of property, plant and equipment (including assets owned and let on operating leases) over their estimated useful lives.
The depreciable amount is the cost of an asset less its residual value.
Land is not depreciated. Estimated useful lives are as follows:
| Freehold and long leasehold buildings | 50 years |
| Short leaseholds | unexpired period |
| of the lease | |
| Property adaptation costs | 10 to 15 years |
| Computer equipment | up to 5 years |
| Other equipment | 4 to 15 years |
8. Impairment of intangible assets and property, plant and equipment
At each reporting date, the Group assesses whether there is any indication that its intangible assets, or property, plant and equipment are impaired. If any such indication exists, the Group estimates the recoverable amount of the asset and the impairment loss if any. Goodwill is tested for impairment annually or more frequently if events or changes in circumstances indicate that it might be impaired. If an asset does not generate cash flows that are independent from those of other assets or groups of assets, recoverable amount is determined for the cash-generating unit to which the asset belongs. The recoverable amount of an asset is the higher of its fair value less cost to sell and its value in use. Value in use is the present value of future cash flows from the asset or cash-generating unit discounted at a rate that reflects market interest rates adjusted for risks specific to the asset or cash-generating unit that have not been reflected in the estimation of future cash flows. If the recoverable amount of an intangible or tangible asset is less than its carrying value, an impairment loss is recognised immediately in profit or loss and the carrying value of the asset reduced by the amount of the loss. A reversal of an impairment loss on intangible assets (excluding goodwill) or property, plant and equipment is recognised as it arises provided the increased carrying value does not exceed that which it would have been had no impairment loss been recognised. Impairment losses on goodwill are not reversed.
9. Investment property
Investment property comprises freehold and leasehold properties that are held to earn rentals or for capital appreciation or both. It is not depreciated but is stated at fair value based on valuations by independent registered valuers. Fair value is based on current prices for similar properties in the same location and condition. Any gain or loss arising from a change in fair value is recognised in profit or loss. Rental income from investment property is recognised on a straight-line basis over the term of the lease. Lease incentives granted are recognised as an integral part of the total rental income.
10. Foreign currencies
The Group’s consolidated financial statements are presented in sterling which is the functional currency of the company.
Transactions in foreign currencies are translated into sterling at the foreign exchange rate ruling at the date of the transaction. Monetary assets and liabilities denominated in foreign currencies are translated into sterling at the rates of exchange ruling at the balance sheet date.
Foreign exchange differences arising on translation are reported in income from trading activities except for differences arising on cash flow hedges and hedges of net investments in foreign operations. Non-monetary items denominated in foreign currencies that are stated at fair value are translated into sterling at foreign exchange rates ruling at the dates the values were determined. Translation differences arising on non-monetary items measured at fair value are recognised in profit or loss except for differences arising on available-for-sale non-monetary financial assets, for example equity shares, which are included in the available-for-sale reserve in equity unless the asset is the hedged item in a fair value hedge.
The assets and liabilities of foreign operations, including goodwill and fair value adjustments arising on acquisition, are translated into sterling at foreign exchange rates ruling at the balance sheet date. The revenues and expenses of foreign operations are translated into sterling at average exchange rates unless these do not approximate to the foreign exchange rates ruling at the dates of the transactions. Foreign exchange differences arising on the translation of a foreign operation are recognised directly in equity and included in profit or loss on its disposal.
11. Leases
Contracts to lease assets are classified as finance leases if they transfer substantially all the risks and rewards of ownership of the asset to the customer. Other contracts to lease assets are classified as operating leases.
Finance lease receivables are stated in the balance sheet at the amount of the net investment in the lease being the minimum lease payments and any unguaranteed residual value discounted at the interest rate implicit in the lease. Finance lease income is allocated to accounting periods so as to give a constant periodic rate of return before tax on the net investment. Unguaranteed residual values are subject to regular review to identify potential impairment. If there has been a reduction in the estimated unguaranteed residual value, the income allocation is revised and any reduction in respect of amounts accrued is recognised immediately.
Rental income from operating leases is credited to the income statement on a receivable basis over the term of the lease. Operating lease assets are included within Property, plant and equipment and depreciated over their useful lives (see accounting policy 7).
206
Financial statements
12. Insurance
General insurance
General insurance comprises short-duration contracts, principally property and liability insurance contracts. Due to the nature of the products sold – retail-based property and casualty, motor, home and personal health insurance contracts – the insurance protection is provided on an even basis throughout the term of the policy.
General insurance and reinsurance premiums are recognised in the accounting period in which they begin. Unearned premiums represent the proportion of the net premiums that relate to periods of insurance after the balance sheet date and are calculated over the period of exposure under the policy, on a daily basis, 24th’s basis or allowing for the estimated incidence of exposure under policies which are longer than twelve months. Provision is made where necessary for the estimated amount of claims over and above unearned premiums including that in respect of future written business on discontinued lines under the run-off of delegated underwriting authority arrangements. The provision is designed to meet future claims and related expenses and is calculated across related classes of business on the basis of a separate carry forward of deferred acquisition expenses after making allowance for investment income.
Acquisition expenses relating to new and renewed business for all classes are expensed over the period during which the premiums are earned. The principal acquisition costs so deferred are commissions payable, costs associated with the telesales and underwriting staff and prepaid claims handling costs in respect of delegated claims handling arrangements for claims which are expected to occur after the balance sheet date. Claims and the related reinsurance are recognised in the accounting period in which the loss occurs. Provision is made for the cost of settling outstanding claims at the balance sheet date, including claims estimated to have been incurred but not yet reported at that date, and claims handling expenses. Provision is only discounted where there is a contractual agreement to make periodic payments. Related reinsurance receivables are recognised on the same basis and at the same time.
Life assurance
The Group’s long-term assurance contracts include whole-life term assurance, endowment assurance, flexible whole-life, pension and annuity contracts that are expected to remain in force for an extended period of time. Long-term assurance contracts under which the Group does not accept significant insurance risk are classified as financial instruments.
The Group recognises the value of in-force long-term assurance contracts as an asset. Cash flows associated with in-force contracts and related assets, including reinsurance cash flows, are projected, using appropriate assumptions as to future mortality, persistency and levels of expenses and excluding the value of future investment margins, to estimate future surpluses attributable to the Group. These surpluses, discounted at a risk-adjusted rate, are recognised as a separate asset. Changes in the value of this asset are included in profit or loss.
Premiums on long-term insurance contracts are recognised as income when receivable. Claims on long-term insurance contracts reflect the cost of all claims arising during the year, including claims handling costs. Claims are recognised when the Group becomes aware of the claim.
Reinsurance
The Group has reinsurance treaties that transfer significant insurance risk. Liabilities for reinsured contracts are calculated gross of reinsurance and a separate reinsurance asset recorded.
13. Provisions
The Group recognises a provision for a present obligation resulting from a past event when it is more likely than not that it will be required to transfer economic benefits to settle the obligation and the amount of the obligation can be estimated reliably.
Provision is made for restructuring costs, including the costs of redundancy, when the Group has a constructive obligation to restructure. An obligation exists when the Group has a detailed formal plan for the restructuring and has raised a valid expectation in those affected by starting to implement the plan or announcing its main features.
If the Group has a contract that is onerous, it recognises the present obligation under the contract as a provision. An onerous contract is one where the unavoidable costs of meeting the obligations under it exceed the expected economic benefits. When the Group vacates a leasehold property, a provision is recognised for the costs under the lease less any expected economic benefits (such as rental income).
Contingent liabilities are possible obligations arising from past events whose existence will be confirmed only by uncertain future events or present obligations arising from past events that are not recognised because either an outflow of economic benefits is not probable or the amount of the obligation cannot be reliably measured. Contingent liabilities are not recognised but information about them is disclosed unless the possibility of any outflow of economic benefits in settlement is remote.
14. Taxation
Provision is made for taxation at current enacted rates on taxable profits, arising in income or in equity, taking into account relief for overseas taxation where appropriate. Deferred taxation is accounted for in full for all temporary differences between the carrying amount of an asset or liability for accounting purposes and its carrying amount for tax purposes, except in relation to overseas earnings where remittance is controlled by the Group, and goodwill.
Deferred tax assets are only recognised to the extent that it is probable that they will be recovered.
207
Accounting policies continued
15. Financial assets
On initial recognition, financial assets are classified into held-to-maturity investments; available-for-sale financial assets; held-for-trading; designated as at fair value through profit or loss; or loans and receivables.
Held-to-maturity investments – a financial asset may be classified as a held-to-maturity investment only if it has fixed or determinable payments, a fixed maturity and the Group has the positive intention and ability to hold to maturity. Held-to-maturity investments are initially recognised at fair value plus directly related transaction costs. They are subsequently measured at amortised cost using the effective interest method (see accounting policy 3) less any impairment losses.
Held-for-trading – a financial asset is classified as held-for-trading if it is acquired principally for sale in the near term, or forms part of a portfolio of financial instruments that are managed together and for which there is evidence of short-term profit taking, or it is a derivative (not in a qualifying hedge relationship). Held-for-trading financial assets are recognised at fair value with transaction costs being recognised in profit or loss. Subsequently they are measured at fair value. Gains and losses on held-for-trading financial assets are recognised in profit or loss as they arise.
Designated as at fair value through profit or loss – financial assets may be designated as at fair value through profit or loss only if such designation (a) eliminates or significantly reduces a measurement or recognition inconsistency; or (b) applies to a group of financial assets, financial liabilities or both, that the Group manages and evaluates on a fair value basis; or (c) relates to an instrument that contains an embedded derivative which is not evidently closely related to the host contract.
Financial assets that the Group designates on initial recognition as being at fair value through profit or loss are recognised at fair value, with transaction costs being recognised in profit or loss, and are subsequently measured at fair value. Gains and losses on financial assets that are designated as at fair value through profit or loss are recognised in profit or loss as they arise.
The principal category of financial assets designated as at fair value through profit or loss is policyholders’ assets underpinning insurance and investment contracts issued by the Group's life assurance businesses. Fair value designation significantly reduces the measurement inconsistency that would arise if these assets were classified as available-for-sale.
Loans and receivables – non-derivative financial assets with fixed or determinable repayments that are not quoted in an active market are classified as loans and receivables, except those that are classified as available-for-sale or as held-for-trading, or designated as at fair value through profit or loss. Loans and receivables are initially recognised at fair value plus directly related transaction costs. They are subsequently measured at amortised cost using the effective interest method (see accounting policy 3) less any impairment losses.
Available-for-sale – financial assets that are not classified as held-to-maturity; held-for-trading; designated as at fair value through profit or loss; or loans and receivables, are classified as available-for-sale. Financial assets can be designated as available-for-sale on initial recognition. Available-for-sale financial assets are initially recognised at fair value plus directly related transaction costs. They are subsequently measured at fair value. Unquoted equity investments whose fair value cannot be measured reliably are carried at cost and classified as available-for-sale financial assets. Impairment losses and exchange differences resulting from retranslating the amortised cost of foreign currency monetary available-for-sale financial assets are recognised in profit or loss together with interest calculated using the effective interest method (see accounting policy 3). Other changes in the fair value of available-for-sale financial assets are reported in a separate component of shareholders’ equity until disposal, when the cumulative gain or loss is recognised in profit or loss.
Reclassifications – held-for-trading and available-for-sale financial assets that meet the definition of loans and receivables (non-derivative financial assets with fixed or determinable payments that are not quoted in an active market) may be reclassified to loans and receivables if the Group has the intention and ability to hold the financial asset for the foreseeable future or until maturity. The Group typically regards the foreseeable future as twelve months from the date of reclassification. Additionally, held-for-trading financial assets that do not meet the definition of loans and receivables may, in rare circumstances, be transferred to available-for-sale financial assets or to held-to-maturity investments. Reclassifications are made at fair value. This fair value becomes the asset’s new cost or amortised cost as appropriate. Gains and losses recognised up to the date of reclassification are not reversed.
Regular way purchases of financial assets classified as loans and receivables are recognised on settlement date; issues of equity or financial liabilities measured at amortised cost are recognised on settlement date; all other regular way transactions in financial instruments are recognised on trade date.
Fair value for a net open position in a financial asset that is quoted in an active market is the current bid price times the number of units of the instrument held. Fair values for financial assets not quoted in an active market are determined using appropriate valuation techniques including discounting future cash flows, option pricing models and other methods that are consistent with accepted economic methodologies for pricing financial assets.
208
Financial statements
16. Impairment of financial assets
The Group assesses at each balance sheet date whether there is any objective evidence that a financial asset or group of financial assets classified as held-to-maturity, available-for-sale or loans and receivables is impaired. A financial asset or portfolio of financial assets is impaired and an impairment loss incurred if there is objective evidence that an event or events since initial recognition of the asset have adversely affected the amount or timing of future cash flows from the asset.
Financial assets carried at amortised cost – if there is objective evidence that an impairment loss on a financial asset or group of financial assets classified as loans and receivables or as held-to-maturity investments has been incurred, the Group measures the amount of the loss as the difference between the carrying amount of the asset or group of assets and the present value of estimated future cash flows from the asset or group of assets discounted at the effective interest rate of the instrument at initial recognition.
Impairment losses are assessed individually for financial assets that are individually significant and individually or collectively for assets that are not individually significant. In making collective assessment of impairment, financial assets are grouped into portfolios on the basis of similar risk characteristics. Future cash flows from these portfolios are estimated on the basis of the contractual cash flows and historical loss experience for assets with similar credit risk characteristics. Historical loss experience is adjusted, on the basis of observable data, to reflect current conditions not affecting the period of historical experience.
Impairment losses are recognised in profit or loss and the carrying amount of the financial asset or group of financial assets reduced by establishing an allowance for impairment losses. If, in a subsequent period, the amount of the impairment loss reduces and the reduction can be ascribed to an event after the impairment was recognised, the previously recognised loss is reversed by adjusting the allowance. Once an impairment loss has been recognised on a financial asset or group of financial assets, interest income is recognised on the carrying amount using the rate of interest at which estimated future cash flows were discounted in measuring impairment.
Impaired loans and receivables are written off, i.e. the impairment provision is applied in writing down the loan's carrying value partially or in full, when the Group concludes that there is no longer any realistic prospect of recovery of part or all of the loan. For portfolios that are collectively assessed for impairment, the timing of write off principally reflects historic recovery experience for each portfolio. For loans that are individually assessed for impairment, the timing of write off is determined on a case-by-case basis. Such loans are reviewed regularly and write offs will be prompted by bankruptcy, insolvency, restructuring and similar events. Amounts recovered after a loan has been written off are credited to the loan impairment charge for the period in which they are received.
Financial assets carried at fair value – when a decline in the fair value of a financial asset classified as available-for-sale has been recognised directly in equity and there is objective evidence that the asset is impaired, the cumulative loss is removed from equity and recognised in profit or loss. The loss is measured as the difference between the amortised cost of the financial asset and its current fair value. Impairment losses on available-for-sale equity instruments are not reversed through profit or loss, but those on available-for-sale debt instruments are reversed, if there is an increase in fair value that is objectively related to a subsequent event.
17. Financial liabilities
On initial recognition financial liabilities are classified into held-for-trading; designated as at fair value through profit or loss; or amortised cost.
Held for trading – a financial liability is classified as held-for-trading if it is incurred principally for repurchase in the near term, or forms part of a portfolio of financial instruments that are managed together and for which there is evidence of short-term profit taking, or it is a derivative (not in a qualifying hedge relationship). Held-for-trading financial liabilities are recognised at fair value with transaction costs being recognised in profit or loss. Subsequently they are measured at fair value. Gains and losses are recognised in profit or loss as they arise.
Designated as at fair value through profit or loss – financial liabilities may be designated as at fair value through profit or loss only if such designation (a) eliminates or significantly reduces a measurement or recognition inconsistency; or (b) applies to a group of financial assets, financial liabilities or both that the Group manages and evaluates on a fair value basis; or (c) relates to an instrument that contains an embedded derivative which is not evidently closely related to the host contract.
Financial liabilities that the Group designates on initial recognition as being at fair value through profit or loss are recognised at fair value, with transaction costs being recognised in profit or loss, and are subsequently measured at fair value. Gains and losses on financial liabilities that are designated as at fair value through profit or loss are recognised in profit or loss as they arise.
The principal categories of financial liabilities designated as at fair value through profit or loss are (a) structured liabilities issued by the Group: designation significantly reduces the measurement inconsistency between these liabilities and the related derivatives carried at fair value; and (b) investment contracts issued by the Group's life assurance businesses: fair value designation significantly reduces the measurement inconsistency that would arise if these liabilities were measured at amortised cost.
Amortised cost – all other financial liabilities are measured at amortised cost using the effective interest method (see accounting policy 3).
Fair value for a net open position in a financial liability that is quoted in an active market is the current offer price times the number of units of the instrument held or issued. Fair values for financial liabilities not quoted in an active market are determined using appropriate valuation techniques including discounting future cash flows, option pricing models and other methods that are consistent with accepted economic methodologies for pricing financial liabilities.
18. Loan commitments
Provision is made for loan commitments, other than those classified as held-for-trading, if it is probable that the facility will be drawn and the resulting loan will be recognised at a value less than the cash advanced. Syndicated loan commitments in excess of the level of lending under the commitment approved for retention by the Group are classified as held-for-trading and measured at fair value.
209
Accounting policies continued
19. Derecognition
A financial asset is derecognised when it has been transferred and the transfer qualifies for derecognition. A transfer requires that the Group either: (a) transfers the contractual rights to receive the asset’s cash flows; or (b) retains the right to the asset’s cash flows but assumes a contractual obligation to pay those cash flows to a third party. After a transfer, the Group assesses the extent to which it has retained the risks and rewards of ownership of the transferred asset. If substantially all the risks and rewards have been retained, the asset remains on the balance sheet. If substantially all the risks and rewards have been transferred, the asset is derecognised. If substantially all the risks and rewards have been neither retained nor transferred, the Group assesses whether or not it has retained control of the asset. If it has not retained control, the asset is derecognised. Where the Group has retained control of the asset, it continues to recognise the asset to the extent of its continuing involvement.
A financial liability is removed from the balance sheet when the obligation is discharged, or cancelled, or expires. On the redemption or settlement of debt securities (including subordinated liabilities) issued by the Group, the Group derecognises the debt instrument and records a gain or loss being the difference between the debt’s carrying amount and the cost of redemption or settlement. The same treatment applies where the debt is exchanged for a new debt issue that has terms substantially different from those of the existing debt. The assessment of whether the terms of the new debt instrument are substantially different takes into account qualitative and quantitative characteristics including a comparison of the discounted present value of the cash flows under the new terms with the discounted present value of the remaining cash flows of the original debt issue.
20. Sale and repurchase transactions
Securities subject to a sale and repurchase agreement under which substantially all the risks and rewards of ownership are retained by the Group continue to be shown on the balance sheet and the sale proceeds recorded as a financial liability. Securities acquired in a reverse sale and repurchase transaction under which the Group is not exposed to substantially all the risks and rewards of ownership are not recognised on the balance sheet and the consideration paid is recorded as a financial asset.
Securities borrowing and lending transactions are usually secured by cash or securities advanced by the borrower. Borrowed securities are not recognised on the balance sheet or lent securities derecognised. Cash collateral received or given is treated as a loan or deposit; collateral in the form of securities is not recognised. However, where securities borrowed are transferred to third parties, a liability for the obligation to return the securities to the stock lending counterparty is recorded.
21. Netting
Financial assets and financial liabilities are offset and the net amount presented in the balance sheet when, and only when, the Group currently has a legally enforceable right to set off the recognised amounts; and it intends either to settle on a net basis, or to realise the asset and settle the liability simultaneously. The Group is party to a number of arrangements, including master netting agreements, that give it the right to offset financial assets and financial liabilities but where it does not intend to settle the amounts net or simultaneously and therefore the assets and liabilities concerned are presented gross.
22. Capital instruments
The Group classifies a financial instrument that it issues as a financial asset, financial liability or an equity instrument in accordance with the substance of the contractual arrangement. An instrument is classified as a liability if it is a contractual obligation to deliver cash or another financial asset, or to exchange financial assets or financial liabilities on potentially unfavourable terms. An instrument is classified as equity if it evidences a residual interest in the assets of the Group after the deduction of liabilities. The components of a compound financial instrument issued by the Group are classified and accounted for separately as financial assets, financial liabilities or equity as appropriate.
23. Derivatives and hedging
Derivative financial instruments are initially recognised, and subsequently measured, at fair value. Derivative fair values are determined from quoted prices in active markets where available. Where there is no active market for an instrument, fair value is derived from prices for the derivative’s components using appropriate pricing or valuation models.
A derivative embedded in a contract is accounted for as a stand-alone derivative if its economic characteristics are not closely related to the economic characteristics of the host contract; unless the entire contract is measured at fair value with changes in fair value recognised in profit or loss.
Gains and losses arising from changes in the fair value of a derivative are recognised as they arise in profit or loss unless the derivative is the hedging instrument in a qualifying hedge. The Group enters into three types of hedge relationship: hedges of changes in the fair value of a recognised asset or liability or firm commitment (fair value hedges); hedges of the variability in cash flows from a recognised asset or liability or a highly probable forecast transaction (cash flow hedges); and hedges of the net investment in a foreign operation.
Hedge relationships are formally documented at inception. The documentation identifies the hedged item and the hedging instrument and details the risk that is being hedged and the way in which effectiveness will be assessed at inception and during the period of the hedge. If the hedge is not highly effective in offsetting changes in fair values or cash flows attributable to the hedged risk, consistent with the documented risk management strategy, hedge accounting is discontinued.
Fair value hedge – in a fair value hedge, the gain or loss on the hedging instrument is recognised in profit or loss. The gain or loss on the hedged item attributable to the hedged risk is recognised in profit or loss and adjusts the carrying amount of the hedged item. Hedge accounting is discontinued if the hedge no longer meets the criteria for hedge accounting; or if the hedging instrument expires or is sold, terminated or exercised; or if hedge designation is revoked. If the hedged item is one for which the effective interest rate method is used, any cumulative adjustment is amortised to profit or loss over the life of the hedged item using a recalculated effective interest rate.
210
Financial statements
Cash flow hedge – in a cash flow hedge, the effective portion of the gain or loss on the hedging instrument is recognised directly in equity and the ineffective portion in profit or loss. When the forecast transaction results in the recognition of a financial asset or financial liability, the cumulative gain or loss is reclassified from equity in the same periods in which the asset or liability affects profit or loss. Otherwise the cumulative gain or loss is removed from equity and recognised in profit or loss at the same time as the hedged transaction. Hedge accounting is discontinued if the hedge no longer meets the criteria for hedge accounting; if the hedging instrument expires or is sold, terminated or exercised; if the forecast transaction is no longer expected to occur; or if hedge designation is revoked. On the discontinuance of hedge accounting (except where a forecast transaction is no longer expected to occur), the cumulative unrealised gain or loss in equity is recognised in profit or loss when the hedged cash flow occurs or, if the forecast transaction results in the recognition of a financial asset or financial liability, in the same periods during which the asset or liability affects profit or loss. Where a forecast transaction is no longer expected to occur, the cumulative unrealised gain or loss in equity is recognised in profit or loss immediately.
Hedge of net investment in a foreign operation – in the hedge of a net investment in a foreign operation, the portion of foreign exchange differences arising on the hedging instrument determined to be an effective hedge is recognised directly in equity. Any ineffective portion is recognised in profit or loss. Non-derivative financial liabilities as well as derivatives may be the hedging instrument in a net investment hedge.
24. Share-based payments
The Group awards shares and options over shares in The Royal Bank of Scotland Group plc to its employees under various share option schemes. The expense for these transactions is measured based on the fair value on the date the awards are granted. The fair value of an option is estimated using valuation techniques which take into account its exercise price, its term, the risk-free interest rate and the expected volatility of the market price of The Royal Bank of Scotland Group plc’s shares. Vesting conditions are not taken into account when measuring fair value, but are reflected by adjusting the proportion of awards that actually vest. The fair value is expensed on a straight-line basis over the vesting period. Following an amendment to IFRS 2 for accounting periods starting after 1 January 2009, the cancellation of an award with non-vesting conditions triggers immediate recognition of an expense in respect of any unrecognised element of the fair value of the award.
25. Cash and cash equivalents
Cash and cash equivalents comprises cash and demand deposits with banks together with short-term highly liquid investments that are readily convertible to known amounts of cash and subject to insignificant risk of change in value.
26. Shares in Group entities
The company’s investments in its subsidiaries are stated at cost less any impairment.
Critical accounting policies and key sources of estimation uncertainty
The reported results of the Group are sensitive to the accounting policies, assumptions and estimates that underlie the preparation of its financial statements. UK company law and IFRS require the directors, in preparing the Group’s financial statements, to select suitable accounting policies, apply them consistently and make judgements and estimates that are reasonable and prudent. In the absence of an applicable standard or interpretation, IAS 8 ‘Accounting Policies, Changes in Accounting Estimates and Errors’, requires management to develop and apply an accounting policy that results in relevant and reliable information in the light of the requirements and guidance in IFRS dealing with similar and related issues and the IASB’s Framework for the Preparation and Presentation of Financial Statements. The judgements and assumptions involved in the Group’s accounting policies that are considered by the Board to be the most important to the portrayal of its financial condition are discussed below. The use of estimates, assumptions or models that differ from those adopted by the Group would affect its reported results.
Loan impairment provisions
The Group’s loan impairment provisions are established to recognise incurred impairment losses in its portfolio of loans classified as loans and receivables and carried at amortised cost. A loan is impaired when there is objective evidence that events since the loan was granted have affected expected cash flows from the loan. The impairment loss is the difference between the carrying value of the loan and the present value of estimated future cash flows at the loan’s original effective interest rate.
At 31 December 2009, gross loans and advances to customers totalled £745,519 million (2008 – £885,611 million; 2007 – £834,987 million) and customer loan impairment provisions amounted to £17,126 million (2008 – £10,889 million; 2007 – £6,449 million).
There are two components to the Group’s loan impairment provisions: individual and collective.
Individual component – all impaired loans that exceed specific thresholds are individually assessed for impairment. Individually assessed loans principally comprise the Group’s portfolio of commercial loans to medium and large businesses. Impairment losses are recognised as the difference between the carrying value of the loan and the discounted value of management’s best estimate of future cash repayments and proceeds from any security held. These estimates take into account the customer’s debt capacity and financial flexibility; the level and quality of its earnings; the amount and sources of cash flows; the industry in which the counterparty operates; and the realisable value of any security held. Estimating the quantum and timing of future recoveries involves significant judgement. The size of receipts will depend on the future performance of the borrower and the value of security, both of which will be affected by future economic conditions; additionally, collateral may not be readily marketable. The actual amount of future cash flows and the date they are received may differ from these estimates and consequently actual losses incurred may differ from those recognised in these financial statements.
211
Accounting policies continued
Collective component – this is made up of two elements: loan impairment provisions for impaired loans that are below individual assessment thresholds (collectively assessed provisions) and for loan losses that have been incurred but have not been separately identified at the balance sheet date (latent loss provisions). Collectively assessed provisions are established on a portfolio basis using a present value methodology taking into account the level of arrears, security, past loss experience, credit scores and defaults based on portfolio trends. The most significant factors in establishing these provisions are the expected loss rates and the related average life. These portfolios include credit card receivables and other personal advances including mortgages. The future credit quality of these portfolios is subject to uncertainties that could cause actual credit losses to differ materially from reported loan impairment provisions. These uncertainties include the economic environment, notably interest rates and their effect on customer spending, the unemployment level, payment behaviour and bankruptcy trends. Latent loss provisions are held against estimated impairment losses in the performing portfolio that have yet to be identified as at the balance sheet date. To assess the latent loss within its portfolios, the Group has developed methodologies to estimate the time that an asset can remain impaired within a performing portfolio before it is identified and reported as such.
Pensions
The Group operates a number of defined benefit pension schemes as described in Note 4 on the accounts. The assets of the schemes are measured at their fair value at the balance sheet date. Scheme liabilities are measured using the projected unit method, which takes account of projected earnings increases, using actuarial assumptions that give the best estimate of the future cash flows that will arise under the scheme liabilities. These cash flows are discounted at the interest rate applicable to high-quality corporate bonds of the same currency and term as the liabilities. Any recognisable surplus or deficit of scheme assets over liabilities is recognised in the balance sheet as an asset (surplus) or liability (deficit). In determining the value of scheme liabilities, assumptions are made as to price inflation, dividend growth, pension increases, earnings growth and employees. There is a range of assumptions that could be adopted in valuing the schemes’ liabilities. Different assumptions could significantly alter the amount of the surplus or deficit recognised in the balance sheet and the pension cost charged to the income statement. The assumptions adopted for the Group’s pension schemes are set out in Note 4 on the accounts together with the sensitivity of reported amounts to changes in those assumptions. A pension asset of £58 million and a liability of £2,963 million were recognised in the balance sheet at 31 December 2009 (2008: asset – £36 million, liability – £2,032 million; 2007 asset – £575 million, liability – £460 million).
Fair value – financial instruments
Financial instruments classified as held-for-trading or designated as at fair value through profit or loss and financial assets classified as available-for-sale are recognised in the financial statements at fair value. All derivatives are measured at fair value. Gains or losses arising from changes in the fair value of financial instruments classified as held-for-trading or designated as at fair value through profit or loss are included in the income statement. Unrealised gains and losses on available-for-sale financial assets are recognised directly in equity unless an impairment loss is recognised.
Financial instruments measured at fair value include:
Loans and advances (held-for-trading and designated as at fair value though profit or loss) – principally comprise reverse repurchase agreements (reverse repos) and cash collateral.
Debt securities (held-for-trading, designated as at fair value though profit or loss and available-for-sale) – debt securities include those issued by governments, municipal bodies, mortgage agencies and financial institutions as well as corporate bonds, debentures and residual interests in securitisations.
Equity securities (held-for-trading, designated as at fair value though profit or loss and available-for-sale) – comprise equity shares of companies or corporations both listed and unlisted.
Deposits by banks and customer accounts (held-for-trading and designated as at fair value though profit or loss) – deposits measured at fair value principally include repurchase agreements (repos), cash collateral and investment contracts issued by the Group’s life assurance businesses.
Debt securities in issue (held-for-trading and designated as at fair value though profit or loss) – measured at fair value and principally comprise medium term notes.
Short positions (held-for-trading) – arise in dealing and market making activities where debt securities and equity shares are sold which the Group does not currently possess.
Derivatives –these include swaps (currency swaps, interest rate swaps, credit default swaps, total return swaps and equity and equity index swaps), forward foreign exchange contracts, forward rate agreements, futures (currency, interest rate and equity) and options (exchange-traded options on currencies, interest rates and equities and equity indices and OTC currency and equity options, interest rate caps and floors and swaptions).
212
Financial statements
Fair value is the amount for which an asset could be exchanged, or a liability settled, between knowledgeable, willing parties in an arm’s length transaction. Fair values are determined from quoted prices in active markets for identical financial assets or financial liabilities where these are available. Fair value for a net open position in a financial asset or financial liability in an active market is the current bid or offer price times the number of units of the instrument held. Where a trading portfolio contains both financial assets and financial liabilities which are derivatives of the same underlying instrument, fair value is determined by valuing the gross long and short positions at current mid market prices, with an adjustment at portfolio level to the net open long or short position to amend the valuation to bid or offer as appropriate. Where the market for a financial instrument is not active, fair value is established using a valuation technique. These valuation techniques involve a degree of estimation, the extent of which depends on the instrument’s complexity and the availability of market-based data. More details about the Group’s valuation methodologies and the sensitivity to reasonably possible alternative assumptions of the fair value of financial instruments valued using techniques where at least one significant input is unobservable are given in Note 11 on pages 226 to 247.
General insurance claims
The Group makes provision for the full cost of settling outstanding claims arising from its general insurance business at the balance sheet date, including claims estimated to have been incurred but not yet reported at that date and claims handling expenses. General insurance claims provisions amounted to £5,802 million at 31 December 2009 (2008 – £5,478 million; 2007 – £5,466 million).
Provisions are determined by management based on experience of claims settled and on statistical models which require certain assumptions to be made regarding the incidence, timing and amount of claims and any specific factors such as adverse weather conditions. In order to calculate the total provision required, the historical development of claims is analysed using statistical methodology to extrapolate, within acceptable probability parameters, the value of outstanding claims at the balance sheet date. Also included in the estimation of outstanding claims are other assumptions such as the inflationary factor used for bodily injury claims which is based on historical trends and, therefore, allows for some increase due to changes in common law and statute. Costs for both direct and indirect claims handling expenses are also included. Outward reinsurance recoveries are accounted for in the same accounting period as the direct claims to which they relate. The outstanding claims provision is based on information available to management and the eventual outcome may vary from the original assessment. Actual claims experience may differ from the historical pattern on which the estimate is based and the cost of settling individual claims may exceed that assumed.
Goodwill
The Group capitalises goodwill arising on the acquisition of businesses, as discussed in accounting policy 6. The carrying value of goodwill as at 31 December 2009 was £14,264 million (2008 – £15,562 million; 2007 – £42,953 million).
Goodwill is the excess of the cost of an acquired business over the fair value of its net assets. The determination of the fair value of assets and liabilities of businesses acquired requires the exercise of management judgement; for example those financial assets and liabilities for which there are no quoted prices, and those non-financial assets where valuations reflect estimates of market conditions, such as property. Different fair values would result in changes to the goodwill arising and to the post-acquisition performance of the acquisition. Goodwill is not amortised but is tested for impairment annually or more frequently if events or changes in circumstances indicate that it might be impaired.
For the purposes of impairment testing, goodwill acquired in a business combination is allocated to each of the Group’s cash-generating units or groups of cash-generating units expected to benefit from the combination. Goodwill impairment testing involves the comparison of the carrying value of a cash-generating unit or group of cash-generating units with its recoverable amount. The recoverable amount is the higher of the unit’s fair value and its value in use. Value in use is the present value of expected future cash flows from the cash-generating unit or group of cash-generating units. Fair value is the amount obtainable for the sale of the cash-generating unit in an arm’s length transaction between knowledgeable, willing parties.
Impairment testing inherently involves a number of judgmental areas: the preparation of cash flow forecasts for periods that are beyond the normal requirements of management reporting; the assessment of the discount rate appropriate to the business; estimation of the fair value of cash-generating units; and the valuation of the separable assets of each business whose goodwill is being reviewed. Sensitivity to changes in assumptions is discussed in Note 17 on page 259.
Deferred tax
The Group makes provision for deferred tax on short-term and other temporary differences where tax recognition occurs at a different time from accounting recognition. Deferred tax assets of £7,039 million were recognised as at 31 December 2009 (2008 – £7,082 million; 2007 – £3,119 million).
The Group has recognised deferred tax assets in respect of losses, principally in the UK, and short-term timing differences. Deferred tax assets are recognised in respect of unused tax losses to the extent that it is probable that there will be future taxable profits against which the losses can be utilised. Business projections prepared for impairment reviews (see Note 17) indicate that sufficient future taxable income will be available against which to offset these recognised deferred tax assets within eight years. The number of years into the future for which forecast profits should be considered when assessing the recoverability of a deferred tax asset is a matter of judgment. A period of eight years is underpinned by the Group’s business projections, its history of profitable operation and the continuing strength of its core business franchises. The Group’s cumulative losses are principally attributable to the recent unparalleled market conditions. Deferred tax assets of £2,163 million (2008 – £1,748 million; 2007 – £687 million) have not been recognised in respect of tax losses carried forward in jurisdictions where doubt exists over the availability of future taxable profits.
213
Accounting policies continued
Accounting developments
International Financial Reporting Standards
The International Accounting Standards Board (IASB) published a revised IFRS 3 ‘Business Combinations’ and related revisions to IAS 27 ‘Consolidated and Separate Financial Statements’ following the completion in January 2008 of its project on the acquisition and disposal of subsidiaries. The standards improve convergence with US GAAP and provide new guidance on accounting for changes in interests in subsidiaries. The cost of an acquisition will comprise only consideration paid to vendors for equity; other costs will be expensed immediately. Groups will only account for goodwill on acquisition of a subsidiary; subsequent changes in interest will be recognised in equity and only on a loss of control will there be a profit or loss on disposal to be recognised in income. The changes are effective for accounting periods beginning on or after 1 July 2009 but both standards may be adopted together for accounting periods beginning on or after 1 July 2007. These changes will affect the Group’s accounting for future acquisitions and disposals of subsidiaries.
The IASB issued amendments to a number of standards in April 2009 as part of its annual improvements project. The amendments are effective for annual periods beginning on or after 1 July 2009 and are not expected to have a material effect on the Group or the company.
The IASB issued an amendment, ‘Group Cash-settled Share-based Payment Transactions‘, to IFRS 2 ‘Share-based Payment’ in June 2009 that will change the accounting for share awards by permitting accounting for equity settlement only by entities that either grant awards over their own equity or have no obligation to settle a share-based payment transaction. The amendment is effective for annual periods beginning on or after 1 January 2010 and is not expected to have a material effect on the Group or the company.
The IASB published an amendment ‘Classification of Rights Issues’ to IAS 32 ‘Financial Instruments: Presentation’ and consequential revisions to other standards in October 2009 to improve the accounting for issues of equity for consideration fixed other than in the reporting entity’s functional currency. The amendment is effective for annual periods beginning on or after 1 February 2010 but it may be adopted earlier. It is not expected to have a material affect on the Group or the company.
The IASB reissued IAS 24, ‘Related Party Disclosures’, in November 2009 clarifying the existing standard and to provide certain exemptions for entities under government control. The revised standard is effective for annual periods beginning on or after 1 January 2011.
The IASB issued IFRS 9 ‘Financial Instruments’ in November 2009 simplifying the classification and measurement requirements in IAS 39 ‘Financial Instruments: Recognition and Measurement’ in respect of financial assets. The standard reduces the measurement categories for financial assets to two: fair value and amortised cost. A financial asset is classified on the basis of the entity’s business model for managing the financial asset and the contractual cash flow characteristics of the financial asset. Only assets with contractual terms that give rise to cash flows on specified dates that are solely payments of principal and interest on the principal amount outstanding and which are held within a business model whose objective is to hold assets in order to collect contractual cash flows are classified as amortised cost. All other financial assets are measured at fair value. Changes in the value of financial assets measured at fair value are generally taken to profit or loss. The standard is effective for annual periods beginning on or after 1 January 2013; early application is permitted.
This standard makes major changes to the framework for the classification and measurement of financial assets and will have a significant effect on the Group’s financial statements. The Group is assessing this impact which is likely to depend on the outcome of the other phases of IASB’s IAS 39 replacement project.
The International Financial Reporting Interpretations Committee (IFRIC) issued interpretation IFRIC 17 ‘Distributions of Non-Cash Assets to Owners’ and the IASB made consequential amendments to IFRS 5 ‘Non-Current Assets Held for Sale and Discontinued Operations’ in December 2008. The interpretation requires distributions to be presented at fair value with any surplus or deficit recognised in income. The amendment to IFRS 5 extends the definition of disposal groups and discontinued operations to disposals by way of distribution. The interpretation is effective for annual periods beginning on or after 1 July 2009, to be adopted at the same time as IFRS 3 ‘Business Combinations’ (revised 2008), and is not expected to have a material effect on the company. The interpretation may affect the accounting treatment in the Group's financial statements of the ABN AMRO businesses to be acquired by the State of Netherlands following the reorganisation of ABN AMRO Bank N.V. described in Note 16.
The IFRIC issued interpretation IFRIC 18 ‘Transfers of Assets from Customers’ in January 2009. The interpretation addresses the accounting by suppliers for assets received from customers, requiring such assets to be measured at fair value. The interpretation is effective for assets from customers received on or after 1 July 2009 and is not expected to have a material effect on the Group or the company.
The IFRIC issued interpretation IFRIC 19 ‘Extinguishing Financial Liabilities with Equity Instruments’ in December 2009. The interpretation clarifies that the profit or loss on extinguishing liabilities by issuing equity instruments should be measured by reference to fair value, preferably of the equity instruments. The interpretation, effective for the Group for annual periods beginning on or after 1 January 2011, is not expected to have a material effect on the Group or the company.
214
Financial statements
Notes on the accounts
1 Net interest income
Group | ||||||||||||
| 2009 | 2008 | 2007 | ||||||||||
| £m | £m | £m | ||||||||||
| Loans and advances to customers | 28,279 | 41,812 | 28,568 | |||||||||
| Loans and advances to banks | 923 | 2,356 | 1,570 | |||||||||
| Debt securities | 4,634 | 5,354 | 2,114 | |||||||||
| Interest receivable | 33,836 | 49,522 | 32,252 | |||||||||
| Customer accounts: demand deposits | 1,899 | 4,341 | 4,327 | |||||||||
| Customer accounts: savings deposits | 2,894 | 3,911 | 2,560 | |||||||||
| Customer accounts: other time deposits | 3,187 | 8,108 | 6,301 | |||||||||
| Deposits by banks | 3,041 | 6,576 | 3,406 | |||||||||
| Debt securities in issue | 5,330 | 9,941 | 5,687 | |||||||||
| Subordinated liabilities | 1,490 | 2,144 | 1,530 | |||||||||
| Internal funding of trading business | (509 | ) | (4,174 | ) | (3,628 | ) | ||||||
| Interest payable | 17,332 | 30,847 | 20,183 | |||||||||
| Net interest income | 16,504 | 18,675 | 12,069 | |||||||||
215
Notes on the accounts continued
2 Non-interest income (excluding insurance premium income)
Group | ||||||||||||
| 2009 | 2008 | 2007 | ||||||||||
| £m | £m | £m | ||||||||||
| Fees and commissions receivable | 9,831 | 9,831 | 8,278 | |||||||||
| Fees and commissions payable | ||||||||||||
| – banking | (2,456 | ) | (1,985 | ) | (1,727 | ) | ||||||
| – insurance related | (366 | ) | (401 | ) | (466 | ) | ||||||
| (2,822 | ) | (2,386 | ) | (2,193 | ) | |||||||
| Income/(loss) from trading activities (1) | ||||||||||||
| Foreign exchange | 2,465 | 1,994 | 1,085 | |||||||||
| Interest rate | 3,875 | 1,454 | 1,414 | |||||||||
| Credit | (4,108 | ) | (12,200 | ) | (1,446 | ) | ||||||
| Equities and commodities | 1,649 | 275 | 239 | |||||||||
| 3,881 | (8,477 | ) | 1,292 | |||||||||
| Gain on redemption of own debt (2) | 3,790 | — | — | |||||||||
| Other operating income | ||||||||||||
| Operating lease and other rental income | 1,391 | 1,525 | 1,671 | |||||||||
| Changes in the fair value of own debt | 51 | 977 | 152 | |||||||||
| Changes in the fair value of securities and other financial assets and liabilities | 101 | (1,730 | ) | 970 | ||||||||
| Changes in the fair value of investment properties | (117 | ) | (86 | ) | 288 | |||||||
| Profit on sale of available-for-sale financial assets | 294 | 342 | 544 | |||||||||
| Profit on sale of property, plant and equipment | 43 | 167 | 741 | |||||||||
| (Loss)/profit on sale of subsidiaries and associates | (135 | ) | 943 | 67 | ||||||||
| Life business profits/(losses) | 156 | (52 | ) | 187 | ||||||||
| Dividend income | 86 | 281 | 137 | |||||||||
| Share of profits less losses of associates | (195 | ) | 69 | 25 | ||||||||
| Other income (3) | 287 | (537 | ) | 51 | ||||||||
| 1,962 | 1,899 | 4,833 | ||||||||||
Notes:
| (1) | The analysis of trading income is based on how the business is organised and the underlying risks managed. Trading income comprises gains and losses on financial instruments held for trading, both realised and unrealised, interest income and dividends and the related funding costs. |
| The types of instruments include: | |
| – Foreign exchange: spot foreign exchange contracts, currency swaps and options, emerging markets and related hedges and funding. | |
| – Interest rate: interest rate swaps, forward foreign exchange contracts, forward rate agreements, interest rate options, interest rate futures and related hedges and funding. | |
| – Credit: asset-backed securities, corporate bonds, credit derivatives and related hedges and funding. | |
| – Equities and commodities: equities, commodities, equity derivatives, commodity contracts and related hedges and funding. | |
| (2) | In April 2009, the Group concluded a series of exchange offers and tender offers with the holders of a number of Tier 1 and Upper Tier 2 securities. The exchanges involving instruments classified as liabilities all met the criteria in IFRS for treatment as the extinguishment of the original liability and the recognition of a new financial liability. Gains on these exchanges, and on the redemption of securities classified as liabilities for cash, totalling £3,790 million were credited to income. No amounts have been recognised in income in relation to the redemption of securities classified as equity or minority interest in the Group financial statements. The difference between the consideration and the carrying value for these securities amounting to £829 million has been recorded in equity. |
| (3) | Other income includes contributions attributable to the Group from activities other than banking and insurance. |
216
Financial statements
Notes on the accounts
3 Operating expenses
| Group | ||||||||||||
| Restated | ||||||||||||
| 2009 | 2008 | 2007 | ||||||||||
| £m | £m | £m | ||||||||||
| Wages, salaries and other staff costs | 10,142 | 8,907 | 6,230 | |||||||||
| Social security costs | 727 | 696 | 471 | |||||||||
| Share-based compensation | 129 | 169 | 65 | |||||||||
| Pension costs | ||||||||||||
| – defined benefit schemes (see Note 4) | 659 | 490 | 489 | |||||||||
| – curtailment gains (see Note 4) | (2,148 | ) | — | — | ||||||||
| – defined contribution schemes | 126 | 148 | 83 | |||||||||
| Staff costs | 9,635 | 10,410 | 7,338 | |||||||||
| Premises and equipment | 3,087 | 2,593 | 1,703 | |||||||||
| Other administrative expenses | 5,584 | 5,464 | 2,969 | |||||||||
| Property, plant and equipment (see Note 18) | 1,616 | 1,584 | 1,297 | |||||||||
| Intangible assets (see Note 17) | 1,193 | 1,570 | 635 | |||||||||
| Depreciation and amortisation | 2,809 | 3,154 | 1,932 | |||||||||
| Write-down of goodwill and other intangible assets | 363 | 32,581 | — | |||||||||
| 21,478 | 54,202 | 13,942 | ||||||||||
Integration costs included in operating expenses comprise expenditure incurred in respect of cost reduction and revenue enhancement programmes connected with acquisitions made by the Group.
| Group | ||||||||||||
| 2009 | 2008 | 2007 | ||||||||||
| £m | £m | £m | ||||||||||
| Staff costs | 365 | 503 | 18 | |||||||||
| Premises and equipment | 78 | 25 | 4 | |||||||||
| Other administrative expenses | 398 | 486 | 26 | |||||||||
| Depreciation and amortisation | 18 | 36 | 60 | |||||||||
| 859 | 1,050 | 108 | ||||||||||
Restructuring costs included in operating expenses comprise:
| 2009 | 2008 | 2007 | ||||||||||
| £m | £m | £m | ||||||||||
| Staff costs | 328 | 251 | — | |||||||||
| Premises and equipment | 48 | 15 | — | |||||||||
| Other administrative expenses | 51 | 41 | — | |||||||||
| 427 | 307 | — | ||||||||||
217
Notes on the accounts continued
3 Operating expenses continued
The average number of persons employed, rounded to the nearest hundred, in the continuing operations of the Group during the year, excluding temporary staff, was 192,000 (2008 – 197,100; 2007 – 157,200); on the same basis discontinued operations employed 2,500 employees (2008 –32,200; 2007 – 13,300). The average number of temporary employees during 2009 was 9,700 (2008 – 7,000; 2007 – 4,900). The number of persons employed in the continuing operations of the Group at 31 December, excluding temporary staff, was as follows:
| Group | ||||||||||||
| 2009 | 2008 | 2007 | ||||||||||
| UK Retail | 28,500 | 31,700 | 31,400 | |||||||||
| UK Corporate | 12,600 | 13,600 | 13,200 | |||||||||
| Wealth | 4,800 | 5,300 | 5,400 | |||||||||
| Global Banking & Markets | 13,800 | 14,500 | 15,500 | |||||||||
| Global Transaction Services | 3,200 | 3,600 | 3,700 | |||||||||
| Ulster Bank | 4,600 | 5,600 | 6,100 | |||||||||
| US Retail & Commercial | 16,400 | 17,300 | 17,400 | |||||||||
| RBS Insurance | 14,600 | 15,300 | 16,400 | |||||||||
| Centre | 3,800 | 4,300 | 3,800 | |||||||||
| Core | 102,300 | 111,200 | 112,900 | |||||||||
| Non-Core | 13,700 | 15,000 | 16,100 | |||||||||
| 116,000 | 126,200 | 129,000 | ||||||||||
| Business Services | 42,900 | 45,700 | 45,900 | |||||||||
| Integration | 500 | 900 | - | |||||||||
| RFS Holdings minority interest | 25,100 | 26,700 | 28,600 | |||||||||
| Total | 184,500 | 199,500 | 203,500 | |||||||||
| UK | 98,500 | 105,800 | 108,000 | |||||||||
| USA | 25,600 | 27,100 | 26,500 | |||||||||
| Europe | 36,800 | 40,200 | 40,500 | |||||||||
| Rest of the World | 23,600 | 26,400 | 28,500 | |||||||||
| Total | 184,500 | 199,500 | 203,500 | |||||||||
There were no persons employed in discontinued operations as at 31 December 2009 (2008 – 2,600; 2007 – 53,200).
Financial statements
218
Financial statements
Notes on the accounts
4 Pension costs
The Group sponsors a number of pension schemes in the UK and overseas, predominantly defined benefit schemes, whose assets are independent of the Group’s finances. The Group’s defined benefit schemes generally provide a pension of one-sixtieth of final pensionable salary for each year of service prior to retirement up to a maximum of 40 years. Employees do not make contributions for basic pensions but may make voluntary contributions to secure additional benefits on a money-purchase basis. Since October 2006 The Royal Bank of Scotland Group Pension Fund (‘Main scheme’) has been closed to new entrants.
The Group also provides post-retirement benefits other than pensions, principally through subscriptions to private healthcare schemes in the UK and the US and unfunded post-retirement benefit plans. Provision for the costs of these benefits is charged to the income statement over the average remaining future service lives of eligible employees. The amounts are not material.
Interim valuations of the Group’s schemes under IAS 19 ‘Employee Benefits’ were prepared to 31 December with the support of independent actuaries, using the following assumptions:
Main scheme | All schemes | |||||||||||||||||||||||
| Principal actuarial assumptions at 31 December | 2009 | 2008 | 2007 | 2009 | 2008 | 2007 | ||||||||||||||||||
| Weighted average | ||||||||||||||||||||||||
| Discount rate | 5.9 | % | 6.5 | % | 6.0 | % | 5.7 | % | 6.0 | % | 5.8 | % | ||||||||||||
| Expected return on plan assets (weighted average) | 6.2 | % | 7.1 | % | 6.9 | % | 5.9 | % | 6.3 | % | 6.8 | % | ||||||||||||
| Rate of increase in salaries | 1.8 | % | 4.0 | % | 4.5 | % | 2.0 | % | 3.4 | % | 4.0 | % | ||||||||||||
| Rate of increase in pensions in payment | 3.5 | % | 2.7 | % | 3.2 | % | 3.0 | % | 2.4 | % | 2.8 | % | ||||||||||||
| Inflation assumption | 3.5 | % | 2.7 | % | 3.2 | % | 3.0 | % | 2.4 | % | 2.9 | % | ||||||||||||
| Main scheme | All schemes | |||||||||||||||||||||||
| Major classes of plan assets as a percentage of total plan assets | 2009 | 2008 | 2007 | 2009 | 2008 | 2007 | ||||||||||||||||||
| Equity interests | 47.6 | % | 59.4 | % | 61.0 | % | 41.7 | % | 42.2 | % | 57.8 | % | ||||||||||||
| Index-linked bonds | 23.7 | % | 18.0 | % | 18.2 | % | 15.2 | % | 11.4 | % | 13.1 | % | ||||||||||||
| Government fixed interest bonds | — | 1.2 | % | 1.2 | % | 19.9 | % | 26.8 | % | 12.9 | % | |||||||||||||
| Corporate and other bonds | 19.7 | % | 18.5 | % | 15.1 | % | 14.8 | % | 14.3 | % | 12.0 | % | ||||||||||||
| Property | 3.5 | % | 3.7 | % | 3.8 | % | 3.4 | % | 3.9 | % | 3.0 | % | ||||||||||||
| Cash and other assets | 5.5 | % | (0.8 | %) | 0.7 | % | 5.0 | % | 1.4 | % | 1.2 | % | ||||||||||||
Ordinary shares of the company with a fair value of £4 million (2008 – £15 million; 2007 – £69 million) are held by the Group’s pension schemes; £4 million (2008 – £15 million; 2007 – £65 million) in the Main scheme which also holds other financial instruments issued by the Group with a value of £192 million (2008 – £421 million; 2007 – £606 million).
The expected return on plan assets at 31 December is based upon the weighted average of the following assumed returns on the major classes of plan assets:
| Main scheme | All schemes | |||||||||||||||||||||||
| 2009 | 2008 | 2007 | 2009 | 2008 | 2007 | |||||||||||||||||||
| Equities | 7.9 | % | 8.4 | % | 8.1 | % | 7.8 | % | 8.4 | % | 8.1 | % | ||||||||||||
| Index-linked bonds | 4.5 | % | 3.9 | % | 4.5 | % | 4.5 | % | 3.9 | % | 4.5 | % | ||||||||||||
| Government fixed interest bonds | — | 3.9 | % | 4.5 | % | 4.0 | % | 4.3 | % | 4.7 | % | |||||||||||||
| Corporate and other bonds | 5.9 | % | 6.1 | % | 5.5 | % | 5.7 | % | 5.7 | % | 5.5 | % | ||||||||||||
| Property | 6.2 | % | 6.1 | % | 6.3 | % | 6.0 | % | 6.1 | % | 6.3 | % | ||||||||||||
| Cash and other assets | 0.5 | % | 2.5 | % | 4.6 | % | 1.4 | % | 5.1 | % | 4.5 | % | ||||||||||||
| Post-retirement mortality assumptions (Main scheme) | 2009 | 2008 | 2007 | |||||||||
| Longevity at age 60 for current pensioners (years): | ||||||||||||
| Males | 27.1 | 26.1 | 26.0 | |||||||||
| Females | 29.5 | 26.9 | 26.8 | |||||||||
| Longevity at age 60 for future pensioners (years): | ||||||||||||
| Males | 29.2 | 28.1 | 28.1 | |||||||||
| Females | 30.8 | 28.2 | 28.2 | |||||||||
The allowance for post-retirement mortality has been updated following an analysis of recent experience of pensioners in the Main scheme.
219
Notes on the accounts continued
4 Pension costs continued
| Main scheme | All schemes | |||||||||||||||||||||||||
| Present | Present | |||||||||||||||||||||||||
| value of | Net | value of | Net | |||||||||||||||||||||||
| Fair value | defined | pension | Fair value | defined | pension | |||||||||||||||||||||
| of plan | benefit | deficit/ | of plan | benefit | deficit/ | |||||||||||||||||||||
| assets | obligations | (surplus) | assets | obligations | (surplus) | |||||||||||||||||||||
| Changes in value of net pension deficit/(surplus) | £m | £m | £m | £m | £m | £m | ||||||||||||||||||||
| At 1 January 2008 | 18,575 | 18,099 | (476 | ) | 27,662 | 27,547 | (115 | ) | ||||||||||||||||||
| Transfers to disposal groups | — | — | — | (1 | ) | (49 | ) | (48 | ) | |||||||||||||||||
| Currency translation and other adjustments | — | — | — | 2,497 | 2,692 | 195 | ||||||||||||||||||||
| Income statement: | ||||||||||||||||||||||||||
| Expected return | 1,271 | (1,271 | ) | 1,865 | (1,865 | ) | ||||||||||||||||||||
| Interest cost | 1,080 | 1,080 | 1,622 | 1,622 | ||||||||||||||||||||||
| Current service cost | 437 | 437 | 705 | 705 | ||||||||||||||||||||||
| Past service cost | 21 | 21 | 28 | 28 | ||||||||||||||||||||||
| 1,271 | 1,538 | 267 | 1,865 | 2,355 | 490 | |||||||||||||||||||||
| Statement of comprehensive income: | ||||||||||||||||||||||||||
| Actuarial gains and losses | (4,784 | ) | (3,389 | ) | 1,395 | (6,051 | ) | (3,764 | ) | 2,287 | ||||||||||||||||
| Disposal of subsidiaries | — | — | — | (31 | ) | (34 | ) | (3 | ) | |||||||||||||||||
| Contributions by employer | 396 | — | (396 | ) | 810 | — | (810 | ) | ||||||||||||||||||
| Contributions by plan participants | — | — | — | 9 | 9 | — | ||||||||||||||||||||
| Benefits paid | (630 | ) | (630 | ) | — | (978 | ) | (978 | ) | — | ||||||||||||||||
| Expenses included in service cost | (24 | ) | (24 | ) | — | (26 | ) | (26 | ) | — | ||||||||||||||||
| At 1 January 2009 | 14,804 | 15,594 | 790 | 25,756 | 27,752 | 1,996 | ||||||||||||||||||||
| Currency translation and other adjustments | — | — | — | (699 | ) | (813 | ) | (114 | ) | |||||||||||||||||
| Income statement | ||||||||||||||||||||||||||
| Expected return | 1,029 | (1,029 | ) | 1,553 | (1,553 | ) | ||||||||||||||||||||
| Interest cost | 999 | 999 | 1,614 | 1,614 | ||||||||||||||||||||||
| Current service cost | 300 | 300 | 583 | 583 | ||||||||||||||||||||||
| Past service cost | 15 | 15 | 15 | 15 | ||||||||||||||||||||||
| Gains on curtailments | (1,947 | ) | (1,947 | ) | (2,148 | ) | (2,148 | ) | ||||||||||||||||||
| 1,029 | (633 | ) | (1,662 | ) | 1,553 | 64 | (1,489 | ) | ||||||||||||||||||
| �� | Statement of comprehensive income | |||||||||||||||||||||||||
| Actuarial gains and losses | 993 | 4,473 | 3,480 | 1,344 | 5,009 | 3,665 | ||||||||||||||||||||
| Contributions by employer | 536 | — | (536 | ) | 1,153 | — | (1,153 | ) | ||||||||||||||||||
| Contributions by plan participants and other scheme members | 2 | 2 | — | 15 | 15 | — | ||||||||||||||||||||
| Benefits paid | (741 | ) | (741 | ) | — | (1,175 | ) | (1,175 | ) | — | ||||||||||||||||
| Expenses included in service cost | (20 | ) | (20 | ) | — | (22 | ) | (22 | ) | — | ||||||||||||||||
| At 31 December 2009 | 16,603 | 18,675 | 2,072 | 27,925 | 30,830 | 2,905 | ||||||||||||||||||||
| 2009 | 2008 | 2007 | ||||||||||
| Net pension deficit comprises: | £m | £m | £m | |||||||||
| Net assets of schemes in surplus (included in Prepayments, accrued income and other assets, Note 19) | (58 | ) | (36 | ) | (575 | ) | ||||||
| Net liabilities of schemes in deficit | 2,963 | 2,032 | 460 | |||||||||
| 2,905 | 1,996 | (115 | ) | |||||||||
220
Financial statements
Notes on the accounts
Curtailment gains of £2,148 million have been recognised in 2009 arising from changes to pension benefits in the Main scheme and certain other subsidiaries schemes due to the capping of future salary increases that will count for pension purposes to the lower of 2% or the rate of inflation in any year.
At 31 December 2009, ABN AMRO’s principal pension scheme in the Netherlands had fair value of plan assets of £8,118 million (2008 –£8,181 million; 2007 – £6,417 million) and present value of defined benefit obligations of £8,298 million (2008 – £8,589 million; 2007 –£6,189 million). The principal actuarial assumptions at 31 December 2009 were: discount rate 5.25% (2008 – 5.4%); expected return on plan assets (weighted average) 5.25% (2008 – 4.7%); rate of increase in salaries 2.5% (2008 – 2.5%); rate of increase in pensions in payment 2.0% (2008 – 2.0%); and inflation assumption 2.0% (2008 – 2.0%).
The Group expects to contribute £746 million to its defined benefit pension schemes in 2010 (Main scheme – £414 million). Of the net liabilities of schemes in deficit, £198 million (2008 – £201 million; 2007 –£212 million) relates to unfunded schemes.
The most recent funding valuation of the main UK scheme, as at 31 March 2007, showed a surplus of assets over liabilities of £0.7 billion. The next valuation is due as at 31 March 2010 and the Group expects this valuation to show that liabilities exceed the value of the assets. Following this valuation, the Group and scheme Trustees will agree the level of contributions to be paid to the scheme. This could result in the amount of contributions payable in 2010 and subsequent years being materially different from the current rates based on the previous valuation.
Cumulative net actuarial losses of £4,382 million (2008 – £717 million losses; 2007 – £1,570 million gains) have been recognised in the statement of comprehensive income, of which £3,296 million losses (2008 – £184 million gains; 2007 – £1,579 million gains) relate to the Main scheme.
| Main scheme | All schemes | |||||||||||||||||||||||||||||||||||||||
| 2009 | 2008 | 2007 | 2006 | 2005 | 2009 | 2008 | 2007 | 2006 | 2005 | |||||||||||||||||||||||||||||||
| History of defined benefit schemes | £m | £m | £m | £m | £m | £m | £m | £m | £m | £m | ||||||||||||||||||||||||||||||
Fair value of plan assets | 16,603 | 14,804 | 18,575 | 17,374 | 15,914 | 27,925 | 25,756 | 27,662 | 18,959 | 17,388 | ||||||||||||||||||||||||||||||
Present value of defined | ||||||||||||||||||||||||||||||||||||||||
benefit obligations | 18,675 | 15,594 | 18,099 | 19,004 | 19,118 | 30,830 | 27,752 | 27,547 | 20,951 | 21,123 | ||||||||||||||||||||||||||||||
Net (deficit)/surplus | (2,072 | ) | (790 | ) | 476 | (1,630 | ) | (3,204 | ) | (2,905 | ) | (1,996 | ) | 115 | (1,992 | ) | (3,735 | ) | ||||||||||||||||||||||
Experience gains/(losses) | ||||||||||||||||||||||||||||||||||||||||
on plan liabilities | 135 | (55 | ) | (256 | ) | (4 | ) | (41 | ) | 328 | (65 | ) | (210 | ) | (19 | ) | (68 | ) | ||||||||||||||||||||||
Experience gains/(losses) | �� | |||||||||||||||||||||||||||||||||||||||
on plan assets | 993 | (4,784 | ) | 163 | 552 | 1,556 | 1,344 | (6,051 | ) | 19 | 587 | 1,661 | ||||||||||||||||||||||||||||
Actual return/(loss) on | ||||||||||||||||||||||||||||||||||||||||
pension schemes assets | 2,022 | (3,513 | ) | 1,345 | 1,574 | 2,486 | 2,897 | (4,186 | ) | 1,413 | 1,660 | 2,677 | ||||||||||||||||||||||||||||
Actual return/(loss) on | ||||||||||||||||||||||||||||||||||||||||
pension schemes assets – % | 13.8% | (19.0% | ) | 7.8% | 9.9% | 18.4% | 11.4% | (14.5% | ) | 6.9% | 9.6% | 18.1% | ||||||||||||||||||||||||||||
The table below sets out the sensitivities of the pension cost for the year and the present value of defined benefit obligations at the balance sheet dates to a change in the principal actuarial assumptions:
| Main scheme | All schemes | |||||||||||||||||||||||||||||||
| Increase/(decrease) | Increase/(decrease) | |||||||||||||||||||||||||||||||
| in pension | in obligation | in pension | in obligation | |||||||||||||||||||||||||||||
| cost for the year | at 31 December | cost for the year | at 31 December | |||||||||||||||||||||||||||||
| 2009 | 2008 | 2009 | 2008 | 2009 | 2008 | 2009 | 2008 | |||||||||||||||||||||||||
| £m | £m | £m | £m | £m | £m | £m | £m | |||||||||||||||||||||||||
0.25% increase in the discount rate | (21 | ) | (37 | ) | (790 | ) | (696 | ) | (41 | ) | (53 | ) | (1,261 | ) | (1,161 | ) | ||||||||||||||||
0.25% increase in inflation | 49 | 77 | 654 | 624 | 93 | 114 | 1,143 | 1,089 | ||||||||||||||||||||||||
0.25% additional rate of increase in pensions in payment | 33 | 41 | 442 | 383 | 47 | 63 | 596 | 695 | ||||||||||||||||||||||||
0.25% additional rate of increase in deferred pensions | 16 | 8 | 214 | 94 | 25 | 15 | 366 | 227 | ||||||||||||||||||||||||
0.25% additional rate of increase in salaries | 8 | 28 | 66 | 168 | 17 | 35 | 125 | 219 | ||||||||||||||||||||||||
Longevity increase of 1 year | 29 | 31 | 416 | 302 | 50 | 50 | 734 | 700 | ||||||||||||||||||||||||
221
Notes on the accounts continued
Amounts paid to the company’s auditors for statutory audit and other services were as follows:
| Group | ||||||||
| 2009 | 2008 | |||||||
| £m | £m | |||||||
| Audit Services | ||||||||
– Statutory audit (1) | 41.3 | 44.1 | ||||||
| – Audit related including regulatory reporting | 3.3 | 3.1 | ||||||
| 44.6 | 47.2 | |||||||
| Tax Services | ||||||||
| – Compliance services | 1.1 | 0.3 | ||||||
| – Advisory services | 0.3 | 0.3 | ||||||
| 1.4 | 0.6 | |||||||
| All other services | 7.5 | 10.9 | ||||||
| Total | 53.5 | 58.7 | ||||||
Note:
| (1) | Includes fees of £21.9 million (2008 – £23.1 million) in respect of the audit of ABN AMRO Holding N.V. of which £8.8 million (2008 – £10.5 million) relates to the interests of the State of the Netherlands and Santander. |
222
6 Tax | Group | |||||||||||
| 2009 | 2008 | 2007 | ||||||||||
| £m | £m | £m | ||||||||||
Current taxation: | ||||||||||||
Charge for the year | 552 | 1,230 | 2,514 | |||||||||
Over provision in respect of prior periods | (191 | ) | (254 | ) | (39 | ) | ||||||
Relief for overseas taxation | — | (34 | ) | (198 | ) | |||||||
| 361 | 942 | 2,277 | ||||||||||
Deferred taxation: | ||||||||||||
(Credit)/charge for the year | (1,041 | ) | (3,167 | ) | 95 | |||||||
Over/(under) provision in respect of prior periods | 309 | (98 | ) | (328 | ) | |||||||
Tax (credit)/charge for the year | (371 | ) | (2,323 | ) | 2,044 | |||||||
The actual tax (credit)/charge differs from the expected tax (credit)/charge computed by applying the standard rate of UK corporation tax of 28% (2008 – 28.5%; 2007 – 30%) as follows:
| 2009 | 2008 | 2007 | ||||||||||
| £m | £m | £m | ||||||||||
Expected tax (credit)/charge | (727 | ) | (11,638 | ) | 2,950 | |||||||
Non-deductible goodwill impairment | 102 | 8,292 | 12 | |||||||||
Unrecognised timing differences | (274 | ) | 274 | 29 | ||||||||
Other non-deductible items | 508 | 378 | 222 | |||||||||
Non-taxable items | ||||||||||||
– gain on redemption of own debt | (693 | ) | — | — | ||||||||
– other | (410 | ) | (491 | ) | (595 | ) | ||||||
Taxable foreign exchange movements | (1 | ) | 80 | 16 | ||||||||
Foreign profits taxed at other rates | 320 | 203 | (25 | ) | ||||||||
Reduction in deferred tax liability following change in the rate of UK corporation tax | — | — | (189 | ) | ||||||||
Losses in year not recognised | 780 | 942 | 2 | |||||||||
Losses brought forward and utilised | (94 | ) | (11 | ) | (11 | ) | ||||||
Adjustments in respect of prior periods (1) | 118 | (352 | ) | (367 | ) | |||||||
Actual tax (credit)/charge | (371 | ) | (2,323 | ) | 2,044 | |||||||
Note:
| (1) | The 2008 and 2007 prior period tax adjustments principally comprise releases of tax provisions in respect of structured transactions and investment disposals, and adjustments to reflect submitted tax computations in the UK and overseas. |
The effective tax rate for the year was 14.3% (2008 – 5.7%; 2007 – 20.8%).
7 Profit attributable to preference shareholders and paid-in equity holders |
| Group | ||||||||||||
| 2009 | 2008 | 2007 | ||||||||||
| £m | £m | £m | ||||||||||
Preference shareholders: | ||||||||||||
Non-cumulative preference shares of US$0.01 | 342 | 293 | 152 | |||||||||
Non-cumulative preference shares of €0.01 | 201 | 183 | 94 | |||||||||
Non-cumulative preference shares of £1 | ||||||||||||
– Issued to UK Financial Investments Limited (1) | 274 | — | — | |||||||||
– Other | 61 | 60 | — | |||||||||
Paid-in equity holders: | ||||||||||||
Interest on securities classified as equity, net of tax | 57 | 60 | — | |||||||||
Total | 935 | 596 | 246 | |||||||||
Notes:
| (1) | Includes £50 million redemption premium on repayment of preference shares. |
| (2) | In accordance with IAS 32, certain preference share issued by the company are included in subordinated liabilities and the related finance cost in interest payable. |
| (3) | Between 1 January 2010 and the date of approval of these accounts, dividends amounting to US$163 million have been declared in respect of equity preference shares for payment on 31 March 2010. |
223
Notes on the accounts continued
8 Ordinary dividends
Prior year ordinary dividends per share in the table below were restated for the effect of the rights issue in June 2008 and the capitalisation issue in September 2008.
| Group | ||||||||||||||||||||||||
| 2009 | 2008 | 2007 | 2009 | 2008 | 2007 | |||||||||||||||||||
| p per share | p per share | p per share | £m | £m | £m | |||||||||||||||||||
Final dividend for previous year declared during the current year | — | 19.3 | 18.5 | — | 2,312 | 2,091 | ||||||||||||||||||
Interim dividend | — | — | 8.5 | — | — | 953 | ||||||||||||||||||
Total dividends paid on ordinary equity shares | — | 19.3 | 27.0 | — | 2,312 | 3,044 | ||||||||||||||||||
9 Profit dealt with in the accounts of the company
As permitted by section 408(3) of the Companies Act 2006, the primary financial statements of the company do not include an income statement or statement of comprehensive income. Condensed information is set out below:
| Company | ||||||||||||
| 2009 | 2008 | 2007 | ||||||||||
| Income statement | £m | £m | £m | |||||||||
Dividends received from banking subsidiary | 2,523 | 4,639 | 2,330 | |||||||||
Dividends received from other subsidiaries | 408 | 163 | 415 | |||||||||
Gain on redemption of own debt | 238 | — | — | |||||||||
Total income | 3,169 | 4,802 | 2,745 | |||||||||
Interest receivable from subsidiaries | 997 | 793 | 460 | |||||||||
Interest payable to subsidiaries | (251 | ) | (495 | ) | (307 | ) | ||||||
Other net interest payable and operating expenses | (62 | ) | (796 | ) | (526 | ) | ||||||
Write-down of investments in subsidiaries | (5,139 | ) | (14,321 | ) | — | |||||||
Operating (loss)/profit before tax | (1,286 | ) | (10,017 | ) | 2,372 | |||||||
Tax | (217 | ) | 415 | 127 | ||||||||
(Loss)/profit for the year | (1,503 | ) | (9,602 | ) | 2,499 | |||||||
(Loss)/profit attributable to: | ||||||||||||
Preference shareholders | 878 | 536 | 246 | |||||||||
Paid-in equity holders | 57 | 60 | — | |||||||||
Ordinary and B shareholders | (2,438 | ) | (10,198 | ) | 2,253 | |||||||
| (1,503 | ) | (9,602 | ) | 2,499 | ||||||||
| Company | ||||||||||||
| 2009 | 2008 | 2007 | ||||||||||
| Statement of comprehensive income | £m | £m | £m | |||||||||
(Loss)/profit for the year | (1,503 | ) | (9,602 | ) | 2,499 | |||||||
Other comprehensive income: | ||||||||||||
Cash flow hedges | 3 | 2 | 3 | |||||||||
Tax on comprehensive income | — | (1 | ) | (1 | ) | |||||||
Other comprehensive income for the year, net of tax | 3 | 1 | 2 | |||||||||
Total comprehensive income for the year | (1,500 | ) | (9,601 | ) | 2,501 | |||||||
Attributable to: | ||||||||||||
Preference shareholders | 878 | 536 | 246 | |||||||||
Paid-in equity holders | 57 | 60 | — | |||||||||
Ordinary and B shareholders | (2,435 | ) | (10,197 | ) | 2,255 | |||||||
Total comprehensive income for the year | (1,500 | ) | (9,601 | ) | 2,501 | |||||||
224
Financial statements
Notes on the accounts
10 Earnings per ordinary and B share | |||||
Earnings per ordinary and B share have been calculated based on the following: | |||||
| Group | ||||||||||||
| 2009 | 2008 | 2007 | ||||||||||
| £m | £m | £m | ||||||||||
Earnings: | ||||||||||||
(Loss)/earnings attributable to ordinary and B shareholders | (3,607 | ) | (24,306 | ) | 7,303 | |||||||
Add back loss from discontinued operations attributable to ordinary and B shareholders | 72 | 86 | — | |||||||||
Gain on redemption of paid-in equity | 200 | — | — | |||||||||
(Loss)/earnings from continuing operations attributable to ordinary and B shareholders | (3,335 | ) | (24,220 | ) | 7,303 | |||||||
Add back finance cost on dilutive convertible securities | — | — | 60 | |||||||||
Diluted (loss)/earnings from continuing operations attributable to ordinary and B shareholders | (3,335 | ) | (24,220 | ) | 7,363 | |||||||
Weighted average number of shares (millions): | ||||||||||||
Ordinary shares in issue during the year | 51,494 | 16,563 | 11,413 | |||||||||
B shares in issue during the year | 1,397 | — | — | |||||||||
Weighted average number of ordinary and B shares in issue during the year | 52,891 | 16,563 | 11,413 | |||||||||
Effect of dilutive share options and convertible securities | 438 | — | 198 | |||||||||
Diluted weighted average number of ordinary and B shares in issue during the year | 53,329 | 16,563 | 11,611 | |||||||||
The numbers of shares in issue in prior years were adjusted retrospectively for the bonus element of the rights issue completed in June 2008 and the capitalisation issue in September 2008. The contingent agreement with HM Treasury enabling it to place up to 16 billion new B shares at 50p each had a dilutive effect in 2009. None of the convertible securities had a dilutive effect in 2009 or 2008. All convertible securities had a dilutive effect in 2007 and have been included in the computation of diluted earnings per share.
225
Notes on the accounts continued
11 Financial instruments
Classification
The following tables analyse the Group’s financial assets and financial liabilities in accordance with the categories of financial instruments in IAS 39.
Assets and liabilities outside the scope of IAS 39 are shown separately.
| Group | ||||||||||||||||||||||||||||||||||||
| Designated | Other | |||||||||||||||||||||||||||||||||||
| as at fair | financial | Non | ||||||||||||||||||||||||||||||||||
| value | instruments | financial | ||||||||||||||||||||||||||||||||||
Held-for- | through | Hedging | Available- | Loans and | (amortised | Finance | assets/ | |||||||||||||||||||||||||||||
| trading | profit or loss | derivatives | for-sale | receivables | cost) | leases | liabilities | Total | ||||||||||||||||||||||||||||
| 2009 | £m | £m | £m | £m | £m | £m | £m | £m | £m | |||||||||||||||||||||||||||
Assets | ||||||||||||||||||||||||||||||||||||
Cash and balances at central banks | — | — | — | 52,261 | 52,261 | |||||||||||||||||||||||||||||||
Loans and advances to banks (1) | 45,449 | — | — | 46,304 | 91,753 | |||||||||||||||||||||||||||||||
Loans and advances to customers (2,3) | 42,277 | 1,981 | — | 671,037 | 13,098 | 728,393 | ||||||||||||||||||||||||||||||
Debt securities (4) | 111,482 | 2,603 | 143,298 | 9,871 | 267,254 | |||||||||||||||||||||||||||||||
Equity shares | 14,443 | 2,192 | 2,893 | — | 19,528 | |||||||||||||||||||||||||||||||
Settlement balances | — | — | — | 12,033 | 12,033 | |||||||||||||||||||||||||||||||
Derivatives | 436,857 | 4,597 | 441,454 | |||||||||||||||||||||||||||||||||
Intangible assets | 17,847 | 17,847 | ||||||||||||||||||||||||||||||||||
Property, plant and equipment | 19,397 | 19,397 | ||||||||||||||||||||||||||||||||||
Deferred taxation | 7,039 | 7,039 | ||||||||||||||||||||||||||||||||||
Prepayments, accrued income and other assets | — | — | — | 1,421 | 19,564 | 20,985 | ||||||||||||||||||||||||||||||
Assets of disposal groups | 18,542 | 18,542 | ||||||||||||||||||||||||||||||||||
| 650,508 | 6,776 | 4,597 | 146,191 | 792,927 | 13,098 | 82,389 | 1,696,486 | |||||||||||||||||||||||||||||
Liabilities | ||||||||||||||||||||||||||||||||||||
Deposits by banks (5) | 53,609 | — | 88,535 | 142,144 | ||||||||||||||||||||||||||||||||
Customer accounts (6, 7) | 52,868 | 8,580 | 552,754 | 614,202 | ||||||||||||||||||||||||||||||||
Debt securities in issue (8, 9) | 3,925 | 41,537 | 222,106 | 267,568 | ||||||||||||||||||||||||||||||||
Settlement balances | ||||||||||||||||||||||||||||||||||||
and short positions | 40,463 | — | 10,413 | 50,876 | ||||||||||||||||||||||||||||||||
Derivatives | 417,634 | 6,507 | 424,141 | |||||||||||||||||||||||||||||||||
Accruals, deferred income | ||||||||||||||||||||||||||||||||||||
and other liabilities | — | — | 1,889 | 467 | 27,971 | 30,327 | ||||||||||||||||||||||||||||||
Retirement benefit liabilities | 2,963 | 2,963 | ||||||||||||||||||||||||||||||||||
Deferred taxation | 2,811 | 2,811 | ||||||||||||||||||||||||||||||||||
Insurance liabilities | 10,281 | 10,281 | ||||||||||||||||||||||||||||||||||
Subordinated liabilities | — | 1,277 | 36,375 | 37,652 | ||||||||||||||||||||||||||||||||
Liabilities of disposal groups | 18,890 | 18,890 | ||||||||||||||||||||||||||||||||||
| 568,499 | 51,394 | 6,507 | — | — | 912,072 | 467 | 62,916 | 1,601,855 | ||||||||||||||||||||||||||||
Equity | 94,631 | |||||||||||||||||||||||||||||||||||
| 1,696,486 | ||||||||||||||||||||||||||||||||||||
| For notes relating to this table refer to page 228. | ||||||||||||||||||||||||||||||||||||
226
Financial statements
Notes on the accounts
| Group | ||||||||||||||||||||||||||||
| Designated | Other | |||||||||||||||||||||||||||
| as at fair | financial | Non | ||||||||||||||||||||||||||
| value | instruments | financial | ||||||||||||||||||||||||||
| Held-for- | through | Hedging | Available- | Loans and | (amortised | Finance | assets/ | |||||||||||||||||||||
| trading | profit or loss | derivatives | for-sale | receivables | cost) | leases | liabilities | Total | ||||||||||||||||||||
| 2008 | £m | £m | £m | £m | £m | £m | £m | £m | £m | |||||||||||||||||||
| Assets | ||||||||||||||||||||||||||||
| Cash and balances at central banks | — | — | — | 12,400 | 12,400 | |||||||||||||||||||||||
Loans and advances to banks (1) | 56,234 | — | — | 81,963 | 138,197 | |||||||||||||||||||||||
Loans and advances to customers (2, 3) | 51,501 | 2,141 | — | 806,627 | 14,453 | 874,722 | ||||||||||||||||||||||
Debt securities (4) | 116,280 | 5,428 | 132,856 | 12,985 | 267,549 | |||||||||||||||||||||||
| Equity shares | 17,054 | 2,101 | 7,175 | — | 26,330 | |||||||||||||||||||||||
| Settlement balances | — | — | — | 17,832 | 17,832 | |||||||||||||||||||||||
| Derivatives | 985,700 | 6,859 | 992,559 | |||||||||||||||||||||||||
| Intangible assets | 20,049 | 20,049 | ||||||||||||||||||||||||||
| Property, plant and equipment | 18,949 | 18,949 | ||||||||||||||||||||||||||
| Deferred taxation | 7,082 | 7,082 | ||||||||||||||||||||||||||
| Prepayments, accrued income | ||||||||||||||||||||||||||||
| and other assets | — | — | — | 1,326 | 23,076 | 24,402 | ||||||||||||||||||||||
| Assets of disposal groups | 1,581 | 1,581 | ||||||||||||||||||||||||||
| 1,226,769 | 9,670 | 6,859 | 140,031 | 933,133 | 14,453 | 70,737 | 2,401,652 | |||||||||||||||||||||
| Liabilities | ||||||||||||||||||||||||||||
Deposits by banks (5) | 81,154 | — | 176,890 | 258,044 | ||||||||||||||||||||||||
Customer accounts (6, 7) | 55,926 | 8,054 | 575,532 | 639,512 | ||||||||||||||||||||||||
Debt securities in issue (8, 9) | 3,992 | 47,451 | 248,846 | 300,289 | ||||||||||||||||||||||||
| Settlement balances | ||||||||||||||||||||||||||||
| and short positions | 42,536 | — | 11,741 | 54,277 | ||||||||||||||||||||||||
| Derivatives | 963,088 | 8,276 | 971,364 | |||||||||||||||||||||||||
Accruals, deferred income and | ||||||||||||||||||||||||||||
| other liabilities | 260 | — | 1,619 | 22 | 29,581 | 31,482 | ||||||||||||||||||||||
| Retirement benefit liabilities | 2,032 | 2,032 | ||||||||||||||||||||||||||
| Deferred taxation | 4,165 | 4,165 | ||||||||||||||||||||||||||
| Insurance liabilities | 9,976 | 9,976 | ||||||||||||||||||||||||||
| Subordinated liabilities | — | 1,509 | 47,645 | 49,154 | ||||||||||||||||||||||||
| Liabilities of disposal groups | 859 | 859 | ||||||||||||||||||||||||||
| 1,146,956 | 57,014 | 8,276 | 1,062,273 | 22 | 46,613 | 2,321,154 | ||||||||||||||||||||||
| Equity | 80,498 | |||||||||||||||||||||||||||
| 2,401,652 | ||||||||||||||||||||||||||||
| For notes relating to this table refer to page 228. |
227
Notes on the accounts continued
11 Financial instruments continued |
| Group | |||||||||||||||||||||||||||||
Held-for- trading | Designated as at fair value through profit or loss | Hedging derivatives | Available- for-sale | Loans and receivables | Other financial instruments (amortised cost) | Finance leases | Non financial assets/ liabilities | Total | |||||||||||||||||||||
| 2007 | £m | £m | £m | £m | £m | £m | £m | £m | £m | ||||||||||||||||||||
| Assets | |||||||||||||||||||||||||||||
| Cash and balances at central banks | — | — | — | 17,866 | 17,866 | ||||||||||||||||||||||||
Loans and advances to banks (1) | 71,639 | — | — | 147,821 | 219,460 | ||||||||||||||||||||||||
Loans and advances to customers (2, 3) | 103,811 | 3,067 | — | 709,090 | 12,570 | 828,538 | |||||||||||||||||||||||
Debt securities (4) | 190,671 | 5,777 | 95,536 | 2,672 | 294,656 | ||||||||||||||||||||||||
| Equity shares | 37,546 | 7,866 | 7,614 | — | 53,026 | ||||||||||||||||||||||||
| Settlement balances | — | — | — | 16,589 | 16,589 | ||||||||||||||||||||||||
| Derivatives | 274,849 | 2,553 | 277,402 | ||||||||||||||||||||||||||
| Intangible assets | 49,916 | 49,916 | |||||||||||||||||||||||||||
| Property, plant and equipment | 18,745 | 18,745 | |||||||||||||||||||||||||||
| Deferred taxation | 3,119 | 3,119 | |||||||||||||||||||||||||||
| Prepayments, accrued income | |||||||||||||||||||||||||||||
| and other assets | — | — | — | 877 | 14,785 | 15,662 | |||||||||||||||||||||||
| Assets of disposal groups | 45,850 | 45,850 | |||||||||||||||||||||||||||
| 678,516 | 16,710 | 2,553 | 103,150 | 894,915 | 12,570 | 132,415 | 1,840,829 | ||||||||||||||||||||||
| Liabilities | |||||||||||||||||||||||||||||
Deposits by banks (5) | 65,491 | — | 246,803 | 312,294 | |||||||||||||||||||||||||
Customer accounts (6, 7) | 60,426 | 7,505 | 614,432 | 682,363 | |||||||||||||||||||||||||
Debt securities in issue (8, 9) | 9,455 | 41,834 | 222,883 | 274,172 | |||||||||||||||||||||||||
| Settlement balances | |||||||||||||||||||||||||||||
| and short positions | 73,501 | — | 17,520 | 91,021 | |||||||||||||||||||||||||
| Derivatives | 269,343 | 2,709 | 272,052 | ||||||||||||||||||||||||||
| Accruals, deferred income | |||||||||||||||||||||||||||||
| and other liabilities | 209 | — | 1,545 | 19 | 32,435 | 34,208 | |||||||||||||||||||||||
| Retirement benefit liabilities | 460 | 460 | |||||||||||||||||||||||||||
| Deferred taxation | 5,400 | 5,400 | |||||||||||||||||||||||||||
| Insurance liabilities | 10,162 | 10,162 | |||||||||||||||||||||||||||
| Subordinated liabilities | — | 897 | 37,146 | 38,043 | |||||||||||||||||||||||||
| Liabilities of disposal groups | 29,228 | 29,228 | |||||||||||||||||||||||||||
| 478,425 | 50,236 | 2,709 | 1,140,329 | 19 | 77,685 | 1,749,403 | |||||||||||||||||||||||
| Equity | 91,426 | ||||||||||||||||||||||||||||
| 1,840,829 | |||||||||||||||||||||||||||||
Notes:
| (1) | Includes reverse repurchase agreements of £35,097 million (2008 – £58,771 million; 2007 – £175,941 million) and items in the course of collection from other banks of £2,533 million (2008 – £2,888 million; 2007 – £3,095 million). |
| (2) | Includes reverse repurchase agreements of £41,040 million (2008 – £39,313 million; 2007 – £142,357 million). |
| (3) | The change in fair value of loans and advances to customers designated as at fair value through profit and loss attributable to changes in credit risk was £157 million income for the year and cumulatively a credit of £140 million (2008 – charge £328 million; cumulative £440 million credit; 2007 – not material). |
| (4) | Includes treasury bills and similar securities of £45,617 million (2008 – £31,509 million; 2007 – £16,315 million) and other eligible bills of £34,794 million (2008 – £25,028 million; 2007 – £1,914 million). |
| (5) | Includes repurchase agreements of £38,006 million (2008 – £83,666 million; 2007 – £163,038 million) and items in the course of transmission to other banks of £770 million (2008 – £542 million; 2007 – £372 million). |
| (6) | Includes repurchase agreements of £68,353 million (2008 – £58,143 million; 2007 – £134,916 million). |
| (7) | The carrying amount of other customer accounts designated as at fair value through profit or loss is £101 million higher (2008 – £47 million lower; 2007 – £77 million higher) than the principal amount. No amounts have been recognised in profit or loss for changes in credit risk associated with these liabilities as the changes are immaterial measured as the change in fair value from movements in the period in the credit risk premium payable. The amounts include investment contracts with a carrying value of £5,170 million (2008 – £5,364 million; 2007 – £5,555 million). |
| (8) | Comprises bonds and medium term notes of £164,900 million (2008 – £156,841 million; 2007 – £119,578 million) and certificates of deposit and other commercial paper of £102,668 million (2008 – £143,448 million; 2007 – £154,594 million). |
| (9) | £155 million (2008 – £1,054 million; 2007 – £162 million) has been recognised in profit or loss for changes in credit risk associated with debt securities in issue designated as at fair value through profit or loss measured as the change in fair value from movements in the period in the credit risk premium payable by the Group. The carrying amount is £810 million (2008 – £1,145 million; 2007– £317 million) lower than the principal amount. |
| (10) | During 2009 and 2008 the Group reclassified financial assets from the held-for-trading and available-for-sale categories into the loans and receivables category and during 2008 from the held-for-trading category into the available-for-sale category (see pages 231 to 233). |
228
Financial statements
Notes on the accounts
The following tables analyse the company’s financial assets and financial liabilities in accordance with the categories of financial instruments in IAS 39. Assets and liabilities outside the scope of IAS 39 are shown separately as non financial assets/liabilities.
| Company | ||||||||||||||||||||||||
| Other financial | Non | |||||||||||||||||||||||
| instruments | financial | |||||||||||||||||||||||
Held-for- | Hedging | Loans and | (amortised | assets/ | ||||||||||||||||||||
| trading | derivatives | receivables | cost) | liabilities | Total | |||||||||||||||||||
| 2009 | £m | £m | £m | £m | £m | £m | ||||||||||||||||||
| Assets | ||||||||||||||||||||||||
Loans and advances to banks (1) | — | 31,238 | 31,238 | |||||||||||||||||||||
Loans and advances to customers (3) | — | 2,777 | 2,777 | |||||||||||||||||||||
Debt securities (3) | — | 1,286 | 1,286 | |||||||||||||||||||||
Investments in Group undertakings | 64,766 | 64,766 | ||||||||||||||||||||||
Settlement balances | 11 | 11 | ||||||||||||||||||||||
Derivatives (3) | 930 | 239 | 1,169 | |||||||||||||||||||||
Deferred taxation | 2 | 2 | ||||||||||||||||||||||
Prepayments, accrued income and other assets | — | — | 43 | 43 | ||||||||||||||||||||
| 930 | 239 | 35,301 | 64,822 | 101,292 | ||||||||||||||||||||
Liabilities | ||||||||||||||||||||||||
Deposits by banks (4) | — | 93 | 93 | |||||||||||||||||||||
Customer accounts (2) | — | 13,264 | 13,264 | |||||||||||||||||||||
Debt securities in issue | — | 11,788 | 11,788 | |||||||||||||||||||||
Derivatives (2) | 432 | 14 | 446 | |||||||||||||||||||||
Accruals, deferred income and other liabilities | — | — | 1,357 | 1,357 | ||||||||||||||||||||
Subordinated liabilities | — | 8,762 | 8,762 | |||||||||||||||||||||
| 432 | 14 | 33,907 | 1,357 | 35,710 | ||||||||||||||||||||
Equity | 65,582 | |||||||||||||||||||||||
| 101,292 | ||||||||||||||||||||||||
| 2008 | ||||||||||||||||||||||||
Assets | ||||||||||||||||||||||||
Loans and advances to banks (1) | — | 27,031 | 27,031 | |||||||||||||||||||||
Investments in Group undertakings | 42,196 | 42,196 | ||||||||||||||||||||||
Derivatives (3) | 975 | 193 | 1,168 | |||||||||||||||||||||
Deferred taxation | 3 | 3 | ||||||||||||||||||||||
Prepayments, accrued income and other assets | — | — | 489 | 489 | ||||||||||||||||||||
| 975 | 193 | 27,031 | 42,688 | 70,887 | ||||||||||||||||||||
Liabilities | ||||||||||||||||||||||||
Deposits by banks (4) | — | 1,802 | 1,802 | |||||||||||||||||||||
Customer accounts (2) | — | 26 | 26 | |||||||||||||||||||||
Debt securities in issue | — | 14,179 | 14,179 | |||||||||||||||||||||
Derivatives (2) | 136 | 225 | 361 | |||||||||||||||||||||
Accruals, deferred income and other liabilities | — | — | 47 | 47 | ||||||||||||||||||||
Subordinated liabilities | — | 10,314 | 10,314 | |||||||||||||||||||||
| 136 | 225 | 26,321 | 47 | 26,729 | ||||||||||||||||||||
Equity | 44,158 | |||||||||||||||||||||||
| 70,887 | ||||||||||||||||||||||||
229
11 Financial instruments continued |
| Company | ||||||||||||||||||||||||
| Non | ||||||||||||||||||||||||
| Other | financial | |||||||||||||||||||||||
Held-for- | Hedging | Loans and | (amortised | assets/ | ||||||||||||||||||||
| trading | derivatives | receivables | cost) | liabilities | Total | |||||||||||||||||||
| 2007 | £m | £m | £m | £m | £m | £m | ||||||||||||||||||
Assets | ||||||||||||||||||||||||
Loans and advances to banks (1) | — | 7,686 | 7,686 | |||||||||||||||||||||
Loans and advances to customers (3) | — | 307 | 307 | |||||||||||||||||||||
Investments in Group undertakings | 43,542 | 43,542 | ||||||||||||||||||||||
Derivatives (3) | 173 | 173 | ||||||||||||||||||||||
Prepayments, accrued income and other assets | — | — | 127 | 127 | ||||||||||||||||||||
| 173 | — | 7,993 | 43,669 | 51,835 | ||||||||||||||||||||
Liabilities | ||||||||||||||||||||||||
Deposits by banks (4) | — | 5,572 | 5,572 | |||||||||||||||||||||
Debt securities in issue | — | 13,453 | 13,453 | |||||||||||||||||||||
Derivatives (2) | 125 | 54 | 179 | |||||||||||||||||||||
Accruals, deferred income and other liabilities | — | — | 8 | 8 | ||||||||||||||||||||
Deferred taxation | — | 3 | 3 | |||||||||||||||||||||
Subordinated liabilities | — | 7,743 | 7,743 | |||||||||||||||||||||
| 125 | 54 | 26,768 | 11 | 26,958 | ||||||||||||||||||||
Equity | 24,877 | |||||||||||||||||||||||
| 51,835 | ||||||||||||||||||||||||
Notes:
| (1) | Includes amounts due from subsidiaries of £31,238 million (2008 – £27,031 million; 2007 – £7,130 million). |
| (2) | Due to subsidiaries. |
| (3) | Due from subsidiaries. |
| (4) | Includes amounts due to subsidiaries of £4 million (2008 – £1,706 million; 2007 – £5,572 million). |
Amounts included in the consolidated income statement: |
| Group | ||||||||||||
| 2009 | 2008 | 2007 | ||||||||||
| £m | £m | £m | ||||||||||
Gains/(losses) on financial assets/liabilities designated as at fair value through profit or loss | 1,441 | (901 | ) | 1,074 | ||||||||
(Losses)/gains on disposal or settlement of loans and receivables | (573 | ) | 4 | 3 | ||||||||
230
Financial statements
Notes on the accounts
Reclassification of financial instruments
The Group reclassified financial assets from the held-for-trading (HFT) and available-for-sale (AFS) categories into the loans and receivables (LAR) category (as permitted by paragraph 50D of IAS 39 as amended) and from the held-for-trading category into the available-for-sale category (as permitted by paragraph 50B of IAS 39 as amended).
The turbulence in the financial markets during the second half of 2008 was regarded by management as rare circumstances in the context of paragraph 50B of IAS 39 as amended.
The table below shows the carrying value and fair value and the effect on profit or loss of reclassification undertaken by the Group in 2008 and 2009.
| 2009 | ||||||||||||||||||||||||
| Reduction in | ||||||||||||||||||||||||
| 31 December 2009 | After reclassification | Amount | profit or loss | |||||||||||||||||||||
| that would | as result of | |||||||||||||||||||||||
| Carrying | Fair | Impairment | have been | reclassi- | ||||||||||||||||||||
| value | value | Income | losses | recognised | fication | |||||||||||||||||||
| £m | £m | £m | £m | £m | £m | |||||||||||||||||||
Reclassified from HFT to LAR | ||||||||||||||||||||||||
Loans | ||||||||||||||||||||||||
Leveraged finance | 2,574 | 2,257 | 109 | (902 | ) | 482 | 1,275 | |||||||||||||||||
Corporate and other loans | 5,302 | 4,114 | 99 | (361 | ) | (321 | ) | (59 | ) | |||||||||||||||
| 7,876 | 6,371 | 208 | (1,263 | ) | 161 | 1,216 | ||||||||||||||||||
Debt securities | ||||||||||||||||||||||||
CDO | 21 | 21 | 2 | — | 2 | — | ||||||||||||||||||
RMBS | 1,532 | 1,168 | (115 | ) | — | (25 | ) | 90 | ||||||||||||||||
CMBS | 826 | 596 | (44 | ) | — | 24 | 68 | |||||||||||||||||
CLOs | 647 | 536 | (43 | ) | (16 | ) | 39 | 98 | ||||||||||||||||
Other ABS | 1,145 | 1,070 | (13 | ) | — | — | 13 | |||||||||||||||||
Other | 886 | 882 | 34 | — | 254 | 220 | ||||||||||||||||||
| 5,057 | 4,273 | (179 | ) | (16 | ) | 294 | 489 | |||||||||||||||||
Total | 12,933 | 10,644 | 29 | (1,279 | ) | 455 | 1,705 | |||||||||||||||||
Reclassified from HFT to AFS (1) | ||||||||||||||||||||||||
Debt securities | ||||||||||||||||||||||||
CDO | 1,170 | 1,170 | 35 | (226 | ) | 40 | 231 | |||||||||||||||||
RMBS | 3,042 | 3,042 | 335 | (84 | ) | 460 | 209 | |||||||||||||||||
CMBS | 63 | 63 | (2 | ) | — | 11 | 13 | |||||||||||||||||
CLOs | 2,676 | 2,676 | 57 | — | 704 | 647 | ||||||||||||||||||
Other ABS | 508 | 508 | 20 | — | 44 | 24 | ||||||||||||||||||
Other | 142 | 142 | (3 | ) | (118 | ) | 34 | 155 | ||||||||||||||||
| 7,601 | 7,601 | 442 | (428 | ) | 1,293 | 1,279 | ||||||||||||||||||
Equity securities | 28 | 28 | (1 | ) | — | — | 1 | |||||||||||||||||
| 7,629 | 7,629 | 441 | (428 | ) | 1,293 | 1,280 | ||||||||||||||||||
Reclassified from AFS to LAR: (2) | ||||||||||||||||||||||||
Debt securities | 869 | 745 | 21 | — | 21 | — | ||||||||||||||||||
Total | 21,431 | 19,018 | 491 | (1,707 | ) | 1,769 | 2,985 | |||||||||||||||||
Notes:
| (1) | The amount taken to AFS reserves was £1,067 million. |
| (2) | The amount that would have been taken to AFS reserves if reclassification had not occurred is £(73) million. |
231
Notes on the accounts continued
11 Financial instruments continued
The following table is for reclassifications in 2009. The balance sheet values of these assets, the effect of the reclassification on the income statement for the period from the date of reclassification to 31 December 2009 and the gains and losses relating to these assets recorded in the income statement for the years ended 31 December 2009, 2008 and 2007 were as follows:
| 2009 | 2008 | 2007 | ||||||||||||||||||||||||||||||||||||||||||||||
| After reclassification | ||||||||||||||||||||||||||||||||||||||||||||||||
| Gains/(losses) | ||||||||||||||||||||||||||||||||||||||||||||||||
| 2009 – on reclassification | 31 December 2009 | Gains/(losses) | Reduction in | recognised in | ||||||||||||||||||||||||||||||||||||||||||||
| up to the | Amount profit or loss | the income | ||||||||||||||||||||||||||||||||||||||||||||||
| Effective | Expected | date of | that would | as result of | statement | |||||||||||||||||||||||||||||||||||||||||||
| Carrying | interest | cash | Carrying | Fair | reclassi- | Impairment | have been | reclassi- | in prior | |||||||||||||||||||||||||||||||||||||||
| value | rate | flows | value | value | fication | Income | losses | recognised | fication | periods | ||||||||||||||||||||||||||||||||||||||
| £m | % | £m | £m | £m | £m | £m | £m | £m | £m | £m | £m | |||||||||||||||||||||||||||||||||||||
| Reclassified from HFT to LAR: | ||||||||||||||||||||||||||||||||||||||||||||||||
| Loans | ||||||||||||||||||||||||||||||||||||||||||||||||
| Leveraged finance | 510 | 13.37 | 1,075 | — | — | — | (70 | ) | (71 | ) | (141 | ) | — | (76 | ) | — | ||||||||||||||||||||||||||||||||
| Corporate and other loans | 1,230 | 2.85 | 1,565 | 887 | 924 | (103 | ) | 26 | (180 | ) | (115 | ) | 39 | 14 | 25 | |||||||||||||||||||||||||||||||||
| 1,740 | 2,640 | 887 | 924 | (103 | ) | (44 | ) | (251 | ) | (256 | ) | 39 | (62 | ) | 25 | |||||||||||||||||||||||||||||||||
| Debt securities | ||||||||||||||||||||||||||||||||||||||||||||||||
| RMBS | 86 | 3.30 | 94 | 78 | 74 | (2 | ) | 2 | — | (3 | ) | (5 | ) | (3 | ) | — | ||||||||||||||||||||||||||||||||
| CMBS | 64 | 2.17 | 67 | 41 | 36 | (3 | ) | (6 | ) | — | (10 | ) | (4 | ) | (14 | ) | — | |||||||||||||||||||||||||||||||
| Other ABS | 39 | 2.51 | 41 | 7 | 7 | 1 | 1 | — | — | (1 | ) | (10 | ) | — | ||||||||||||||||||||||||||||||||||
| Other | 66 | 13.19 | 147 | 64 | 71 | (29 | ) | 3 | — | 11 | 8 | (12 | ) | — | ||||||||||||||||||||||||||||||||||
| 255 | 349 | 190 | 188 | (33 | ) | — | — | (2 | ) | (2 | ) | (39 | ) | — | ||||||||||||||||||||||||||||||||||
| Total | 1,995 | 2,989 | 1,077 | 1,112 | (136 | ) | (44 | ) | (251 | ) | (258 | ) | 37 | (101 | ) | 25 | ||||||||||||||||||||||||||||||||
232
Financial statements
Notes on the accounts
The following table is for reclassifications in 2008. The balance sheet values of these assets, the effect of the reclassification on the income statement for the period from the date of reclassification to 31 December 2008 and the gains and losses relating to these assets recorded in the income statement for the years ended 31 December 2008, 2007 and 2006 were as follows:
| 2008 | 2007 | 2006 | ||||||||||||||||||||||||||||||||||||||||||||||
| After reclassification | ||||||||||||||||||||||||||||||||||||||||||||||||
| Gains/(losses) | ||||||||||||||||||||||||||||||||||||||||||||||||
| 2008 – on reclassification | 31 December 2008 | Gains/(losses) | Increase in | recognised in | ||||||||||||||||||||||||||||||||||||||||||||
| up to the | Amount | profit or loss | the income | |||||||||||||||||||||||||||||||||||||||||||||
| Effective | Expected | date of | that would | as result of | statement | |||||||||||||||||||||||||||||||||||||||||||
| Carrying | interest | cash | Carrying | Fair | reclassi- | Impairment | have been | reclassi- | in prior | |||||||||||||||||||||||||||||||||||||||
| value | rate | flows | value | value | fication | Income | losses | recognised | fication | periods | ||||||||||||||||||||||||||||||||||||||
| £m | % | £m | £m | £m | £m | £m | £m | £m | £m | £m | £m | |||||||||||||||||||||||||||||||||||||
| Reclassified from HFT to LAR: | ||||||||||||||||||||||||||||||||||||||||||||||||
| Loans | ||||||||||||||||||||||||||||||||||||||||||||||||
| Leveraged finance | 3,602 | 10.14 | % | 6,091 | 4,304 | 2,714 | (456 | ) | 455 | — | (1,015 | ) | 1,470 | (155 | ) | — | ||||||||||||||||||||||||||||||||
| Corporate and other loans | 5,205 | 6.03 | % | 7,752 | 6,053 | 5,143 | (74 | ) | 267 | — | (639 | ) | 906 | (46 | ) | 3 | ||||||||||||||||||||||||||||||||
| 8,807 | 13,843 | 10,357 | 7,857 | (530 | ) | 722 | — | (1,654 | ) | 2,376 | (201 | ) | 3 | |||||||||||||||||||||||||||||||||||
| Debt securities | ||||||||||||||||||||||||||||||||||||||||||||||||
| CDO | 215 | 4.92 | % | 259 | 236 | 221 | 4 | 5 | — | (11 | ) | 16 | 5 | 6 | ||||||||||||||||||||||||||||||||||
| RMBS | 1,765 | 6.05 | % | 2,136 | 2,059 | 1,579 | (115 | ) | 171 | — | (293 | ) | 464 | (12 | ) | — | ||||||||||||||||||||||||||||||||
| CMBS | 1,877 | 4.77 | % | 2,402 | 2,144 | 1,776 | (42 | ) | 50 | — | (293 | ) | 343 | (19 | ) | — | ||||||||||||||||||||||||||||||||
| CLOs | 835 | 6.34 | % | 1,141 | 1,121 | 851 | (22 | ) | 104 | — | (164 | ) | 268 | (14 | ) | (2 | ) | |||||||||||||||||||||||||||||||
| Other ABS | 2,203 | 5.07 | % | 3,203 | 2,242 | 1,943 | (68 | ) | 129 | — | (151 | ) | 280 | 3 | (1 | ) | ||||||||||||||||||||||||||||||||
| Other | 2,548 | 2.64 | % | 2,778 | 2,615 | 2,401 | 73 | 7 | — | (162 | ) | 169 | 95 | 476 | ||||||||||||||||||||||||||||||||||
| 9,443 | 11,919 | 10,417 | 8,771 | (170 | ) | 466 | — | (1,074 | ) | 1,540 | 58 | 479 | ||||||||||||||||||||||||||||||||||||
| Total | 18,250 | 25,762 | 20,774 | 16,628 | (700 | ) | 1,188 | — | (2,728 | ) | 3,916 | (143 | ) | 482 | ||||||||||||||||||||||||||||||||||
| Reclassified from HFT to AFS: | ||||||||||||||||||||||||||||||||||||||||||||||||
Debt securities (1) | ||||||||||||||||||||||||||||||||||||||||||||||||
| CDO | 3,592 | 10.32 | % | 5,607 | 1,346 | 1,346 | (994 | ) | (514 | ) | (446 | ) | (1,468 | ) | 508 | (400 | ) | — | ||||||||||||||||||||||||||||||
| RMBS | 5,205 | 8.03 | % | 8,890 | 5,171 | 5,171 | (531 | ) | 21 | — | (131 | ) | 152 | (4 | ) | 74 | ||||||||||||||||||||||||||||||||
| CMBS | 590 | 6.65 | % | 836 | 256 | 256 | (110 | ) | (48 | ) | — | (408 | ) | 360 | 4 | — | ||||||||||||||||||||||||||||||||
| CLOs | 3,498 | 4.89 | % | 4,257 | 3,759 | 3,759 | (353 | ) | (797 | ) | — | (1,633 | ) | 836 | 36 | 1 | ||||||||||||||||||||||||||||||||
| Other ABS | 1,323 | 5.70 | % | 2,013 | 712 | 712 | (185 | ) | (36 | ) | — | (5 | ) | (31 | ) | (42 | ) | 72 | ||||||||||||||||||||||||||||||
| Other | 756 | 10.17 | % | 1,311 | 777 | 777 | — | 131 | — | (3 | ) | 134 | (1 | ) | — | |||||||||||||||||||||||||||||||||
| 14,964 | 22,914 | 12,021 | 12,021 | (2,173 | ) | (1,243 | ) | (446 | ) | (3,648 | ) | 1,959 | (407 | ) | 147 | |||||||||||||||||||||||||||||||||
| Equity shares | 34 | — | 32 | 26 | 26 | (9 | ) | — | — | (9 | ) | 9 | 13 | — | ||||||||||||||||||||||||||||||||||
| 14,998 | 22,946 | 12,047 | 12,047 | (2,182 | ) | (1,243 | ) | (446 | ) | (3,657 | ) | 1,968 | (394 | ) | 147 | |||||||||||||||||||||||||||||||||
| Reclassified from | ||||||||||||||||||||||||||||||||||||||||||||||||
| AFS to LAR: | ||||||||||||||||||||||||||||||||||||||||||||||||
| Debt securities (1) | 694 | 1.38 | % | 760 | 1,016 | 956 | (12 | ) | 6 | — | 6 | — | — | — | ||||||||||||||||||||||||||||||||||
| Total | 33,942 | 49,468 | 33,837 | 29,631 | (2,894 | ) | (49 | ) | (446 | ) | (6,379 | ) | 5,884 | (537 | ) | 629 | ||||||||||||||||||||||||||||||||
Notes:
(1) | The amount taken to AFS reserves was £(2,193) million. |
(2) | The amount that would have been in AFS reserves if reclassification had not occurred is £(37) million. |
(3) | The above table has been restated. |
233
Notes on the accounts continued
11 Financial instruments continued
Valuation of financial instruments carried at fair value
Control environment
The Group’s control environment for the determination of the fair value of financial instruments includes formalised protocols for the review and validation of fair values independent from the businesses entering into the transactions. There are specific controls to ensure consistent pricing policies and procedures, incorporating disciplined price verification. The Group ensures that appropriate attention is given to bespoke transactions, structured products, illiquid products and other instruments which are difficult to price.
A key element of the control environment is the independent price verification (‘IPV’) process. Valuations are first performed by the business which entered into the transaction. Such valuations may be directly from available prices, or may be derived using a model and variable model inputs. These valuations are reviewed, and if necessary amended, by a team, independent of those trading the financial instruments, in the light of available pricing evidence. IPV is performed at a frequency to match the availability of independent data. For liquid instruments IPV is performed daily. The minimum frequency of review in the Group is monthly for exposures in the regulatory trading book, and six monthly for exposures in the regulatory banking book. The IPV control includes formalised reporting and escalation of any valuation differences in breach of established thresholds. The Global Pricing Unit determines IPV policy, monitors adherence to that policy, and performs additional independent reviews on highly subjective valuation issues for GBM and Non-Core.
Certain assets in the non-core business are comparably more difficult and subjective to value. The valuations of these portfolios are subject to a further level of review through an additional Non-Core valuation committee comprising senior representatives of the trading function, risk management and the Global Pricing Unit which meets regularly and are responsible for monitoring, assessing and enhancing the adequacy of the valuation techniques being adopted for these instruments.
Valuation models are subject to a review process which requires different levels of model documentation, testing and review, depending on the complexity of the model and the size of the Group’s exposure. A key element of the control environment over model use in the Group is a modelled product review committee, made up of valuations experts from several functions within the Group. This committee sets the policy for model documentation, testing and review, and prioritises models with significant exposure for review by the Group’s Quantitative Research Centre. Potential valuation uncertainty is a key input in determining model review priorities at these meetings. The Quantative Research Centre, which is independent of the trading businesses, assesses the appropriateness of the application of the model to the product, the mathematical robustness of the model, and (where appropriate), considers alternative modelling approaches.
GBM’s senior management valuations control committee meets formally monthly to discuss independent pricing, reserving and valuation issues relating to both GBM and Non-Core exposures. All material methodology changes require review and ratification by this committee. The committee includes valuation specialists representing several independent review functions including Market Risk, the quantitative research centre and finance.
The Group Executive Valuation Committee discusses the issues escalated by the modelled product review committee, GBM senior management valuations control committee and other relevant issues. The committee covers key material and subjective valuation issues within the trading business. The committee will provide ratification to the appropriateness of areas with very high residual valuation uncertainty. Committee membership includes the Group Finance Director, the Group Chief Accountant, Head of Group Market Risk, GBM CFO and Non-Core CFO, and representation from front office trading and Finance.
234
Financial statements
Notes on the accounts
Valuation techniques
The Group uses a number of methodologies to determine the fair values of financial instruments for which observable prices in active markets for identical instruments are not available. These techniques include: relative value methodologies based on observable prices for similar instruments; present value approaches where future cash flows from the asset or liability are estimated and then discounted using a risk-adjusted interest rate; option pricing models (such as Black-Scholes or binomial option pricing models) and simulation models such as Monte-Carlo.
The principal inputs to these valuation techniques are listed below. Values between and beyond available data points are obtained by interpolation and extrapolation. When utilising valuation techniques, the fair value can be significantly affected by the choice of valuation model and by underlying assumptions concerning factors such as the amounts and timing of cash flows, discount rates and credit risk.
| · | Bond prices – quoted prices are generally available for government bonds, certain corporate securities and some mortgage-related products. |
| · | Credit spreads – where available, these are derived from prices of CDS or other credit based instruments, such as debt securities. For others, credit spreads are obtained from pricing services. |
| · | Interest rates – these are principally benchmark interest rates such as the London Inter-Bank Offered Rate (LIBOR) and quoted interest rates in the swap, bond and futures markets. |
| · | Foreign currency exchange rates – there are observable markets both for spot and forward contracts and futures in the world’s major currencies. |
| · | Equity and equity index prices – quoted prices are generally readily available for equity shares listed on the world’s major stock exchanges and for major indices on such shares. |
| · | Commodity prices – many commodities are actively traded in spot and forward contracts and futures on exchanges in London, New York and other commercial centres. |
| · | Price volatilities and correlations – volatility is a measure of the tendency of a price to change with time. Correlation measures the degree to which two or more prices or other variables are observed to move together. If they move in the same direction there is positive correlation; if they move in opposite directions there is negative correlation. Volatility is a key input in valuing options and the valuation of certain products such as derivatives with more than one underlying variable that are correlation-dependent. Volatility and correlation values are obtained from broker quotations, pricing services or derived from option prices. |
| · | Prepayment rates – the fair value of a financial instrument that can be prepaid by the issuer or borrower differs from that of an instrument that cannot be prepaid. In valuing prepayable instruments that are not quoted in active markets, the Group considers the value of the prepayment option. |
| · | Counterparty credit spreads – adjustments are made to market prices (or parameters) when the creditworthiness of the counterparty differs from that of the assumed counterparty in the market price (or parameters). |
| · | Recovery rates/loss given default – these are used as an input to valuation models and reserves for ABS and other credit products as an indicator of severity of losses on default. Recovery rates are primarily sourced from market data providers or inferred from observable credit spreads. |
In order to determine a reliable fair value, where appropriate, management applies valuation adjustments to the pricing information gathered from the above sources. These adjustments reflect the Group’s assessment of factors that market participants would consider in setting a price, to the extent that these factors are not reflected in that pricing information. Furthermore, on an ongoing basis, the Group assesses the appropriateness of any model used. To the extent that the price provided by internal models does not represent the fair value of the instrument, for instance in highly stressed market conditions, the Group makes adjustments to the model valuation to calibrate to other available pricing sources. Where unobservable inputs are used, the Group may determine a range of possible valuations derived from differing stress scenarios to determine the sensitivity associated with the valuation. When establishing the fair value of a financial instrument using a valuation technique, the Group considers certain adjustments to the modelled price which market participants would make when pricing that instrument. Such adjustments include the credit quality of the counterparty and adjustments to compensate for any known model limitations.
On initial recognition of financial assets and liabilities valued using valuation techniques incorporating information other than observable market data, any difference between the transaction price and that derived from the valuation technique is deferred. Such amounts are recognised in profit or loss over the life of the transaction; when market data become observable; or when the transaction matures or is closed out as appropriate. At 31 December 2009, net gains of £204 million (2008 – £102 million; 2007 – £72 million) were carried forward in the balance sheet. During the year net gains of £127 million (2008 – £89 million; 2007 – £67 million) were deferred and £25 million (2008 – £65 million; 2007 – £10 million) recognised in the income statement.
235
Notes on the accounts continued
11 Financial instruments continued
Valuation reserves
When valuing financial instruments in the trading book, adjustments are made to mid-market valuations to cover bid-offer spread, liquidity and credit risk.
| Valuation reserves and adjustments comprise: | ||||||||||||
| 2009 | 2008 | 2007 | ||||||||||
| £m | £m | £m | ||||||||||
| Credit valuation adjustments: | ||||||||||||
| Monoline insurers | 3,796 | 5,988 | 862 | |||||||||
| CDPCs | 499 | 1,311 | 44 | |||||||||
| Other counterparties | 1,588 | 1,738 | 263 | |||||||||
| 5,883 | 9,037 | 1,169 | ||||||||||
| Bid-offer and liquidity reserves | 2,814 | 3,260 | 1,154 | |||||||||
| 8,697 | 12,297 | 2,323 | ||||||||||
| Debit valuation adjustments: | ||||||||||||
| Debt securities in issue | (2,331 | ) | (2,373 | ) | (456 | ) | ||||||
| Derivatives | (467 | ) | (450 | ) | — | |||||||
| Total debit valuation adjustments | (2,798 | ) | (2,823 | ) | (456 | ) | ||||||
| Total reserves | 5,899 | 9,474 | 1,867 | |||||||||
Credit valuation adjustments (CVA) represent an estimate of the adjustment to fair value that a market participant would make to incorporate the credit risk inherent in counterparty derivative exposures. The Group makes such credit adjustments to derivative exposures it has to counterparties, as well as debit valuation adjustments to liabilities issued by the Group. CVA is discussed in Risk, capital and liquidity management – Market turmoil exposures – Credit valuation adjustments (pages 146 to 152). Bid-offer and liquidity reserves and own credit are discussed below.
Bid-offer and liquidity reserves
Trading positions are adjusted to bid (for assets) or offer (for liabilities) levels, by marking individual cash based positions directly to bid or offer or by taking bid-offer reserves calculated on a portfolio basis for derivatives.
The bid-offer approach is based on current market spreads and standard market bucketing of risk. Risk data is used as the primary source of information within bid-offer calculations and is aggregated when it is more granular than market standard buckets.
Bid-offer adjustments for each risk factor are determined by aggregating similar risk exposures arising on different products. Additional basis bid/offer reserves are taken where these are charged in the market. Risk associated with non identical underlying exposures is not netted down unless there is evidence that the cost of closing the combined risk exposure is less than the cost of closing on an individual basis. For example: interest rate delta bid-offer methodology (when viewed in isolation) allows aggregation of risk across different tenor bases. Tenor basis bid-offer reserves are then applied to compensate for the netting within the (original) delta bid-offer calculation.
Bid-offer spreads vary by maturity and risk type to reflect different spreads in the market. For positions where there is no observable quote, the bid-offer spreads are widened in comparison to proxies to reflect reduced liquidity or observability. Bid-offer methodologies also incorporate liquidity triggers whereby wider spreads are applied to risks above pre-defined thresholds.
Netting is applied across risk buckets where there is market evidence to support this. For example calendar netting and cross strike netting effects are taken into account where such trades occur regularly within the market. Netting will also apply where long and short risk in two different risk buckets can be closed out in a single market transaction at less cost than via two separate transactions (closing out the individual bucketed risk in isolation).
Vanilla risk on exotic products is typically reserved as part of the overall portfolio based calculation e.g. delta and vega risk is included within the delta and vega bid-offer calculations. Aggregation of risk arising from different models is in line with the Group’s risk management practices; the model review control process considers the appropriateness of model selection in this respect.
Product related risks such as correlation risk attract specific bid to offer reserves. Additional reserves are provided for exotic products to ensure overall reserves match market close-out costs. These market close-out costs inherently incorporate risk decay and cross-effects which are unlikely to be adequately reflected in the static hedge based on vanilla instruments.
Where there is limited bid-offer information for a product a conservative approach is taken, taking into account pricing approach and risk management strategy.
Market risk close-out costs excluding CVA were £2,814 million as at 31 December 2009 (2008 – £3,260 million; 2007 – £1,154 million).
When valuing financial liabilities recorded at fair value, the Group takes into account the effect of its own credit standing. The categories of financial liabilities on which own credit spread adjustments are made are issued debt held at fair value, including issued structured notes, and derivatives. An own credit adjustment is applied to positions where it is believed that counterparties would consider the Group’s creditworthiness when pricing trades.
For issued debt and structured notes, this adjustment is based on independent quotes from market participants for the debt issuance spreads above average inter-bank rates, (at a range of tenors) which the market would demand when purchasing new senior or sub-debt issuances from the Group. Where necessary, these quotes are interpolated using a curve shape derived from CDS prices.
The own credit adjustment:
| · | does not alter cash flows; |
| · | is not used for performance management; and |
| · | is disregarded for regulatory capital reporting processes. |
The fair value of the Group’s derivative financial liabilities has also been adjusted to reflect the Group’s own credit risk. The adjustment takes into account collateral posted by the Group and the effects of master netting agreements.
The reserve movement between periods will not equate to the reported profit or loss for own credit. The balance sheet reserves are stated by conversion of underlying currency balances at spot rates for each period whereas the income statement includes intra-period foreign exchange sell-offs.
The effect of change in credit spreads could be reversed in future periods.
The table below shows own credit adjustments on own liabilities.
| Debt securities in issue | ||||||||||||||||||||
| Designated | ||||||||||||||||||||
| as at | ||||||||||||||||||||
| fair value | ||||||||||||||||||||
Held-for- | through profit | |||||||||||||||||||
| trading (1) | or loss | Total | Derivatives (2) | Total | ||||||||||||||||
| Cumulative own credit adjustment | £m | £m | £m | £m | £m | |||||||||||||||
| At 31 December 2009 | 1,237 | 1,094 | 2,331 | 467 | 2,798 | |||||||||||||||
| At 31 December 2008 | 1,346 | 1,027 | 2,373 | 450 | 2,823 | |||||||||||||||
| At 31 December 2007 | 304 | 152 | 456 | — | 456 | |||||||||||||||
| Book values of underlying liabilities | £bn | £bn | £bn | £bn | £bn | |||||||||||||||
| At 31 December 2009 | 36.6 | 13.3 | 49.9 | 16.8 | 66.7 | |||||||||||||||
| At 31 December 2008 | 25.5 | 16.9 | 42.4 | 43.5 | 85.9 | |||||||||||||||
Notes:
| (1) | The held-for-trading portfolio consists of wholesale and retail note issuances. |
| (2) | The effect of foreign exchange rates, new issues and redemptions are not captured separately. |
237
Notes on the accounts continued
11 Financial instruments continued
Valuation hierarchy
The tables below show the financial instruments carried at fair value by hierarchy – level 1, level 2 and level 3. The valuation techniques, main assumptions used in the valuation of these instruments and reasonably possible increases or decreases in fair value based on reasonably possible alternative assumptions for level 3 financial instruments are set out below.
| Total | Level 1 | Level 2 | Level 3 | Level 3 sensitivity (2) | ||||||||||||||||||||||
| 2009 | £bn | £bn | £bn | £bn | £m | £m | Level 3 valuation technique and related assumptions | |||||||||||||||||||
| Assets | ||||||||||||||||||||||||||
| Loans and advances: | ||||||||||||||||||||||||||
| – banks | 45.4 | — | 45.4 | — | — | — | n/a | |||||||||||||||||||
| – customers | 44.3 | — | 43.2 | 1.1 | 80 | (40 | ) | Proprietary model: credit spreads, indices | ||||||||||||||||||
| Debt securities | ||||||||||||||||||||||||||
| Government | 146.8 | 130.1 | 16.7 | — | — | — | n/a | |||||||||||||||||||
| RMBS | 57.7 | — | 57.2 | 0.5 | 30 | (10 | ) | Industry standard model: prepayment | ||||||||||||||||||
rates, probability of default, loss severity and yield | ||||||||||||||||||||||||||
| CMBS | 4.1 | — | 4.0 | 0.1 | 30 | — | n/a | |||||||||||||||||||
| CDOs | 3.6 | — | 2.6 | 1.0 | 130 | (80 | ) | Proprietary model: implied collateral valuation, | ||||||||||||||||||
| default rates, housing prices, correlation | ||||||||||||||||||||||||||
| CLOs | 8.8 | — | 8.0 | 0.8 | 80 | (50 | ) | Industry standard simulation model: credit | ||||||||||||||||||
| spreads, recovery rates, correlation | ||||||||||||||||||||||||||
| Other ABS | 6.1 | — | 5.2 | 0.9 | 120 | (40 | ) | Proprietary model: credit spreads, | ||||||||||||||||||
| Corporate | 11.4 | — | 10.8 | 0.6 | 70 | (20 | ) | Proprietary model: credit spreads | ||||||||||||||||||
Other (3) | 18.9 | 0.2 | 18.5 | 0.2 | 10 | (30 | ) | Proprietary model: credit spreads |
| 257.4 | 130.3 | 123.0 | 4.1 | 470 | (230 | ) | ||||||||||||||||||||
| Equity shares | 19.5 | 15.4 | 2.6 | 1.5 | 280 | (220 | ) | Valuation statements: fund valuation | ||||||||||||||||||
| Derivatives | ||||||||||||||||||||||||||
| Foreign exchange | 69.4 | — | 69.2 | 0.2 | 10 | — | Proprietary model: volatility, correlation | |||||||||||||||||||
| Interest rate | 323.6 | 0.3 | 321.8 | 1.5 | 80 | (100 | ) | Proprietary model: volatility, correlation | ||||||||||||||||||
| Equities | 6.5 | 0.4 | 5.8 | 0.3 | 20 | (20 | ) | Proprietary model; volatility, correlation, | ||||||||||||||||||
| dividends | ||||||||||||||||||||||||||
| Commodities | 0.3 | — | 0.3 | — | — | — | n/a | |||||||||||||||||||
| Credit – APS | 1.4 | — | — | 1.4 | 1,370 | (1,540 | ) | Proprietary model: correlation, expected losses, | ||||||||||||||||||
| recovery rates, credit spreads | ||||||||||||||||||||||||||
| Credit – other | 40.3 | 0.1 | 37.2 | 3.0 | 420 | (360 | ) | Proprietary, industry option and correlation | ||||||||||||||||||
| models: counterparty credit risk, correlation, | ||||||||||||||||||||||||||
| volatility |
| 441.5 | 0.8 | 434.3 | 6.4 | 1,900 | (2,020 | ) | ||||||||||||||||||||
| Total assets | 808.1 | 146.5 | 648.5 | 13.1 | 2,730 | (2,510 | ) | |||||||||||||||||||
| Liabilities | ||||||||||||||||||||||||||
| Deposits: | ||||||||||||||||||||||||||
| – banks | 53.6 | — | 53.6 | — | — | — | n/a | |||||||||||||||||||
| – customers | 61.4 | — | 61.3 | 0.1 | — | (10 | ) | Proprietary model: credit spreads correlation | ||||||||||||||||||
| Debt securities in issue | 45.5 | — | 43.2 | 2.3 | 50 | (10 | ) | Proprietary model: volatility, correlation, | ||||||||||||||||||
| Short positions | 40.5 | 27.1 | 13.2 | 0.2 | 10 | (20 | ) | Proprietary model: credit spreads, correlation |
| Derivatives | ||||||||||||||||||||||||||
| Foreign exchange | 63.9 | — | 63.9 | — | — | — | n/a | |||||||||||||||||||
| Interest rate | 311.4 | 0.1 | 310.5 | 0.8 | 40 | (60 | ) | Proprietary model: volatility, correlation, | ||||||||||||||||||
| Equities | 9.5 | 1.0 | 8.3 | 0.2 | 20 | (70 | ) | Proprietary model: volatility, correlation | ||||||||||||||||||
| dividends | ||||||||||||||||||||||||||
| Commodities | 0.2 | — | 0.2 | — | — | — | n/a | |||||||||||||||||||
| Credit | 39.1 | — | 38.1 | 1.0 | 80 | (100 | ) | Proprietary CVA model, industry option and | ||||||||||||||||||
| correlation models: counterparty credit risk, | ||||||||||||||||||||||||||
| correlation, volatility |
| 424.1 | 1.1 | 421.0 | 2.0 | 140 | (230 | ) | ||||||||||||||||||||
Other financial liabilities (4) | 1.3 | — | 1.3 | — | — | — | n/a | |||||||||||||||||||
| Total liabilities | 626.4 | 28.2 | 593.6 | 4.6 | 200 | (270 | ) |
238
Financial statements
Notes on the accounts
| Total | Level 1 | Level 2 | Level 3 | Level 3 sensitivity (2) | ||||||||||||||||||||||
| 2008 | £bn | £bn | £bn | £bn | £m | £m | Level 3 valuation technique and related assumptions | |||||||||||||||||||
| Assets | ||||||||||||||||||||||||||
| Loans and advances | ||||||||||||||||||||||||||
| – banks | 56.2 | — | 56.2 | — | — | — | n/a | |||||||||||||||||||
| – customers | 53.6 | — | 50.5 | 3.1 | 70 | (50 | ) | Proprietary model: credit spreads, indices | ||||||||||||||||||
| Debt securities | ||||||||||||||||||||||||||
| Government | 105.9 | 68.7 | 37.2 | — | — | — | n/a | |||||||||||||||||||
| RMBS | 72.8 | — | 72.3 | 0.5 | 40 | (90 | ) | Industry standard model: prepayment rates, | ||||||||||||||||||
| probability of default, loss severity and yield | ||||||||||||||||||||||||||
| CMBS | 3.9 | — | 3.3 | 0.6 | 30 | (30 | ) | n/a | ||||||||||||||||||
| CDOs | 8.6 | — | 6.9 | 1.7 | 410 | (440 | ) | Proprietary model: implied collateral valuation, | ||||||||||||||||||
| default rates, housing prices, correlation | ||||||||||||||||||||||||||
| CLOs | 8.7 | — | 7.7 | 1.0 | 40 | (40 | ) | Industry standard simulation model: credit | ||||||||||||||||||
| spreads, recovery rates, correlation | ||||||||||||||||||||||||||
| Other ABS | 8.1 | — | 6.6 | 1.5 | 10 | (10 | ) | Proprietary model: credit spreads | ||||||||||||||||||
| Corporate | 18.0 | 0.9 | 15.8 | 1.3 | 40 | (40 | ) | Proprietary model: credit spreads | ||||||||||||||||||
Other (3) | 28.6 | 4.1 | 24.2 | 0.3 | — | — | Proprietary model: credit spreads |
| 254.6 | 73.7 | 174.0 | 6.9 | 570 | (650 | ) | ||||||||||||||||||||
| Equity shares | 26.3 | 15.4 | 9.8 | 1.1 | 80 | (160 | ) | Valuation statements: fund valuation | ||||||||||||||||||
| Derivatives | ||||||||||||||||||||||||||
| Foreign exchange | 173.3 | 2.2 | 171.0 | 0.1 | — | — | Proprietary model: volatility, correlation | |||||||||||||||||||
| Interest rate | 654.8 | 0.4 | 652.9 | 1.5 | 80 | (80 | ) | Proprietary model: volatility, correlation | ||||||||||||||||||
| Equities | 9.2 | 0.5 | 8.6 | 0.1 | — | (10 | ) | Proprietary model: volatility, correlation, | ||||||||||||||||||
| dividends | ||||||||||||||||||||||||||
| Commodities – Sempra | 11.6 | — | 11.0 | 0.6 | 50 | (50 | ) | n/a | ||||||||||||||||||
| Commodities – other | 1.3 | — | 1.3 | — | — | — | Proprietary model: credit spreads, correlation, | |||||||||||||||||||
| expected losses and recoveries | ||||||||||||||||||||||||||
| Credit | 142.4 | 0.8 | 133.6 | 8.0 | 1,030 | (1,200 | ) | Proprietary, industry option and correlation | ||||||||||||||||||
| models: counterparty credit risk, correlation, | ||||||||||||||||||||||||||
| volatility |
| 992.6 | 3.9 | 978.4 | 10.3 | 1,160 | (1,340 | ) | ||||||||||||||||||||
| Total assets | 1,383.3 | 93.0 | 1,268.9 | 21.4 | 1,880 | (2,200 | ) | |||||||||||||||||||
| Liabilities | ||||||||||||||||||||||||||
| Deposits: | ||||||||||||||||||||||||||
| – banks | 81.1 | — | 81.1 | — | — | — | n/a | |||||||||||||||||||
| – customers | 64.0 | — | 63.7 | 0.3 | — | — | Proprietary model: credit spreads correlation | |||||||||||||||||||
| Debt securities in issue | 51.4 | — | 47.0 | 4.4 | 190 | (170 | ) | Proprietary model: volatility, correlation | ||||||||||||||||||
| Short positions | 42.5 | 36.0 | 6.5 | — | — | — | Proprietary model: credit spreads, correlation |
| Derivatives | ||||||||||||||||||||||||||
| Foreign exchange | 173.4 | 2.2 | 171.2 | — | — | — | n/a | |||||||||||||||||||
| Interest rate | 641.0 | 0.4 | 639.7 | 0.9 | 90 | (90 | ) | Proprietary model: volatility, correlation | ||||||||||||||||||
| Equities | 12.2 | 0.9 | 11.2 | 0.1 | — | — | Proprietary model: volatility, correlation, | |||||||||||||||||||
| correlation, dividends | ||||||||||||||||||||||||||
| Commodities – Sempra | 10.9 | — | 10.5 | 0.4 | 30 | (30 | ) | n/a | ||||||||||||||||||
| Commodities – other | 1.2 | — | 1.2 | — | — | — | Proprietary model: credit spreads, correlation, | |||||||||||||||||||
| expected losses and recoveries | ||||||||||||||||||||||||||
| Credit | 132.7 | 0.1 | 130.0 | 2.6 | 180 | (160 | ) | Proprietary, industry option and correlation | ||||||||||||||||||
| models: counterparty credit risk, correlation, | ||||||||||||||||||||||||||
| volatility |
| 971.4 | 3.6 | 963.8 | 4.0 | 300 | (280 | ) | ||||||||||||||||||||
Other financial liabilities (4) | 1.8 | — | 1.5 | 0.3 | 60 | (40 | ) | |||||||||||||||||||
| Total liabilities | 1,212.2 | 39.6 | 1,163.6 | 9.0 | 550 | (490 | ) |
239
Notes on the accounts continued
11 Financial instruments continued
Amounts classified as available-for-sale comprise:
| Total | Level 1 (1) | Level 2 (1) | Level 3 (1) | Level 3 sensitivity (2) | ||||||||||||||||||||
| £bn | £bn | £bn | £bn | £m | £m | |||||||||||||||||||
| 2009 | ||||||||||||||||||||||||
| Debt securities | 143.3 | 70.3 | 71.7 | 1.3 | 90 | (50 | ) | |||||||||||||||||
| Equity shares | 2.9 | 0.5 | 1.7 | 0.7 | 100 | (90 | ) | |||||||||||||||||
| 146.2 | 70.8 | 73.4 | 2.0 | 190 | (140 | ) | ||||||||||||||||||
| 2008 | ||||||||||||||||||||||||
| Debt securities | 132.8 | 20.9 | 108.9 | 3.0 | 90 | (120 | ) | |||||||||||||||||
| Equity shares | 7.2 | 4.8 | 2.1 | 0.3 | 60 | (110 | ) | |||||||||||||||||
| 140.0 | 25.7 | 111.0 | 3.3 | 150 | (230 | ) | ||||||||||||||||||
| 2007 | ||||||||||||||||||||||||
| Assets | ||||||||||||||||||||||||
| Loans and advances | ||||||||||||||||||||||||
| – banks | 71.6 | — | 71.5 | 0.1 | — | — | ||||||||||||||||||
| – customers | 106.9 | — | 93.8 | 13.1 | 160 | (120 | ) | |||||||||||||||||
| Debt securities | 292.0 | 115.2 | 164.1 | 12.7 | 330 | (460 | ) | |||||||||||||||||
| Equity shares | 53.0 | 42.3 | 9.0 | 1.7 | 70 | (70 | ) | |||||||||||||||||
| Derivatives | 277.4 | 1.9 | 270.3 | 5.2 | 50 | (50 | ) | |||||||||||||||||
| Total assets | 800.9 | 159.4 | 608.7 | 32.8 | 610 | (700 | ) | |||||||||||||||||
| Liabilities | ||||||||||||||||||||||||
| Deposits by banks and customers | 133.4 | — | 132.0 | 1.4 | 10 | (10 | ) | |||||||||||||||||
| Debt securities in issue | 51.3 | — | 42.1 | 9.2 | 30 | (30 | ) | |||||||||||||||||
| Short positions | 73.5 | 63.6 | 9.9 | — | — | — | ||||||||||||||||||
| Derivatives | 272.1 | 2.1 | 265.6 | 4.4 | 70 | (70 | ) | |||||||||||||||||
Other financial liabilities (4) | 1.1 | — | 0.9 | 0.2 | 10 | (10 | ) | |||||||||||||||||
| Total liabilities | 531.4 | 65.7 | 450.5 | 15.2 | 120 | (120 | ) | |||||||||||||||||
Notes:
| (1) | Level 1: valued using unadjusted quoted prices in active markets, examples include G10 government securities, listed equity shares, certain exchange-traded derivatives and certain US agency securities. |
Level 2: includes most government agency securities, investment-grade corporate bonds, certain mortgage products, most bank and bridge loans, repos and reverse repos, less liquid listed equities, state and municipal obligations, most physical commodities, investment contracts issued by the Group’s life assurance businesses and certain money market securities and loan commitments and most OTC derivatives.
Level 3: includes cash instruments which trade infrequently, certain syndicated and commercial mortgage loans, unlisted equity shares, certain residual interests in securitisations, super senior tranches of high grade and mezzanine CDOs, other mortgage-based products and less liquid debt securities, certain structured debt securities in issue, and OTC derivatives where valuation depends upon unobservable inputs such as certain credit and exotic derivatives. No gain or loss is recognised on the initial recognition of a financial instrument valued using a technique incorporating significant unobservable data.
| (2) | Sensitivity represents the reasonably possible favourable and unfavourable effect respectively on the income statement or the statement of comprehensive income due to reasonably possible changes to valuations using reasonably possible alternative inputs to the Group’s valuation techniques or models. Totals for sensitivities are not indicative of the total potential effect on the income statement or the statement of comprehensive income. |
| (3) | Primarily includes debt securities issued by banks and building societies. |
| (4) | Comprise subordinated liabilities and write downs relating to undrawn syndicated loan facilities. |
240
Financial statements
Notes on the accounts
For each of the portfolio categories shown in the above table, set out below is a description of the types of products that comprise the portfolio and the valuation techniques that are applied in determining fair value, including a description of valuation techniques used for levels 2 and 3 and inputs to those models and techniques. Where reasonably possible alternative assumptions of unobservable inputs used in models would change the fair value of the portfolio significantly, the alternative inputs are indicated. Where there have been significant changes to valuation techniques during the year a discussion of the reasons for this are also included.
Loans and advances to customers
Loans in level 3 primarily comprise commercial mortgages.
Commercial mortgages
These senior and mezzanine commercial mortgages are loans secured on commercial land and buildings that were originated or acquired by the Group for securitisation. Senior commercial mortgages carry a variable interest rate and mezzanine or more junior commercial mortgages may carry a fixed or variable interest rate. Factors affecting the value of these loans may include, but are not limited to, loan type, underlying property type and geographic location, loan interest rate, loan to value ratios, debt service coverage ratios, prepayment rates, cumulative loan loss information, yields, investor demand, market volatility since the last securitisation, and credit enhancement. Where observable market prices for a particular loan are not available, the fair value will typically be determined with reference to observable market transactions in other loans or credit related products including debt securities and credit derivatives. Assumptions are made about the relationship between the loan and the available benchmark data.
Debt securities
RMBS
RMBS where the underlying assets are US agency-backed mortgages and there is regular trading are generally classified as level 2 in the fair value hierarchy. RMBS are also classified as level 2 when regular trading is not prevalent in the market, but similar executed trades or third-party data including indices, broker quotes and pricing services can be used to substantiate the fair value. RMBS are classified as level 3 when trading activity is not available and a model with significant unobservable data is utilised.
In determining whether an instrument is similar to that being valued, the Group considers a range of factors, principally: the lending standards of the brokers and underwriters that originated the mortgages, the lead manager of the security, the issue date of the respective securities, the underlying asset composition (including origination date, loan to value ratios, historic loss information and geographic location of the mortgages), the credit rating of the instrument, and any credit protection that the instrument may benefit from, such as insurance wraps or subordinated tranches. Where there are instances of market observable data for several similar RMBS tranches, the Group considers the extent of similar characteristics shared with the instrument being valued, together with the frequency, tenor and nature of the trades that have been observed. This method is most frequently used for US and UK RMBS. RMBS of Dutch and Spanish originated mortgages guaranteed by those governments are valued using the credit spreads of the respective government debt and certain assumptions made by the Group, or based on observable prices from Bloomberg or consensus pricing services.
The Group primarily uses an industry standard model to project the expected future cash flows to be received from the underlying mortgages and to forecast how these cash flows will be distributed to the various holders of the RMBS. This model utilises data provided by the servicer of the underlying mortgage portfolio, layering on assumptions for mortgage prepayments, probability of default, expected losses, and yield. The Group uses data from third-party sources to calibrate its assumptions, including pricing information from third party pricing services, independent research, broker quotes, and other independent sources. An assessment is made of third-party data source to determine its applicability and reliability. The Group adjusts the model price with a liquidity premium to reflect the price that the instrument could be traded in the market and may also make adjustments for model deficiencies.
The fair value of securities within each class of asset changes on a broadly consistent basis in response to changes in given market factors. However, the extent of the change, and therefore the range of reasonably possible alternative assumptions, may be either more or less pronounced, depending on the particular terms and circumstances of the individual security. The Group believes that probability of default was the least transparent input into Alt-A and prime RMBS modelled valuations (and most sensitive to variations).
Commercial mortgage backed securities
CMBS is valued using an industry standard model and the inputs, where possible, are corroborated using observable market data.
Collateralised debt obligations
CDOs purchased from third parties are valued using independent, third-party quotes or independent lead manager indicative prices. For super senior CDOs which have been originated by the Group no specific third-party information is available. The valuation of these super senior CDOs therefore takes into consideration outputs from a proprietary model, market data and appropriate valuation adjustments.
A collateral net asset value methodology using dealer buy side marks to determine an upper bound for super senior CDO valuations. An ABS index implied collateral valuation, is also used which provides a market calibrated valuation data point. Both the ABS index implied valuation and the collateral net asset value methodology apply an assumed immediate liquidation approach.
Collateralised loan obligations
To determine the fair value of CLOs purchased from third parties, the Group use third-party broker or lead manager quotes as the primary pricing source. These quotes are benchmarked to consensus pricing sources where they are available.
For CLOs originated and still held by the Group, the fair value is determined using a correlation model based on a Monte Carlo simulation framework. The main model inputs are credit spreads and recovery rates of the underlying assets and their correlation. A credit curve is assigned to each underlying asset based on prices, from third-party dealer quotes, and cash flow profiles, sourced from an industry standard model. Losses are calculated taking into account the attachment and detachment point of the exposure. Where the correlation inputs to this model are not observable CLOs are deemed to be level 3.
241
Notes on the accounts continued
11 Financial instruments continued
Other asset-backed and corporate debt securities
Where observable market prices for a particular debt security are not available, the fair value will typically be determined with reference to observable market transactions in other related products, such as similar debt securities or credit derivatives. Assumptions are made about the relationship between the individual debt security and the available benchmark data. Where significant management judgement has been applied in identifying the most relevant related product, or in determining the relationship between the related product and the instrument itself, the valuation is shown in level 3.
Equity shares
Private equity investments include unit holdings and limited partnership interests primarily in corporate private equity funds, debt funds and fund of hedges funds. Externally managed funds are valued using recent prices where available. Where not available, the fair value of investments in externally managed funds is generally determined using statements or other information provided by the fund managers.
The Group considers that valuations may rely significantly on the judgements and estimates made by the fund managers, particularly in assessing private equity components. Given the decline in liquidity in world markets, and the level of subjectivity, these are included in level 3.
Derivatives
Derivatives are priced using quoted prices for the same or similar instruments where these are available. However, the majority of derivatives are valued using pricing models. Inputs for these models are usually observed directly in the market, or derived from observed prices. However, it is not always possible to observe or corroborate all model inputs. Unobservable inputs used are based on estimates taking into account a range of available information including historic analysis, historic traded levels, market practice, comparison to other relevant benchmark observable data and consensus pricing data.
Credit derivatives – APS
The Group has purchased credit protection over a portfolio of specified assets and exposures (covered assets) from HMT with a par value of £282 billion. The protection is subject to a first loss of £60 billion and covers 90% of subsequent losses. Once a covered asset has experienced a trigger event, losses and recoveries in respect of that asset are included in the balance receivable under the APS. Receipts from HMT will, over time, amount to 90% of cumulative losses (net of cumulative recoveries) on the portfolio of covered assets less the first loss amount.
The Group has a right to terminate the APS at any time provided that the Financial Services Authority has confirmed in writing to HMT that it has no objection to the proposed termination. On termination the Group must pay HMT the higher of the regulatory capital relief received and £2.5 billion less premiums paid plus the aggregate of amounts received from the UK Government under the APS. In consideration for the protection provided by the APS, the Group paid an initial premium of £1.4 billion on 31 December 2009. A further premium of £700 million is payable on 3 December 2010 and subsequently annual premiums of £500 million until the earlier of 2099 and the termination of the agreement.
The APS is a single contract providing credit protection in respect of the covered assets. Under IFRS, credit protection is treated either as a financial guarantee contract or as a derivative financial instrument depending on the terms of the agreement and the nature of the protected assets and exposures. The Group has concluded, principally because the covered portfolio includes significant exposure in the form of derivatives, that the APS does not meet the criteria to be treated as a financial guarantee contract. The contract has therefore been accounted for as a derivative financial instrument. It was recognised initially and measured subsequently at fair value with changes in fair value recognised in profit or loss. There is no change in the recognition and measurement of the covered assets as a result of the APS.
Where protection is provided on a particular seniority of exposure, as is the case with the APS, which requires initial losses to be taken by the Group, it is termed “tranched” protection. The model being used to value the APS – Gaussian Copula model with stochastic recoveries is used by the Group to value tranches traded by the exotic credit desk and is a model that is currently used within the wider market.
The option to exit the APS is not usually present in such tranched trades and consequently, there is no standard market practice for reflecting this part of the trade within the standard model framework. The approach that has been adopted assumes that the Group will not exit the trade before the minimum level of fees has been paid and at this point it will be clear whether it should exit the trade or not. The APS derivative is valued as the payment of the minimum level of fees in return for protection receipts which are in excess of both the first loss and the total future premiums.
The model primarily uses the following information, obtained in relation to each individual asset: notional, maturity, probability of default and expected recovery rate given default. Other required information is the correlation between the underlying assets; and the size of the first loss.
The APS protects a wide range of asset types, and hence, the correlation between the underlying assets cannot be observed from market data. In the absence of this, the Group determines a reasonable level for this input. The expected recovery rate given default is based on internally assessed levels. The probability of default is calculated with reference to data observable in the market. Where possible, data is obtained for each asset within the APS, but for most of the assets, such observable data does not exist. Therefore, this important input is determined from information available for portfolios of similarly rated entities. As the inputs into the valuation model are not all observable the APS derivative is a level 3 asset. The value of the credit protection at 31 December 2009 was £1.4 billion, representing the initial premium paid at 31 December 2009.
242
Financial statements
Notes on the accounts
The Group has used the following reasonably possible alternative assumptions in relation to those inputs that could have significant effect on the valuation of the APS CDS:
● | correlation: +/- 10% |
● | expected losses on covered assets that have triggered: +/- £1 billion |
● | range of possible recovery rates on non-triggered assets: +/- 10% |
● | credit spreads: +/- 10 basis points |
Using the above reasonably possible alternative assumptions, the fair value of the APS derivative could be higher by approximately £1,370 million or lower by approximately £1,540 million.
Credit derivatives – other
The Group’s other credit derivatives include vanilla and bespoke portfolio tranches, gap risk products and certain other unique trades. The bespoke portfolio tranches are synthetic tranches referenced to a bespoke portfolio of corporate names on which the Group purchases credit protection. Bespoke portfolio tranches are valued using Gaussian Copula, a standard method which uses observable market inputs (credit spreads, index tranche prices and recovery rates) to generate an output price for the tranche via a mapping methodology. In essence this method takes the expected loss of the tranche expressed as a fraction of the expected loss of the whole underlying portfolio and calculates which detachment point on the liquid index, and hence which correlation level, coincides with this expected loss fraction. Where the inputs into this valuation technique are observable in the market, bespoke tranches are considered to be level 2 assets. Where inputs are not observable, bespoke tranches are considered to be level 3 assets. However, all transactions executed with a CDPC counterparty are considered level 3 as the counterparty credit risk assessment is a significant component of these valuations.
Gap risk products are leveraged trades, with the counterparty’s potential loss capped at the amount of the initial principal invested. Gap risk is the probability that the market will move discontinuously too quickly to exit a portfolio and return the principal to the counterparty without incurring losses, should an unwind event be triggered. This optionality is embedded within these portfolio structures and is very rarely traded outright in the market. Gap risk is not observable in the markets and, as such, these structures are deemed to be level 3 instruments.
Other unique trades are valued using a specialised model for each instrument and the same market data inputs as all other trades where applicable. By their nature, the valuation is also driven by a variety of other model inputs, many of which are unobservable in the market. Where these instruments have embedded optionality it is valued using a variation of the Black-Scholes option pricing formula, and where they have correlation exposure it is valued using a variant of the Gaussian Copula model. The volatility or unique correlation inputs required to value these products are generally unobservable and the instruments are therefore deemed to be level 3 instruments.
Equity derivatives
Equity derivative products are split into equity exotic derivatives and equity hybrids. Equity exotic derivatives have payouts based on the performance of one or more stocks, equity funds or indices. Most payouts are based on the performance of a single asset and are valued using observable market option data. Unobservable equity derivative trades are typically complex basket options on stocks. Such basket option payouts depend on the performance of more than one equity asset and require correlations for their valuation. Valuation is then performed using industry standard valuation models, with unobservable correlation inputs calculated by reference to correlations observed between similar underlyings.
Equity hybrids have payouts based on the performance of a basket of underlyings where the underlyings are from different asset classes. Correlations between these different underlyings are typically unobservable with no market information for closely related assets available. Where no market for the correlation input exists, these inputs are based on historical time series.
Interest rate and commodity derivatives
Interest rate and commodity options provide a payout (or series of payouts) linked to the performance of one or more underlying, including interest rates, foreign exchange rates and commodities.
Exotic options do not trade in active markets except in a small number of cases. Consequently, the Group uses models to determine fair value using valuation techniques typical for the industry. These techniques can be divided, firstly, into modelling approaches and, secondly, into methods of assessing appropriate levels for model inputs. The Group uses a variety of proprietary models for valuing exotic trades.
Exotic valuation inputs include correlation between interest rates, foreign exchange rates and commodity prices. Correlations for more liquid rate pairs are valued using independently sourced consensus pricing levels. Where a consensus pricing benchmark is unavailable, these instruments are categorised as level 3.
Debt securities in issue
The carrying value of debt securities in issue is represented partly by underlying cash and partly through a derivative component. The classification of the amount in level 3 is driven by the derivative component and not by the cash element.
Other financial instruments
Other than the portfolios discussed above, there are other financial instruments which are held at fair value determined from data which are not market observable, or incorporating material adjustments to market observed data. These include subordinated liabilities and write downs relating to undrawn syndicated loan facilities.
243
Notes on the accounts continued
11 Financial instruments continued
Level 3 portfolio movement table
| Gains or | Gains or | |||||||||||||||||||||||||||||||||||
| losses | losses | |||||||||||||||||||||||||||||||||||
| recognised | relating to | |||||||||||||||||||||||||||||||||||
| At | in the income | Transfers | Purchases | At 31 | instruments | |||||||||||||||||||||||||||||||
| 1 January | statement | in/out of | Reclass- | and | Sales and | Foreign | December | held at | ||||||||||||||||||||||||||||
| 2009 | or SOCI (1) | Level 3 | ification | issues | settlements | exchange | 2009 | year end | ||||||||||||||||||||||||||||
| £m | £m | £m | £m | £m | £m | £m | £m | £m | ||||||||||||||||||||||||||||
| Assets | ||||||||||||||||||||||||||||||||||||
FVTPL(2): | ||||||||||||||||||||||||||||||||||||
| Loans and advances | 3,148 | 130 | 330 | (1,537 | ) | 22 | (898 | ) | (136 | ) | 1,059 | 11 | ||||||||||||||||||||||||
| Debt securities | 3,846 | (49 | ) | 104 | (157 | ) | 378 | (1,207 | ) | (133 | ) | 2,782 | (165 | ) | ||||||||||||||||||||||
| Equity shares | 793 | (49 | ) | 133 | — | 22 | (151 | ) | (37 | ) | 711 | (48 | ) | |||||||||||||||||||||||
| Derivatives | 10,265 | (3,672 | ) | (211 | ) | — | 1,811 | (1,301 | ) | (463 | ) | 6,429 | (1,079 | ) | ||||||||||||||||||||||
| FVTPL assets | 18,052 | (3,640 | ) | 356 | (1,694 | ) | 2,233 | (3,557 | ) | (769 | ) | 10,981 | (1,281 | ) | ||||||||||||||||||||||
AFS(3): | ||||||||||||||||||||||||||||||||||||
| Debt securities | 3,102 | (376 | ) | (929 | ) | — | 128 | (491 | ) | (109 | ) | 1,325 | (9 | ) | ||||||||||||||||||||||
| Equity shares | 325 | (141 | ) | 632 | — | 53 | (75 | ) | (45 | ) | 749 | (51 | ) | |||||||||||||||||||||||
| AFS assets | 3,427 | (517 | ) | (297 | ) | — | 181 | (566 | ) | (154 | ) | 2,074 | (60 | ) | ||||||||||||||||||||||
| Total assets | 21,479 | (4,157 | ) | 59 | (1,694 | ) | 2,414 | (4,123 | ) | (923 | ) | 13,055 | (1,341 | ) | ||||||||||||||||||||||
| Liabilities | ||||||||||||||||||||||||||||||||||||
| Deposits | 290 | 43 | (217 | ) | — | 15 | (23 | ) | (5 | ) | 103 | — | ||||||||||||||||||||||||
| Debt securities in issue | 4,362 | 57 | (1,682 | ) | — | 493 | (638 | ) | (247 | ) | 2,345 | (41 | ) | |||||||||||||||||||||||
| Short positions | 41 | (45 | ) | 188 | — | 4 | (4 | ) | — | 184 | 12 | |||||||||||||||||||||||||
| Derivatives | 4,035 | (215 | ) | (978 | ) | — | 76 | (744 | ) | (187 | ) | 1,987 | (244 | ) | ||||||||||||||||||||||
| Other financial liabilities | 257 | — | — | — | — | (242 | ) | (14 | ) | 1 | — | |||||||||||||||||||||||||
| Total liabilities | 8,985 | (160 | ) | (2,689 | ) | — | 588 | (1,651 | ) | (453 | ) | 4,620 | (273 | ) | ||||||||||||||||||||||
Notes:
| (1) | Net losses recognised in the income statement and statement of comprehensive income were £4,257 million and £60 million respectively. Net losses on FVTPL assets and liabilities of £3,800 million were included in income from trading activities. £457 million net losses relating to AFS assets were recorded within interest income, dividend income and impairment losses as appropriate. |
| (2) | FVTPL: Fair value through profit or loss. |
| (3) | AFS: Available-for-sale. |
Assets reduced in the year due to disposals, write downs, transfers and reclassifications. Decrease in loans and advances to customers of £2,089 million primarily reflected the reclassification of certain leveraged and real estate finance loans from held-for-trading to loans and receivables in first half of the year. The decrease in debt securities of £2,841 million reflects wind-down of the US fund derivative portfolio, £929 million of available-for-sale debt securities transferred to level 2 due to increased observability as well as liquidations and write-downs. Derivative assets included hedges with CDPCs, illiquid credit and interest rate derivatives.
The decrease in debt securities in issue is due to a transfer to level 2 of £1,600 million of constant proportion portfolio insurance notes reflecting the minimal residual equity component within these notes at 31 December 2009.
Sales and settlements include £577 million of derivative assets and £437 million of derivative liabilities relating to Sempra included in disposal groups in 2009.
Additionally, £1,533 million of non-G10 government debt securities, foreign exchange derivatives (assets – £1,846 million, liabilities – £1,836 million) were transferred from level 1 to level 2 reflecting refinements of hierarchy level classification in 2009.
244
Financial statements
Notes on the accounts
Fair value of financial instruments not carried at fair value
The following table shows the carrying values and the fair values of financial instruments carried on the balance sheet at amortised cost.
| Group | ||||||||||||||||||||||||
| 2009 | 2009 | 2008 | 2008 | 2007 | 2007 | |||||||||||||||||||
| Carrying | Fair | Carrying | Fair | Carrying | Fair | |||||||||||||||||||
| value | value | value | value | value | value | |||||||||||||||||||
| £bn | £bn | £bn | £bn | £bn | £bn | |||||||||||||||||||
| Financial assets | ||||||||||||||||||||||||
| Cash and balances at central banks | 52.3 | 52.3 | 12.4 | 12.4 | 17.9 | 17.9 | ||||||||||||||||||
| Loans and advances to banks | 46.3 | 46.0 | 82.0 | 81.9 | 147.8 | 147.8 | ||||||||||||||||||
| Loans and advances to customers | 684.1 | 650.9 | 821.1 | 776.1 | 721.7 | 723.7 | ||||||||||||||||||
| Debt securities | 9.9 | 9.0 | 13.0 | 11.5 | 2.7 | 2.6 | ||||||||||||||||||
| Settlement balances | 12.0 | 12.0 | 17.8 | 17.8 | 16.6 | 16.6 | ||||||||||||||||||
| Financial liabilities | ||||||||||||||||||||||||
| Deposits by banks | 88.5 | 88.3 | 176.9 | 176.3 | 246.8 | 246.6 | ||||||||||||||||||
| Customer accounts | 552.8 | 552.1 | 575.5 | 576.4 | 614.4 | 614.1 | ||||||||||||||||||
| Debt securities in issue | 222.1 | 218.5 | 248.8 | 241.3 | 222.9 | 222.8 | ||||||||||||||||||
| Settlement balances | 10.4 | 10.4 | 11.7 | 11.7 | 17.5 | 17.5 | ||||||||||||||||||
| Subordinated liabilities | 36.4 | 31.6 | 47.6 | 36.4 | 37.1 | 35.8 | ||||||||||||||||||
The fair value of subordinated liabilities of the company as at 31 December 2009 is £4.9 billion compared to a carrying value of £8.8 billion (2008 – £8.8 billion fair value on a carrying value of £10.3 billion; 2007 – £7.0 billion fair value on a carrying value £7.7 billion). The fair value of other financial assets and liabilities of the company are not materially different from their carrying values.
The fair value is the amount for which an asset could be exchanged, or a liability settled, between knowledgeable, willing parties in an arm’s length transaction. Quoted market values are used where available; otherwise, fair values have been estimated based on discounted expected future cash flows and other valuation techniques. These techniques involve uncertainties and require assumptions and judgments covering prepayments, credit risk and discount rates. Changes in these assumptions would significantly affect estimated fair values. The fair values reported would not necessarily be realised in an immediate sale or settlement. As a wide range of valuation techniques is available, it may be inappropriate to compare the Group’s fair value information to independent markets or other financial institutions’ fair values.
The fair values of intangible assets, such as core deposits, credit card and other customer relationships are not included in the calculation of these fair values since these are not financial instruments.
The assumptions and methodologies underlying the calculation of fair values of financial instruments at the balance sheet date are set out below:
The fair value of financial instruments which are of short maturity (3 months or less) approximates their carrying value. This applies mainly to cash and balances at central banks, items in the course of collection from other banks, settlement balances, items in the course of transmission to other banks and demand deposits.
Loans and advances to banks and customers
Fair value is estimated by grouping loans into homogeneous portfolios and applying a discount rate to the cash flows. The discount rate is based on the market rate applicable at the balance sheet date for a similar portfolio with similar maturity and credit risk characteristics.
Debt securities
Fair values are determined using quoted prices where available or by reference to quoted prices of similar instruments.
Deposits by banks and customer accounts
The fair values of deposits are estimated using discounted cash flow valuation techniques.
Debt securities in issue and subordinated liabilities
Fair values are determined using quoted prices where available or by reference to valuation techniques and adjusting for own credit spreads where appropriate.
245
Notes on the accounts continued
11 Financial instruments continued
Remaining maturity
The following table shows the residual maturity of financial instruments, based on contract date of maturity.
| Group | ||||||||||||||||||||||||||||||||||||
| 2009 | 2008 | 2007 | ||||||||||||||||||||||||||||||||||
| Less than | More than | Less than | More than | Less than | More than | |||||||||||||||||||||||||||||||
| 12 months | 12 months | Total | 12 months | 12 months | Total | 12 months | 12 months | Total | ||||||||||||||||||||||||||||
| £m | £m | £m | £m | £m | £m | £m | £m | £m | ||||||||||||||||||||||||||||
| Assets | ||||||||||||||||||||||||||||||||||||
| Cash and balances | ||||||||||||||||||||||||||||||||||||
| at central banks | 52,229 | 32 | 52,261 | 12,364 | 36 | 12,400 | 17,866 | — | 17,866 | |||||||||||||||||||||||||||
| Loans and advances to banks | 89,622 | 2,131 | 91,753 | 133,565 | 4,632 | 138,197 | 187,969 | 31,491 | 219,460 | |||||||||||||||||||||||||||
| Loans and advances to customers | 227,745 | 500,648 | 728,393 | 338,751 | 535,971 | 874,722 | 395,753 | 432,785 | 828,538 | |||||||||||||||||||||||||||
| Debt securities | 69,197 | 198,057 | 267,254 | 69,912 | 197,637 | 267,549 | 70,088 | 224,568 | 294,656 | |||||||||||||||||||||||||||
| Equity shares | — | 19,528 | 19,528 | — | 26,330 | 26,330 | — | 53,026 | 53,026 | |||||||||||||||||||||||||||
| Settlement balances | 12,022 | 11 | 12,033 | 17,795 | 37 | 17,832 | 16,561 | 28 | 16,589 | |||||||||||||||||||||||||||
| Derivatives | 70,537 | 370,917 | 441,454 | 184,278 | 808,281 | 992,559 | 50,841 | 226,561 | 277,402 | |||||||||||||||||||||||||||
| Liabilities | ||||||||||||||||||||||||||||||||||||
| Deposits by banks | 135,641 | 6,503 | 142,144 | 248,896 | 9,148 | 258,044 | 302,934 | 9,360 | 312,294 | |||||||||||||||||||||||||||
| Customer accounts | 586,628 | 27,574 | 614,202 | 611,047 | 28,465 | 639,512 | 650,685 | 31,678 | 682,363 | |||||||||||||||||||||||||||
| Debt securities in issue | 140,826 | 126,742 | 267,568 | 174,507 | 125,782 | 300,289 | 156,020 | 118,152 | 274,172 | |||||||||||||||||||||||||||
| Settlement balances | ||||||||||||||||||||||||||||||||||||
| and short positions | 17,952 | 32,924 | 50,876 | 24,448 | 29,829 | 54,277 | 44,466 | 46,555 | 91,021 | |||||||||||||||||||||||||||
| Derivatives | 71,625 | 352,516 | 424,141 | 175,908 | 795,456 | 971,364 | 54,624 | 217,428 | 272,052 | |||||||||||||||||||||||||||
| Subordinated liabilities | 2,144 | 35,508 | 37,652 | 3,394 | 45,760 | 49,154 | 1,896 | 36,147 | 38,043 | |||||||||||||||||||||||||||
| Company | ||||||||||||||||||||||||||||||||||||
| 2009 | 2008 | 2007 | ||||||||||||||||||||||||||||||||||
| Less than | More than | Less than | More than | Less than | More than | |||||||||||||||||||||||||||||||
| 12 months | 12 months | Total | 12 months | 12 months | Total | 12 months | 12 months | Total | ||||||||||||||||||||||||||||
| £m | £m | £m | £m | £m | £m | £m | £m | £m | ||||||||||||||||||||||||||||
| Assets | ||||||||||||||||||||||||||||||||||||
| Loans and advances to banks | 16,447 | 14,791 | 31,238 | 16,096 | 10,935 | 27,031 | 1,655 | 6,031 | 7,686 | |||||||||||||||||||||||||||
| Loans and advances to customers | — | 2,777 | 2,777 | — | — | — | 307 | — | 307 | |||||||||||||||||||||||||||
| Debt securities | 52 | 1,234 | 1,286 | — | — | — | — | — | — | |||||||||||||||||||||||||||
| Settlement balances | 11 | — | 11 | — | — | — | — | — | — | |||||||||||||||||||||||||||
| Derivatives | 80 | 1,089 | 1,169 | 221 | 947 | 1,168 | 127 | 46 | 173 | |||||||||||||||||||||||||||
| Liabilities | ||||||||||||||||||||||||||||||||||||
| Deposits by banks | 93 | — | 93 | 1,802 | — | 1,802 | 5,572 | — | 5,572 | |||||||||||||||||||||||||||
| Customer accounts | 13,264 | — | 13,264 | 26 | — | 26 | — | — | — | |||||||||||||||||||||||||||
| Debt securities in issue | 4,965 | 6,823 | 11,788 | 7,253 | 6,926 | 14,179 | 8,855 | 4,598 | 13,453 | |||||||||||||||||||||||||||
| Derivatives | 53 | 393 | 446 | 227 | 134 | 361 | 102 | 77 | 179 | |||||||||||||||||||||||||||
| Subordinated liabilities | 130 | 8,632 | 8,762 | 424 | 9,890 | 10,314 | 119 | 7,624 | 7,743 | |||||||||||||||||||||||||||
246
Financial statements
Notes on the accounts
The following tables show, by contractual maturity, the undiscounted cash flows payable up to a period of 20 years from the balance sheet date, including future payments of interest.
On balance sheet liabilities
| Group | ||||||||||||||||||||||||
| 0-3 months | 3-12 months | 1-3 years | 3-5 years | 5-10 years | 10-20 years | |||||||||||||||||||
| 2009 | £m | £m | £m | £m | £m | £m | ||||||||||||||||||
| Deposits by banks | 65,966 | 15,541 | 3,934 | 2,301 | 632 | 12 | ||||||||||||||||||
| Customer accounts | 521,400 | 15,619 | 5,944 | 4,221 | 8,490 | 4,392 | ||||||||||||||||||
| Debt securities in issue | 100,220 | 49,300 | 56,869 | 25,915 | 27,326 | 3,819 | ||||||||||||||||||
| Derivatives held for hedging | 660 | 1,566 | 3,232 | 1,264 | 1,674 | 1,508 | ||||||||||||||||||
| Subordinated liabilities | 1,929 | 1,892 | 3,654 | 4,963 | 20,157 | 6,105 | ||||||||||||||||||
| Settlement balances and other liabilities | 12,048 | 100 | 139 | 104 | 239 | 83 | ||||||||||||||||||
| 702,223 | 84,018 | 73,772 | 38,768 | 58,518 | 15,919 | |||||||||||||||||||
| Guarantees and commitments – notional amount | ||||||||||||||||||||||||
Guarantees (1) | 39,952 | — | — | — | — | — | ||||||||||||||||||
Commitments (2) | 291,634 | — | — | — | — | — | ||||||||||||||||||
| 331,586 | — | — | — | — | — | |||||||||||||||||||
| 2008 | ||||||||||||||||||||||||
| Deposits by banks | 154,614 | 14,347 | 3,345 | 2,754 | 2,048 | 34 | ||||||||||||||||||
| Customer accounts | 523,268 | 33,450 | 6,577 | 6,337 | 7,298 | 5,319 | ||||||||||||||||||
| Debt securities in issue | 131,714 | 48,652 | 40,067 | 38,223 | 38,667 | 5,626 | ||||||||||||||||||
| Derivatives held for hedging | 394 | 2,216 | 2,543 | 1,334 | 2,682 | 1,373 | ||||||||||||||||||
| Subordinated liabilities | 1,753 | 4,271 | 6,824 | 5,793 | 24,503 | 13,030 | ||||||||||||||||||
| Settlement balances and other liabilities | 13,351 | 5 | 12 | 6 | 10 | 6 | ||||||||||||||||||
| 825,094 | 102,941 | 59,368 | 54,447 | 75,208 | 25,388 | |||||||||||||||||||
Notes:
| (1) | The Group is only called upon to satisfy a guarantee when the guaranteed party fails to meet its obligations. The Group expects most guarantees it provides to expire unused. |
| (2) | The Group has given commitments to provide funds to customers under undrawn formal facilities, credit lines and other commitments to lend subject to certain conditions being met by the counterparty. The Group does not expect all facilities to be drawn, and some may lapse before drawdown. |
| Company | ||||||||||||||||||||||||
| 0-3 months | 3-12 months | 1-3 years | 3-5 years | 5-10 years | 10-20 years | |||||||||||||||||||
| 2009 | £m | £m | £m | £m | £m | £m | ||||||||||||||||||
| Deposits by banks | 93 | — | — | — | — | — | ||||||||||||||||||
| Customer accounts | 964 | 12,337 | — | — | — | — | ||||||||||||||||||
| Debt securities in issue | 3,132 | 2,080 | 2,732 | 3,615 | 1,255 | — | ||||||||||||||||||
| Derivatives held for hedging | (5 | ) | (23 | ) | (19 | ) | 13 | 64 | — | |||||||||||||||
| Subordinated liabilities | 106 | 406 | 1,146 | 2,010 | 2,634 | 3,923 | ||||||||||||||||||
| 4,290 | 14,800 | 3,859 | 5,638 | 3,953 | 3,923 | |||||||||||||||||||
| 2008 | ||||||||||||||||||||||||
| Deposits by banks | 116 | 1,707 | — | — | — | — | ||||||||||||||||||
| Debt securities in issue | 4,448 | 3,105 | 1,334 | 6,105 | — | — | ||||||||||||||||||
| Derivatives held for hedging | 186 | 16 | 30 | 1 | — | — | ||||||||||||||||||
| Subordinated liabilities | 158 | 458 | 1,464 | 1,376 | 4,241 | 5,149 | ||||||||||||||||||
| 4,908 | 5,286 | 2,828 | 7,482 | 4,241 | 5,149 | |||||||||||||||||||
The tables above show the timing of cash outflows to settle financial liabilities. They have been prepared on the following basis:
Financial liabilities are included at the earliest date on which the counterparty can require repayment regardless of whether or not such early repayment results in a penalty. If repayment is triggered by, or is subject to, specific criteria such as market price hurdles being reached, the liability is included at the earliest possible date that the conditions could be fulfilled without considering the probability of the conditions being met. For example, if a structured note is automatically prepaid when an equity index exceeds a certain level, the cash outflow will be included in the less than three months’ period whatever the level of the index at the year end. The settlement date of debt securities in issue issued by certain securitisation vehicles consolidated by the Group depends on when cash flows are received from the securitised assets. Where these assets are prepayable, the timing of the cash outflow relating to securities assumes that each asset will be prepaid at the earliest possible date.
Liabilities with a contractual maturity of greater than 20 years – the principal amounts of financial liabilities that are repayable after 20 years or where the counterparty has no right to repayment of the principal are excluded from the table as are interest payments after 20 years.
Held-for-trading assets and liabilities – held-for-trading assets and liabilities amounting to £650.5 billion (assets) and £568.5 billion (liabilities) (2008 – £1,226.8 billion assets and £1,146.7 billion liabilities) have been excluded from the table in view of their short term nature.
247
Notes on the accounts continued
12 Financial assets – impairments
The following table shows the movement in the provision for impairment losses for loans and advances.
| Group | ||||||||||||||||||||||||
| Individually | Collectively | Total | ||||||||||||||||||||||
| assessed | assessed | Latent | 2009 | 2008 | 2007 | |||||||||||||||||||
| £m | £m | £m | £m | £m | £m | |||||||||||||||||||
| At 1 January | 4,970 | 4,102 | 1,944 | 11,016 | 6,452 | 3,935 | ||||||||||||||||||
| Transfer to disposal groups | (155 | ) | (111 | ) | (58 | ) | (324 | ) | (767 | ) | — | |||||||||||||
| Currency translation and other adjustments | (330 | ) | (78 | ) | (122 | ) | (530 | ) | 1,441 | 137 | ||||||||||||||
| Acquisition of subsidiaries | — | — | — | — | — | 2,221 | ||||||||||||||||||
| Disposal of subsidiaries | (65 | ) | — | — | (65 | ) | (178 | ) | — | |||||||||||||||
| Net increase in provisions of discontinued operations | — | — | — | — | — | 46 | ||||||||||||||||||
| Amounts written-off | (3,940 | ) | (2,999 | ) | — | (6,939 | ) | (3,148 | ) | (2,011 | ) | |||||||||||||
| Recoveries of amounts previously written-off | 94 | 305 | — | 399 | 319 | 342 | ||||||||||||||||||
| Charged to the income statement | 8,625 | 4,197 | 1,312 | 14,134 | 7,091 | 1,946 | ||||||||||||||||||
| Unwind of discount | (246 | ) | (162 | ) | — | (408 | ) | (194 | ) | (164 | ) | |||||||||||||
At 31 December (1) | 8,953 | 5,254 | 3,076 | 17,283 | 11,016 | 6,452 | ||||||||||||||||||
Notes:
| (1) | The provision for impairment losses at 31 December 2009 includes £157 million relating to loans and advances to banks (2008 – £127 million; 2007 – £3 million). |
| (2) | There is no provision for impairment losses in the company. |
| Group | ||||||||||||
| 2009 | 2008 | 2007 | ||||||||||
| Impairment losses charged to the income statement | £m | £m | £m | |||||||||
| Loans and advances to customers | 14,100 | 6,973 | 1,946 | |||||||||
| Loans and advances to banks | 34 | 118 | — | |||||||||
| 14,134 | 7,091 | 1,946 | ||||||||||
| Debt securities | 601 | 878 | 20 | |||||||||
| Equity shares | 215 | 103 | 2 | |||||||||
| 816 | 981 | 22 | ||||||||||
| 14,950 | 8,072 | 1,968 | ||||||||||
| Group | ||||||||||||
| 2009 | 2008 | 2007 | ||||||||||
| £m | £m | £m | ||||||||||
Gross income not recognised but which would have been recognised under the original terms of non-accrual and restructured loans | ||||||||||||
| Domestic | 625 | 393 | 390 | |||||||||
| Foreign | 1,079 | 342 | 155 | |||||||||
| 1,704 | 735 | 545 | ||||||||||
| Interest on non-accrual and restructured loans included in net interest income | ||||||||||||
| Domestic | 226 | 150 | 165 | |||||||||
| Foreign | 182 | 43 | 16 | |||||||||
| 408 | 193 | 181 | ||||||||||
248
Financial statements
Notes on the accounts
The following tables show an analysis of impaired financial assets.
| Group | ||||||||||||||||||||||||||||||||||||
| 2009 | 2008 | 2007 | ||||||||||||||||||||||||||||||||||
| Carrying | Carrying | Carrying | ||||||||||||||||||||||||||||||||||
| Cost | Provision | value | Cost | Provision | value | Cost | Provision | value | ||||||||||||||||||||||||||||
| £m | £m | £m | £m | £m | £m | £m | £m | £m | ||||||||||||||||||||||||||||
| Loans and receivables | ||||||||||||||||||||||||||||||||||||
Loans and advances to banks (1) | 206 | 157 | 49 | 129 | 127 | 2 | 25 | 3 | 22 | |||||||||||||||||||||||||||
Loans and advances to customers (2) | 34,801 | 14,050 | 20,751 | 19,350 | 8,945 | 10,405 | 10,337 | 5,399 | 4,938 | |||||||||||||||||||||||||||
| 35,007 | 14,207 | 20,800 | 19,479 | 9,072 | 10,407 | 10,362 | 5,402 | 4,960 | ||||||||||||||||||||||||||||
| Group | ||||||||||||
| Carrying | Carrying | Carrying | ||||||||||
| Value | Value | Value | ||||||||||
| 2009 | 2008 | 2007 | ||||||||||
| £m | £m | £m | ||||||||||
| Available-for-sale | ||||||||||||
| Debt securities | 758 | 618 | 1 | |||||||||
| Equity shares | 180 | 87 | 72 | |||||||||
| 938 | 705 | 73 | ||||||||||
Notes:
| (1) | Impairment provisions individually assessed. |
| (2) | Impairment provisions individually assessed on balances of £24,540 million (2008 – £11,313 million; 2007 – £3,178 million). |
The Group holds collateral in respect of certain loans and advances to banks and to customers that are past due or impaired. Such collateral includes mortgages over property (both personal and commercial); charges over business assets such as plant, inventories and trade debtors; and guarantees of lending from parties other than the borrower. The following table shows financial and non-financial assets, recognised on the Group's balance sheet, obtained during the year by taking possession of collateral or calling on other credit enhancements.
| Group | ||||||||||||
| 2009 | 2008 | 2007 | ||||||||||
| £m | £m | £m | ||||||||||
| Residential property | 52 | 41 | 32 | |||||||||
| Other property | 110 | 6 | 8 | |||||||||
| Cash | 283 | 59 | 18 | |||||||||
| Other assets | 42 | 30 | 5 | |||||||||
| 487 | 136 | 63 | ||||||||||
In general, the Group seeks to dispose of property and other assets not readily convertible into cash obtained by taking possession of collateral as rapidly as the market for the individual asset permits.
Loans that have been renegotiated in the past 12 months that would otherwise have been past due or impaired amounted to £2,698 million as at 31 December 2009 (2008 – £2,637 million; 2007 – £930 million).
249
Notes on the accounts continued
13 Derivatives
Companies in the Group transact derivatives as principal either as a trading activity or to manage balance sheet foreign exchange, interest rate and credit risk.
The Group enters into fair value hedges, cash flow hedges and hedges of net investments in foreign operations. The majority of the Group’s interest rate hedges relate to the management of the Group’s non-trading interest rate risk. The Group manages this risk to Value-at-Risk limits. The risk is assessed using gap reports that show maturity mismatches. To the extent that such mismatches exceed predetermined limits they are closed by executing derivatives principally interest rate swaps. Suitable larger ticket financial instruments are fair value hedged; the remaining exposure, where possible, is hedged by derivatives documented as cash flow hedges and qualifying for hedge accounting. The majority of the Group’s fair value hedges involve interest rate swaps hedging the interest rate risk in recognised financial assets and financial liabilities. Cash flow hedges relate to exposure to variability in future interest payments and receipts on forecast transactions and on recognised financial assets and financial liabilities. The Group hedges its net investments in foreign operations with currency borrowings and forward foreign exchange contracts.
For cash flow hedge relationships of interest rate risk, the hedged items are actual and forecast variable interest rate cash flows arising from financial assets and financial liabilities with interest rates linked to LIBOR, EURIBOR or the Bank of England Official Bank Rate. The financial assets are customer loans and the financial liabilities are customer deposits and LIBOR linked medium-term notes and other issued securities. As at 31 December 2009, variable rate financial assets of £47.9 billion and variable rate financial liabilities of £49.9 billion were hedged in such cash flow hedge relationships.
For cash flow hedging relationships, the initial and ongoing prospective effectiveness is assessed by comparing movements in the fair value of the expected highly probable forecast interest cash flows with movements in the fair value of the expected changes in cash flows from the hedging interest rate swap or by comparing the respective changes in the price value of a basis point. Prospective effectiveness is measured on a cumulative basis i.e. over the entire life of the hedge relationship. The method of calculating hedge ineffectiveness is the hypothetical derivative method. Retrospective effectiveness is assessed by comparing the actual movements in the fair value of the cash flows and actual movements in the fair value of the hedged cash flows from the interest rate swap over the life to date of the hedging relationship.
Exchange rate contracts in cash flow hedge relationships hedge future foreign currency cash inflow and outflows; mainly principal and interest on foreign currency loans.
For fair value hedge relationships of interest rate risk, the hedged items are typically large corporate fixed-rate loans, fixed-rate finance leases, fixed-rate medium-term notes or preference shares classified as debt. As at 31 December 2009 fixed rate financial assets of £53.7 billion and fixed rate financial liabilities of £52.9 billion were hedged by interest rate swaps in fair value hedge relationships.
The initial and ongoing prospective effectiveness of fair value hedge relationships is assessed on a cumulative basis by comparing movements in the fair value of the hedged item attributable to the hedged risk with changes in the fair value of the hedging interest rate swap or by comparing the respective changes in the price value of a basis point. Retrospective effectiveness is assessed by comparing the actual movements in the fair value of the hedged items attributable to the hedged risk with actual movements in the fair value of the hedging derivative over the life to date of the hedging relationship.
250
Financial statements
Notes on the accounts
The following table shows the notional amounts and fair values of the Group’s derivatives.
| Group | ||||||||||||||||||||||||||||||||||||
| 2009 | 2008 | 2007 | ||||||||||||||||||||||||||||||||||
| Notional | Notional | Notional | ||||||||||||||||||||||||||||||||||
| amounts | Assets | Liabilities | amounts | Assets | Liabilities | amounts | Assets | Liabilities | ||||||||||||||||||||||||||||
| £bn | £m | £m | £bn | £m | £m | £bn | £m | £m | ||||||||||||||||||||||||||||
| Exchange rate contracts | ||||||||||||||||||||||||||||||||||||
| Spot, forwards and futures | 2,004 | 26,744 | 24,898 | 2,316 | 83,065 | 83,568 | 2,134 | 29,829 | 29,629 | |||||||||||||||||||||||||||
| Currency swaps | 922 | 25,883 | 23,466 | 1,074 | 53,398 | 54,728 | 887 | 14,785 | 13,789 | |||||||||||||||||||||||||||
| Options purchased | 440 | 16,656 | — | 616 | 36,762 | — | 488 | 13,750 | — | |||||||||||||||||||||||||||
| Options written | 476 | — | 15,555 | 668 | — | 35,017 | 519 | — | 13,892 | |||||||||||||||||||||||||||
| Interest rate contracts | ||||||||||||||||||||||||||||||||||||
| Interest rate swaps | 30,956 | 265,528 | 253,793 | 37,901 | 548,040 | 532,180 | 24,798 | 142,470 | 141,479 | |||||||||||||||||||||||||||
| Options purchased | 3,180 | 55,976 | — | 5,673 | 99,192 | — | 4,084 | 30,681 | — | |||||||||||||||||||||||||||
| Options written | 2,539 | — | 55,589 | 3,775 | — | 102,216 | 3,640 | — | 31,199 | |||||||||||||||||||||||||||
| Futures and forwards | 6,555 | 2,088 | 2,033 | 8,555 | 7,600 | 6,620 | 3,164 | 807 | 987 | |||||||||||||||||||||||||||
| Credit derivatives | 1,621 | 41,748 | 39,127 | 2,208 | 142,366 | 132,734 | 2,402 | 34,123 | 29,855 | |||||||||||||||||||||||||||
| Equity and commodity contracts | 188 | 6,831 | 9,680 | 622 | 22,136 | 24,301 | 281 | 10,957 | 11,222 | |||||||||||||||||||||||||||
| 441,454 | 424,141 | 992,559 | 971,364 | 277,402 | 272,052 | |||||||||||||||||||||||||||||||
Certain derivative asset and liability balances with the London Clearing House, which meet the offset criteria in IAS 32 ‘Financial Instruments: Presentation’, are shown net.
Included above are derivatives held for hedging purposes as follows:
| 2009 | 2008 | 2007 | ||||||||||||||||||||||
| Assets | Liabilities | Assets | Liabilities | Assets | Liabilities | |||||||||||||||||||
| £m | £m | £m | £m | £m | £m | |||||||||||||||||||
| Fair value hedging: | ||||||||||||||||||||||||
| Exchange rate contracts | 160 | 38 | 1,257 | 1,412 | 62 | 344 | ||||||||||||||||||
| Interest rate contracts | 2,672 | 3,292 | 2,944 | 3,330 | 1,598 | 1,062 | ||||||||||||||||||
| Cash flow hedging: | ||||||||||||||||||||||||
| Exchange rate contracts | 2 | 7 | 2 | 90 | 155 | 78 | ||||||||||||||||||
| Interest rate contracts | 1,753 | 3,080 | 2,503 | 2,834 | 738 | 1,014 | ||||||||||||||||||
| Commodity contracts | — | — | 39 | 14 | — | — | ||||||||||||||||||
| Net investment hedging: | ||||||||||||||||||||||||
| Exchange rate contracts | 10 | 90 | 114 | 596 | — | 211 | ||||||||||||||||||
Hedge ineffectiveness recognised in other operating income comprised:
| 2009 | 2008 | 2007 | ||||||||||
| £m | £m | £m | ||||||||||
| Fair value hedging: | ||||||||||||
| Gains/(losses) on the hedged items attributable to the hedged risk | 512 | (965 | ) | 81 | ||||||||
| (Losses)/gains on the hedging instruments | (455 | ) | 884 | (87 | ) | |||||||
| Fair value ineffectiveness | 57 | (81 | ) | (6 | ) | |||||||
| Cash flow hedging ineffectiveness | 14 | (16 | ) | 9 | ||||||||
| 71 | (97 | ) | 3 | |||||||||
251
Notes on the accounts continued
13 Derivatives continued
The following tables show, for the Group, when the hedged cash flows are expected to occur and when they will affect income for designated cash flow hedges.
| 2009 | ||||||||||||||||||||||||||||||||||||
| Hedged forecast cash | 0-1 | 1-2 | 2-3 | 3-4 | 4-5 | 5-10 | 10-20 | Over 20 | ||||||||||||||||||||||||||||
| years | years | years | years | years | years | years | years | Total | ||||||||||||||||||||||||||||
flows expected to occur | ||||||||||||||||||||||||||||||||||||
| £m | £m | £m | £m | £m | £m | £m | £m | £m | ||||||||||||||||||||||||||||
| Forecast receivable cash flows | 504 | 466 | 423 | 267 | 163 | 379 | 141 | — | 2,343 | |||||||||||||||||||||||||||
| Forecast payable cash flows | (554 | ) | (521 | ) | (416 | ) | (350 | ) | (299 | ) | (990 | ) | (819 | ) | (167 | ) | (4,116 | ) | ||||||||||||||||||
| Hedged forecast cash | ||||||||||||||||||||||||||||||||||||
| flows affect profit or loss | ||||||||||||||||||||||||||||||||||||
| Forecast receivable cash flows | 503 | 467 | 422 | 255 | 163 | 371 | 141 | — | 2,322 | |||||||||||||||||||||||||||
| Forecast payable cash flows | (554 | ) | (518 | ) | (409 | ) | (346 | ) | (296 | ) | (978 | ) | (818 | ) | (167 | ) | (4,086 | ) | ||||||||||||||||||
| 2008 | ||||||||||||||||||||||||||||||||||||
| Hedged forecast cash | 0-1 | 1-2 | 2-3 | 3-4 | 4-5 | 5-10 | 10-20 | Over 20 | ||||||||||||||||||||||||||||
| years | years | years | years | years | years | years | years | Total | ||||||||||||||||||||||||||||
| flows expected to occur | ||||||||||||||||||||||||||||||||||||
| £m | £m | £m | £m | £m | £m | £m | £m | £m | ||||||||||||||||||||||||||||
| Forecast receivable cash flows | 985 | 779 | 667 | 554 | 423 | 1,323 | 407 | 45 | 5,183 | |||||||||||||||||||||||||||
| Forecast payable cash flows | (1,732 | ) | (1,614 | ) | (1,390 | ) | (1,059 | ) | (890 | ) | (2,880 | ) | (1,397 | ) | (257 | ) | (11,219 | ) | ||||||||||||||||||
| Hedged forecast cash | ||||||||||||||||||||||||||||||||||||
flows affect profit or loss | ||||||||||||||||||||||||||||||||||||
| Forecast receivable cash flows | 871 | 758 | 659 | 548 | 421 | 1,284 | 397 | 40 | 4,978 | |||||||||||||||||||||||||||
| Forecast payable cash flows | (1,701 | ) | (1,576 | ) | (1,323 | ) | (1,023 | ) | (878 | ) | (2,771 | ) | (1,337 | ) | (128 | ) | (10,737 | ) | ||||||||||||||||||
The following table shows the notional amounts and fair values of the company’s derivatives.
| Company | ||||||||||||||||||||||||||||||||||||
| 2009 | 2008 | 2007 | ||||||||||||||||||||||||||||||||||
| Notional | Notional | Notional | ||||||||||||||||||||||||||||||||||
| amounts | Assets | Liabilities | amounts | Assets | Liabilities | amounts | Assets | Liabilities | ||||||||||||||||||||||||||||
| £bn | £m | £m | £bn | £m | £m | £bn | £m | £m | ||||||||||||||||||||||||||||
| Exchange rate contracts | 10 | 875 | 422 | 7 | 792 | 353 | 13 | 154 | 178 | |||||||||||||||||||||||||||
| Interest rate contracts | 4 | 294 | 24 | 5 | 376 | 8 | 1 | 19 | 1 | |||||||||||||||||||||||||||
| 1,169 | 446 | 1,168 | 361 | 173 | 179 | |||||||||||||||||||||||||||||||
Included above are derivatives held for hedging purposes as follows:
| 2009 | 2008 | 2007 | ||||||||||||||||||||||
| Assets | Liabilities | Assets | Liabilities | Assets | Liabilities | |||||||||||||||||||
| Fair value hedging | £m | £m | £m | £m | £m | £m | ||||||||||||||||||
| Exchange rate contracts | — | — | — | 225 | — | 54 | ||||||||||||||||||
| Interest rate contracts | 239 | 14 | 193 | — | — | — | ||||||||||||||||||
252
Financial statements
Notes on the accounts
14 Debt securities
| Group | ||||||||||||||||||||||||||||||||
| UK | US | Other | Mortgage and | |||||||||||||||||||||||||||||
| central | central | central | Bank and | other asset | ||||||||||||||||||||||||||||
| and local | and local | and local | building | backed | ||||||||||||||||||||||||||||
| government | government | government | society | securities(1) | Corporate | Other(2) | Total | |||||||||||||||||||||||||
| 2009 | £m | £m | £m | £m | £m | £m | £m | £m | ||||||||||||||||||||||||
| Held-for-trading | 8,128 | 10,427 | 50,219 | 6,103 | 28,820 | 6,892 | 893 | 111,482 | ||||||||||||||||||||||||
Designated as at fair value through profit or loss | 122 | 3 | 402 | 483 | 394 | 1,178 | 21 | 2,603 | ||||||||||||||||||||||||
| Available-for-sale | 19,071 | 12,972 | 45,512 | 11,210 | 51,044 | 3,365 | 124 | 143,298 | ||||||||||||||||||||||||
| Loans and receivables | 1 | — | — | — | 7,924 | 1,853 | 93 | 9,871 | ||||||||||||||||||||||||
| 27,322 | 23,402 | 96,133 | 17,796 | 88,182 | 13,288 | 1,131 | 267,254 | |||||||||||||||||||||||||
| Available-for-sale | ||||||||||||||||||||||||||||||||
| Gross unrealised gains | 109 | 213 | 1,062 | 148 | 783 | 90 | 7 | 2,412 | ||||||||||||||||||||||||
| Gross unrealised losses | (60 | ) | (89 | ) | (266 | ) | (119 | ) | (3,314 | ) | (56 | ) | (6 | ) | (3,910 | ) | ||||||||||||||||
| 2008 | ||||||||||||||||||||||||||||||||
| Held-for-trading | 5,372 | 9,859 | 37,519 | 11,021 | 39,879 | 11,057 | 1,573 | 116,280 | ||||||||||||||||||||||||
Designated as at fair value through profit or loss | 2,085 | 510 | 472 | 89 | 236 | 1,580 | 456 | 5,428 | ||||||||||||||||||||||||
| Available-for-sale | 11,330 | 6,152 | 32,480 | 13,139 | 62,067 | 5,400 | 2,288 | 132,856 | ||||||||||||||||||||||||
| Loans and receivables | — | — | — | 114 | 8,961 | 3,749 | 161 | 12,985 | ||||||||||||||||||||||||
| 18,787 | 16,521 | 70,471 | 24,363 | 111,143 | 21,786 | 4,478 | 267,549 | |||||||||||||||||||||||||
| Available-for-sale | ||||||||||||||||||||||||||||||||
| Gross unrealised gains | 41 | 41 | 1,104 | 1,372 | 1,238 | 332 | 266 | 4,394 | ||||||||||||||||||||||||
| Gross unrealised losses | — | (166 | ) | (3,457 | ) | (168 | ) | (3,533 | ) | (426 | ) | (80 | ) | (7,830 | ) | |||||||||||||||||
| 2007 | ||||||||||||||||||||||||||||||||
| Held-for-trading | 10,370 | 12,670 | 60,356 | 16,234 | 62,430 | 27,365 | 1,246 | 190,671 | ||||||||||||||||||||||||
Designated as at fair value through profit or loss | 2,235 | 397 | 101 | 154 | 340 | 2,125 | 425 | 5,777 | ||||||||||||||||||||||||
| Available-for-sale | 1,030 | 2,169 | 31,597 | 11,835 | 36,607 | 6,551 | 5,747 | 95,536 | ||||||||||||||||||||||||
| Loans and receivables | — | — | 1,896 | — | 704 | — | 72 | 2,672 | ||||||||||||||||||||||||
| 13,635 | 15,236 | 93,950 | 28,223 | 100,081 | 36,041 | 7,490 | 294,656 | |||||||||||||||||||||||||
| Available-for-sale | ||||||||||||||||||||||||||||||||
| Gross unrealised gains | 29 | 14 | 56 | 12 | 18 | 22 | 1 | 152 | ||||||||||||||||||||||||
| Gross unrealised losses | — | (62 | ) | (276 | ) | (42 | ) | (181 | ) | (22 | ) | (10 | ) | (593 | ) | |||||||||||||||||
Notes:
| (1) | Includes securities issued by US federal agencies and government sponsored entities and covered bonds. |
| (2) | Includes securities, other than asset-backed securities, issued by US federal agencies and government sponsored entities. |
| (3) | During 2009 and 2008 the Group reclassified financial assets from the held-for-trading and available-for-sale categories into the loans and receivables category and during 2008 from the held-for-trading category into the available-for-sale category (see pages 231 to 233). |
The company holds other debt securities issued by a Group undertaking of £1,286 million, classified as loans and receivables.
253
Notes on the accounts continued
14 Debt securities continued
The following table analyses by issuer the Group’s available-for-sale debt securities by remaining maturity and the related yield (based on weighted averages).
| Within 1 year | After 1 but within 5 years | After 5 but within 10 years | After 10 years | Total | ||||||||||||||||||||||||||||||||||||
| Amount | Yield | Amount | Yield | Amount | Yield | Amount | Yield | Amount | Yield | |||||||||||||||||||||||||||||||
| 2009 | £m | % | £m | % | £m | % | £m | % | £m | % | ||||||||||||||||||||||||||||||
| UK central and local government | 11,815 | — | 2,618 | 4.0 | 2,439 | 4.8 | 2,199 | 4.3 | 19,071 | 1.7 | ||||||||||||||||||||||||||||||
| US central and local government | 294 | 2.4 | 5,620 | 1.4 | 6,957 | 3.7 | 101 | 7.0 | 12,972 | 2.6 | ||||||||||||||||||||||||||||||
| Other central and local government | 11,446 | 2.6 | 17,736 | 3.3 | 10,496 | 4.0 | 5,834 | 5.0 | 45,512 | 3.5 | ||||||||||||||||||||||||||||||
| Bank and building society | 4,617 | 2.2 | 4,972 | 3.0 | 972 | 3.7 | 649 | 2.1 | 11,210 | 2.7 | ||||||||||||||||||||||||||||||
Mortgage-backed securities (1) | 1,377 | 3.2 | 12,016 | 2.5 | 13,055 | 2.2 | 24,596 | 2.5 | 51,044 | 2.5 | ||||||||||||||||||||||||||||||
| Corporate | 469 | 4.4 | 1,586 | 3.1 | 633 | 3.6 | 677 | 2.8 | 3,365 | 3.3 | ||||||||||||||||||||||||||||||
Other (2) | 8 | 3.3 | 116 | 4.0 | — | — | — | — | 124 | 3.9 | ||||||||||||||||||||||||||||||
| Total fair value | 30,026 | 1.5 | 44,664 | 2.9 | 34,552 | 3.2 | 34,056 | 3.1 | 143,298 | 2.7 | ||||||||||||||||||||||||||||||
Notes:
| (1) | Includes securities issued by US federal agencies and government sponsored entities. |
| (2) | Includes securities, other than asset-backed securities, issued by US federal agencies and government sponsored entities. |
The table below shows the fair value of available-for-sale debt securities that were in an unrealised loss position at 31 December 2009.
| Less than 12 months | More than 12 months | Total | ||||||||||||||||||||||
| Gross | Gross | Gross | ||||||||||||||||||||||
| unrealised | unrealised | unrealised | ||||||||||||||||||||||
| Fair value | losses | Fair value | losses | Fair value | losses | |||||||||||||||||||
| 2009 | £m | £m | £m | £m | £m | £m | ||||||||||||||||||
| UK central and local government | 2,824 | 60 | 26 | — | 2,850 | 60 | ||||||||||||||||||
| US central and local government | 5,526 | 88 | 7 | 1 | 5,533 | 89 | ||||||||||||||||||
| Other central and local government | 6,935 | 260 | 391 | 6 | 7,326 | 266 | ||||||||||||||||||
| Bank and building society | 8,965 | 60 | 869 | 59 | 9,834 | 119 | ||||||||||||||||||
| Mortgage-backed securities | 3,185 | 983 | 23,950 | 2,331 | 27,135 | 3,314 | ||||||||||||||||||
| Corporate | 384 | 14 | 167 | 42 | 551 | 56 | ||||||||||||||||||
| Other | 710 | 3 | 16 | 3 | 726 | 6 | ||||||||||||||||||
| 28,529 | 1,468 | 25,426 | 2,442 | 53,955 | 3,910 | |||||||||||||||||||
Gross gains of £1,288 million (2008 – £1,633 million; 2007 – £60 million) and gross losses of £1,255 million (2008 – £1,411 million; 2007 – £12 million) were realised on the sale of available-for-sale securities.
Impairment losses on available-for-sale debt securities are recognised when there is objective evidence of impairment. The Group reviews its portfolios of available-for-sale financial assets for such evidence which includes: default or delinquency in interest or principal payments; significant financial difficulty of the issuer or obligor; and it becoming probable that the issuer will enter bankruptcy or other financial reorganisation. However, the disappearance of an active market because an entity’s financial instruments are no longer publicly traded is not evidence of impairment. Furthermore, a downgrade of an entity’s credit rating is not, of itself, evidence of impairment, although it may be evidence of impairment when considered with other available information. A decline in the fair value of a financial asset below its cost or amortised cost is not necessarily evidence of impairment. The existence of stand alone credit protection of an available-for-sale debt security has no effect on the Group’s assessment of whether or not the security is impaired. If an available-for-sale debt security benefits from credit protection that is integral to the security, the creditworthiness of the provider of that protection is taken into account when determining whether there is objective evidence that the security is impaired. Determining whether objective evidence of impairment exists requires the exercise of management judgment. The unrealised losses on the Group’s available-for-sale debt securities are concentrated in its portfolios of mortgage-backed securities. The losses reflect the widening of credit spreads as a result of the reduced market liquidity in these securities and the current uncertain macro-economic outlook in US and Europe. The underlying securities remain unimpaired.
254
Financial statements
Notes on the accounts
15 Equity shares
| Group | ||||||||||||||||||||||||||||||||||||
| 2009 | 2008 | 2007 | ||||||||||||||||||||||||||||||||||
| Listed | Unlisted | Total | Listed | Unlisted | Total | Listed | Unlisted | Total | ||||||||||||||||||||||||||||
| £m | £m | £m | £m | £m | £m | £m | £m | £m | ||||||||||||||||||||||||||||
| Held-for-trading | 14,394 | 49 | 14,443 | 15,894 | 1,160 | 17,054 | 33,696 | 3,850 | 37,546 | |||||||||||||||||||||||||||
| Designated as at fair value through profit or loss | 1,548 | 644 | 2,192 | 1,340 | 761 | 2,101 | 1,856 | 6,010 | 7,866 | |||||||||||||||||||||||||||
| Available-for-sale | 937 | 1,956 | 2,893 | 4,882 | 2,293 | 7,175 | 5,622 | 1,992 | 7,614 | |||||||||||||||||||||||||||
| 16,879 | 2,649 | 19,528 | 22,116 | 4,214 | 26,330 | 41,174 | 11,852 | 53,026 | ||||||||||||||||||||||||||||
| Available-for-sale | ||||||||||||||||||||||||||||||||||||
| Gross unrealised gains | 293 | 312 | 605 | 1,505 | 172 | 1,677 | 3,467 | 130 | 3,597 | |||||||||||||||||||||||||||
| Gross unrealised losses | (14 | ) | (68 | ) | (82 | ) | (225 | ) | (103 | ) | (328 | ) | (3 | ) | (7 | ) | (10 | ) | ||||||||||||||||||
Gross gains of £393 million (2008 – £190 million; 2007 – £475 million) and gross losses of £132 million (2008 – £70 million; 2007 – £9 million) were realised on the sale of available-for-sale equity shares.
Dividend income from available-for-sale equity shares was £86 million (2008 – £281 million; 2007 – £137 million).
Unquoted equity investments whose fair value cannot be reliably measured are carried at cost and classified as available-for-sale financial assets. They include capital stock (redeemable at cost) in the Federal Home Loan Bank and the Federal Reserve Bank of £0.8 billion (2008 – £0.9 billion; 2007 – £0.5 billion) that the Group’s banking subsidiaries in the US are required to hold; and a number of individually small shareholdings in unlisted companies. Disposals in the year generated losses of £21 million (2008 – nil; 2007 – £0.5 million gain).
255
Notes on the accounts continued
16 Investments in Group undertakings
Investments in Group undertakings are carried at cost less impairment. Movements during the year were as follows:
| Company | ||||||||||||
| 2009 | 2008 | 2007 | ||||||||||
| £m | £m | £m | ||||||||||
| At 1 January | 42,196 | 43,542 | 21,784 | |||||||||
| Currency translation and other adjustments | (566 | ) | 2,839 | 535 | ||||||||
| Additional investments in Group undertakings | 36,202 | 10,323 | 3,663 | |||||||||
| Additions | — | 26 | 17,566 | |||||||||
| Redemption of investments in Group undertakings | (7,908 | ) | — | — | ||||||||
| Disposals | (19 | ) | (213 | ) | (6 | ) | ||||||
| Impairment of investment in RFS Holdings B.V. | (5,025 | ) | (14,321 | ) | — | |||||||
| Other impairments | (114 | ) | — | — | ||||||||
| At 31 December | 64,766 | 42,196 | 43,542 | |||||||||
The principal subsidiary undertakings of the company are shown below. Their capital consists of ordinary and preference shares which are unlisted with the exception of certain preference shares issued by NatWest and ABN AMRO. The Royal Bank of Scotland plc, RBS Insurance Group Limited and RFS Holdings B.V. are directly owned by the company, and all of the other subsidiary undertakings are owned directly, or indirectly through intermediate holding companies, by these companies. All of these subsidiaries are included in the Group’s consolidated financial statements and have an accounting reference date of 31 December.
| Country of | ||||||
| incorporation | ||||||
| Nature of | and principal | Group | ||||
| business | area of operation | interest | ||||
| The Royal Bank of Scotland plc | Banking | Great Britain | 100 | % | ||
National Westminster Bank Plc (1) | Banking | Great Britain | 100 | % | ||
| Citizens Financial Group, Inc. | Banking | US | 100 | % | ||
Coutts & Company (2) | Private banking | Great Britain | 100 | % | ||
| RBS Securities Inc. | Broker dealer | US | 100 | % | ||
| RBS Insurance Group Limited | Insurance | Great Britain | 100 | % | ||
Ulster Bank Limited (3) | Banking | Northern Ireland | 100 | % | ||
ABN AMRO Holding N.V. (4) | Banking | The Netherlands | 38 | % | ||
Notes:
| (1) | The company does not hold any of the NatWest preference shares in issue. |
| (2) | Coutts & Company is incorporated with unlimited liability. Its registered office is 440 Strand, London WC2R 0QS. |
| (3) | Ulster Bank Limited and its subsidiaries also operate in the Republic of Ireland. |
| (4) | RFS Holdings B.V. (RFS) owns 100% of the outstanding shares of ABN AMRO Holding N.V. (ABN AMRO). The company owns 38% of RFS; the balance of shares is held by the State of the Netherlands, successor to Fortis N.V., Fortis SA/NV, and Banco Santander S.A. (the consortium members). Although the company does not control a majority of the voting rights in RFS, through the terms of the Consortium and Shareholders’ Agreement and RFS’s Articles of Association, it controls the board of RFS and RFS is a subsidiary of the company. The capital and income rights of shares issued by RFS are linked to the net assets and income of the ABN AMRO business units which the individual consortium members have agreed to acquire. In preparation for the divestment of the ABN AMRO businesses to be acquired by the Dutch State, on 6 February 2010, the businesses of ABN AMRO acquired by the Dutch State were legally demerged from the RBS acquired businesses. As a result, there are now two separate banks within ABN AMRO Holding N.V., The Royal Bank of Scotland N.V. and the new entity named ABN AMRO Bank N.V., each licensed separately by the Dutch Central Bank. Both banks will be governed by the current managing and supervisory boards of ABN AMRO Holding N.V. until the legal separation of the new ABN AMRO Bank N.V. from ABN AMRO Holding N.V., which is expected to take place within two months of the legal demerger and is subject to approval by the Dutch Central Bank. From that point RBS will cease to consolidate the Consortium Members’ interest in ABN AMRO in the RBS Group statutory results. |
The above information is provided in relation to the principal related undertakings as permitted by Section 410(2) of the Companies Act 2006. Full information on all related undertakings will be included in the Annual Return delivered to the Registrar of Companies for Scotland.
256
Financial statements
Notes on the accounts
17 Intangible assets
| Group | ||||||||||||||||||||
| Core | Other | Internally | ||||||||||||||||||
| deposit | purchased | generated | ||||||||||||||||||
| Goodwill | intangibles | intangibles | software | Total | ||||||||||||||||
| 2009 | £m | £m | £m | £m | £m | |||||||||||||||
| Cost: | ||||||||||||||||||||
| At 1 January 2009 | 45,624 | 2,780 | 4,367 | 4,524 | 57,295 | |||||||||||||||
| Transfers to disposal groups | (238 | ) | — | — | — | (238 | ) | |||||||||||||
| Currency translation and other adjustments | (2,743 | ) | (225 | ) | (281 | ) | (65 | ) | (3,314 | ) | ||||||||||
| Additions | — | — | 53 | 559 | 612 | |||||||||||||||
| Disposal of subsidiaries | — | — | — | (16 | ) | (16 | ) | |||||||||||||
| Disposals and write-off of fully amortised assets | — | (2 | ) | — | (187 | ) | (189 | ) | ||||||||||||
| At 31 December 2009 | 42,643 | 2,553 | 4,139 | 4,815 | 54,150 | |||||||||||||||
| Accumulated amortisation and impairment: | ||||||||||||||||||||
| At 1 January 2009 | 30,062 | 1,407 | 2,369 | 3,408 | 37,246 | |||||||||||||||
| Currency translation and other adjustments | (2,046 | ) | (106 | ) | (137 | ) | (58 | ) | (2,347 | ) | ||||||||||
| Disposal of subsidiaries | — | — | — | (13 | ) | (13 | ) | |||||||||||||
| Disposals and write-off of fully amortised assets | — | (1 | ) | — | (138 | ) | (139 | ) | ||||||||||||
| Charge for the year | — | 262 | 345 | 586 | 1,193 | |||||||||||||||
| Write down of goodwill and other intangible assets | 363 | — | — | — | 363 | |||||||||||||||
| At 31 December 2009 | 28,379 | 1,562 | 2,577 | 3,785 | 36,303 | |||||||||||||||
| Net book value at 31 December 2009 | 14,264 | 991 | 1,562 | 1,030 | 17,847 | |||||||||||||||
2008 | ||||||||||||||||||||
| Cost: | ||||||||||||||||||||
| At 1 January 2008 | 42,953 | 2,344 | 3,489 | 3,882 | 52,668 | |||||||||||||||
| Transfers to disposal groups | (3,692 | ) | (240 | ) | (105 | ) | (146 | ) | (4,183 | ) | ||||||||||
| Currency translation and other adjustments | 8,905 | 680 | 961 | 214 | 10,760 | |||||||||||||||
| Acquisition of subsidiaries | 524 | — | — | — | 524 | |||||||||||||||
| Additions | — | — | 23 | 602 | 625 | |||||||||||||||
| Disposal of subsidiaries | (3,066 | ) | — | — | (7 | ) | (3,073 | ) | ||||||||||||
| Disposals and write-off of fully amortised assets | — | (4 | ) | (1 | ) | (21 | ) | (26 | ) | |||||||||||
| At 31 December 2008 | 45,624 | 2,780 | 4,367 | 4,524 | 57,295 | |||||||||||||||
| Accumulated amortisation and impairment: | ||||||||||||||||||||
| At 1 January 2008 | — | 238 | 223 | 2,291 | 2,752 | |||||||||||||||
| Transfer to disposal groups | — | — | — | (37 | ) | (37 | ) | |||||||||||||
| Currency translation and other adjustments | — | 150 | 210 | 69 | 429 | |||||||||||||||
| Disposals and write-off of fully amortised assets | — | (3 | ) | (1 | ) | (19 | ) | (23 | ) | |||||||||||
| Charge for the year | — | 337 | 582 | 651 | 1,570 | |||||||||||||||
| Write down of goodwill and other intangible assets | 30,062 | 685 | 1,355 | 453 | 32,555 | |||||||||||||||
| At 31 December 2008 | 30,062 | 1,407 | 2,369 | 3,408 | 37,246 | |||||||||||||||
| Net book value at 31 December 2008 | 15,562 | 1,373 | 1,998 | 1,116 | 20,049 | |||||||||||||||
257
Notes on the accounts continued
17 Intangible assets continued
| Group | ||||||||||||||||||||
| Core | Other | Internally | ||||||||||||||||||
| deposit | purchased | generated | ||||||||||||||||||
| Goodwill | intangibles | intangibles | software | Total | ||||||||||||||||
| 2007 | £m | £m | £m | £m | £m | |||||||||||||||
| Cost: | ||||||||||||||||||||
| At 1 January 2007 | 17,889 | 265 | 275 | 2,642 | 21,071 | |||||||||||||||
| Currency translation and other adjustments | 1,187 | 105 | 177 | 52 | 1,521 | |||||||||||||||
| Acquisition of subsidiaries | 23,917 | 1,974 | 3,034 | 791 | 29,716 | |||||||||||||||
| Additions | — | — | 6 | 481 | 487 | |||||||||||||||
| Goodwill written off | (40 | ) | — | — | — | (40 | ) | |||||||||||||
| Disposals and write-off of fully amortised assets | — | — | (3 | ) | (84 | ) | (87 | ) | ||||||||||||
| At 31 December 2007 | 42,953 | 2,344 | 3,489 | 3,882 | 52,668 | |||||||||||||||
| Accumulated amortisation: | ||||||||||||||||||||
| At 1 January 2007 | — | 127 | 97 | 1,943 | 2,167 | |||||||||||||||
| Currency translation and other adjustments | — | 1 | 3 | 3 | 7 | |||||||||||||||
| Disposals and write-off of fully amortised assets | — | — | (1 | ) | (80 | ) | (81 | ) | ||||||||||||
| Charge for the year – continuing operations | — | 110 | 124 | 401 | 635 | |||||||||||||||
| Charge for the year – discontinued operations | — | — | — | 24 | 24 | |||||||||||||||
| At 31 December 2007 | — | 238 | 223 | 2,291 | 2,752 | |||||||||||||||
| Net book value at 31 December 2007 | 42,953 | 2,106 | 3,266 | 1,591 | 49,916 | |||||||||||||||
Impairment review
The Group’s goodwill acquired in business combinations is reviewed annually at 30 September for impairment by comparing the recoverable amount of each cash generating unit (CGU) to which goodwill has been allocated with its carrying value.
Changes were made to the Group’s reporting structure in the first half of 2009, which is detailed on page 297. Following the reorganisation of the Group structure, ABN AMRO and NatWest goodwill was reallocated to the appropriate CGUs.
The CGUs of the Group, excluding RFS Holdings minority interest where the goodwill arising is significant, principally on the acquisitions of NatWest, ABN AMRO, Charter One and Churchill are as follows:
| Recoverable | Goodwill at | ||||
| amount | 30 September | ||||
| 2009 | based on: | £m | |||
| UK Retail | Value in use | 2,697 | |||
| UK Corporate | Value in use | 2,693 | |||
| Wealth | Value in use | 611 | |||
| Global Transaction Services | Value in use | 2,749 | |||
| US Retail & Commercial | Value in use | 2,761 | |||
| RBS Insurance | Value in use | 935 | |||
258
Financial statements
Notes on the accounts
| Goodwill | |||||||||||||
| Recoverable | prior to | Goodwill at | |||||||||||
| amount | write down | Write down | 31 December | ||||||||||
| 2008 | based on: | £m | £m | £m | |||||||||
| UK Retail & Commercial Banking | Value in use | 6,009 | — | 6,009 | |||||||||
| Global Banking & Markets | Value in use | 8,946 | (8,946 | ) | — | ||||||||
| Global Transaction Services | Value in use | 3,121 | — | 3,121 | |||||||||
| Europe & Middle East Retail & Commercial Banking | Value in use | 1,201 | (1,201 | ) | — | ||||||||
| Asia Retail & Commercial Banking | Value in use | 970 | (863 | ) | 107 | ||||||||
| US Retail & Commercial Banking | Value in use | 7,405 | (4,382 | ) | 3,023 | ||||||||
| RBS Insurance | Value in use | 935 | — | 935 | |||||||||
The analysis of goodwill by operating segment is shown in Note 38.
The recoverable amounts for all CGUs in September 2009 were based on the value in use test, using management’s latest five-year forecasts. The long-term growth rates have been based on respective country GDP rates adjusted for inflation. The risk discount rates are based on observable market long-term government bond yields and average industry betas adjusted for an appropriate risk premium based on independent analysis.
The recoverable amount of UK Retail, based on a 4% terminal growth rate and 14.6% pre tax discount rate, exceeded the carrying amount by £0.7 billion. A 1% change in the discount rate or the terminal growth rate would change the recoverable amount by approximately £0.9 billion and £0.5 billion respectively. In addition, a 5% change in the forecast pre tax earnings would change the recoverable amount by approximately £0.4 billion.
The recoverable amount of UK Corporate, based on a 4% terminal growth rate and a 15.1% pre tax discount rate, exceeded its carrying value by £6.1 billion. A 1% change in the discount rate or similar change in the terminal growth rate would change the recoverable amount by approximately £1.4 billion and £0.9 billion respectively. In addition, a 5% change in the forecast pre tax earnings would change the recoverable amount by approximately £0.8 billion.
The recoverable amount of Wealth, based on a 4% terminal growth rate and a 15.3% pre tax discount rate, exceeded its carrying value by £5.6 billion. A 1% change in the discount rate or similar change in the terminal growth rate would change the recoverable amount by approximately £0.6 billion and £0.5 billion respectively. In addition, a 5% change in the forecast pre tax earnings would change the recoverable amount by approximately £0.4 billion.
The recoverable amount of Global Transaction Services, based on a 3% (2008 – 3%) terminal growth rate and a 16.7% (2008 – 15.7%) pre tax discount rate, exceeded its carrying value by more than 100% (2008 – 100%) and was insensitive to a reasonably possible change in key assumptions.
The recoverable amount of US Retail & Commercial, based on a 5% (2008 – 5%) terminal growth rate and a 14.8% (2008 – 18%) pre tax discount rate, exceeded its carrying value by £2.1 billion (2008 – impairment of £4.4 billion). A 1% change in the discount rate or similar change in the terminal growth rate would change the recoverable amount by approximately £1.0 billion (2008 – £1 billion) and £0.8 billion (2008 – £0.7 billion) respectively. In addition, a 5% change in the forecast pre tax earnings would change the recoverable amount by approximately £0.7 billion (2008 – £0.5 billion).
The recoverable amount of RBS Insurance, based on a 3% (2008 – 3%) and a 13.9% (2008 – 14.6%) pre tax discount rate, exceeded the carrying amount by over £3 billion (2008 – £3 billion) and was insensitive to a reasonably possible change in key assumptions.
A further £1.4 billion (2008 – £1.5 billion) of goodwill is attributable to the State of the Netherlands minority interest arising on the acquisition of ABN AMRO. The recoverable amount based on latest management forecasts, a 0% terminal growth rate and a 17.5% pre-tax discount rate supported the carrying amount of the goodwill. In 2008, a £14.5 billion impairment charge was recorded.
During the year an impairment charge of £363 million was recorded principally in relation to NatWest and ABN AMRO goodwill allocated to Non-Core businesses following the restructure of the Group.
In 2008, the recoverable amounts for all CGUs were based on value in use tests. Goodwill write downs were recorded in Global Banking & Markets, US Retail & Commercial, Europe & Middle East Retail & Commercial Banking and Asia Retail & Commercial Banking divisions.
259
Notes on the accounts continued
18 Property, plant and equipment
| Group | ||||||||||||||||||||||||||||
| Long | Short | Computers | Operating | |||||||||||||||||||||||||
| Investment | Freehold | leasehold | leasehold | and other | lease | |||||||||||||||||||||||
| properties | premises | premises | premises | equipment | assets | Total | ||||||||||||||||||||||
| 2009 | £m | £m | £m | £m | £m | £m | £m | |||||||||||||||||||||
| Cost or valuation: | ||||||||||||||||||||||||||||
| At 1 January 2009 | 3,868 | 4,032 | 224 | 1,867 | 4,168 | 9,334 | 23,493 | |||||||||||||||||||||
| Transfers to disposal groups | — | (32 | ) | — | (62 | ) | (80 | ) | — | (174 | ) | |||||||||||||||||
| Currency translation and other adjustments | (85 | ) | (134 | ) | — | (65 | ) | (131 | ) | (561 | ) | (976 | ) | |||||||||||||||
| Disposal of subsidiaries | — | (15 | ) | — | — | (19 | ) | — | (34 | ) | ||||||||||||||||||
| Reclassifications | 1 | 18 | 1 | (34 | ) | 14 | — | — | ||||||||||||||||||||
| Additions | 1,634 | 304 | 8 | 153 | 750 | 2,241 | 5,090 | |||||||||||||||||||||
| Expenditure on investment properties | — | — | — | — | — | 8 | ||||||||||||||||||||||
| Change in fair value of investment properties | (117 | ) | — | — | — | — | — | (117 | ) | |||||||||||||||||||
| Disposals and write-off of fully depreciated assets | (426 | ) | (75 | ) | (19 | ) | (56 | ) | (420 | ) | (1,456 | ) | (2,452 | ) | ||||||||||||||
| At 31 December 2009 | 4,883 | 4,098 | 214 | 1,803 | 4,282 | 9,558 | 24,838 | |||||||||||||||||||||
| Accumulated impairment, depreciation and amortisation: | ||||||||||||||||||||||||||||
| At 1 January 2009 | — | 422 | 79 | 492 | 1,916 | 1,635 | 4,544 | |||||||||||||||||||||
| Transfers to disposal groups | — | — | — | (7 | ) | (31 | ) | — | (38 | ) | ||||||||||||||||||
| Currency translation and other adjustments | — | (1 | ) | — | (11 | ) | (48 | ) | (69 | ) | (129 | ) | ||||||||||||||||
| Disposal of subsidiaries | — | (1 | ) | — | — | (14 | ) | — | (15 | ) | ||||||||||||||||||
| Write-off of property, plant and equipment | — | 5 | — | 5 | — | — | 10 | |||||||||||||||||||||
| Disposals and write-off of fully depreciated assets | — | — | — | (2 | ) | (126 | ) | (419 | ) | (547 | ) | |||||||||||||||||
| Charge for the year | 128 | 8 | 164 | 699 | 617 | 1,616 | ||||||||||||||||||||||
| At 31 December 2009 | — | 553 | 87 | 641 | 2,396 | 1,764 | 5,441 | |||||||||||||||||||||
| Net book value at 31 December 2009 | 4,883 | 3,545 | 127 | 1,162 | 1,886 | 7,794 | 19,397 | |||||||||||||||||||||
| 2008 | ||||||||||||||||||||||||||||
| Cost or valuation: | ||||||||||||||||||||||||||||
| At 1 January 2008 | 3,431 | 3,645 | 215 | 1,688 | 3,929 | 11,437 | 24,345 | |||||||||||||||||||||
| Transfers to disposal groups | — | (262 | ) | — | (188 | ) | (349 | ) | — | (799 | ) | |||||||||||||||||
| Currency translation and other adjustments | 320 | 452 | 5 | 149 | 436 | 1,313 | 2,675 | |||||||||||||||||||||
| Acquisition of subsidiaries | — | — | — | 30 | 31 | — | 61 | |||||||||||||||||||||
| Disposal of subsidiaries | — | — | — | (2 | ) | (57 | ) | (5,015 | ) | (5,074 | ) | |||||||||||||||||
| Reclassifications | — | (176 | ) | — | 197 | (14 | ) | (7 | ) | — | ||||||||||||||||||
| Additions | 417 | 486 | 22 | 61 | 837 | 3,794 | 5,617 | |||||||||||||||||||||
| Expenditure on investment properties | 8 | — | — | — | — | — | 8 | |||||||||||||||||||||
| Change in fair value of investment properties | (86 | ) | — | — | — | — | — | (86 | ) | |||||||||||||||||||
| Disposals and write-off of fully depreciated assets | (222 | ) | (113 | ) | (18 | ) | (68 | ) | (645 | ) | (2,188 | ) | (3,254 | ) | ||||||||||||||
| At 31 December 2008 | 3,868 | 4,032 | 224 | 1,867 | 4,168 | 9,334 | 23,493 | |||||||||||||||||||||
| Accumulated impairment, depreciation and amortisation: | ||||||||||||||||||||||||||||
| At 1 January 2008 | — | 391 | 74 | 436 | 1,952 | 2,747 | 5,600 | |||||||||||||||||||||
| Transfers to disposal groups | — | (60 | ) | — | (91 | ) | (243 | ) | — | (394 | ) | |||||||||||||||||
| Currency translation and other adjustments | — | (9 | ) | 1 | 9 | 148 | 202 | 351 | ||||||||||||||||||||
| Disposal of subsidiaries | — | — | — | (1 | ) | (39 | ) | (1,447 | ) | (1,487 | ) | |||||||||||||||||
| Reclassifications | — | 17 | (2 | ) | 1 | (9 | ) | (7 | ) | — | ||||||||||||||||||
| Write-off of property, plant and equipment | — | 19 | — | — | 7 | — | 26 | |||||||||||||||||||||
| Disposals and write-off of fully depreciated assets | — | (22 | ) | — | (31 | ) | (539 | ) | (544 | ) | (1,136 | ) | ||||||||||||||||
| Charge for the year | — | 86 | 6 | 169 | 639 | 684 | 1,584 | |||||||||||||||||||||
| At 31 December 2008 | — | 422 | 79 | 492 | 1,916 | 1,635 | 4,544 | |||||||||||||||||||||
| Net book value at 31 December 2008 | 3,868 | 3,610 | 145 | 1,375 | 2,252 | 7,699 | 18,949 | |||||||||||||||||||||
260
Financial statements
Notes on the accounts
| Group | ||||||||||||||||||||||||||||
| Long | Short | Computers | Operating | |||||||||||||||||||||||||
| Investment | Freehold | leasehold | leasehold | and other | lease | |||||||||||||||||||||||
| properties | premises | premises | premises | equipment | assets | Total | ||||||||||||||||||||||
| 2007 | £m | £m | £m | £m | £m | £m | £m | |||||||||||||||||||||
| Cost or valuation: | ||||||||||||||||||||||||||||
| At 1 January 2007 | 4,885 | 2,579 | 310 | 1,254 | 3,069 | 11,589 | 23,686 | |||||||||||||||||||||
| Currency translation and other adjustments | 96 | 65 | 1 | 11 | 12 | (10 | ) | 175 | ||||||||||||||||||||
| Acquisition of subsidiaries | — | 950 | — | 157 | 191 | 202 | 1,500 | |||||||||||||||||||||
| Reclassifications | 3 | (4 | ) | 3 | 1 | (3 | ) | — | — | |||||||||||||||||||
| Additions | 450 | 592 | 34 | 309 | 857 | 2,791 | 5,033 | |||||||||||||||||||||
| Transfers to disposal groups | — | (4 | ) | (13 | ) | — | — | (422 | ) | (439 | ) | |||||||||||||||||
| Expenditure on investment properties | 41 | — | — | — | — | — | 41 | |||||||||||||||||||||
| Change in fair value of investment properties | 288 | — | — | — | — | — | 288 | |||||||||||||||||||||
| Disposals and write-off of fully depreciated assets | (2,332 | ) | (533 | ) | (120 | ) | (44 | ) | (197 | ) | (2,713 | ) | (5,939 | ) | ||||||||||||||
| At 31 December 2007 | 3,431 | 3,645 | 215 | 1,688 | 3,929 | 11,437 | 24,345 | |||||||||||||||||||||
| Accumulated depreciation and amortisation: | ||||||||||||||||||||||||||||
| At 1 January 2007 | — | 446 | 96 | 374 | 1,670 | 2,680 | 5,266 | |||||||||||||||||||||
| Currency translation and other adjustments | — | (4 | ) | — | (1 | ) | (1 | ) | 2 | (4 | ) | |||||||||||||||||
| Transfers to disposal groups | — | — | — | — | — | (52 | ) | (52 | ) | |||||||||||||||||||
| Reclassifications | — | (2 | ) | 2 | — | — | — | — | ||||||||||||||||||||
| Disposals and write-off of fully depreciated assets | — | (122 | ) | (32 | ) | (25 | ) | (132 | ) | (610 | ) | (921 | ) | |||||||||||||||
| Charge for the year – continuing operations | — | 66 | 8 | 87 | 409 | 727 | 1,297 | |||||||||||||||||||||
| Charge for the year – discontinued operations | — | 7 | — | 1 | 6 | — | 14 | |||||||||||||||||||||
| At 31 December 2007 | — | 391 | 74 | 436 | 1,952 | 2,747 | 5,600 | |||||||||||||||||||||
| Net book value at 31 December 2007 | 3,431 | 3,254 | 141 | 1,252 | 1,977 | 8,690 | 18,745 | |||||||||||||||||||||
| 2009 | 2008 | 2007 | ||||||||||||||||||||||||||
| £m | £m | £m | ||||||||||||||||||||||||||
| Property, plant and equipment pledged as security | — | — | 935 | |||||||||||||||||||||||||
Investment properties are valued to reflect fair value, that is, the market value of the Group’s interest at the reporting date excluding any special terms or circumstances relating to the use or financing of the property and transaction costs that would be incurred in making a sale. Observed market data such as rental yield, replacement cost and useful life, reflect relatively few transactions involving property that is not necessarily identical to property owned by the Group.
Valuations are carried out by qualified surveyors who are members of the Royal Institution of Chartered Surveyors, or an equivalent overseas body. The valuation as at 31 December 2009 for a significant majority of the Group’s investment properties was undertaken with the support of external valuers.
Investment property acquired during 2009 includes £1,336 million arising on assumption by the Group of control of properties for which it provided finance to a customer.
The fair value of investment properties includes £84 million (2008 – £172 million; 2007 – £234 million) of appreciation since purchase.
Rental income from investment properties was £233 million (2008 – £257 million; 2007 – £300 million). Direct operating expenses of investment properties were £16 million (2008 – £22 million; 2007 – £49 million).
Property, plant and equipment, excluding investment properties, include £213 million (2008 – £1,132 million; 2007 – £717 million) assets in the course of construction.
Freehold and long leasehold properties with a net book value of £5 million (2008 – nil; 2007 – £451 million) were sold subject to operating leases.
261
Notes on the accounts continued
19 Prepayments, accrued income and other assets
| Group | Company | |||||||||||||||||||||||
| 2009 | 2008 | 2007 | 2009 | 2008 | 2007 | |||||||||||||||||||
| £m | £m | £m | £m | £m | £m | |||||||||||||||||||
| Prepayments | 1,872 | 1,949 | 1,988 | — | — | — | ||||||||||||||||||
| Accrued income | 897 | 1,206 | 1,214 | — | — | — | ||||||||||||||||||
| Deferred expenses | 596 | 709 | 385 | — | — | — | ||||||||||||||||||
| Pension schemes in net surplus | 58 | 36 | 575 | — | — | — | ||||||||||||||||||
| Other assets | 17,562 | 20,502 | 11,500 | 43 | 489 | 127 | ||||||||||||||||||
| 20,985 | 24,402 | 15,662 | 43 | 489 | 127 | |||||||||||||||||||
20 Discontinued operations and assets and liabilities of disposal groups
(a) (Loss)/profit from discontinued operations, net of tax
| 2009 | 2008 | 2007 | ||||||||||
| £m | £m | £m | ||||||||||
| Discontinued operations: | ||||||||||||
| Total income | — | 2,571 | 749 | |||||||||
| Operating expenses | — | (1,407 | ) | (493 | ) | |||||||
| Insurance net claims | — | — | (28 | ) | ||||||||
| Impairment losses | — | (564 | ) | (160 | ) | |||||||
| Profit before tax | — | 600 | 68 | |||||||||
| Gain on disposal | — | 3,859 | — | |||||||||
| Operating profit before tax | — | 4,459 | 68 | |||||||||
| Tax on profit | — | (204 | ) | (8 | ) | |||||||
| Tax on gain on disposal | — | (33 | ) | — | ||||||||
| Profit after tax | — | 4,222 | 60 | |||||||||
| Businesses acquired exclusively with a view to disposal | ||||||||||||
| Loss after tax | (99 | ) | (251 | ) | (136 | ) | ||||||
| (Loss)/profit from discontinued operations, net of tax | (99 | ) | 3,971 | (76 | ) | |||||||
Discontinued operations in 2008 reflect the results of Banco Real sold to Santander on 24 July 2008.
Businesses acquired exclusively with a view to disposal comprise those ABN AMRO businesses, including Banca Antonveneta, Asset Management and Private Equity, classified as disposal groups on the acquisition of ABN AMRO on 17 October 2007. The Asset Management business was sold to Fortis on 3 April 2008. Banca Antonveneta, excluding its subsidiary Interbanca, was sold to Banca Monte dei Paschi di Siena S.p.A. on 30 May 2008.
To comply with EC State Aid requirements the Group has agreed to make a series of divestments over the next four years. Sempra was the only such divestment that met the criteria for classification as a disposal group at 31 December 2009. The other assets and associated liabilities classified as disposal groups include certain non-core interests in Asia and Latin America.
262
Financial statements
Notes on the accounts
(b) Cash flows attributable to discontinued operations
Included within the Group’s cash flows are the following amounts attributable to discontinued operations:
| 2009 | 2008 | 2007 | ||||||||||
| £m | £m | £m | ||||||||||
| Net cash flows from operating activities | — | (124 | ) | (1,304 | ) | |||||||
| Net cash flows from investing activities | — | (368 | ) | 4,341 | ||||||||
| Net cash flows from financing activities | — | 339 | (25 | ) | ||||||||
| Net increase in cash and cash equivalents | — | 287 | 3,172 | |||||||||
(c) Assets and liabilities of disposal groups
| Sempra | Other | 2009 | 2008 | 2007 | ||||||||||||||||
| £m | £m | £m | £m | £m | ||||||||||||||||
| Assets of disposal groups | ||||||||||||||||||||
| Cash and balances at central banks | — | 129 | 129 | — | — | |||||||||||||||
| Loans and advances to banks | 314 | 74 | 388 | — | — | |||||||||||||||
| Loans and advances to customers | 306 | 2,910 | 3,216 | — | — | |||||||||||||||
| Debt securities and equity shares | 56 | 848 | 904 | — | — | |||||||||||||||
| Derivatives | 6,361 | — | 6,361 | — | — | |||||||||||||||
| Intangible assets | 238 | — | 238 | — | — | |||||||||||||||
| Settlement balances | 1,579 | — | 1,579 | — | — | |||||||||||||||
| Property, plant and equipment | 92 | 44 | 136 | 66 | 395 | |||||||||||||||
| Other assets | 5,257 | 160 | 5,417 | — | — | |||||||||||||||
| Discontinued operations and other disposal groups | 14,203 | 4,165 | 18,368 | 66 | 395 | |||||||||||||||
| Assets acquired exclusively with a view to disposal | — | 174 | 174 | 1,515 | 45,455 | |||||||||||||||
| 14,203 | 4,339 | 18,542 | 1,581 | 45,850 | ||||||||||||||||
| Liabilities of disposal groups | ||||||||||||||||||||
| Deposits by banks | 560 | 58 | 618 | — | — | |||||||||||||||
| Customer accounts | 1,961 | 6,946 | 8,907 | — | — | |||||||||||||||
| Derivatives | 6,262 | 421 | 6,683 | — | — | |||||||||||||||
| Settlement balances | 950 | — | 950 | — | — | |||||||||||||||
| Subordinated liabilities | — | 6 | 6 | — | — | |||||||||||||||
| Other liabilities | 1,260 | 415 | 1,675 | — | — | |||||||||||||||
| Discontinued operations and other disposal groups | 10,993 | 7,846 | 18,839 | — | — | |||||||||||||||
| Assets acquired exclusively with a view to disposal | — | 51 | 51 | 859 | 29,228 | |||||||||||||||
| 10,993 | 7,897 | 18,890 | 859 | 29,228 | ||||||||||||||||
263
Notes on the accounts continued
21 Settlement balances and short positions
| Group | ||||||||||||
| 2009 | 2008 | 2007 | ||||||||||
| £m | £m | £m | ||||||||||
| Settlement balances (amortised cost) | 10,413 | 11,741 | 17,520 | |||||||||
| Short positions (held-for-trading): | ||||||||||||
| Debt securities – Government | 26,647 | 32,519 | 41,048 | |||||||||
| – Other issuers | 10,871 | 6,374 | 25,310 | |||||||||
| Equity shares | 2,945 | 3,643 | 7,143 | |||||||||
| 50,876 | 54,277 | 91,021 | ||||||||||
22 Accruals, deferred income and other liabilities
| Group | Company | |||||||||||||||||||||||
| 2009 | 2008 | 2007 | 2009 | 2008 | 2007 | |||||||||||||||||||
| £m | £m | £m | £m | £m | £m | |||||||||||||||||||
| Notes in circulation | 1,889 | 1,619 | 1,545 | — | — | — | ||||||||||||||||||
| Current taxation | 429 | 585 | 1,630 | 169 | — | — | ||||||||||||||||||
| Accruals | 7,429 | 7,531 | 8,377 | 3 | 3 | — | ||||||||||||||||||
| Deferred income | 5,818 | 7,640 | 6,289 | 3 | 4 | — | ||||||||||||||||||
Other liabilities (1) | 14,762 | 14,107 | 16,367 | 1,182 | 40 | 8 | ||||||||||||||||||
| 30,327 | 31,482 | 34,208 | 1,357 | 47 | 8 | |||||||||||||||||||
Note:
(1) Other liabilities include £5 million (2008 – £1 million; 2007 – £9 million) in respect of share-based compensation.
Included in other liabilities are provisions for liabilities and charges as follows:
| Group | £m | |||
| At 1 January 2009 | 222 | |||
| Currency translation and other movements | 78 | |||
| Disposal of subsidiaries | (4 | ) | ||
| Charge to income statement | 482 | |||
| Releases to income statement | (57 | ) | ||
| Provisions utilised | (159 | ) | ||
| At 31 December 2009 | 562 |
Note:
(1) Comprises property provisions and other provisions arising in the normal course of business.
264
Financial statements
Notes on the accounts
23 Deferred taxation
Provision for deferred taxation has been made as follows:
| Group | Company | |||||||||||||||||||||||
| 2009 | 2008 | 2007 | 2009 | 2008 | 2007 | |||||||||||||||||||
| £m | £m | £m | £m | £m | £m | |||||||||||||||||||
| Deferred tax liability | 2,811 | 4,165 | 5,400 | — | — | 3 | ||||||||||||||||||
| Deferred tax asset | (7,039 | ) | (7,082 | ) | (3,119 | ) | (2 | ) | (3 | ) | — | |||||||||||||
| Net deferred tax | (4,228 | ) | (2,917 | ) | 2,281 | (2 | ) | (3 | ) | 3 | ||||||||||||||
| Group | ||||||||||||||||||||||||||||||||||||||||||||||||||||
| Fair | Available- | Tax | ||||||||||||||||||||||||||||||||||||||||||||||||||
| Accelerated | value of | for-sale | Cash | losses | ||||||||||||||||||||||||||||||||||||||||||||||||
| capital | Deferred | IFRS | financial | financial | flow | Share | carried | |||||||||||||||||||||||||||||||||||||||||||||
| Pension | allowances | Provisions | gains | transition | instruments | assets | Intangibles | hedging | schemes | forward | Other | Total | ||||||||||||||||||||||||||||||||||||||||
| £m | £m | £m | £m | £m | £m | £m | £m | £m | £m | £m | £m | £m | ||||||||||||||||||||||||||||||||||||||||
At 1 January 2008 | (51 | ) | 3,384 | (886 | ) | 606 | (619 | ) | (233 | ) | — | 1,253 | (252 | ) | (11 | ) | (904 | ) | (6 | ) | 2,281 | |||||||||||||||||||||||||||||||
| Transfers to disposal groups | 19 | 69 | 528 | 36 | — | — | 80 | (29 | ) | — | — | — | 238 | 941 | ||||||||||||||||||||||||||||||||||||||
Acquisition/(disposals) of subsidiaries | — | (509 | ) | — | — | 6 | 2 | (2 | ) | 3 | 1 | — | — | 58 | (441 | ) | ||||||||||||||||||||||||||||||||||||
Charge/(credit) to income statement | 157 | (127 | ) | (106 | ) | 21 | 195 | (125 | ) | 350 | (898 | ) | 286 | (2 | ) | (3,079 | ) | 63 | (3,265 | ) | ||||||||||||||||||||||||||||||||
(Credit)/charge to equity directly | (476 | ) | — | — | (6 | ) | 1 | 3 | (547 | ) | — | (317 | ) | 10 | (709 | ) | (3 | ) | (2,044 | ) | ||||||||||||||||||||||||||||||||
| Other | (31 | ) | 267 | (350 | ) | (46 | ) | (3 | ) | — | 84 | 445 | (201 | ) | — | (38 | ) | (516 | ) | (389 | ) | |||||||||||||||||||||||||||||||
| At 1 January 2009 | (382 | ) | 3,084 | (814 | ) | 611 | (420 | ) | (353 | ) | (35 | ) | 774 | (483 | ) | (3 | ) | (4,730 | ) | (166 | ) | (2,917 | ) | |||||||||||||||||||||||||||||
| Transfers to disposal groups | — | — | 2 | — | — | (2 | ) | — | — | — | — | — | 11 | 11 | ||||||||||||||||||||||||||||||||||||||
Acquisitions/(disposals) of subsidiaries | — | — | — | — | — | — | — | — | — | — | — | (8 | ) | (8 | ) | |||||||||||||||||||||||||||||||||||||
Charge/(credit) to income statement | 691 | (165 | ) | (740 | ) | (81 | ) | (6 | ) | 164 | (483 | ) | 397 | 165 | (6 | ) | (973 | ) | 305 | (732 | ) | |||||||||||||||||||||||||||||||
(Credit)/charge to equity directly | (1,033 | ) | — | — | (501 | ) | 1 | — | 126 | — | 204 | — | 554 | 1 | (648 | ) | ||||||||||||||||||||||||||||||||||||
Currency translation and other adjustments | — | (104 | ) | 72 | 107 | 52 | 7 | 1 | (63 | ) | 54 | 1 | 15 | (76 | ) | 66 | ||||||||||||||||||||||||||||||||||||
| At 31 December 2009 | (724 | ) | 2,815 | (1,480 | ) | 136 | (373 | ) | (184 | ) | (391 | ) | 1,108 | (60 | ) | (8 | ) | (5,134 | ) | 67 | (4,228 | ) | ||||||||||||||||||||||||||||||
| Cash | ||||||||||||||||
| IFRS | flow | Total | ||||||||||||||
| Company | transition | hedging | Other | £m | ||||||||||||
| At 1 January 2008 | — | (2 | ) | 5 | 3 | |||||||||||
| (Credit)/charge to income statement | (4 | ) | 2 | (5 | ) | (7 | ) | |||||||||
| Other | 1 | — | — | 1 | ||||||||||||
| At 1 January 2009 | (3 | ) | — | — | (3 | ) | ||||||||||
| Charge to income statement | 1 | — | — | 1 | ||||||||||||
| At 31 December 2009 | (2 | ) | — | — | (2 | ) | ||||||||||
Notes:
| (1) | Deferred tax assets are recognised, as set out above, that depend on the availability of future taxable profits in excess of profits arising from the reversal of other temporary differences. Business projections prepared for impairment reviews (see Note 17) indicate it is probable that sufficient future taxable income will be available against which to offset these recognised deferred tax assets within eight years. UK losses do not expire and Netherlands losses expire after nine years. In jurisdictions where doubt exists over the availability of future taxable profits, deferred tax assets of £2,163 million (2008 – £1,748 million; 2007 – £687 million) have not been recognised in respect of tax losses carried forward of £7,759 million (2008 – £5,779 million; 2007 – £2,043 million). Of these losses, £27 million will expire within one year, £18 million within five years and £6,837 million thereafter. The balance of tax losses carried forward has no time limit. |
| (2) | Deferred tax liabilities of £279 million (2008 – £980 million; 2007 – £977 million) have not been recognised in respect of retained earnings of overseas subsidiaries and held-over gains on the incorporation of overseas branches. Retained earnings of overseas subsidiaries are expected to be reinvested indefinitely or remitted to the UK free from further taxation. No taxation is expected to arise in the foreseeable future in respect of held-over gains. The temporary differences at the balance sheet date are significantly reduced from the previous year as a result of changes to UK tax legislation which largely exempts from UK tax, overseas dividends received on or after 1 July 2009. |
265
Notes on the accounts continued
24 Insurance business
| Group | ||||||||||||
| 2009 | 2008 | 2007 | ||||||||||
| £m | £m | £m | ||||||||||
| Insurance premium income | 5,807 | 6,626 | 6,376 | |||||||||
| Reinsurers’ share | (263 | ) | (300 | ) | (289 | ) | ||||||
| Net premium income | 5,544 | 6,326 | 6,087 | |||||||||
| Insurance claims | 4,992 | 4,603 | 4,742 | |||||||||
| Reinsurers’ share | (135 | ) | (173 | ) | (118 | ) | ||||||
| Net claims | 4,857 | 4,430 | 4,624 | |||||||||
| Group | ||||||||||||
| Insurance liabilities | 2009 | 2008 | 2007 | |||||||||
| £m | £m | £m | ||||||||||
| Life assurance business: | ||||||||||||
| Unit linked insurance contracts | 292 | 256 | 364 | |||||||||
| Index linked insurance contracts | 1,090 | 1,331 | 1,490 | |||||||||
| Participating bonds | 2,793 | 2,602 | 2,544 | |||||||||
| Other insurance contracts | 304 | 309 | 298 | |||||||||
| 4,479 | 4,498 | 4,696 | ||||||||||
| General insurance business | 5,802 | 5,478 | 5,466 | |||||||||
| 10,281 | 9,976 | 10,162 | ||||||||||
General insurance business
(i) Claims and loss adjustment expenses
| Group | ||||||||||||
| Gross | Reinsurance | Net | ||||||||||
| £m | £m | £m | ||||||||||
| Notified claims | 3,894 | (264 | ) | 3,630 | ||||||||
| Incurred but not reported | 1,572 | 1 | 1,573 | |||||||||
| At 1 January 2008 | 5,466 | (263 | ) | 5,203 | ||||||||
| Cash paid for claims settled in the year | (3,969 | ) | 97 | (3,872 | ) | |||||||
| Increase/(decrease) in liabilities | ||||||||||||
| – arising from current year claims | 4,079 | (45 | ) | 4,034 | ||||||||
| – arising from prior year claims | (241 | ) | (66 | ) | (307 | ) | ||||||
| Net exchange differences | 143 | (10 | ) | 133 | ||||||||
| At 31 December 2008 | 5,478 | (287 | ) | 5,191 | ||||||||
| Notified claims | 4,052 | (260 | ) | 3,792 | ||||||||
| Incurred but not reported | 1,426 | (27 | ) | 1,399 | ||||||||
| At 1 January 2009 | 5,478 | (287 | ) | 5,191 | ||||||||
| Cash paid for claims settled in the year | (3,812 | ) | 69 | (3,743 | ) | |||||||
| Increase/(decrease) in liabilities | ||||||||||||
| – arising from current year claims | 4,383 | (23 | ) | 4,360 | ||||||||
| – arising from prior year claims | (79 | ) | (53 | ) | (132 | ) | ||||||
| Disposal of subsidiary | (124 | ) | 5 | (119 | ) | |||||||
| Net exchange differences | (44 | ) | 3 | (41 | ) | |||||||
| At 31 December 2009 | 5,802 | (286 | ) | 5,516 | ||||||||
| Notified claims | 4,101 | (276 | ) | 3,825 | ||||||||
| Incurred but not reported | 1,701 | (10 | ) | 1,691 | ||||||||
| At 31 December 2009 | 5,802 | (286 | ) | 5,516 | ||||||||
266
Financial statements
Notes on the accounts
Outstanding claims provisions are not discounted for the time value of money except for claims settled by periodic payments under the Courts Act 2003. Total reserves for claims settled prior to the year end by periodic payment are £91.6 million (2008 – £29.0 million) gross and £26.1 million (2008 – £3.6 million) net of reinsurance. The corresponding undiscounted amounts are £275.7 million (2008 – £85.0 million) gross and £61.8 million (2008 – £12.1 million) net of reinsurance. The category of claims subject to periodical payments is motor liability. The rate of interest used for the calculation of present values is 4.14% being the 40-year gilt rate as at October 2009. The average interval between the date of the last future cash flow being discounted and the end of the financial year is 49.8 years. Reserves include provision for claims that may be settled in due course by periodic payments under the Courts Act 2003.
(ii) Provisions for unearned premiums and unexpired short-term insurance risks
| Group | ||||||||||||
| Unearned premium provision | Gross | Reinsurance | Net | |||||||||
| £m | £m | £m | ||||||||||
| At 1 January 2008 | 2,752 | (41 | ) | 2,711 | ||||||||
| Movement in the year | (105 | ) | (38 | ) | (143 | ) | ||||||
| Exchange differences | 64 | — | 64 | |||||||||
| At 1 January 2009 | 2,711 | (79 | ) | 2,632 | ||||||||
| Increase in the year | 1,747 | (63 | ) | 1,684 | ||||||||
| Release in the year | (1,813 | ) | 75 | (1,738 | ) | |||||||
| Disposal of subsidiary | (145 | ) | — | (145 | ) | |||||||
| Exchange differences | (10 | ) | — | (10 | ) | |||||||
| At 31 December 2009 | 2,490 | (67 | ) | 2,423 | ||||||||
The unearned premium provision is included within Accruals, deferred income and other liabilities (Note 22).
| Group | ||||||||||||
| Gross performance of life business (life contracts) | 2009 | 2008 | 2007 | |||||||||
| £m | £m | £m | ||||||||||
| Opening net assets | 588 | 604 | 579 | |||||||||
| Profit from existing business: | ||||||||||||
| Expected return | 35 | 41 | 35 | |||||||||
| Experience variances | (38 | ) | (15 | ) | (23 | ) | ||||||
| (3 | ) | 26 | 12 | |||||||||
New business contribution (1) | 31 | 14 | 5 | |||||||||
| Operating assumption changes | 10 | 2 | 6 | |||||||||
| Investment return variances | 32 | (46 | ) | (14 | ) | |||||||
| Economic assumption changes | (4 | ) | (2 | ) | — | |||||||
| Transfer to shareholders’ funds | (106 | ) | — | — | ||||||||
| Other | 6 | (10 | ) | 16 | ||||||||
| Closing net assets | 554 | 588 | 604 | |||||||||
Note:
| (1) | New business contribution represents the present value of future profits on new insurance contract business written during the year. |
267
Notes on the accounts continued
24 Insurance business continued
| Group | ||||||||
| Life | Investment | |||||||
| Movement in provision for liabilities under life contracts and under linked and other investment contracts | contracts | contracts | ||||||
| £m | £m | |||||||
| At 1 January 2008 | 4,696 | 5,555 | ||||||
| Premiums received | 868 | 330 | ||||||
| Fees and expenses | (21 | ) | (38 | ) | ||||
| Investment return | 17 | (970 | ) | |||||
| Actuarial adjustments | (233 | ) | — | |||||
| Account balances paid on surrender and other terminations in the year | (734 | ) | (455 | ) | ||||
| Transfers to disposal groups | (686 | ) | — | |||||
| Exchange and other adjustments | 591 | 904 | ||||||
| At 1 January 2009 | 4,498 | 5,326 | ||||||
| Premiums received | 528 | 349 | ||||||
| Fees and expenses | (16 | ) | (13 | ) | ||||
| Investment return | 400 | 442 | ||||||
| Actuarial adjustments | (205 | ) | — | |||||
| Account balances paid on surrender and other terminations in the year | (546 | ) | (712 | ) | ||||
| Exchange and other adjustments | (180 | ) | (263 | ) | ||||
| At 31 December 2009 | 4,479 | 5,129 | ||||||
Investment contracts are presented within customer deposits.
Changes in assumptions during the year were not material to the profit recognised.
| Group | ||||||||||||
| Assets backing linked liabilities | 2009 | 2008 | 2007 | |||||||||
| £m | £m | £m | ||||||||||
| Debt securities | 4,484 | 4,500 | 2,899 | |||||||||
| Equity securities | 4,642 | 4,816 | 6,863 | |||||||||
| Cash and cash equivalents | 102 | 81 | 68 | |||||||||
| The associated liabilities are: | ||||||||||||
| Linked contracts and participating bonds classified as insurance contracts | 4,175 | 4,189 | 4,398 | |||||||||
| Linked contracts classified as investment contracts | 5,053 | 5,208 | 5,432 | |||||||||
There are no options and guarantees relating to life assurance contracts that could in aggregate have a material effect on the amount, timing and uncertainty of the Group’s future cash flows.
268
Financial statements
Notes on the accounts
Insurance risk
Insurance risk is the risk of fluctuations in the timing, frequency or severity of insured events, relative to the expectations of the Group at the time of underwriting.
Underwriting and pricing risk
The Group manages underwriting and pricing risk through the use of underwriting guidelines which detail the class, nature and type of business that may be accepted; pricing policies by product line and by brand; and centralised control of policy wordings and any subsequent changes.
Claims management risk
The risk that claims are handled or paid inappropriately is managed using a range of IT system controls and manual processes conducted by experienced staff. These, together with a range of detailed policies and procedures ensure that all claims are handled in a timely, appropriate and accurate manner.
Reinsurance risk
Reinsurance is used to protect against the impact of major catastrophic events or unforeseen volumes of, or adverse trends in, large individual claims and to transfer risk that is outside the Group’s current risk appetite.
Reinsurance of risks above the Group’s risk appetite is only effective if the reinsurance premium is economic and the counterparty is financially secure. Acceptable reinsurers are rated A- or better unless specifically authorised.
Reserving risk
Reserving risk relates to both premiums and claims. It is the risk that reserves are assessed incorrectly such that insufficient funds have been retained to pay or handle claims as the amounts fall due. Claims development data provides information on the historical pattern of reserving risk.
| Accident year | ||||||||||||||||||||||||||||||||||||||||
| Insurance claims – gross | 2001 | 2002 | 2003 | 2004 | 2005 | 2006 | 2007 | 2008 | 2009 | Total | ||||||||||||||||||||||||||||||
| £m | £m | £m | £m | £m | £m | £m | £m | £m | £m | |||||||||||||||||||||||||||||||
Estimate of ultimate claims costs: | ||||||||||||||||||||||||||||||||||||||||
| At end of accident year | 2,395 | 3,013 | 3,658 | 3,710 | 4,265 | 4,269 | 4,621 | 4,080 | 4,383 | 34,394 | ||||||||||||||||||||||||||||||
| One year later | (70 | ) | 91 | (140 | ) | (186 | ) | (92 | ) | (275 | ) | (71 | ) | 29 | (714 | ) | ||||||||||||||||||||||||
| Two years later | 20 | 1 | (106 | ) | (88 | ) | (147 | ) | (77 | ) | (5 | ) | (402 | ) | ||||||||||||||||||||||||||
| Three years later | 12 | (12 | ) | (55 | ) | (85 | ) | (60 | ) | (16 | ) | (216 | ) | |||||||||||||||||||||||||||
| Four years later | (40 | ) | (17 | ) | (47 | ) | (31 | ) | (55 | ) | (190 | ) | ||||||||||||||||||||||||||||
| Five years later | (1 | ) | (19 | ) | (21 | ) | — | (41 | ) | |||||||||||||||||||||||||||||||
| Six years later | (9 | ) | (11 | ) | (32 | ) | (52 | ) | ||||||||||||||||||||||||||||||||
| Seven years later | 6 | (14 | ) | (8 | ) | |||||||||||||||||||||||||||||||||||
| Eight years later | 4 | 4 | ||||||||||||||||||||||||||||||||||||||
| Current estimate of | ||||||||||||||||||||||||||||||||||||||||
| cumulative claims | 2,317 | 3,032 | 3,257 | 3,320 | 3,911 | 3,901 | 4,545 | 4,109 | 4,383 | 32,775 | ||||||||||||||||||||||||||||||
Cumulative payments to date | (2,247 | ) | (2,961 | ) | (3,110 | ) | (3,080 | ) | (3,582 | ) | (3,316 | ) | (3,716 | ) | (2,995 | ) | (2,179 | ) | (27,186 | ) | ||||||||||||||||||||
| 70 | 71 | 147 | 240 | 329 | 585 | 829 | 1,114 | 2,204 | 5,589 | |||||||||||||||||||||||||||||||
| Liability in respect of earlier years | 109 | |||||||||||||||||||||||||||||||||||||||
| Claims handling costs | 104 | |||||||||||||||||||||||||||||||||||||||
| Gross general insurance claims liability | 5,802 | |||||||||||||||||||||||||||||||||||||||
269
Notes on the accounts continued
24 Insurance business continued
| Accident year | ||||||||||||||||||||||||||||||||||||||||
Insurance claims – | 2001 | 2002 | 2003 | 2004 | 2005 | 2006 | 2007 | 2008 | 2009 | Total | ||||||||||||||||||||||||||||||
net of reinsurance | £m | £m | £m | £m | £m | £m | £m | £m | £m | £m | ||||||||||||||||||||||||||||||
| Estimate of ultimate | ||||||||||||||||||||||||||||||||||||||||
| claims costs: | ||||||||||||||||||||||||||||||||||||||||
| At end of accident year | 2,011 | 2,584 | 3,215 | 3,514 | 4,168 | 4,215 | 4,572 | 4,034 | 4,360 | 32,673 | ||||||||||||||||||||||||||||||
| One year later | (61 | ) | 59 | (106 | ) | (168 | ) | (67 | ) | (261 | ) | (90 | ) | 24 | (670 | ) | ||||||||||||||||||||||||
| Two years later | 22 | (12 | ) | (103 | ) | (90 | ) | (161 | ) | (87 | ) | (17 | ) | (448 | ) | |||||||||||||||||||||||||
| Three years later | 13 | (3 | ) | (53 | ) | (81 | ) | (64 | ) | (23 | ) | (211 | ) | |||||||||||||||||||||||||||
| Four years later | (41 | ) | (21 | ) | (44 | ) | (46 | ) | (60 | ) | (212 | ) | ||||||||||||||||||||||||||||
| Five years later | 1 | (24 | ) | (23 | ) | (19 | ) | (65 | ) | |||||||||||||||||||||||||||||||
| Six years later | (19 | ) | (5 | ) | (34 | ) | (58 | ) | ||||||||||||||||||||||||||||||||
| Seven years later | — | (11 | ) | (11 | ) | |||||||||||||||||||||||||||||||||||
| Eight years later | 1 | 1 | ||||||||||||||||||||||||||||||||||||||
| Current estimate of | ||||||||||||||||||||||||||||||||||||||||
| cumulative claims | 1,927 | 2,567 | 2,852 | 3,110 | 3,816 | 3,844 | 4,465 | 4,058 | 4,360 | 30,999 | ||||||||||||||||||||||||||||||
| Cumulative payments | ||||||||||||||||||||||||||||||||||||||||
| to date | (1,881 | ) | (2,513 | ) | (2,759 | ) | (2,923 | ) | (3,503 | ) | (3,278 | ) | (3,665 | ) | (2,970 | ) | (2,157 | ) | (25,649 | ) | ||||||||||||||||||||
| 46 | 54 | 93 | 187 | 313 | 566 | 800 | 1,088 | 2,203 | 5,350 | |||||||||||||||||||||||||||||||
Liability in respect of earlier years | 62 | |||||||||||||||||||||||||||||||||||||||
| Claims handling costs | 104 | |||||||||||||||||||||||||||||||||||||||
| Net general insurance claims liability | 5,516 | |||||||||||||||||||||||||||||||||||||||
Claims reserves
It is the Group’s policy to hold undiscounted claims reserves (including reserves to cover claims which have been incurred but not reported (IBNR reserves) for all classes at a sufficient level to meet all liabilities as they fall due.
The Group’s focus is on high volume and relatively straightforward products, for example home and motor. This facilitates the generation of comprehensive underwriting and claims data, which are used to accurately price and monitor the risks accepted.
The following table shows loss ratios for each major class of business, gross and net of reinsurance.
| 2009 | 2008 | 2007 | |||||||||||||||||||||||||||
| Earned | Claims | Loss | Earned | Loss | Earned | Loss | |||||||||||||||||||||||
| premiums | incurred | ratio | premiums | ratio | premiums | ratio | |||||||||||||||||||||||
| £m | £m | % | £m | % | £m | % | |||||||||||||||||||||||
| Residential property | Gross | 1,129 | 597 | 53 | 1,103 | 48 | 1,087 | 82 | |||||||||||||||||||||
| Net | 1,065 | 596 | 56 | 1,034 | 51 | 1,020 | 86 | ||||||||||||||||||||||
| Personal motor | Gross | 2,984 | 3,062 | 103 | 3,173 | 84 | 3,254 | 80 | |||||||||||||||||||||
| Net | 2,901 | 2,997 | 103 | 3,075 | 83 | 3,161 | 81 | ||||||||||||||||||||||
| Commercial property | Gross | 182 | 74 | 41 | 194 | 41 | 211 | 55 | |||||||||||||||||||||
| Net | 166 | 74 | 45 | 174 | 46 | 191 | 60 | ||||||||||||||||||||||
| Commercial motor | Gross | 136 | 136 | 100 | 143 | 91 | 142 | 75 | |||||||||||||||||||||
| Net | 135 | 132 | 98 | 141 | 91 | 133 | 80 | ||||||||||||||||||||||
| Other | Gross | 848 | 435 | 51 | 994 | 42 | 851 | 40 | |||||||||||||||||||||
| Net | 845 | 429 | 51 | 828 | 51 | 839 | 41 | ||||||||||||||||||||||
| Total | Gross | 5,279 | 4,304 | 82 | 5,607 | 68 | 5,545 | 73 | |||||||||||||||||||||
| Net | 5,112 | 4,228 | 83 | 5,252 | 71 | 5,344 | 75 | ||||||||||||||||||||||
The Group has no interest rate exposure from general insurance liabilities because provisions for claims under short-term insurance contracts are not discounted.
270
Financial statements
Notes on the accounts
Frequency and severity of specific risks and sources of uncertainty
Most general insurance contracts are written on an annual basis, which means that the Group’s liability extends for a 12 month period, after which the Group is entitled to decline or renew or can impose renewal terms by amending the premium, terms and conditions, or both.
The frequency and severity of claims and the sources of uncertainty for the key classes that the Group is exposed to are as follows:
Motor insurance contracts (personal and commercial)
Claims experience is quite variable, due to a wide range of factors, but the principal ones are age, sex and driving experience of the driver, type and nature of vehicle, use of vehicle and area.
There are many sources of uncertainty that will affect the Group’s experience under motor insurance, including operational risk, reserving risk, premium rates not matching claims inflation rates, weather, the social, economic and legislative environment and reinsurance failure risk.
Property insurance contracts (residential and commercial)
The major causes of claims for property insurance are theft, flood, escape of water, fire, storm, subsidence and various types of accidental damage.
The major source of uncertainty in the Group’s property contracts is the volatility of weather. Over a longer period, the strength of the economy is also a factor.
Other commercial insurance contracts
Other commercial claims come mainly from business interruption and loss arising from the negligence of the insured (liability insurance). Business interruption losses come from the loss of income, revenue and/or profit as a result of property damage claims. Liability insurance includes employers’ liability and public/products’ liability. Liability insurance is written on an occurrence basis, and is subject to claims that are identified over a substantial period of time, but where the loss event occurred during the life of the policy.
Fluctuations in the social and economic climate are a source of uncertainty in the Group’s business interruption and general liability accounts. Other sources of uncertainty are changes in the law, or its interpretation, and reserving risk. Other uncertainties are significant events (for example terrorist attacks) and any emerging new heads of damage or types of claim that are not envisaged when the policy is written.
The following table shows the expected maturity of insurance liabilities up to 20 years excluding those linked directly to the financial assets backing these contracts, £4,175 million (2008 – £4,189 million; 2007 – £4,398 million).
| Group | ||||||||||||||||||||||||
| 0-3 months | 3-12 months | 1-3 years | 3-5 years | 5-10 years | 10-20 years | |||||||||||||||||||
| £m | £m | £m | £m | £m | £m | |||||||||||||||||||
| 2009 | 561 | 1,685 | 1,898 | 949 | 665 | 73 | ||||||||||||||||||
| 2008 | 623 | 1,645 | 1,899 | 903 | 487 | 53 | ||||||||||||||||||
| 2007 | 710 | 1,796 | 1,961 | 882 | 395 | 33 | ||||||||||||||||||
271
Notes on the accounts continued
24 Insurance business continued
Life business
The Group’s three UK regulated life companies, National Westminster Life Assurance Limited (NatWest Life), Royal Scottish Assurance plc (RSA) and Direct Line Life Insurance Company Limited, are required to meet minimum capital requirements at all times under the UK Financial Service Authority’s Prudential Sourcebook. The capital resources covering the regulatory requirement are not transferable to other areas of the Group. To ensure that the capital requirement is satisfied at all times, each company holds an additional voluntary buffer above the regulatory minimum.
The Group is not exposed to price, currency, credit, or interest risk on unit linked life contracts but it is exposed to variation in management fees. A decrease of 10% in the value of the assets would reduce the asset management fees by £1 million per annum (2008 – £5 million). The Group writes insurance contracts with minimum guaranteed death benefits that expose it to the risk that declines in the value of underlying investments may increase the Group’s net exposure to death risk. The Group’s long-term assurance contracts include whole-life, term assurance, endowment assurances, flexible whole life, pension and annuity contracts that are expected to remain in force for an extended period of time.
Contracts under which the Group does not accept significant insurance risk are classified as investment contracts. As required by IFRS 4 ‘Insurance Contracts’ long-term business provisions are calculated in accordance with existing local GAAP (UK accounting standard FRS 27 ‘Life Assurance’).
Estimations (assumptions) including future mortality, morbidity, persistency and levels of expenses are made in calculating actuarial reserves. Key metrics for the UK include:
| Assumptions | 2009 | 2008 | 2007 | |
| Valuation interest rate | ||||
| Term assurance | 2.9% | 2.50% | 3.00% | |
| Interest | 2.9% | 2.50% | 3.00% | |
| Unit growth | 4.4% | 3.70% | 3.50% | |
| Expense inflation | 4.4% | 3.00% | 4.00% |
Sample mortality rates, expressed as deaths per million per annum, for term assurance products (age 40).
| Mortality | 2009 | 2008 | 2007 | |
| Male non-smoker | 674 | 723 | 810 | |
| Male smoker | 1,542 | 1,590 | 1,830 | |
| Female non-smoker | 497 | 568 | 460 | |
| Female smoker | 1,136 | 1,277 | 1,310 |
Expenses:
| 2009 | 2008 | 2007 | ||||||||||
| Pre-2000 products – RSA | per annum | per annum | per annum | |||||||||
| Lifestyle protection plan | £26.68 | £29.30 | £25.18 | |||||||||
| Mortgage savings plan | £59.80 | £65.92 | £56.67 | |||||||||
| Pre-2000 products – NatWest Life | ||||||||||||
| Term assurances | £23.23 | £26.01 | £26.01 | |||||||||
| Linked life bonds | £23.23 | £26.01 | £23.17 | |||||||||
| Post-2000 products | ||||||||||||
| Term assurances | £20.70 | £23.17 | £23.16 | |||||||||
| Guaranteed bonds | £23.00 | £25.71 | £25.71 | |||||||||
272
Financial statements
Notes on the accounts
Frequency and severity of claims – for contracts where death is the insured risk, the most significant factors that could increase the overall frequency of claims are epidemics or widespread changes in lifestyle, resulting in earlier or more claims than expected.
For contracts where survival is the insured risk, the most significant factor is continued improvement in medical science and social conditions that would increase longevity.
For contracts with fixed and guaranteed benefits and fixed future premiums, there are no mitigating terms and conditions that reduce the insurance risk accepted. Participating contracts can result in a significant portion of the insurance risk being shared with the insured party.
Sources of uncertainty in the estimation of future benefit payments and premium receipts – the Group uses base tables of standard mortality appropriate to the type of contract being written and the territory in which the insured person resides. These are adjusted to reflect the Group’s experience, mortality improvements and voluntary termination behaviour.
| Sensitivity factor | Description of sensitivity factor applied |
| Interest rate and investment return | Change in market interest rates of ±1%. |
| The test allows consistently for similar changes to investment returns | |
| and movements in the market value of backing fixed interest securities. | |
| Expenses | Increase in maintenance expenses of 10% |
| Assurance mortality/morbidity | Increase in mortality/morbidity rates for assurance contracts of 5% |
| Annuitant mortality | Reduction in mortality rates for annuity contracts of 5% |
The above sensitivity factors are applied via actuarial and statistical models, with the following effect on the financial statements.
| Increase/(decrease) in profit and equity | ||||||||||||
| 2009 | 2008 | 2007 | ||||||||||
| Risk factor | £m | £m | £m | |||||||||
| Interest rates | (11 | ) | (11 | ) | (18 | ) | ||||||
| Interest rates | 10 | 11 | 15 | |||||||||
| Expenses | (9 | ) | (7 | ) | (5 | ) | ||||||
| Assurance mortality/morbidity | (12 | ) | (9 | ) | (8 | ) | ||||||
Limitations of sensitivity analysis: the above tables demonstrate the effect of a change in a key UK assumption whilst other assumptions remain unaffected. In reality, such an occurrence is unlikely, due to correlation between the assumptions and other factors. It should also be noted that these sensitivities are non-linear, and larger or smaller impacts should not be interpolated or extrapolated from these results. The sensitivity analyses do not take into consideration that assets and liabilities are actively managed and may vary at the time that any actual market movement occurs.
25 Subordinated liabilities
| Group | Company | |||||||||||||||||||||||
| 2009 | 2008 | 2007 | 2009 | 2008 | 2007 | |||||||||||||||||||
| £m | £m | £m | £m | £m | £m | |||||||||||||||||||
| Dated loan capital | 24,597 | 30,162 | 23,065 | 6,526 | 7,421 | 5,585 | ||||||||||||||||||
| Undated loan capital | 8,164 | 11,697 | 9,866 | 574 | 1,071 | 781 | ||||||||||||||||||
| Preference shares | 2,000 | 2,194 | 1,686 | 1,662 | 1,822 | 1,377 | ||||||||||||||||||
| Trust preferred securities | 2,891 | 5,101 | 3,426 | — | — | — | ||||||||||||||||||
| 37,652 | 49,154 | 38,043 | 8,762 | 10,314 | 7,743 | |||||||||||||||||||
273
Notes on the accounts continued
25 Subordinated liabilities continued
In April 2009, the Group concluded a series of exchange offers and tender offers with the holders of a number of Tier 1 and Upper Tier 2 securities. The exchanges involving instruments classified as liabilities all met the criteria in IFRS for treatment as the extinguishment of the original liability and the recognition of a new financial liability. Gains on these exchanges, and on the redemption of securities classified as liabilities for cash, totalling £3,790 million were credited to income. No amounts have been recognised in income in relation to the redemption of securities classified as equity or minority interest in the Group financial statements. The difference between the consideration and the carrying value for these securities amounting to £829 million has been recorded in equity.
The Group has undertaken that, unless otherwise agreed with the European Commission, neither the company nor any of its direct or indirect subsidiaries (excluding companies in the ABN AMRO Group) will pay external investors any dividends or coupons on existing hybrid capital instruments (including preference shares, B shares and upper and lower tier 2 instruments) from a date starting not later than 30 April 2010 and for a period of two years thereafter ("the deferral period"), or exercise any call rights in relation to these capital instruments between 24 November 2009 and the end of the deferral period, unless there is a legal obligation to do so. Hybrid capital instruments issued after 24 November 2009 will generally not be subject to the restriction on dividend or coupon payments or call options.
Certain preference shares issued by the company are classified as liabilities; these securities remain subject to the capital maintenance rules of the Companies Act 2006.
The following tables analyse the remaining maturity of subordinated liabilities by (1) the final redemption date; and (2) the next call date.
| Group | ||||||||||||||||||||||||||||
| 2009 – final redemption | 2010 | 2011 | 2012-2014 | 2015-2019 | Thereafter | Perpetual | Total | |||||||||||||||||||||
| £m | £m | £m | £m | £m | £m | £m | ||||||||||||||||||||||
| Sterling | 122 | 8 | 164 | 1,778 | — | 2,603 | 4,675 | |||||||||||||||||||||
| US dollars | 407 | 196 | 1,457 | 5,314 | 323 | 5,294 | 12,991 | |||||||||||||||||||||
| Euro | 1,589 | 443 | 1,414 | 7,360 | 1,664 | 4,410 | 16,880 | |||||||||||||||||||||
| Other | 26 | — | 554 | 1,905 | — | 621 | 3,106 | |||||||||||||||||||||
| Total | 2,144 | 647 | 3,589 | 16,357 | 1,987 | 12,928 | 37,652 | |||||||||||||||||||||
| Group | ||||||||||||||||||||||||||||||||
| 2009 – call date | Currently | 2010 | 2011 | 2012-2014 | 2015-2019 | Thereafter | Perpetual | Total | ||||||||||||||||||||||||
| £m | £m | £m | £m | £m | £m | £m | £m | |||||||||||||||||||||||||
| Sterling | 174 | 408 | 202 | 496 | 1,720 | 1,504 | 171 | 4,675 | ||||||||||||||||||||||||
| US dollars | 1,811 | 1,814 | 1,429 | 3,171 | 1,139 | 1,891 | 1,736 | 12,991 | ||||||||||||||||||||||||
| Euro | 564 | 2,849 | 1,755 | 3,142 | 5,501 | 709 | 2,360 | 16,880 | ||||||||||||||||||||||||
| Other | 419 | 576 | — | 1,025 | 914 | 172 | — | 3,106 | ||||||||||||||||||||||||
| Total | 2,968 | 5,647 | 3,386 | 7,834 | 9,274 | 4,276 | 4,267 | 37,652 | ||||||||||||||||||||||||
| Group | ||||||||||||||||||||||||||||
| 2008 – final redemption | 2009 | 2010 | 2011-2013 | 2014-2018 | Thereafter | Perpetual | Total | |||||||||||||||||||||
| £m | £m | £m | £m | £m | £m | £m | ||||||||||||||||||||||
| Sterling | 192 | 15 | 176 | 1,458 | 370 | 6,287 | 8,498 | |||||||||||||||||||||
| US dollars | 1,308 | 342 | 1,123 | 7,435 | 561 | 7,655 | 18,424 | |||||||||||||||||||||
| Euro | 1,865 | 1,378 | 1,991 | 7,923 | 1,957 | 4,087 | 19,201 | |||||||||||||||||||||
| Other | 29 | — | 7 | 2,284 | 34 | 677 | 3,031 | |||||||||||||||||||||
| Total | 3,394 | 1,735 | 3,297 | 19,100 | 2,922 | 18,706 | 49,154 | |||||||||||||||||||||
| Group | ||||||||||||||||||||||||||||||||
| 2008 – call date | Currently | 2009 | 2010 | 2011-2013 | 2014-2018 | Thereafter | Perpetual | Total | ||||||||||||||||||||||||
| £m | £m | £m | £m | £m | £m | £m | £m | |||||||||||||||||||||||||
| Sterling | — | 192 | 752 | 1,039 | 2,729 | 3,615 | 171 | 8,498 | ||||||||||||||||||||||||
| US dollars | 1,833 | 3,247 | 2,601 | 4,814 | 1,951 | 2,053 | 1,925 | 18,424 | ||||||||||||||||||||||||
| Euro | — | 2,351 | 3,137 | 5,699 | 7,021 | 942 | 51 | 19,201 | ||||||||||||||||||||||||
| Other | — | 500 | 405 | 922 | 954 | 250 | — | 3,031 | ||||||||||||||||||||||||
| Total | 1,833 | 6,290 | 6,895 | 12,474 | 12,655 | 6,860 | 2,147 | 49,154 | ||||||||||||||||||||||||
274
Financial statements
Notes on the accounts
| Group | |||||||||||||||||||||||||||||||
| 2007 – final redemption | 2008 | 2009 | 2010-2012 | 2013-2017 | Thereafter | Perpetual | Total | ||||||||||||||||||||||||
| £m | £m | £m | £m | £m | £m | £m | |||||||||||||||||||||||||
| Sterling | 194 | — | 34 | 1,405 | 389 | 5,818 | 7,840 | ||||||||||||||||||||||||
| US dollars | 903 | 1,540 | 620 | 5,477 | 743 | 3,985 | 13,268 | ||||||||||||||||||||||||
| Euro | 764 | 1,312 | 1,405 | 5,711 | 1,674 | 3,164 | 14,030 | ||||||||||||||||||||||||
| Other | 35 | — | 6 | 2,076 | 325 | 463 | 2,905 | ||||||||||||||||||||||||
| Total | 1,896 | 2,852 | 2,065 | 14,669 | 3,131 | 13,430 | 38,043 | ||||||||||||||||||||||||
| Group | |||||||||||||||||||||||||||||||
| 2007 – call date | Currently | 2008 | 2009 | 2010-2012 | 2013-2017 | Thereafter | Perpetual | Total | |||||||||||||||||||||||
| £m | £m | £m | £m | £m | £m | £m | £m | ||||||||||||||||||||||||
| Sterling | — | 194 | — | 1,497 | 2,456 | 3,527 | 166 | 7,840 | |||||||||||||||||||||||
| US dollars | 1,347 | 1,492 | 2,585 | 4,485 | 1,678 | 1,681 | — | 13,268 | |||||||||||||||||||||||
| Euro | — | 1,612 | 1,685 | 4,992 | 5,091 | 611 | 39 | 14,030 | |||||||||||||||||||||||
| Other | — | 35 | 431 | 843 | 1,468 | 128 | — | 2,905 | |||||||||||||||||||||||
| Total | 1,347 | 3,333 | 4,701 | 11,817 | 10,693 | 5,947 | 205 | 38,043 | |||||||||||||||||||||||
| Company | |||||||||||||||||||||||||||||||
| 2009 – final redemption | 2010 | 2011 | 2012-2014 | 2015-2019 | Thereafter | Perpetual | Total | ||||||||||||||||||||||||
| £m | £m | £m | £m | £m | £m | £m | |||||||||||||||||||||||||
| Sterling | 13 | — | — | — | 400 | 200 | 613 | ||||||||||||||||||||||||
| US dollars | 62 | 185 | 1,075 | 630 | 2,578 | 2,013 | 6,543 | ||||||||||||||||||||||||
| Euro | 55 | — | — | — | 1,551 | — | 1,606 | ||||||||||||||||||||||||
| Total | 130 | 185 | 1,075 | 630 | 4,529 | 2,213 | 8,762 | ||||||||||||||||||||||||
| Company | |||||||||||||||||||||||||||||||
| 2009 – call date | Currently | 2010 | 2011 | 2012-2014 | 2015-2019 | Thereafter | Perpetual | Total | |||||||||||||||||||||||
| £m | £m | £m | £m | £m | £m | £m | £m | ||||||||||||||||||||||||
| Sterling | — | 212 | — | — | 400 | — | 1 | 613 | |||||||||||||||||||||||
| US dollars | 1,039 | 48 | 185 | 2,794 | 630 | 1,847 | — | 6,543 | |||||||||||||||||||||||
| Euro | — | 55 | — | 1,107 | 444 | — | — | 1,606 | |||||||||||||||||||||||
| Total | 1,039 | 315 | 185 | 3,901 | 1,474 | 1,847 | 1 | 8,762 | |||||||||||||||||||||||
| Company | |||||||||||||||||||||||||||||||
| 2008 – final redemption | 2009 | 2010 | 2011-2013 | 2014-2018 | Thereafter | Perpetual | Total | ||||||||||||||||||||||||
| £m | £m | £m | £m | £m | £m | £m | |||||||||||||||||||||||||
| Sterling | 9 | — | — | — | 400 | 200 | 609 | ||||||||||||||||||||||||
| US dollars | 415 | — | 717 | 1,381 | 2,863 | 2,661 | 8,037 | ||||||||||||||||||||||||
| Euro | — | — | — | — | 1,668 | — | 1,668 | ||||||||||||||||||||||||
| Total | 424 | — | 717 | 1,381 | 4,931 | 2,861 | 10,314 | ||||||||||||||||||||||||
| Company | |||||||||||||||||||||||||||||||
| 2008 – call date | Currently | 2009 | 2010 | 2011-2013 | 2014-2018 | Thereafter | Perpetual | Total | |||||||||||||||||||||||
| £m | £m | £m | £m | £m | £m | £m | £m | ||||||||||||||||||||||||
| Sterling | — | 9 | 199 | — | 400 | — | 1 | 609 | |||||||||||||||||||||||
| US dollars | 582 | 1,511 | 682 | 1,296 | 2,710 | 1,256 | — | 8,037 | |||||||||||||||||||||||
| Euro | — | — | — | 1,190 | 478 | — | — | 1,668 | |||||||||||||||||||||||
| Total | 582 | 1,520 | 881 | 2,486 | 3,588 | 1,256 | 1 | 10,314 | |||||||||||||||||||||||
| Company | |||||||||||||||||||||||||||||||
| 2007 – final redemption | 2008 | 2009 | 2010-2012 | 2013-2017 | Thereafter | Perpetual | Total | ||||||||||||||||||||||||
| £m | £m | £m | £m | £m | £m | £m | |||||||||||||||||||||||||
| Sterling | 13 | — | — | — | 399 | 199 | 611 | ||||||||||||||||||||||||
| US dollars | 61 | 199 | 148 | 1,204 | 2,259 | 1,935 | 5,806 | ||||||||||||||||||||||||
| Euro | 45 | — | — | — | 1,281 | — | 1,326 | ||||||||||||||||||||||||
| Total | 119 | 199 | 148 | 1,204 | 3,939 | 2,134 | 7,743 | ||||||||||||||||||||||||
| Company | |||||||||||||||||||||||||||||||
| 2007 – call date | Currently | 2008 | 2009 | 2010-2012 | 2013-2017 | Thereafter | Perpetual | Total | |||||||||||||||||||||||
| £m | £m | £m | £m | £m | £m | £m | £m | ||||||||||||||||||||||||
| Sterling | — | 13 | — | 198 | 399 | — | 1 | 611 | |||||||||||||||||||||||
| US dollars | 425 | 435 | 620 | 643 | 2,594 | 1,089 | — | 5,806 | |||||||||||||||||||||||
| Euro | — | 45 | — | 914 | 367 | — | — | 1,326 | |||||||||||||||||||||||
| Total | 425 | 493 | 620 | 1,755 | 3,360 | 1,089 | 1 | 7,743 | |||||||||||||||||||||||
275
Notes on the accounts continued
25 Subordinated liabilities continued
Dated loan capital
2009 £m | 2008 £m | 2007 £m | ||||||||||
| The company | ||||||||||||
| US$400 million 6.4% subordinated notes 2009 (redeemed April 2009) | — | 278 | 202 | |||||||||
US$300 million 6.375% subordinated notes 2011 (1) | 201 | 231 | 163 | |||||||||
US$750 million 5% subordinated notes 2013 (1) | 503 | 579 | 382 | |||||||||
US$750 million 5% subordinated notes 2014 (1) | 521 | 616 | 386 | |||||||||
US$250 million 5% subordinated notes 2014 (1) | 153 | 169 | 123 | |||||||||
US$675 million 5.05% subordinated notes 2015 (1) | 468 | 550 | 357 | |||||||||
US$350 million 4.7% subordinated notes 2018 (1) | 231 | 286 | 173 | |||||||||
| 2,077 | * | 2,709 | * | 1,786 | * | |||||||
| The Royal Bank of Scotland plc | ||||||||||||
| €255 million 5.25% subordinated notes 2008 | — | — | 192 | |||||||||
| €300 million 4.875% subordinated notes 2009 (redeemed March 2009) | — | 298 | 228 | |||||||||
| €1,000 million 6% subordinated notes 2013 | 1,014 | 1,083 | 790 | |||||||||
| US$50 million floating rate subordinated notes 2013 | 36 | 36 | 26 | |||||||||
| €1,000 million floating rate subordinated notes 2013 | — | — | 744 | |||||||||
| €500 million 6% subordinated notes 2013 | 452 | 487 | 374 | |||||||||
£150 million 10.5% subordinated bonds 2013 (2) | 177 | 180 | 169 | |||||||||
| US$1,250 million floating rate subordinated notes 2014 (redeemed July 2009) | — | 862 | 630 | |||||||||
| AUD590 million 6% subordinated notes 2014 (callable April 2010) | 330 | 281 | 254 | |||||||||
| AUD410 million floating rate subordinated notes 2014 (callable April 2010) | 229 | 195 | 182 | |||||||||
| CAD700 million 4.25% subordinated notes 2015 (callable March 2010) | 419 | 409 | 358 | |||||||||
| £250 million 9.625% subordinated bonds 2015 | 301 | 311 | 286 | |||||||||
| US$750 million floating rate subordinated notes 2015 (callable September 2010) | 462 | 513 | 374 | |||||||||
| €750 million floating rate subordinated notes 2015 | 741 | 783 | 564 | |||||||||
| CHF400 million 2.375% subordinated notes 2015 | 244 | 257 | 166 | |||||||||
| CHF100 million 2.375% subordinated notes 2015 | 69 | 72 | 41 | |||||||||
| CHF200 million 2.375% subordinated notes 2015 | 117 | 125 | 86 | |||||||||
| US$500 million floating rate subordinated notes 2016 (callable October 2011) | 308 | 346 | 252 | |||||||||
| US$1,500 million floating rate subordinated notes 2016 (callable April 2011) | 926 | 1,038 | 757 | |||||||||
| €500 million 4.5% subordinated notes 2016 (callable January 2011) | 476 | 511 | 379 | |||||||||
| CHF200 million 2.75% subordinated notes 2017 (callable December 2012) | 120 | 129 | 89 | |||||||||
| €100 million floating rate subordinated notes 2017 | 89 | 97 | 73 | |||||||||
| €500 million floating rate subordinated notes 2017 (callable June 2012) | 445 | 482 | 371 | |||||||||
| €750 million 4.35% subordinated notes 2017 (callable January 2017) | 728 | 770 | 548 | |||||||||
| AUD450 million 6.5% subordinated notes 2017 (callable February 2012) | 255 | 217 | 202 | |||||||||
| AUD450 million floating rate subordinated notes 2017 (callable February 2012) | 250 | 214 | 199 | |||||||||
US$1,500 million floating rate subordinated callable step up notes 2017 (callable August 2012) | 925 | 1,029 | 752 | |||||||||
| €2,000 million 6.93% subordinated notes 2018 (callable April 2018) | 2,017 | 2,136 | — | |||||||||
| US$125.6 million floating rate subordinated notes 2020 | 78 | 87 | 64 | |||||||||
| €1,000 million 4.625% subordinated notes 2021 (callable September 2016) | 962 | 1,019 | 724 | |||||||||
| €300 million CMS linked floating rate subordinated notes 2022 | 292 | 303 | 228 | |||||||||
| €144.4 million floating rate subordinated notes 2022 (callable June 2022) | 143 | 152 | — | |||||||||
| National Westminster Bank Plc | ||||||||||||
| US$1,000 million 7.375% subordinated notes 2009 (redeemed October 2009) | — | 697 | 507 | |||||||||
| €600 million 6% subordinated notes 2010 | 564 | 623 | 474 | |||||||||
| €500 million 5.125% subordinated notes 2011 | 455 | 488 | 376 | |||||||||
| £300 million 7.875% subordinated notes 2015 | 365 | 379 | 349 | |||||||||
| £300 million 6.5% subordinated notes 2021 | 351 | 376 | 330 | |||||||||
| Charter One Financial, Inc. | ||||||||||||
| US$400 million 6.375% subordinated notes 2012 | 255 | 287 | 212 | |||||||||
| RBS Holdings USA Inc. | ||||||||||||
| US$170 million subordinated loan capital floating rate notes 2009 (redeemed October 2009) | — | 116 | 85 | |||||||||
| US$100 million 5.575% senior subordinated revolving credit 2009 (redeemed October 2009) | — | 69 | 50 | |||||||||
US$500 million subordinated loan capital floating rate notes 2010 (callable on any interest payment date) | 311 | 342 | 249 | |||||||||
| First Active plc | ||||||||||||
| £60 million 6.375% subordinated bonds 2018 (callable April 2013) | 66 | 66 | 65 |
276
Financial statements
Notes on the accounts
Dated loan capital continued
2009 £m | 2008 £m | 2007 £m | ||||||||||
| Other minority interest subordinated issues | 12 | 16 | 16 | |||||||||
| ABN AMRO and subsidiaries | ||||||||||||
| €113 million 7.50% subordinated notes 2008 | — | — | 83 | |||||||||
| €182 million 6.00% fixed rate subordinated notes 2009 (redeemed April 2009) | — | 169 | 132 | |||||||||
| €182 million 6.13% fixed rate subordinated notes 2009 (redeemed June 2009) | — | 165 | 127 | |||||||||
| €1,150 million 4.63% fixed rate subordinated notes 2009 (redeemed May 2009) | — | 1,104 | 848 | |||||||||
| €250 million 4.70% CMS linked subordinated notes 2019 | 189 | 195 | 131 | |||||||||
| €800 million 6.25% fixed rate subordinated notes 2010 | 733 | 795 | 598 | |||||||||
| €100 million 5.13% flip flop Bermudan callable subordinated notes 2017 (callable December 2012) | 84 | 89 | 75 | |||||||||
€500 million floating rate Bermudan callable subordinated lower tier 2 notes 2018 (callable May 2013) | 426 | 455 | 350 | |||||||||
€1,000 million floating rate Bermudan callable subordinated lower tier 2 notes 2016 (callable September 2011) | 862 | 923 | 710 | |||||||||
| €13 million zero coupon subordinated notes 2029 (callable June 2010) | 4 | 8 | 2 | |||||||||
| €82 million floating rate subordinated notes 2017 | 68 | 72 | 55 | |||||||||
| €103 million floating rate subordinated lower tier 2 notes 2020 | 83 | 89 | 68 | |||||||||
| €170 million floating rate sinkable subordinated notes 2041 | 190 | 205 | 184 | |||||||||
| €15 million CMS linked floating rate subordinated lower tier 2 notes 2020 | 10 | 10 | 11 | |||||||||
€1,500 million floating rate Bermudan callable subordinated lower tier 2 notes 2015 (callable June 2010) | 1,326 | 1,419 | 1,087 | |||||||||
€5 million floating rate Bermudan callable subordinated lower tier 2 notes 2015 (callable October 2010) | 4 | 5 | 4 | |||||||||
€65 million floating rate Bermudan callable subordinated lower tier 2 notes 2015 (callable October 2010) | 58 | 62 | 48 | |||||||||
| US$12 million floating rate subordinated notes 2008 | — | — | 6 | |||||||||
| US$12 million floating rate subordinated notes 2008 | — | — | 6 | |||||||||
| US$165 million 6.14% subordinated notes 2019 | 132 | 152 | 94 | |||||||||
| US$72 million 5.98% subordinated notes 2019 | 34 | 49 | 7 | |||||||||
| US$500 million 4.65% subordinated notes 2018 | 293 | 359 | 214 | |||||||||
| US$500 million floating rate Bermudan callable subordinated notes 2013 | — | — | 232 | |||||||||
| US$1,500 million floating rate Bermudan callable subordinated notes 2015 (callable March 2010) | 887 | 982 | 717 | |||||||||
US$100 million floating rate Bermudan callable subordinated lower tier 2 notes 2015 (callable October 2010) | 62 | 68 | 50 | |||||||||
US$36 million floating rate Bermudan callable subordinated lower tier 2 notes 2015 (callable October 2010) | 22 | 25 | 18 | |||||||||
US$1,000 million floating rate Bermudan callable subordinated lower tier 2 notes 2017 (callable January 2012) | 598 | 661 | 479 | |||||||||
| AUD575 million 6.50% Bermudan callable subordinated lower tier 2 notes 2018 (callable May 2013) | 318 | 286 | 231 | |||||||||
AUD175 million 7.46% Bermudan callable subordinated lower tier 2 notes 2018 (callable May 2013) | 93 | 79 | 73 | |||||||||
| €26 million 7.42% subordinated notes 2016 | 27 | 28 | 20 | |||||||||
| €7 million 7.38% subordinated notes 2016 | 7 | 8 | 6 | |||||||||
| €256 million 5.25% fixed rate subordinated notes 2008 | — | — | 190 | |||||||||
| €13 million floating rate subordinated notes 2008 | — | — | 9 | |||||||||
| £42 million 8.18% subordinated notes 2010 | 7 | 15 | 19 | |||||||||
| £25 million 9.18% amortising MTN subordinated lower tier 2 notes 2011 | 8 | 9 | 15 | |||||||||
| £750 million 5% fixed rate Bermudan callable subordinated upper tier 2 notes 2016 | 727 | 728 | 642 | |||||||||
| US$250 million 7.75% fixed rate subordinated notes 2023 | 155 | 173 | 127 | |||||||||
| US$150 million 7.13% fixed rate subordinated notes 2093 | 93 | 104 | 76 | |||||||||
| US$250 million 7.00% fixed rate subordinated notes 2008 | — | — | 127 | |||||||||
US$68 million floating rate subordinated notes 2009 (6) | — | — | 34 | |||||||||
US$12 million floating rate subordinated notes 2009 (6) | — | — | 6 | |||||||||
BRL50 million floating rate subordinated notes 2013 (6) | — | — | 14 | |||||||||
BRL250 million floating rate subordinated notes 2013 (6) | — | — | 71 | |||||||||
BRL250 million floating rate subordinated notes 2014 (6) | — | — | 71 | |||||||||
BRL885 million floating rate subordinated notes 2014 (6) | — | — | 251 | |||||||||
BRL300 million floating rate subordinated notes 2014 (6) | — | — | 85 | |||||||||
| PKR0.80 million floating rate subordinated notes 2012 | — | 7 | 6 | |||||||||
| MYR200 million zero coupon subordinated notes 2017 | 36 | 40 | 30 | |||||||||
| TRY60 million floating rate callable subordinated notes 2012 (redeemed September 2009) | — | 34 | 25 | |||||||||
| 24,597 | 30,162 | 23,065 | ||||||||||
* In addition, the company has in issue €166 million (2008 and 2007 – €500 million) subordinated loan notes of €1,000 each, US$827 million (2008 and 2007 – US$1,950 million) subordinated loan notes of US$1,000 each and £93 million (2008 and 2007 – £400 million) subordinated loan notes of £1,000 each. These loan notes are included in the company balance sheet as loan capital but are reclassified as minority interest trust preferred securities on consolidation (see Note 26).
Notes:
| (1) | On-lent to The Royal Bank of Scotland plc on a subordinated basis. |
| (2) | Unconditionally guaranteed by the company. |
| (3) | In the event of certain changes in tax laws, dated loan capital issues may be redeemed in whole, but not in part, at the option of the issuer, at the principal amount thereof plus accrued interest, subject to prior regulatory approval. |
| (4) | Except as stated above, claims in respect of the Group’s dated loan capital are subordinated to the claims of other creditors. None of the Group’s dated loan capital is secured. |
| (5) | Interest on all floating rate subordinated notes is calculated by reference to market rates. |
| (6) | Transferred to Banco Santander. |
277
Notes on the accounts continued
25 Subordinated liabilities continued
Undated loan capital
2009 £m | 2008 £m | 2007 £m | ||||||||||
| The company | ||||||||||||
| US$163 million (2008 and 2007 – US$350 million) undated floating rate primary capital notes | ||||||||||||
(callable on any interest payment date) (3) | 101 | 240 | 175 | |||||||||
| US$762 million (2008 and 2007 – US$1,200 million) 7.648% perpetual regulatory tier one securities | ||||||||||||
(callable September 2031) (1, 2, 3) | 473 | 831 | 606 | |||||||||
| 574 | 1,071 | 781 | ||||||||||
| The Royal Bank of Scotland plc | ||||||||||||
| £150 million 5.625% undated subordinated notes (callable June 2032) | 144 | 144 | 144 | |||||||||
£96 million (2008 and 2007 – £175 million) 7.375% undated subordinated notes (callable August 2010) (3) | 101 | 190 | 183 | |||||||||
| €152 million 5.875% undated subordinated notes | — | — | 114 | |||||||||
£117 million (2008 and 2007 – £350 million) 6.25% undated subordinated notes (callable December 2012) (3) | 126 | 380 | 354 | |||||||||
£138 million (2008 and 2007 – £500 million) 6% undated subordinated notes (callable September 2014) (3) | 143 | 565 | 517 | |||||||||
€197 million (2008 and 2007 – €500 million) 5.125% undated subordinated notes (callable July 2014) (3) | 194 | 516 | 371 | |||||||||
€243 million (2008 and 2007 – €1,000 million) floating rate undated subordinated notes (callable July 2014) (3) | 214 | 966 | 742 | |||||||||
£178 million (2008 and 2007 – £500 million) 5.125% undated subordinated notes (callable March 2016) (3) | 189 | 556 | 499 | |||||||||
| £200 million 5.125% subordinated upper tier 2 notes (callable September 2026) | 210 | 210 | 210 | |||||||||
£260 million (2008 and 2007 – £600 million) 5.5% undated subordinated notes (callable December 2019) (3) | 272 | 677 | 595 | |||||||||
£174 million (2008 and 2007 – £500 million) 6.2% undated subordinated notes (callable March 2022) (3) | 206 | 614 | 543 | |||||||||
£145 million (2008 and 2007 – £200 million) 9.5% undated subordinated bonds (callable August 2018) (3, 4) | 176 | 253 | 228 | |||||||||
| £400 million 5.625% subordinated upper tier 2 notes (redeemed April 2009) | — | 397 | 397 | |||||||||
£83 million (2008 and 2007 – £300 million) 5.625% undated subordinated notes (callable September 2026) (3) | 90 | 431 | 318 | |||||||||
£51 million (2008 and 2007 – £350 million) 5.625% undated subordinated notes (callable June 2032) (3) | 55 | 364 | 363 | |||||||||
£190 million (2008 and 2007 – £400 million) 5% undated subordinated notes (callable March 2011) (3) | 197 | 424 | 402 | |||||||||
| JPY25 billion 2.605% undated subordinates notes (callable November 2034) | 173 | 217 | 103 | |||||||||
| CAD700 million 5.37% fixed rate undated subordinated notes (callable May 2016) | 452 | 464 | 363 | |||||||||
| National Westminster Bank Plc | ||||||||||||
| US$293 million (2008 and 2007 – US$500 million) primary capital floating rate notes, Series A | ||||||||||||
(callable on any interest payment date) (3) | 205 | 343 | 251 | |||||||||
| US$312 million (2008 and 2007 – US$500 million) primary capital floating rate notes, Series B | ||||||||||||
(callable on any interest payment date) (3) | 182 | 347 | 256 | |||||||||
| US$332 million (2008 and 2007 – US$500 million) primary capital floating rate notes, Series C | ||||||||||||
(callable on any interest payment date) (3) | 192 | 346 | 255 | |||||||||
| €400 million 6.625% fixed/floating rate undated subordinated notes (callable April 2010) | 358 | 388 | 303 | |||||||||
| €100 million floating rate undated step-up notes (callable April 2010) | 90 | 97 | 74 | |||||||||
£162 million (2008 and 2007 – £325 million) 7.625% undated subordinated step-up notes (callable January 2010) (3) | 174 | 363 | 357 | |||||||||
£127 million (2008 and 2007 – £200 million) 7.125% undated subordinated step-up notes (callable October 2022) (3) | 127 | 201 | 205 | |||||||||
£68 million (2008 and 2007 – £200 million) 11.5% undated subordinated notes (callable December 2022) (3, 5) | 79 | 269 | 269 | |||||||||
| First Active plc | ||||||||||||
| £20 million 11.75% perpetual tier two capital | 26 | 26 | 23 | |||||||||
| €38 million 11.375% perpetual tier two capital | 51 | 52 | 39 | |||||||||
| £1.3 million floating rate perpetual tier two capital | 2 | 2 | 2 | |||||||||
| ABN AMRO and subsidiaries | ||||||||||||
| €9 million 4.650% perpetual convertible financing preference shares | — | — | 7 | |||||||||
| €1,000 million 4.310% perpetual Bermudan callable subordinated tier 1 notes (callable March 2016) | 834 | 824 | 598 | |||||||||
| €800 million 10.00% fixed perpetual mandatory convertible tier 1 notes 2099 (issued July 2009) | 716 | — | — | |||||||||
| €967 million 10.00% fixed perpetual mandatory convertible tier 1 notes 2072 (issued December 2009) | 866 | — | — | |||||||||
| €833 million 10.00% fixed perpetual mandatory convertible tier 1 notes 2073 (issued December 2009) | 746 | — | — | |||||||||
| 8,164 | 11,697 | 9,866 | ||||||||||
Notes:
| (1) | On-lent to The Royal Bank of Scotland plc on a subordinated basis. |
| (2) | The company can satisfy interest payment obligations by issuing sufficient ordinary shares to appointed Trustees to enable them, on selling these shares, to settle the interest payment. |
| (3) | Partially redeemed following the completion of the exchange and tender offers in April 2009. |
| (4) | Guaranteed by the company. |
| (5) | Exchangeable at the option of the issuer into 200 million 8.392% (gross) non-cumulative preference shares of £1 each of National Westminster Bank Plc at any time. |
| (6) | Except as stated above, claims in respect of the Group’s undated loan capital are subordinated to the claims of other creditors. None of the Group’s undated loan capital is secured. |
| (7) | In the event of certain changes in tax laws, undated loan capital issues may be redeemed in whole, but not in part, at the option of the Group, at the principal amount thereof plus accrued interest, subject to prior regulatory approval. |
| (8) | Interest on all floating rate subordinated notes is calculated by reference to market rates. |
278
Financial statements
Notes on the accounts
Preference shares
2009 £m | 2008 £m | 2007 £m | ||||||||||
| The company | ||||||||||||
Non-cumulative preference shares of US$0.01 (1) | ||||||||||||
| Series F US$200 million 7.65% (redeemable at option of issuer) | 123 | 137 | 100 | |||||||||
| Series H US$300 million 7.25% (redeemable at option of issuer) | 185 | 205 | 150 | |||||||||
| Series L US$850 million 5.75% (redeemable December 2049) | 524 | 582 | 421 | |||||||||
Non-cumulative convertible preference shares of US$0.01 (1) | ||||||||||||
| Series 1 US$1,000 million 9.118% (redeemable March 2010) | 630 | 698 | 510 | |||||||||
Non-cumulative convertible preference shares of £0.01 (1) | ||||||||||||
| Series 1 £200 million 7.387% (redeemable December 2010) | 199 | 211 | 201 | |||||||||
| Cumulative preference shares of £1 | ||||||||||||
| £0.5 million 11% and £0.4 million 5.5% (non-redeemable) | 1 | 1 | 1 | |||||||||
| 1,662 | 1,834 | 1,383 | ||||||||||
| National Westminster Bank Plc | ||||||||||||
| Non-cumulative preference shares of £1 | ||||||||||||
| Series A £140 million 9% (non-redeemable) | 145 | 145 | 143 | |||||||||
| Non-cumulative preference shares of US$25 | ||||||||||||
Series C US$300 million 7.7628% (2) | 193 | 215 | 160 | |||||||||
| 2,000 | 2,194 | 1,686 | ||||||||||
Notes:
| (1) | Further details of the contractual terms of the preference shares are given in Note 27 on pages 282 and 283. |
| (2) | Series C preference shares each carry a gross dividend of 8.625% inclusive of associated tax credit. Redeemable at the option of the issuer at par. |
| Trust preferred securities comm | 2009 £m | 2008 £m | 2007 £m | |||||||||
€391 million (2008 and 2007 – €1,250 million) 6.467% (redeemable June 2012) (1, 2) | 362 | 1,325 | 979 | |||||||||
US$486 million (2008 and 2007 – US$750 million) 6.8% (redeemable December 2049) (1, 2) | 300 | 514 | 374 | |||||||||
US$322 million (2008 and 2007 – US$850 million) 4.709% (redeemable July 2013) (1, 2) | 196 | 640 | 421 | |||||||||
US$394 million (2008 and 2007 – US$650 million) 6.425% (redeemable January 2034) (1, 2) | 280 | 677 | 344 | |||||||||
| ABN AMRO and subsidiaries | ||||||||||||
| US$1,285 million 5.90% Trust Preferred V | 696 | 760 | 464 | |||||||||
| US$200 million 6.25% Trust Preferred VI | 107 | 121 | 82 | |||||||||
| US$1,800 million 6.08% Trust Preferred VII | 950 | 1,064 | 762 | |||||||||
| 2,891 | 5,101 | 3,426 |
Notes:
| (1) | The trust preferred securities issued by subsidiaries have no maturity date and are not redeemable at the option of the holders at any time. These securities may, with the consent of the UK Financial Services Authority, be redeemed, by the issuer on the dates specified above or on any interest payment date thereafter. They may also be redeemed in whole, but not in part, upon the occurrence of certain tax and regulatory events. The company classifies its obligations to these subsidiaries as dated loan capital. |
| (2) | Partially redeemed following the completion of the exchange and tender offers in April 2009. |
279
Notes on the accounts continued
| 26 Minority interests | ABN AMRO £m | Other interests | Total £m | |||||||||
| At 1 January 2008 | 32,997 | 5,391 | 38,388 | |||||||||
| Currency translation and other adjustments | 8,098 | 1,158 | 9,256 | |||||||||
| Acquisition of outstanding ABN AMRO ordinary shares | 356 | — | 356 | |||||||||
| (Loss)/profit attributable to minority interests | (11,244 | ) | 412 | (10,832 | ) | |||||||
| Dividends paid | — | (285 | ) | (285 | ) | |||||||
| Losses on available-for-sale financial assets, net of tax | (144 | ) | (1,303 | ) | (1,447 | ) | ||||||
| Movements in cash flow hedging reserves, net of tax | (831 | ) | — | (831 | ) | |||||||
| Actuarial losses recognised in retirement benefit schemes, net of tax | (478 | ) | — | (478 | ) | |||||||
| Equity raised | — | 1,071 | 1,071 | |||||||||
| Equity withdrawn | (12,571 | ) | (1,008 | ) | (13,579 | ) | ||||||
| At 31 December 2008 | 16,183 | 5,436 | 21,619 | |||||||||
| Currency translation and other adjustments | (1,282 | ) | (152 | ) | (1,434 | ) | ||||||
| (Loss)/profit attributable to minority interests | (299 | ) | 648 | 349 | ||||||||
| Dividends paid | — | (313 | ) | (313 | ) | |||||||
| Gains/(losses) on available-for-sale financial assets, net of tax | 133 | (336 | ) | (203 | ) | |||||||
| Movements in cash flow hedging reserves, net of tax | (150 | ) | — | (150 | ) | |||||||
| Actuarial gains recognised in retirement benefit schemes, net of tax | 92 | — | 92 | |||||||||
| Equity raised | — | 9 | 9 | |||||||||
| Equity withdrawn | (9 | ) | (2,436 | ) | (2,445 | ) | ||||||
| Transfer to retained earnings | — | (629 | ) | (629 | ) | |||||||
| At 31 December 2009 | 14,668 | 2,227 | 16,895 | |||||||||
ABN AMRO represents the other consortium members’ interests in RFS Holdings B.V. The capital and income rights of shares issued by RFS Holdings B.V. are linked to the net assets and income of the ABN AMRO business units which the individual consortium members have agreed to acquire. The distribution to other consortium members of their respective interests is expected in 2010. Other minority interests include trust preferred securities of £664 million (2008 – £1,821 million; 2007 – £1,821 million) and in prior years RBS China Sarl (2008 – £1,898 million; 2007 – £2,438 million). Equity withdrawn in respect of ABN AMRO relates to distributions to consortium members.
Included in minority interests are the following trust preferred securities (1):
2009 £m | 2008 £m | 2007 £m | ||||||||||
| US$357 million (2008 and 2007 – US$950 million) 5.512% (redeemable September 2014) | 198 | 529 | 529 | |||||||||
| US$470 million (2008 and 2007 – US$1,000 million) 3 month US$ LIBOR plus 0.80% | ||||||||||||
| (redeemable September 2014) | 261 | 555 | 555 | |||||||||
| €166 million (2008 and 2007 – €500 million) 4.243% (redeemable January 2016) | 112 | 337 | 337 | |||||||||
| £93 million (2008 and 2007 – £400 million) 5.6457% (redeemable June 2017) | 93 | 400 | 400 | |||||||||
| 664 | 1,821 | 1,821 | ||||||||||
Note:
| (1) | The trust preferred securities issued by subsidiaries have no maturity date and are not redeemable at the option of the holders at any time. These securities may, with the consent of the UK Financial Services Authority, be redeemed, in whole or in part, by the issuer on the dates specified above or on any interest payment date thereafter. They may also be redeemed in whole, but not in part, upon the occurrence of certain tax and regulatory events. The company classifies its obligations to these subsidiaries as dated loan capital. |
The trust preferred securities above were also included in the series of exchange offers and tender offers concluded by the Group in April 2009 (see page 274).
280
Financial statements
27 Share capital
| Allotted, called up and fully paid | ||||||||||||||||||||
1 January 2009 | Issued during the year £m | Redeemed during the year | 31 December 2009 | Authorised (1) 31 December | ||||||||||||||||
| Ordinary shares of 25p | 9,864 | 4,227 | — | 14,091 | 11,151 | |||||||||||||||
| B shares of £0.01 | — | 510 | — | 510 | — | |||||||||||||||
| Dividend access share of £0.01 | — | — | — | — | — | |||||||||||||||
| Non-voting deferred shares of £0.01 | 27 | — | — | 27 | 323 | |||||||||||||||
| Additional Value Shares of £0.01 | — | — | — | — | 27 | |||||||||||||||
| Non-cumulative preference shares of US$0.01 | 2 | — | — | 2 | 3 | |||||||||||||||
| Non-cumulative convertible preference shares of US$0.01 | — | — | — | — | — | |||||||||||||||
| Non-cumulative preference shares of €0.01 | — | — | — | — | — | |||||||||||||||
| Non-cumulative convertible preference shares of €0.01 | — | — | — | — | — | |||||||||||||||
| Non-cumulative convertible preference shares of £0.25 | — | — | — | — | 225 | |||||||||||||||
| Non-cumulative convertible preference shares of £0.01 | — | — | — | — | — | |||||||||||||||
| Cumulative preference shares of £1 | 1 | — | — | 1 | 1 | |||||||||||||||
| Non-cumulative preference shares of £1 | 6 | — | (5 | ) | 1 | 300 | ||||||||||||||
| Allotted, called up and fully paid | Authorised (1) | |||||||||||||||||||
| Number of shares – thousands | 2009 | 2008 | 2007 | 2008 | 2007 | |||||||||||||||
| Ordinary shares of 25p | 56,365,721 | 39,456,005 | 10,006,215 | 44,603,278 | 12,070,492 | |||||||||||||||
| B shares of £0.01 | 51,000,000 | — | — | — | — | |||||||||||||||
| Dividend access share of £0.01 | — | — | — | — | — | |||||||||||||||
| Non-voting deferred shares of £0.01 | 2,660,556 | 2,660,556 | 2,660,556 | 32,300,000 | 32,300,000 | |||||||||||||||
| Additional Value Shares of £0.01 | — | — | — | 2,700,000 | 2,700,000 | |||||||||||||||
| Non-cumulative preference shares of US$0.01 | 308,015 | 308,015 | 308,015 | 516,000 | 419,500 | |||||||||||||||
| Non-cumulative convertible preference shares of US$0.01 | 1,000 | 1,000 | 1,000 | 3,900 | 3,900 | |||||||||||||||
| Non-cumulative preference shares of €0.01 | 2,526 | 2,526 | 2,526 | 66,000 | 66,000 | |||||||||||||||
| Non-cumulative convertible preference shares of €0.01 | — | — | — | 3,000 | 3,000 | |||||||||||||||
| Non-cumulative convertible preference shares of £0.25 | — | — | — | 900,000 | 900,000 | |||||||||||||||
| Non-cumulative convertible preference shares of £0.01 | 200 | 200 | 200 | 1,000 | 1,000 | |||||||||||||||
| Cumulative preference shares of £1 | 900 | 900 | 900 | 900 | 900 | |||||||||||||||
| Non-cumulative preference shares of £1 | 750 | 5,750 | 750 | 300,000 | 300,000 | |||||||||||||||
| Movement in ordinary and B shares in issue – thousands | Ordinary shares of 25p | B shares of £0.01 | ||||||
| At 1 January 2008 | 10,006,215 | — | ||||||
| Shares issued in respect of the rights issue | 6,123,010 | — | ||||||
| Shares issued in respect of the capitalisation issue | 403,468 | — | ||||||
| Shares issued in respect of the placing and open offer | 22,909,776 | — | ||||||
| Other shares issued | 13,536 | — | ||||||
| At 1 January 2009 | 39,456,005 | — | ||||||
| Shares issued in respect of the placing and open offer | 16,909,716 | — | ||||||
| B Shares issued | — | 51,000,000 | ||||||
| At 31 December 2009 | 56,365,721 | 51,000,000 | ||||||
Note:
| (1) | Prior to the Companies Act 2006, the authorised share capital of UK companies was divided between issued share capital and unissued share capital whose allotment was determined by the Articles of Association of a company and specific authorities granted to directors. Since 15 December 2009 when the company changed its constitution to reflect the Companies Act 2006, there is no authorised share capital. The meeting approving the changes also resolved to grant the directors the power to issue a nominal amount of £1,610 million B shares of 1p each and £44,250 million ordinary shares of 25p each in connection with the company's participation in the UK Government’s Asset Protection Scheme. |
281
Notes on the accounts continued
27 Share capital continued
Ordinary shares
At the Annual General meeting in April 2009, the authorised ordinary share capital of the company was increased by £7.5 billion through the creation of 30 billion new ordinary shares of 25p each.
At a General meeting in April 2009, the authorised ordinary share capital of the company was increased by a further £4.2 billion through the creation of 16.9 billion new ordinary shares of 25p each.
In April 2009, the company issued 16.9 billion ordinary shares at 31.75p each through a placing and open offer. The placing and open offer was fully underwritten by HM Treasury. The net proceeds were £5.4 billion.
Following redemption of the non-cumulative sterling preference shares of £1 each, the authorised ordinary share capital of the company was increased by £5 million through the creation of 20 million new ordinary shares of 25p each (see below).
During the year ended 31 December 2009, options were granted over 1.5 billion ordinary shares under the company’s executive and sharesave schemes. At 31 December 2009, options granted under the company’s various schemes, exercisable up to 2019 at prices ranging from 28.2p to 586p per share, were outstanding in respect of 1.4 billion ordinary shares.
No ordinary shares were issued during the year ended 31 December 2009 following the exercise of options under the company’s share schemes. Any options exercised were satisfied using market purchase shares held in the Trust.
No options granted under the NatWest executive scheme were outstanding as at 31 December 2009.
Employee share trusts purchased 86.2 million ordinary shares at a cost of £33 million and awarded 8.7 million ordinary shares on receipt of £0.06 million on the exercise of awards under employee share schemes.
The employee share trusts incurred costs of £0.2 million in purchasing the company’s ordinary shares.
B shares and dividend access share
In December 2009, the company entered into an acquisition and contingent capital agreement with HM Treasury. HM Treasury agreed to acquire at 50p per share 51 billion B shares with a nominal value of 1p each and a Dividend Access Share with a nominal value of 1p; these shares were issued to HM Treasury on 22 December 2009. Net proceeds were £25.1 billion. HM Treasury also agreed to subscribe for up to 16 billion further B shares with a nominal value of 1p each at 50p per share subject to certain conditions including the Group's core tier 1 capital ratio falling below 5%. The fair value of the consideration payable by the company on entering into this agreement amounted to £1,458 million; of this £1,208 million has been debited to the contingent capital reserve.
The B shares do not generally carry voting rights at general meetings of ordinary shareholders. Each B share is entitled to the same cash dividend as an ordinary share (subject to anti–dilution adjustments). The B shares may be converted into ordinary shares at a fixed ratio of issue price (50p) divided by the conversion price (50p subject to anti-dilution adjustments) at the option of the holder at any time after issue.
Following the issue of B shares, HM Treasury's holding of ordinary shares of the company remained at 70.3% although its economic interest rose to 84.4%. HM Treasury has agreed not to convert its B shares into ordinary shares to the extent that its holding of ordinary shares following the conversion would represent more than 75% of the company's issued ordinary share capital.
The Dividend Access Share entitles the holder to dividends equal to the greater of 7% of the aggregate issue price of B shares issued to HM Treasury and 250% times the ordinary dividend rate multiplied by the number of B shares issued, less any dividends paid on the B shares and on ordinary shares issued on conversion. Dividends on the dividend access share are discretionary unless a dividend has been paid on the ordinary shares, in which case dividends became mandatory. The Dividend Access Share does not generally carry voting rights at general meetings of ordinary shareholders and is not convertible into ordinary shares.
The contingent capital commitment agreement can be terminated in whole or in part by the company, with the FSA’s consent, at any time. It expires at the end of five years or, if earlier, on its termination in full.
Preference shares
Under IFRS certain of the Group’s preference shares are classified as debt and are included in subordinated liabilities on the balance sheet.
Following the Placing and Open Offer in April 2009, the company redeemed the five million non-cumulative sterling preference shares of £1 issued at £1,000 each (£5 billion in total) held by HM Treasury at 101 per cent of their issue price plus the dividend accrued on the preference shares from 1 December 2008 to the date of redemption and the commissions payable to HM Treasury under the Second Placing and Open Offer Agreement. In accordance with the Articles of Association of the company, the nominal amount of these shares was, upon redemption of the shares, divided into and reclassified as 20 million new ordinary shares of 25p each.
Other securities
Certain of the Group’s subordinated securities in the legal form of debt are classified as equity under IFRS.
These securities entitle the holders to interest which may be deferred at the sole discretion of the company. Repayment of the securities is at the sole discretion of the company on giving between 30 and 60 days notice.
Non-cumulative preference shares
Non-cumulative preference shares entitle the holders thereof (subject to the terms of issue) to receive periodic non-cumulative cash dividends at specified fixed rates for each Series payable out of distributable profits of the company.
The non-cumulative preference shares are redeemable at the option of the company, in whole or in part from time to time at the rates detailed on the next page plus dividends otherwise payable for the then current dividend period accrued to the date of redemption.
282
Financial statements
Notes on the accounts
| Class of preference share | Number of shares | Interest rate | Redemption date on | Redemption price | Debt or equity(1) | |||||||||
| Non-cumulative preference shares of US$0.01 | ||||||||||||||
| Series F | 8 million | 7.65% | 31 March 2007 | US$25 | Debt | |||||||||
| Series H | 12 million | 7.25% | 31 March 2004 | US$25 | Debt | |||||||||
| Series L | 34 million | 5.75% | 30 September 2009 | US$25 | Debt | |||||||||
| Series M | 37 million | 6.4% | 30 September 2009 | US$25 | Equity | |||||||||
| Series N | 40 million | 6.35% | 30 June 2010 | US$25 | Equity | |||||||||
| Series P | 22 million | 6.25% | 31 December 2010 | US$25 | Equity | |||||||||
| Series Q | 27 million | 6.75% | 30 June 2011 | US$25 | Equity | |||||||||
| Series R | 26 million | 6.125% | 30 December 2011 | US$25 | Equity | |||||||||
| Series S | 38 million | 6.6% | 30 June 2012 | US$25 | Equity | |||||||||
| Series T | 64 million | 7.25% | 31 December 2012 | US$25 | Equity | |||||||||
| Series U | 15,000 | 7.64% | 29 September 2017 | US$100,000 | Equity | |||||||||
| Non-cumulative convertible preference shares of US$0.01 | ||||||||||||||
| Series 1 | 1 million | 9.118% | 31 March 2010 | US$1,000 | Debt | |||||||||
| Non-cumulative preference shares of €0.01 | ||||||||||||||
| Series 1 | 1.25 million | 5.5% | 31 December 2009 | €1,000 | Equity | |||||||||
| Series 2 | 1.25 million | 5.25% | 30 June 2010 | €1,000 | Equity | |||||||||
| Series 3 | 26,000 | 7.0916% | 29 September 2017 | €50,000 | Equity | |||||||||
| Non-cumulative convertible preference shares of £0.01 | ||||||||||||||
| Series 1 | 200,000 | 7.387% | 31 December 2010 | £1,000 | Debt | |||||||||
| Non-cumulative preference shares of £1 | ||||||||||||||
| Series 1 | 750,000 | 8.162% | 5 October 2012 | £1,000 | Equity | |||||||||
Notes:
| (1) | Those preference shares where the Group has an obligation to pay dividends are classified as debt; those where distributions are discretionary are classified as equity. The conversion rights attaching to the convertible preference shares may result in the Group delivering a variable number of equity shares to preference shareholders; these convertible preference shares are treated as debt. |
| (2) | The whole of each series of preference share is issued or redeemed at the same time. |
In the event that the non-cumulative convertible preference shares are not redeemed on or before the redemption date, the holder may convert them into ordinary shares in the company at the prevailing market price.
Under existing arrangements, no redemption or purchase of any non-cumulative preference shares may be made by the company without the prior consent of the UK Financial Services Authority.
On a winding-up or liquidation of the company, the holders of the non-cumulative preference shares will be entitled to receive, out of any surplus assets available for distribution to the company’s shareholders (after payment of arrears of dividends on the cumulative preference shares up to the date of repayment) pari passu with the cumulative preference shares and all other shares of the company ranking pari passu with the non-cumulative preference shares as regards participation in the surplus assets of the company, a liquidation distribution per share equal to the applicable redemption price detailed in the table above, together with an amount equal to dividends for the then current dividend period accrued to the date of payment, before any distribution or payment may be made to holders of the ordinary shares as regards participation in the surplus assets of the company.
Except as described above, the holders of the non-cumulative preference shares have no right to participate in the surplus assets of the company.
Holders of the non-cumulative preference shares are not entitled to receive notice of or attend general meetings of the company except if any resolution is proposed for adoption by the shareholders of the company to vary or abrogate any of the rights attaching to the non-cumulative preference shares or proposing the winding-up or liquidation of the company. In any such case, they are entitled to receive notice of and to attend the general meeting of shareholders at which such resolution is to be proposed and are entitled to speak and vote on such resolution (but not on any other resolution). In addition, in the event that, prior to any general meeting of shareholders, the company has failed to pay in full the three most recent quarterly dividend payments due on the non-cumulative dollar preference shares (other than Series U), the two most recent semi-annual dividend payments due on the non-cumulative convertible dollar preference shares and the most recent dividend payments due on the non-cumulative euro preference shares, the non-cumulative sterling preference shares, the Series U non-cumulative dollar preference shares and the non-cumulative convertible sterling preference shares, the holders shall be entitled to receive notice of, attend, speak and vote at such meeting on all matters together with the holders of the ordinary shares. In these circumstances only, the rights of the holders of the non-cumulative preference shares so to vote shall continue until the company shall have resumed the payment in full of the dividends in arrears.
The Group has undertaken that, unless otherwise agreed with the European Commission, neither the company nor any of its direct or indirect subsidiaries (excluding companies in the ABN AMRO Group) will pay external investors any dividends or coupons on existing hybrid capital instruments (including preference shares, B shares and upper and lower tier 2 instruments) from a date starting not later than 30 April 2010 and for a period of two years thereafter ("the deferral period"), or exercise any call rights in relation to these capital instruments between 24 November 2009 and the end of the deferral period, unless there is a legal obligation to do so. Hybrid capital instruments issued after 24 November 2009 will generally not be subject to the restriction on dividend or coupon payments or call options.
283
Notes on the accounts continued
28 Reserves
On 1 January 2007, the merger reserve comprised the premium on shares issued to acquire NatWest less goodwill amortisation charged under previous GAAP. No share premium was recorded in the company financial statements through the operation of the merger relief provisions of the Companies Act 1985.
UK law prescribes that only the reserves of the company are taken into account for the purpose of making distributions and in determining the permissible applications of the share premium account.
The Group optimises capital efficiency by maintaining reserves in subsidiaries, including regulated entities. Certain preference shares and subordinated debt are also included within regulatory capital. The remittance of reserves to the company or the redemption of shares or subordinated capital by regulated entities may be subject to maintaining the capital resources required by the relevant regulator.
Paid-in equity represents notes issued under the company’s euro medium term note programme with par value of US$1,600 million and CAD600 million that are classified as equity under IFRS. The notes attract coupons of 6.99% and 6.666% respectively until October 2017 when they change to 2.67% above the London interbank offered rate for 3-month US dollar deposits and 2.76% above the Canadian dollar offered rate respectively. US$1,036 million of this capital was redeemed in April 2009.
Under the arrangements for the placing and open offer in December 2008, the company issued shares in exchange for shares in Encuentro Limited. No share premium was recorded in the company financial statements through the operation of the merger relief provisions of the Companies Act 2006. The subsequent redemption of these shares gave rise to distributable profits of £14,273 million which have been transferred from merger reserve to retained earnings.
Under the arrangements for accession to APS in December 2009, the company issued B shares in exchange for shares in Aonach Mor Limited. No share premium was recorded in the company financial statements through the operation of the merger relief provisions of the Companies Act 2006. The subsequent redemption of some of these shares gave rise to distributable profits of £9,950 million which have been transferred from merger reserve to retained earnings.
At 31 December 2009, 138,695,912 (2008 – 61,165,254) ordinary shares of 25p each of the company were held by Employee Share Trusts in respect of share awards and options granted to employees.
29 Leases
Minimum amounts receivable under non-cancellable leases:
| Group | ||||||||||||||||||||||||||||||||||||
| Finance lease contracts | Hire purchase agreements | Operating lease assets: future minimum lease rentals £m | ||||||||||||||||||||||||||||||||||
| Year in which receipt will occur: | Gross amount | Unearned finance | Other movements £m | Present value £m | Gross amount £m | Unearned finance income £m | Other movements £m | Present value £m | ||||||||||||||||||||||||||||
| 2009 | ||||||||||||||||||||||||||||||||||||
| Receivable: | ||||||||||||||||||||||||||||||||||||
| Within 1 year | 1,507 | (470 | ) | (23 | ) | 1,014 | 2,110 | (64 | ) | (7 | ) | 2,039 | 781 | |||||||||||||||||||||||
| After 1 year but within 5 years | 5,496 | (1,790 | ) | (131 | ) | 3,575 | 3,086 | (100 | ) | (81 | ) | 2,905 | 2,514 | |||||||||||||||||||||||
| After 5 years | 10,942 | (2,455 | ) | (313 | ) | 8,174 | 309 | (6 | ) | (21 | ) | 282 | 1,018 | |||||||||||||||||||||||
| Total | 17,945 | (4,715 | ) | (467 | ) | 12,763 | 5,505 | (170 | ) | (109 | ) | 5,226 | 4,313 | |||||||||||||||||||||||
| 2008 | ||||||||||||||||||||||||||||||||||||
| Receivable: | ||||||||||||||||||||||||||||||||||||
| Within 1 year | 1,485 | (613 | ) | (24 | ) | 848 | 2,298 | (171 | ) | — | 2,127 | 918 | ||||||||||||||||||||||||
| After 1 year but within 5 years | 6,112 | (2,004 | ) | (128 | ) | 3,980 | 3,731 | (284 | ) | (34 | ) | 3,413 | 2,479 | |||||||||||||||||||||||
| After 5 years | 12,567 | (3,094 | ) | (341 | ) | 9,132 | 395 | (30 | ) | (44 | ) | 321 | 1,141 | |||||||||||||||||||||||
| Total | 20,164 | (5,711 | ) | (493 | ) | 13,960 | 6,424 | (485 | ) | (78 | ) | 5,861 | 4,538 | |||||||||||||||||||||||
| 2007 | ||||||||||||||||||||||||||||||||||||
| Receivable: | ||||||||||||||||||||||||||||||||||||
| Within 1 year | 1,297 | (390 | ) | (23 | ) | 884 | 2,028 | (153 | ) | — | 1,875 | 1,073 | ||||||||||||||||||||||||
| After 1 year but within 5 years | 4,968 | (1,766 | ) | (144 | ) | 3,058 | 3,442 | (300 | ) | (25 | ) | 3,117 | 3,046 | |||||||||||||||||||||||
| After 5 years | 11,648 | (3,187 | ) | (288 | ) | 8,173 | 281 | (7 | ) | (29 | ) | 245 | 1,473 | |||||||||||||||||||||||
| Total | 17,913 | (5,343 | ) | (455 | ) | 12,115 | 5,751 | (460 | ) | (54 | ) | 5,237 | 5,592 | |||||||||||||||||||||||
284
Financial statements
Notes on the accounts
| Group | ||||||||||||
2009 £m | 2008 £m | 2007 £m | ||||||||||
| Nature of operating lease assets in balance sheet | ||||||||||||
| Transportation | 6,039 | 5,883 | 6,859 | |||||||||
| Cars and light commercial vehicles | 1,352 | 1,199 | 1,390 | |||||||||
| Other | 403 | 617 | 441 | |||||||||
| 7,794 | 7,699 | 8,690 | ||||||||||
| Amounts recognised as income and expense | ||||||||||||
| Finance leases – contingent rental income | (139 | ) | (37 | ) | (23 | ) | ||||||
| Operating leases – minimum rentals payable | 647 | 566 | 322 | |||||||||
| Finance lease contracts and hire purchase agreements | ||||||||||||
| Accumulated allowance for uncollectible minimum receivables | 313 | 213 | 222 | |||||||||
Residual value exposures
The tables below give details of the unguaranteed residual values included in the carrying value of finance lease receivables (see pages 226 to 228) and operating lease assets (see pages 260 and 261).
| Year in which residual value will be recovered | ||||||||||||||||||||
| 2009 | Within 1 year | After 1 year but within | After 2 years but within | After 5 years | Total £m | |||||||||||||||
| Operating leases | ||||||||||||||||||||
| Transportation | 164 | 327 | 1,607 | 2,255 | 4,353 | |||||||||||||||
| Cars and light commercial vehicles | 624 | 134 | 113 | 7 | 878 | |||||||||||||||
| Other | 31 | 32 | 40 | 7 | 110 | |||||||||||||||
| Finance lease contracts | 23 | 35 | 96 | 313 | 467 | |||||||||||||||
| Hire purchase agreements | 64 | 25 | 75 | 109 | 273 | |||||||||||||||
| 906 | 553 | 1,931 | 2,691 | 6,081 | ||||||||||||||||
| 2008 | ||||||||||||||||||||
| Operating leases | ||||||||||||||||||||
| Transportation | 794 | 130 | 1,701 | 2,103 | 4,728 | |||||||||||||||
| Cars and light commercial vehicles | 577 | 195 | 182 | 8 | 962 | |||||||||||||||
| Other | 112 | 35 | 48 | 8 | 203 | |||||||||||||||
| Finance lease contracts | 24 | 29 | 99 | 341 | 493 | |||||||||||||||
| Hire purchase agreements | — | 9 | 25 | 44 | 78 | |||||||||||||||
| 1,507 | 398 | 2,055 | 2,504 | 6,464 | ||||||||||||||||
| 2007 | ||||||||||||||||||||
| Operating leases | ||||||||||||||||||||
| Transportation | 485 | 253 | 1,762 | 2,505 | 5,005 | |||||||||||||||
| Cars and light commercial vehicles | 331 | 467 | 118 | — | 916 | |||||||||||||||
| Other | 26 | 47 | 64 | 18 | 155 | |||||||||||||||
| Finance lease contracts | 23 | 29 | 115 | 288 | 455 | |||||||||||||||
| Hire purchase agreements | — | 7 | 18 | 29 | 54 | |||||||||||||||
| 865 | 803 | 2,077 | 2,840 | 6,585 | ||||||||||||||||
The Group provides asset finance to its customers through acting as a lessor. It purchases plant, equipment and intellectual property, renting them to customers under lease arrangements that, depending on their terms, qualify as either operating or finance leases.
285
30 Collateral and securitisations
Securities repurchase agreements and lending transactions
The Group enters into securities repurchase agreements and securities lending transactions under which it receives or transfers collateral in accordance with normal market practice. Generally, the agreements require additional collateral to be provided if the value of the securities falls below a predetermined level.
Under standard terms for repurchase transactions in the UK and US markets, the recipient of collateral has an unrestricted right to sell or repledge it, subject to returning equivalent securities on settlement of the transaction.
The fair value (and carrying value) of securities transferred under repurchase transactions included within debt securities on the balance sheet were £66.9 billion (2008 – £80.6 billion; 2007 – £107.7 billion). All of these securities could be sold or repledged by the holder. Securities received as collateral under reverse repurchase agreements amounted to £74.0 billion (2008 – £89.3 billion), of which £73.0 billion (2008 – £49.0 billion) had been resold or repledged as collateral for the Group’s own transactions.
Other collateral given
| Group assets pledged against Group liabilities | 2009 £m | 2008* £m | ||||||
| Loans and advances to banks | 13 | 13 | ||||||
| Loans and advances to customers | 147,150 | 125,463 | ||||||
| Debt securities | 8,723 | 15,490 | ||||||
| 155,886 | 140,966 |
| Liabilities secured by Group assets | 2009 £m | 2008 £m | ||||||
| Deposits by banks | 12,724 | 15,429 | ||||||
| Customer accounts | 3,362 | 11,050 | ||||||
| Debt securities in issue | 35,670 | 58,689 | ||||||
| 51,756 | 85,168 | |||||||
| * revised | ||||||||
Note:
| (1) | The table above includes assets used as collateral for central bank liquidity schemes. |
Of the assets above, £137.3 billion (2008 – £111.3 billion) relates to securitisations. Additionally the Group has assets and liabilities collateralised in respect of derivative collateral arrangements.
Securitisations and other asset transfers
Continued recognition
The table below sets out the asset categories together with the carrying amounts of the assets and associated liabilities for those securitisations (see pages 154 and 155) and other asset transfers where substantially all the risks and rewards of the asset have been retained by the Group.
| 2009 | 2008* | |||||||||||||||
| Asset type | Assets £m | Liabilities £m | Assets £m | Liabilities £m | ||||||||||||
| Residential mortgages | 69,927 | 15,937 | 55,714 | 20,075 | ||||||||||||
| Credit card receivables | 2,975 | 1,592 | 3,004 | 3,197 | ||||||||||||
| Other loans | 36,448 | 1,010 | 1,679 | 1,071 | ||||||||||||
| Commercial paper conduits | 27,366 | 25,583 | 49,857 | 48,684 | ||||||||||||
| Finance lease receivables | 597 | 597 | 1,077 | 857 | ||||||||||||
| 137,313 | 44,719 | 111,331 | 73,884 | |||||||||||||
* revised
Continuing involvement
At 31 December 2009, securitised assets were £3.1 billion (2008 – £1.1 billion); retained interest £101.9 million (2008 – £50 million); subordinated assets £90.7 million (2008 – £9 million); and related liabilities £32.7 million (2008 – £9 million).
286
Financial statements
Notes on the accounts
31 Capital resources
The Group’s regulatory capital resources at 31 December in accordance with Financial Services Authority (FSA) definitions were as follows:
| Composition of regulatory capital | 2009 £m | 2008 £m | ||||||
| Tier 1 | ||||||||
| Ordinary and B shareholders’ equity | 69,890 | 45,525 | ||||||
| Minority interests | 16,895 | 21,619 | ||||||
| Adjustment for: | ||||||||
| – Goodwill and other intangible assets | (17,847 | ) | (20,049 | ) | ||||
| – Goodwill and other intangible assets of discontinued businesses | (238 | ) | — | |||||
| – Unrealised losses on available-for-sale debt securities | 1,888 | 3,687 | ||||||
| – Reserves arising on revaluation of property and unrealised gains on available-for-sale equities | (207 | ) | (984 | ) | ||||
| – Reallocation of preference shares and innovative securities | (656 | ) | (1,813 | ) | ||||
| – Other regulatory adjustments | (1,184 | ) | (362 | ) | ||||
| Less expected loss over provisions | (2,558 | ) | (770 | ) | ||||
| Less securitisation positions | (1,353 | ) | (663 | ) | ||||
| Less APS first loss | (5,106 | ) | — | |||||
| Core Tier 1 capital | 59,524 | 46,190 | ||||||
| Preference shares | 11,265 | 16,655 | ||||||
| Innovative Tier 1 securities | 5,213 | 7,383 | ||||||
| Tax on the excess of expected losses over provisions | 1,020 | 308 | ||||||
| Less deductions from Tier 1 capital | (601 | ) | (689 | ) | ||||
| Total Tier 1 capital | 76,421 | 69,847 | ||||||
| Tier 2 | ||||||||
| Reserves arising on revaluation of property and unrealised gains on available-for-sale equities | 207 | 984 | ||||||
| Collective impairment allowances | 796 | 666 | ||||||
| Perpetual subordinated debt | 4,950 | 9,829 | ||||||
| Term subordinated debt | 20,063 | 23,162 | ||||||
| Minority and other interests in Tier 2 capital | 11 | 11 | ||||||
| Less deductions from Tier 2 capital | (5,532 | ) | (2,429 | ) | ||||
| Less APS first loss | (5,106 | ) | — | |||||
| Total Tier 2 capital | 15,389 | 32,223 | ||||||
| Tier 3 | — | 260 | ||||||
| Supervisory deductions | ||||||||
| Unconsolidated investments | (4,472 | ) | (4,044 | ) | ||||
| Other deductions | (93 | ) | (111 | ) | ||||
| Deductions from total capital | (4,565 | ) | (4,155 | ) | ||||
| Total regulatory capital | 87,245 | 98,175 |
Note:
| (1) | The Group adopted Basel II with effect from 1 January 2008; data for 2007 has not been provided as it is not directly comparable. |
It is the Group’s policy to maintain a strong capital base, to expand it as appropriate and to utilise it efficiently throughout its activities to optimise the return to shareholders while maintaining a prudent relationship between the capital base and the underlying risks of the business. In carrying out this policy, the Group has regard to the supervisory requirements of the FSA. The FSA uses Risk Asset Ratio (RAR) as a measure of capital adequacy for UK banks, comparing a bank’s capital resources with its risk-weighted assets (the assets and off-balance sheet exposures are ‘weighted’ to reflect the inherent credit and other risks); by international agreement, the RAR should be not less than 8% with a Tier 1 component of not less than 4%. The Group has complied with the FSAs capital requirements throughout the year.
A number of subsidiaries and sub-groups within the Group, principally banking and insurance entities, are subject to various individual regulatory capital requirements in the UK and overseas.
287
Notes on the accounts continued
32 Memorandum items
Contingent liabilities and commitments
The amounts shown in the table below are intended only to provide an indication of the volume of business outstanding at 31 December. Although the Group is exposed to credit risk in the event of non-performance of the obligations undertaken by customers, the amounts shown do not, and are not intended to, provide any indication of the Group’s expectation of future losses.
| Group | ||||||||||||||||||||||||||||
Less than 1 year | More than 1 year but | More than 3 years but | Over 5 years | 2009 £m | 2008 £m | 2007 £m | ||||||||||||||||||||||
| Contingent liabilities: | ||||||||||||||||||||||||||||
| Guarantees and assets pledged as collateral security | 23,995 | 6,354 | 2,821 | 6,838 | 40,008 | 49,262 | 46,441 | |||||||||||||||||||||
| Other contingent liabilities | 6,057 | 3,265 | 1,103 | 3,587 | 14,012 | 22,275 | 15,479 | |||||||||||||||||||||
| 30,052 | 9,619 | 3,924 | 10,425 | 54,020 | 71,537 | 61,920 | ||||||||||||||||||||||
| Commitments: | ||||||||||||||||||||||||||||
Undrawn formal standby facilities, credit lines and other commitments to lend | ||||||||||||||||||||||||||||
| – less than one year | 127,423 | — | — | — | 127,423 | 166,572 | 181,914 | |||||||||||||||||||||
| – one year and over | 19,864 | 80,906 | 37,238 | 26,203 | 164,211 | 185,826 | 150,897 | |||||||||||||||||||||
| Other commitments | 2,597 | 77 | 11 | 3,322 | 6,007 | 9,326 | 5,368 | |||||||||||||||||||||
| 149,884 | 80,983 | 37,249 | 29,525 | 297,641 | 361,724 | 338,179 | ||||||||||||||||||||||
Banking commitments and contingent obligations, which have been entered into on behalf of customers and for which there are corresponding obligations from customers, are not included in assets and liabilities. The Group’s maximum exposure to credit loss, in the event of non-performance by the other party and where all counterclaims, collateral or security proves valueless, is represented by the contractual nominal amount of these instruments included in the table above. These commitments and contingent obligations are subject to the Group’s normal credit approval processes.
Contingent liabilities
Guarantees – the Group gives guarantees on behalf of customers. A financial guarantee represents an irrevocable undertaking that the Group will meet a customer’s obligations to third parties if the customer fails to do so. The maximum amount that the Group could be required to pay under a guarantee is its principal amount as disclosed in the table above. The Group expects most guarantees it provides to expire unused.
Other contingent liabilities – these include standby letters of credit, supporting customer debt issues and contingent liabilities relating to customer trading activities such as those arising from performance and customs bonds, warranties and indemnities.
Commitments
Commitments to lend – under a loan commitment the Group agrees to make funds available to a customer in the future. Loan commitments, which are usually for a specified term may be unconditionally cancellable or may persist, provided all conditions in the loan facility are satisfied or waived. Commitments to lend include commercial standby facilities and credit lines, liquidity facilities to commercial paper conduits and unutilised overdraft facilities.
Other commitments – these include documentary credits, which are commercial letters of credit providing for payment by the Group to a named beneficiary against presentation of specified documents, forward asset purchases, forward deposits placed and undrawn note issuance and revolving underwriting facilities, and other short-term trade related transactions.
288
Financial statements
Notes on the accounts
Contractual obligations for future expenditure not provided in the accounts
The following table shows contractual obligations for future expenditure not provided for in the accounts at the year end.
| Group | ||||||||||||
2009 £m | 2008 £m | 2007 £m | ||||||||||
| Operating leases | ||||||||||||
Minimum rentals payable under non-cancellable leases (1) | ||||||||||||
| Within 1 year | 479 | 579 | 359 | |||||||||
| After 1 year but within 5 years | 1,691 | 1,727 | 1,224 | |||||||||
| After 5 years | 3,055 | 3,299 | 3,017 | |||||||||
| 5,225 | 5,605 | 4,600 | ||||||||||
| Property, plant and equipment | ||||||||||||
| Contracts to buy, enhance or maintain investment properties | — | 7 | 9 | |||||||||
Contracts to buy assets to be leased under operating leases (2) | 2,724 | 6,063 | 1,350 | |||||||||
| Other capital expenditure | 89 | 128 | 201 | |||||||||
| 2,813 | 6,198 | 1,560 | ||||||||||
Contracts to purchase goods or services (3) | 665 | 2,127 | 1,598 | |||||||||
| Total | 8,703 | 13,930 | 7,758 | |||||||||
Notes:
| (1) | Predominantly property leases | ||
| (2) | Of which due within 1 year: £370 million (2008 – £3,769 million; 2007 – £713 million) | ||
| (3) | Of which due within 1 year: £480 million (2008 – £1,129 million; 2007 – £1,448 million) | ||
Trustee and other fiduciary activities
In its capacity as trustee or other fiduciary role, the Group may hold or place assets on behalf of individuals, trusts, companies, pension schemes and others. The assets and their income are not included in the Group’s financial statements. The Group earned fee income of £1,355 million (2008 – £1,442 million; 2007 – £695 million) from these activities.
The Financial Services Compensation Scheme
The Financial Services Compensation Scheme (FSCS), the UK's statutory fund of last resort for customers of authorised financial services firms, pays compensation if a firm is unable to meet its obligations. The FSCS funds compensation for customers by raising management expenses levies and compensation levies on the industry. In relation to protected deposits, each deposit-taking institution contributes towards these levies in proportion to their share of total protected deposits on 31 December of the year preceding the scheme year (which runs from 1 April to 31 March), subject to annual maxima set by the Financial Services Authority (FSA). In addition, the FSCS has the power to raise levies (‘exit levies’) on firms who have ceased to participate in the scheme and are in the process of ceasing to be authorised for the amount that the firm would otherwise have been asked to pay during the relevant levy year. The FSCS also has the power to raise exit levies on such firms which look at their potential liability to pay levies in future years.
FSCS has borrowed from HM Treasury to fund the compensation costs associated with Bradford & Bingley, Heritable Bank, Kaupthing Singer & Friedlander, Landsbanki ‘Icesave’ and London Scottish Bank plc. These borrowings are on an interest-only basis until September 2011. The annual limit on the FSCS management expenses levy for the three years from September 2008 in relation to these institutions has been capped at £1 billion per annum.
The FSCS will receive funds from asset sales, surplus cash flow, or other recoveries in relation to these institutions which will be used to reduce the principal amount of the FSCS's borrowings. Only after the interest only period, which is expected to end in September 2011, will a schedule for repayment of any remaining principal outstanding (after recoveries) on the borrowings be agreed between the FSCS and HM Treasury. It is expected that, from that point, the FSCS will begin to raise compensation levies (principal repayments). No provision has been made for these levies as the amount is not yet known and is unlikely to be determined before 2011.
The Group has accrued £135 million for its share of FSCS management expenses levies for the 2009/10 and 2010/11 scheme years.
Litigation
As a participant in the financial services industry, the Group operates in a legal and regulatory environment that exposes it to potentially significant litigation risks. As a result, the company and other members of the Group are involved in various disputes and legal proceedings in the United Kingdom, the United States and other jurisdictions, including litigation. Such cases are subject to many uncertainties, and their outcome is often difficult to predict, particularly in the earlier stages of a case.
Other than as set out in this section, so far as the Group is aware, neither the company nor any member of the Group is or has been engaged in or has pending or threatened any governmental, legal or arbitration proceedings which may have or have had in the recent past (covering the 12 months immediately preceding the date of this document) a significant effect on the Group’s financial position or profitability.
289
Notes on the accounts continued
32 Memorandum items continued
Unarranged overdraft charges
In common with other banks in the United Kingdom, the Royal Bank and NatWest have received claims and complaints from a large number of customers in the United Kingdom seeking refunds of unarranged overdraft charges (the “Charges”). The vast majority of these claims and complaints have challenged the Charges on the basis that they contravene the Unfair Terms in Consumer Contracts Regulations 1999 (the “Regulations”) or are unenforceable under the common law penalty doctrine (or both).
In July 2007, the Office of Fair Trading (“OFT”) issued proceedings in a test case in the English High Court against the banks which was intended to determine certain issues concerning the legal status and enforceability of contractual terms relating to the Charges. The test case concluded in November 2009 with a judgment of the Supreme Court in favour of the banks. As a result of the court rulings made in the test case, the Group expects substantially all of the customer claims and complaints it has received relating to the Charges to fail. The Group cannot at this stage predict with any certainty the final outcome of all customer claims and complaints. It is unable reliably to estimate any liability that may arise as a result of or in connection with these matters or its effect on the Group’s consolidated net assets, operating results or cash flows in any particular period.
Shareholder litigation
The company and a number of its subsidiaries and certain individual officers and directors have been named as defendants in a class action filed in the United States District Court for the Southern District of New York. The consolidated amended complaint alleges certain false and misleading statements and omissions in public filings and other communications during the period 1 March 2007 to 19 January 2009, and variously asserts claims under Sections 11, 12 and 15 of the Securities Act 1933, Sections 10 and 20 of the Securities Exchange Act 1934 and Rule 10b-5 thereunder.
The putative class is composed of (1) all persons who purchased or otherwise acquired Group securities between 1 March 2007 and 19 January 2009; and/or (2) all persons who purchased or otherwise acquired Series Q, R, S, T and/or U non-cumulative dollar preference shares issued pursuant or traceable to the 8 April 2005 SEC registration statement and were damaged thereby. Plaintiffs seek unquantified damages on behalf of the putative class.
The Group has also received notification of similar prospective claims in the United Kingdom and elsewhere but no court proceedings have been commenced in relation to these claims.
The Group considers that it has substantial and credible legal and factual defences to these claims and will defend them vigorously. The Group is unable reliably to estimate the liability, if any, that might arise or its effect on the Group’s consolidated net assets, operating results or cash flows in any particular period.
Other securitisation and securities related litigation in the United States
Group companies have been named as defendants in a number of purported class action and other lawsuits in the United States that relate to the securitisation and securities underwriting businesses. In general, the cases involve the issuance of mortgage backed securities, collateralised debt obligations, or public debt or equity where the plaintiffs have brought actions against the issuers and underwriters of such securities (including Group companies) claiming that certain disclosures made in connection with the relevant offerings of such securities were false or misleading with respect to alleged “sub-prime” mortgage exposure. The Group considers that it has substantial and credible legal and factual defences to these claims and will continue to defend them vigorously. The Group cannot at this stage reliably estimate the liability, if any, that may arise as a result of or in connection with the these lawsuits, individually or in the aggregate, or their effect on the Group’s consolidated net assets, operating results or cash flows in any particular period.
World Online International NV.
In November 2009 the Supreme Court in the Netherlands gave a declaratory judgment against World Online International NV, Goldmans Sachs International and ABN AMRO Bank NV in relation to claims arising out of the World Online initial public offering of 2000. It held that these defendants had committed certain wrongful acts in connection with the initial public offering. The judgment does not establish liability or the amount of any loss. The Group does not believe that any final liability or loss will have a significant effect on the Group’s financial position or profitability.
Summary of other disputes, legal proceedings and litigation
Members of the Group are engaged in other litigation in the United Kingdom and a number of overseas jurisdictions, including the United States, involving claims by and against them arising in the ordinary course of business. The Group has reviewed these other actual, threatened and known potential claims and proceedings and, after consulting with its legal advisers, does not expect that the outcome of these other claims and proceedings will have a material adverse effect on the Group’s financial position or profitability in any particular period.
Investigations
The Group’s businesses and financial condition can be affected by the fiscal or other policies and other actions of various governmental and regulatory authorities in the United Kingdom, the European Union, the United States and elsewhere. The Group has engaged, and will continue to engage, in discussions with relevant regulators, including in the United Kingdom and the United States, on an ongoing and regular basis informing them of operational, systems and control evaluations and issues as deemed appropriate or required and it is possible that any matters discussed or identified may result in investigatory actions by the regulators, increased costs being incurred by the Group, remediation of systems and controls, public or private censure or fines. Any of these events or circumstances could have a material adverse impact on the Group, its business, reputation, results of operations or the price of securities issued by it.
290
Financial statements
Notes on the accounts
In particular there is continuing political and regulatory scrutiny of the operation of the retail banking and consumer credit industries in the United Kingdom and elsewhere. The nature and impact of future changes in policies and regulatory action are not predictable and are beyond the Group’s control but could have an adverse impact on the Group’s businesses and earnings.
Retail banking
In the European Union, regulatory actions included an inquiry into retail banking initiated on 13 June 2005 in all of the then 25 member states by the European Commission’s Directorate General for Competition. The inquiry examined retail banking in Europe generally. On 31 January 2007, the European Commission announced that barriers to competition in certain areas of retail banking, payment cards and payment systems in the European Union had been identified. The European Commission indicated that it will consider using its powers to address these barriers and will encourage national competition authorities to enforce European and national competition laws where appropriate.
Multilateral interchange fees
In 2007, the European Commission issued a decision that while interchange is not illegal per se, MasterCard’s current multilateral interchange fee (“MIF”) arrangement for cross border payment card transactions with MasterCard and Maestro branded consumer credit and debit cards in the European Union are in breach of competition law. MasterCard was required by the decision to withdraw the relevant cross-border MIFs (i.e. set these fees to zero) by 21 June 2008.
MasterCard appealed against the decision to the European Court of First Instance on 1 March 2008, and the Group has intervened in the appeal proceedings. In addition, in Summer 2008, MasterCard announced various changes to its scheme arrangements. The European Commission was concerned that these changes might be used as a means of circumventing the requirements of the infringement decision. In April 2009 MasterCard agreed an interim settlement on the level of cross-border MIF with the European Commission pending the outcome of the appeal process and, as a result, the European Commission has advised it will no longer investigate the non-compliance issue (although MasterCard is continuing with its appeal).
Visa’s cross-border MIFs were exempted in 2002 by the European Commission for a period of five years up to 31 December 2007 subject to certain conditions. On 26 March 2008, the European Commission opened a formal inquiry into Visa’s current MIF arrangements for cross border payment card transactions with Visa branded debit and consumer credit cards in the European Union and on 6 April 2009 the European Commission announced that it had issued Visa with a formal Statement of Objections. At the same time Visa announced changes to its interchange levels and introduced some changes to enhance transparency. There is no deadline for the closure of the inquiry.
In the UK, the OFT has carried out investigations into Visa and MasterCard domestic credit card interchange rates. The decision by the OFT in the MasterCard interchange case was set aside by the Competition Appeal Tribunal (the “CAT”) in June 2006. The OFT’s investigations in the Visa interchange case and a second MasterCard interchange case are ongoing. On 9 February 2007, the OFT announced that it was expanding its investigation into domestic interchange rates to include debit cards. In January 2010 the OFT advised that it did not anticipate issuing a Statement of Objections prior to the European Court’s judgment, although it has reserved the right to do so if it considers it appropriate.
The outcome of these investigations is not known, but they may have an impact on the consumer credit industry in general and, therefore, on the Group’s business in this sector.
Payment Protection Insurance
Having conducted a market study relating to Payment Protection Insurance (“PPI”), on 7 February 2007 the OFT referred the PPI market to the Competition Commission (“CC”) for an in-depth inquiry. The CC published its final report on 29 January 2009 and announced its intention to order a range of remedies, including a prohibition on actively selling PPI at point of sale of the credit product (and for 7 days thereafter), a ban on single premium policies and other measures to increase transparency (in order to improve customers’ ability to search and improve price competition). Barclays Bank PLC subsequently appealed certain CC findings to the Competition Appeal Tribunal (“CAT”). On 16 October 2009, the CAT handed down a judgment quashing the ban on selling PPI at the point of sale of credit products and remitted the matter back to the CC for review. The CC’s current Administrative Timetable is to publish a supplementary report by Summer 2010 and give further consideration to its full range of recommended remedies and a draft order to implement them during Autumn 2010.
The FSA has been conducting a broad industry thematic review of PPI sales practices and in September 2008, the FSA announced that it intended to escalate its level of regulatory intervention. Substantial numbers of customer complaints alleging the mis-selling of PPI policies have been made to banks and to the FOS and many of these are being upheld by the FOS against the banks.
In September 2009, the FSA issued a consultation paper on guidance on the fair assessment of PPI mis-selling complaints and, where necessary, the provision of an appropriate level of redress. The consultation also covers proposed rules requiring firms to re-assess (against the new guidance) all PPI mis-selling complaints received and rejected since 14 January 2005. A policy statement containing final guidance and rules is expected in early 2010. Separately, discussions continue between the FSA and the Group in respect of concerns expressed by the FSA over certain categories of historical PPI sales.
Personal current accounts
On 16 July 2008, the OFT published the results of its market study into personal current accounts in the United Kingdom. The OFT found evidence of competition and several positive features in the personal current account market but believes that the market as a whole is not working well for consumers and that the ability of the market to function well has become distorted.
On 7 October 2009, the OFT published a follow-up report summarising the initiatives agreed between the OFT and personal current account providers to address the OFT’s concerns about transparency and switching, following its market study. Personal current account providers will take a number of steps to improve transparency, including providing customers with an annual summary of the cost of their account and making charges prominent on monthly statements. To improve the switching process, a number of steps are being introduced following work with BACS, the payment processor, including measures to reduce the impact on consumers of any problems with transferring direct debits.
291
Notes on the accounts continued
32 Memorandum items continued
On 22 December 2009, the OFT published a further report in which it stated that it continued to have significant concerns about the operation of the personal current account market in the United Kingdom, in particular in relation to unarranged overdrafts, and that it believed that fundamental changes are required for the market to work in the best interests of bank customers. The OFT stated that it would discuss these issues intensively with banks, consumer groups and other organisations, with the aim of reporting on progress by the end of March 2010.
US dollar clearing activities
In connection with a previously disclosed investigation of ABN AMRO’s New York Branch by US regulatory authorities, ABN AMRO and members of ABN AMRO’s management continue to provide information to the United States Department of Justice relating to ABN AMRO’s dollar clearing activities, United States Department of Treasury compliance procedures and other Bank Secrecy Act of 1970 compliance matters. ABN AMRO has reached an agreement in principle with the United States Department of Justice that would resolve all presently known aspects of the ongoing investigation, although no written agreement has yet been reached and negotiations continue. Under the terms of the agreement in principle, ABN AMRO and the United States would enter into a deferred prosecution agreement in which ABN AMRO would waive indictment and agree to the filing of information in the United States District Court charging it with certain violations of federal law based on information disclosed in an agreed factual statement. ABN AMRO would also agree to continue co-operating in the United States’ ongoing investigation and to settle all known civil and criminal claims currently held by the United States for the sum of US$500 million. The precise terms of the deferred prosecution agreement are still under negotiation.
Securitisation and collateralised debt obligation business
The New York State Attorney General has issued subpoenas to a wide array of participants in the securitisation and securities industry, focusing on the information underwriters obtained as part of the due diligence process from the independent due diligence firms. RBS Securities Inc. has produced documents requested by the New York State Attorney General, principally related to loans that were pooled into one securitisation transaction and will continue to cooperate with the investigation. More recently, the Massachusetts Attorney General has issued a subpoena to RBS Securities Inc. seeking information related to residential mortgage lending practices and sales and securitisation of residential mortgage loans. These respective investigations are in the early stages and therefore it is difficult to predict the potential exposure from any such investigation. The company and its subsidiaries are co-operating with these various investigations and requests.
Other investigations
In the UK, the OFT has been investigating the Group for alleged conduct in breach of Article 101 of the Treaty on the Functioning of the European Union and/or the Chapter 1 prohibition of the Competition Act 1998 relating to the provision of loan products to professional services firms. The Group is co-operating fully with the OFT's investigation.
In April 2009 the FSA notified the Group that it was commencing a supervisory review of the acquisition of ABN AMRO in 2007 and the 2008 capital raisings and an investigation into conduct, systems and controls within the Global Banking & Markets division of the Group. The company and its subsidiaries are cooperating fully with this review and investigation.
In November 2009, the FSA informed the Group that it was commencing an investigation into certain aspects of the policies of, and training and controls within, certain of the Group’s UK subsidiaries relating to compliance with UK money laundering regulations during the period from December 2007 to December 2008. The company and its subsidiaries are cooperating fully with this investigation.
In January 2010, the FSA informed the Group that it intended to commence an investigation into certain aspects of the handling of customer complaints. The scope of the proposed investigation (including which businesses and subsidiaries are affected) is not yet clear. The company and its subsidiaries intend to co-operate fully with this investigation.
In the United States, the company and certain subsidiaries have received requests for information from various governmental agencies, self-regulatory organisations, and state governmental agencies including in connection with sub-prime mortgages and securitisations, collateralised debt obligations and synthetic products related to sub-prime mortgages. In particular, during March 2008, the Group was advised by the US Securities and Exchange Commission that it had commenced a non-public, formal investigation relating to the Group’s United States sub-prime securities exposures and United States residential mortgage exposures. The company and its subsidiaries are cooperating with these various requests for information and investigations.
292
Financial statements
Notes on the accounts
33 Net cash (outflow)/inflow from operating activities
| Group | Company | |||||||||||||||||||||||
| 2009 £m | Restated 2008 | 2007 £m | 2009 £m | 2008 £m | 2007 £m | |||||||||||||||||||
| Operating (loss)/profit before tax | (2,595 | ) | (40,836 | ) | 9,832 | (1,286 | ) | (10,017 | ) | 2,372 | ||||||||||||||
| Operating (loss)/profit before tax on discontinued activities | (101 | ) | 4,208 | 68 | — | — | — | |||||||||||||||||
| Decrease/(increase) in prepayments and accrued income | 433 | (921 | ) | (662 | ) | — | — | (1 | ) | |||||||||||||||
| Interest on subordinated liabilities | 1,490 | 2,144 | 1,518 | 537 | 499 | 470 | ||||||||||||||||||
| (Decrease)/increase in accruals and deferred income | (1,538 | ) | 3,961 | (818 | ) | (1 | ) | 7 | — | |||||||||||||||
| Provisions for impairment losses | 14,950 | 8,072 | 1,968 | — | — | — | ||||||||||||||||||
| Loans and advances written-off net of recoveries | (6,540 | ) | (2,829 | ) | (1,669 | ) | — | — | — | |||||||||||||||
| Unwind of discount on impairment losses | (408 | ) | (194 | ) | (164 | ) | — | — | — | |||||||||||||||
| Profit on sale of property, plant and equipment | (43 | ) | (167 | ) | (741 | ) | — | — | — | |||||||||||||||
| Profit/(loss) on sale of subsidiaries and associates | 135 | (943 | ) | (67 | ) | — | (487 | ) | — | |||||||||||||||
| Profit on sale of securities | (294 | ) | (342 | ) | (544 | ) | — | — | — | |||||||||||||||
| Charge for defined benefit pension schemes | 659 | 490 | 489 | — | — | — | ||||||||||||||||||
| Pension scheme curtailment gains | (2,148 | ) | — | — | — | — | — | |||||||||||||||||
| Cash contribution to defined benefit pension schemes | (1,153 | ) | (810 | ) | (599 | ) | — | — | — | |||||||||||||||
| Other provisions utilised | (159 | ) | (32 | ) | (211 | ) | — | — | — | |||||||||||||||
| Depreciation and amortisation | 2,809 | 3,154 | 1,932 | — | — | — | ||||||||||||||||||
| Gain on redemption of own debt | (3,790 | ) | — | — | (238 | ) | — | — | ||||||||||||||||
| Write down of goodwill and other intangible assets | 363 | 32,581 | — | — | — | — | ||||||||||||||||||
| Write down of investment in subsidiaries | — | — | — | 5,139 | 14,321 | — | ||||||||||||||||||
| Elimination of foreign exchange differences | 12,217 | (41,874 | ) | (10,282 | ) | (753 | ) | 1,778 | (58 | ) | ||||||||||||||
| Elimination of non-cash items on discontinued activities | — | 592 | 62 | — | — | — | ||||||||||||||||||
| Other non-cash items | 1,404 | 2,167 | (327 | ) | 21 | 2 | 2 | |||||||||||||||||
| Net cash inflow/(outflow) from trading activities | 15,691 | (31,579 | ) | (215 | ) | 3,419 | 6,103 | 2,785 | ||||||||||||||||
| Decrease/(increase) in loans and advances to banks and customers | 151,568 | (5,469 | ) | (90,829 | ) | 4,121 | (15,542 | ) | (8 | ) | ||||||||||||||
| (Increase)/decrease in securities | (5,902 | ) | 75,964 | (26,167 | ) | (1,286 | ) | — | — | |||||||||||||||
| (Increase)/decrease in other assets | (1,839 | ) | (5,845 | ) | (384 | ) | (10 | ) | (73 | ) | — | |||||||||||||
| Decrease/(increase) in derivative assets | 544,744 | (708,607 | ) | (88,948 | ) | (1 | ) | (995 | ) | (173 | ) | |||||||||||||
| Changes in operating assets | 688,571 | (643,957 | ) | (206,328 | ) | 2,824 | (16,610 | ) | (181 | ) | ||||||||||||||
| (Decrease)/increase in deposits by banks and customers | (131,685 | ) | (78,166 | ) | 81,645 | 11,533 | (4,064 | ) | 4,677 | |||||||||||||||
| Increase/(decrease) in insurance liabilities | 429 | (186 | ) | 2,706 | — | — | — | |||||||||||||||||
| (Decrease)/increase in debt securities in issue | (34,528 | ) | 27,222 | 59,735 | (1,828 | ) | (1,794 | ) | 10,936 | |||||||||||||||
| Increase/(decrease) in other liabilities | 20 | (8,869 | ) | (1,036 | ) | (66 | ) | 32 | (7 | ) | ||||||||||||||
| (Decrease)/increase in derivative liabilities | (540,540 | ) | 699,601 | 83,466 | 85 | 182 | 137 | |||||||||||||||||
| Increase/(decrease) in settlement balances and short positions | 1,769 | (37,864 | ) | 8,073 | (11 | ) | — | — | ||||||||||||||||
| Changes in operating liabilities | (704,535 | ) | 601,738 | 234,589 | 9,713 | (5,644 | ) | 15,743 | ||||||||||||||||
| Total income taxes (paid)/received | (719 | ) | (1,540 | ) | (2,442 | ) | 409 | 119 | 6 | |||||||||||||||
| Net cash (outflow)/inflow from operating activities | (992 | ) | (75,338 | ) | 25,604 | 16,365 | (16,032 | ) | 18,353 | |||||||||||||||
293
Notes on the accounts continued
34 Analysis of the net investment in business interests and
intangible assets
(a) Acquisition of ABN AMRO
On 17 October 2007, the Group, through its subsidiary RFS Holdings B.V. (RFS), acquired 99% of the ordinary shares of ABN AMRO Holding N.V., the holding company of a major European banking group based in the Netherlands with subsidiaries that undertake commercial banking operations, investment banking and other related financial activities. During 2008, RFS acquired the remaining 1% of the ordinary shares of ABN AMRO.
The fair values of ABN AMRO’s assets and liabilities at the date of acquisition were as follows:
Pre-acquisition carrying | Disposal groups (1) | Fair value adjustments | Recognised acquisition | |||||||||||||
| Cash and balances at central banks | 7,263 | (186 | ) | — | 7,077 | |||||||||||
| Loans and advances to banks | 120,120 | (3,646 | ) | — | 116,474 | |||||||||||
| Loans and advances to customers | 314,287 | (26,158 | ) | (2,542 | ) | 285,587 | ||||||||||
| Treasury and other eligible bills and debt and equity securities | 166,018 | (3,804 | ) | — | 162,214 | |||||||||||
| Derivatives | 86,695 | (322 | ) | — | 86,373 | |||||||||||
| Intangible assets | 4,239 | (3,522 | ) | 5,070 | 5,787 | |||||||||||
| Property, plant and equipment | 2,062 | (747 | ) | 170 | 1,485 | |||||||||||
| Other assets | 32,710 | (7 | ) | 1,177 | 33,880 | |||||||||||
Assets of disposal groups (1) | 2,987 | 38,392 | 689 | 42,068 | ||||||||||||
| Deposits by banks | (160,906 | ) | 2,808 | 1 | (158,097 | ) | ||||||||||
| Customer accounts | (253,583 | ) | 13,786 | (150 | ) | (239,947 | ) | |||||||||
| Debt securities in issue | (134,630 | ) | 5,937 | 225 | (128,468 | ) | ||||||||||
| Settlement balances and short positions | (44,748 | ) | 36 | — | (44,712 | ) | ||||||||||
| Derivatives | (85,491 | ) | 417 | — | (85,074 | ) | ||||||||||
| Subordinated liabilities | (11,748 | ) | 868 | 624 | (10,256 | ) | ||||||||||
| Other liabilities | (21,268 | ) | 271 | (1,928 | ) | (22,925 | ) | |||||||||
Liabilities of disposal groups (1) | (2,377 | ) | (24,123 | ) | — | (26,500 | ) | |||||||||
| Net identifiable assets and liabilities | 21,630 | — | 3,336 | 24,966 | ||||||||||||
| Minority interests | (242 | ) | ||||||||||||||
| Goodwill on acquisition | 23,851 | |||||||||||||||
| Consideration | 48,575 | |||||||||||||||
| Satisfied by: | ||||||||||||||||
| Issue of 531 million ordinary shares of the company | 2,719 | |||||||||||||||
| Cash | 45,786 | |||||||||||||||
| Fees and expenses relating to the acquisition | 70 | |||||||||||||||
| Consideration | 48,575 | |||||||||||||||
| Net cash: | ||||||||||||||||
| Cash consideration | 45,856 | |||||||||||||||
| Cash acquired | (60,093 | ) | ||||||||||||||
| (14,237 | ) |
Note:
| (1) | Banca Antonveneta SpA. and ABN AMRO’s asset management business were identified as disposal groups on the acquisition of ABN AMRO and sold during 2008. In addition, under the terms of the Consortium and Shareholders’ Agreement, consortium members other than the Group agreed to acquire, in due course, various ABN AMRO businesses including operations in Brazil (sold 1 July 2008), the commercial and retail businesses in the Netherlands, the private clients business and Interbanca. |
It is estimated that the Group would have reported total income of £37.2 billion and profit after tax of £7.7 billion from continuing operations for the year ended 31 December 2007 had all acquisitions occurred on 1 January 2007.
294
Financial statements
Notes on the accounts
(b) Other acquisitions and disposals
| Group | ||||||||||||
2009 £m | 2008 £m | 2007 £m | ||||||||||
| Fair value given for businesses acquired | (115 | ) | (1,810 | ) | (280 | ) | ||||||
| Cash and cash equivalents acquired | — | — | 5 | |||||||||
| Non-cash consideration | — | (17 | ) | — | ||||||||
| Net outflow of cash in respect of purchases | (115 | ) | (1,827 | ) | (275 | ) | ||||||
| Cash and cash equivalents in businesses sold | — | — | 21 | |||||||||
| Other assets sold | 896 | 739 | 16 | |||||||||
| Non-cash consideration | — | (103 | ) | (2 | ) | |||||||
| (Loss)/profit on disposal | (135 | ) | 943 | 67 | ||||||||
| Net inflow of cash in respect of disposals | 761 | 1,579 | 102 | |||||||||
| Dividends received from joint ventures | 21 | 89 | 11 | |||||||||
| Cash expenditure on intangible assets | (562 | ) | 2,411 | (435 | ) | |||||||
| Net inflow/(outflow) | 105 | 2,252 | (597 | ) | ||||||||
The Group’s reported result from continuing operations for 2009 and 2008 would not have been materially affected had all acquisitions occurred on 1 January 2008 or 1 January 2009. The profit on disposal arises on the sales of Angel Trains, Tesco Personal Finance and the European Consumer Finance business during 2008.
35 Interest received and paid
| Group | Company | |||||||||||||||||||||||
2009 £m | 2008 £m | 2007 £m | 2009 £m | 2008 £m | 2007 £m | |||||||||||||||||||
| Interest received | 36,396 | 52,393 | 31,552 | 1,140 | 794 | 457 | ||||||||||||||||||
| Interest paid | (21,224 | ) | (31,614 | ) | (18,407 | ) | (866 | ) | (1,325 | ) | (746 | ) | ||||||||||||
| 15,172 | 20,779 | 13,145 | 274 | (531 | ) | (289 | ) | |||||||||||||||||
295
Notes on the accounts continued
36 Analysis of changes in financing during the year
Group | Company | |||||||||||||||||||||||||||||||||||||||||||||||
Share capital, share premium, paid-in equity and merger reserve | Subordinated liabilities | Share capital, share premium, paid-in equity and merger reserve | Subordinated liabilities | |||||||||||||||||||||||||||||||||||||||||||||
| 2009 | 2008 | 2007 | 2009 | 2008 | 2007 | 2009 | 2008 | 2007 | 2009 | 2008 | 2007 | |||||||||||||||||||||||||||||||||||||
| £m | £m | £m | £m | £m | £m | £m | £m | £m | £m | £m | £m | |||||||||||||||||||||||||||||||||||||
| At 1 January | 49,323 | 31,806 | 24,178 | 49,154 | 38,043 | 27,654 | 38,442 | 20,925 | 13,297 | 10,314 | 7,743 | 8,194 | ||||||||||||||||||||||||||||||||||||
| Issue of ordinary shares | — | 49 | 77 | — | — | — | — | 49 | 77 | — | — | — | ||||||||||||||||||||||||||||||||||||
| Issue of other | ||||||||||||||||||||||||||||||||||||||||||||||||
| equity securities | — | — | 4,673 | — | — | — | — | — | 4,673 | — | — | — | ||||||||||||||||||||||||||||||||||||
| Redemption of | ||||||||||||||||||||||||||||||||||||||||||||||||
| preference shares | (5,000 | ) | — | — | — | — | — | (5,000 | ) | — | — | — | — | — | ||||||||||||||||||||||||||||||||||
| Placing and open offer | 5,274 | 19,741 | — | — | — | — | 5,274 | 19,741 | — | — | — | — | ||||||||||||||||||||||||||||||||||||
| Rights issue | — | 12,000 | — | — | — | — | — | 12,000 | — | — | — | — | ||||||||||||||||||||||||||||||||||||
| Issue of B shares | 25,101 | — | — | — | — | — | 12,801 | — | — | — | — | — | ||||||||||||||||||||||||||||||||||||
| Redemption of | ||||||||||||||||||||||||||||||||||||||||||||||||
| paid in equity | (308 | ) | — | — | — | — | — | (308 | ) | — | — | — | — | — | ||||||||||||||||||||||||||||||||||
| Net proceeds from issue of | ||||||||||||||||||||||||||||||||||||||||||||||||
| subordinated liabilities | — | — | — | 2,309 | 2,413 | 1,018 | — | — | — | — | — | — | ||||||||||||||||||||||||||||||||||||
| Repayment of | ||||||||||||||||||||||||||||||||||||||||||||||||
| subordinated liabilities | — | — | — | (5,145 | ) | (1,727 | ) | (1,708 | ) | — | — | — | (458 | ) | — | (469 | ) | |||||||||||||||||||||||||||||||
| Net cash inflow/(outflow) | ||||||||||||||||||||||||||||||||||||||||||||||||
| from financing | 25,067 | 31,790 | 4,750 | (2,836 | ) | 686 | (690 | ) | 12,767 | 31,790 | 4,750 | (458 | ) | — | (469 | ) | ||||||||||||||||||||||||||||||||
| Investment in subsidiaries | — | — | 2,719 | — | — | 10,256 | 12,300 | — | 2,719 | — | — | — | ||||||||||||||||||||||||||||||||||||
| Transfer to | ||||||||||||||||||||||||||||||||||||||||||||||||
| retained earnings | (10,150 | ) | (14,273 | ) | — | — | — | — | (10,150 | ) | (14,273 | ) | — | — | — | — | ||||||||||||||||||||||||||||||||
| Currency translation and | ||||||||||||||||||||||||||||||||||||||||||||||||
| other adjustments | — | — | 159 | (8,666 | ) | 10,425 | 823 | — | — | 159 | (1,094 | ) | 2,571 | 18 | ||||||||||||||||||||||||||||||||||
| At 31 December | 64,240 | 49,323 | 31,806 | 37,652 | 49,154 | 38,043 | 53,359 | 38,442 | 20,925 | 8,762 | 10,314 | 7,743 | ||||||||||||||||||||||||||||||||||||
37 Analysis of cash and cash equivalents
| Group | Company | |||||||||||||||||||||||
| At 1 January | 2009 £m | 2008 £m | 2007 £m | 2009 £m | 2008 £m | 2007 £m | ||||||||||||||||||
| – cash | 72,425 | 52,796 | 28,378 | — | 5 | 11 | ||||||||||||||||||
| – cash equivalents | 62,500 | 96,159 | 43,273 | 5,069 | 1,568 | 646 | ||||||||||||||||||
| 134,925 | 148,955 | 71,651 | 5,069 | 1,573 | 657 | |||||||||||||||||||
| Acquisition of subsidiaries | — | — | 60,098 | — | — | — | ||||||||||||||||||
| Disposal of subsidiaries | — | (3,171 | ) | — | — | — | — | |||||||||||||||||
| Net cash inflow/(outflow) | 9,261 | (10,859 | ) | 17,206 | 11,379 | 3,496 | 916 | |||||||||||||||||
| At 31 December | 144,186 | 134,925 | 148,955 | 16,448 | 5,069 | 1,573 | ||||||||||||||||||
| Comprising: | ||||||||||||||||||||||||
| Cash and balances at central banks | 51,811 | 12,007 | 17,428 | — | — | — | ||||||||||||||||||
| Treasury bills and debt securities | 15,818 | 15,623 | 6,818 | — | — | — | ||||||||||||||||||
| Loans and advances to banks | 76,557 | 107,295 | 124,709 | 16,448 | 5,069 | 1,573 | ||||||||||||||||||
| Cash and cash equivalents | 144,186 | 134,925 | 148,955 | 16,448 | 5,069 | 1,573 | ||||||||||||||||||
Certain subsidiary undertakings are required to maintain balances with the Bank of England which, at 31 December 2009, amounted to £450 million (2008 – £393 million; 2007 – £439 million). Certain subsidiary undertakings are required by law to maintain reserve balances with the Federal Reserve Bank in the US. Such reserve balances were nil at 31 December 2009 (2008 – nil; 2007 – US$1 million). ABN AMRO had mandatory reserve deposits of €6 million at 31 December 2009 (2008 – €3 million; 2007 – €6 million).
296
Financial statements
Notes on the accounts
38 Segmental analysis
(a) Divisions
Following a comprehensive strategic review, changes have been made to the Group’s operating segments in 2009. A Non-Core division has been created comprising those lines of business, portfolios and individual assets that the Group intends to run off or sell. Furthermore, Business Services (formerly Group Manufacturing) is no longer reported as a separate division and its costs are now allocated to the customer-facing divisions along with certain central costs. UK Retail & Commercial Banking has been split into three segments (UK Retail, UK Corporate and Wealth). Ulster Bank has become a specific segment. The remaining elements of Europe & Middle East Retail & Commercial Banking, Asia Retail & Commercial Banking and Share of shared assets form part of Non-Core. The segment measure is now Operating profit/(loss) before tax which differs from Contribution used previously; it excludes certain infrequent items and RFS Holdings minority interest, which is not an operating segment of the Group. Comparative data have been restated accordingly.
The directors manage the Group primarily by class of business and present the segmental analysis on that basis. Segments charge market prices for services rendered to other parts of the Group; funding charges between segments are determined by Group Treasury, having regard to commercial demands.
The Group’s activities are organised as follows:
UK Retail offers a comprehensive range of banking products and related financial services to the personal market. It serves customers through the Royal Bank and NatWest networks of branches and ATMs in the United Kingdom, and also through telephone and internet channels.
UK Corporate is a leading provider of banking, finance, and risk management services to the corporate and SME sector in the United Kingdom. It offers a full range of banking products and related financial services through a nationwide network of relationship managers, and also through telephone and internet channels. The product range includes asset finance through the Lombard brand.
Wealth provides private banking and investment services in the UK through Coutts & Co and Adam & Company; offshore banking through RBS International, NatWest Offshore and Isle of Man Bank; and international private banking through RBS Coutts.
Global Banking & Markets (GBM) is a leading banking partner to major corporations and financial institutions around the world, providing an extensive range of debt and equity financing, risk management and investment services to its customers. The division is organised along six principal business lines: money markets; rates flow trading; currencies and commodities; equities; credit markets and portfolio management & origination.
Global Transaction Services ranks among the top five global transaction services providers, offering global payments, cash and liquidity management, and trade finance and commercial card products and services. It includes the Group’s corporate money transmission activities in the United Kingdom and the United States as well as Global Merchant Services, the Group’s United Kingdom and international merchant acquiring business.
Ulster Bank is the leading retail and commercial bank in Northern Ireland and the third largest banking group on the island of Ireland. It provides a comprehensive range of financial services through both its Retail Markets division which has a network of branches and operates in the personal and bancassurance sectors, and its Corporate Markets division, which provides services to SME business customers, corporates and institutional markets.
US Retail & Commercial provides financial services primarily through the Citizens and Charter One brands. US Retail & Commercial is engaged in retail and corporate banking activities through its branch network in 12 states in the United States and through non-branch offices in other states. It ranks among the top five banks in New England.
RBS Insurance sells and underwrites retail and SME insurance over the telephone and internet, as well as through brokers and partnerships. Its brands include Direct Line, Churchill and Privilege, which sell general insurance products direct to the customer, as well as Green Flag and NIG. Through its international division, RBS Insurance sells general insurance, mainly motor, in Germany and Italy. The Intermediary and Broker division sells general insurance products through independent brokers.
Central Functions comprises group and corporate functions, such as treasury, funding and finance, risk management, legal, communications and human resources. The Centre manages the Group’s capital resources and Group-wide regulatory projects and provides services to the operating divisions.
Non-Core Division manages separately assets that the Group intends to run off or dispose. The division contains a range of businesses and asset portfolios primarily from the GBM division, including RBS Sempra Commodities, linked to proprietary trading, higher risk profile asset portfolios including excess risk concentrations, and other illiquid portfolios. It also includes a number of other portfolios and businesses, including regional markets businesses, that the Group has concluded are no longer strategic.
297
Notes on the accounts continued
38 Segmental analysis continued
| Group | ||||||||||||||||||||||||||||
| Operating | ||||||||||||||||||||||||||||
| Net | Non- | expenses and | Depreciation | |||||||||||||||||||||||||
| interest | interest | Total | insurance | and | Impairment | Operating | ||||||||||||||||||||||
| income | income | income | claims | amortisation | losses | profit/(loss) | ||||||||||||||||||||||
| 2009 | £m | £m | £m | £m | £m | £m | £m | |||||||||||||||||||||
| UK Retail | 3,452 | 1,629 | 5,081 | (3,170 | ) | (3 | ) | (1,679 | ) | 229 | ||||||||||||||||||
| UK Corporate | 2,292 | 1,290 | 3,582 | (1,376 | ) | (154 | ) | (927 | ) | 1,125 | ||||||||||||||||||
| Wealth | 663 | 446 | 1,109 | (645 | ) | (11 | ) | (33 | ) | 420 | ||||||||||||||||||
| Global Banking & Markets | 2,375 | 8,634 | 11,009 | (4,482 | ) | (178 | ) | (640 | ) | 5,709 | ||||||||||||||||||
| Global Transaction Services | 912 | 1,575 | 2,487 | (1,462 | ) | (13 | ) | (39 | ) | 973 | ||||||||||||||||||
| Ulster Bank | 780 | 254 | 1,034 | (748 | ) | (5 | ) | (649 | ) | (368 | ) | |||||||||||||||||
| US Retail & Commercial | 1,775 | 949 | 2,724 | (2,063 | ) | (72 | ) | (702 | ) | (113 | ) | |||||||||||||||||
| RBS Insurance | 354 | 4,106 | 4,460 | (4,363 | ) | (31 | ) | (8 | ) | 58 | ||||||||||||||||||
| Central items | (284 | ) | 524 | 240 | 1,017 | (964 | ) | (1 | ) | 292 | ||||||||||||||||||
| Core | 12,319 | 19,407 | 31,726 | (17,292 | ) | (1,431 | ) | (4,678 | ) | 8,325 | ||||||||||||||||||
| Non-Core | 1,248 | (3,549 | ) | (2,301 | ) | (2,593 | ) | (442 | ) | (9,221 | ) | (14,557 | ) | |||||||||||||||
| 13,567 | 15,858 | 29,425 | (19,885 | ) | (1,873 | ) | (13,899 | ) | (6,232 | ) | ||||||||||||||||||
| Reconciling items | ||||||||||||||||||||||||||||
| RFS Holdings minority interest | 2,937 | 2,406 | 5,343 | (3,950 | ) | (646 | ) | (1,051 | ) | (304 | ) | |||||||||||||||||
| Amortisation of purchased intangible assets | — | — | — | — | (272 | ) | — | (272 | ) | |||||||||||||||||||
| Write-down of goodwill | — | — | — | (363 | ) | — | — | (363 | ) | |||||||||||||||||||
| Integration and restructuring costs | — | — | — | (1,268 | ) | (18 | ) | — | (1,286 | ) | ||||||||||||||||||
| Gain on redemption of own debt | — | 3,790 | 3,790 | — | — | — | 3,790 | |||||||||||||||||||||
| Strategic disposals | — | 132 | 132 | — | — | — | 132 | |||||||||||||||||||||
| Gains on pensions curtailment | — | — | — | 2,148 | — | — | 2,148 | |||||||||||||||||||||
| Bonus tax | — | — | — | (208 | ) | — | — | (208 | ) | |||||||||||||||||||
| 16,504 | 22,186 | 38,690 | (23,526 | ) | (2,809 | ) | (14,950 | ) | (2,595 | ) | ||||||||||||||||||
| 2008 | ||||||||||||||||||||||||||||
| UK Retail | 3,187 | 1,935 | 5,122 | (3,378 | ) | (2 | ) | (1,019 | ) | 723 | ||||||||||||||||||
| UK Corporate | 2,448 | 1,289 | 3,737 | (1,487 | ) | (150 | ) | (319 | ) | 1,781 | ||||||||||||||||||
| Wealth | 578 | 481 | 1,059 | (686 | ) | (9 | ) | (16 | ) | 348 | ||||||||||||||||||
| Global Banking & Markets | 2,326 | 388 | 2,714 | (3,705 | ) | (283 | ) | (522 | ) | (1,796 | ) | |||||||||||||||||
| Global Transaction Services | 937 | 1,494 | 2,431 | (1,372 | ) | (3 | ) | (54 | ) | 1,002 | ||||||||||||||||||
| Ulster Bank | 708 | 331 | 1,039 | (715 | ) | — | (106 | ) | 218 | |||||||||||||||||||
| US Retail & Commercial | 1,726 | 861 | 2,587 | (1,471 | ) | (151 | ) | (437 | ) | 528 | ||||||||||||||||||
| RBS Insurance | 496 | 3,934 | 4,430 | (3,767 | ) | (37 | ) | (42 | ) | 584 | ||||||||||||||||||
| Central items | 1,710 | (1,198 | ) | 512 | 1,148 | (654 | ) | 19 | 1,025 | |||||||||||||||||||
| Core | 14,116 | 9,515 | 23,631 | (15,433 | ) | (1,289 | ) | (2,496 | ) | 4,413 | ||||||||||||||||||
| Non-Core | 1,648 | (4,680 | ) | (3,032 | ) | (2,840 | ) | (543 | ) | (4,936 | ) | (11,351 | ) | |||||||||||||||
| 15,764 | 4,835 | 20,599 | (18,273 | ) | (1,832 | ) | (7,432 | ) | (6,938 | ) | ||||||||||||||||||
| Reconciling items | ||||||||||||||||||||||||||||
| RFS Holdings minority interest | 2,911 | 1,916 | 4,827 | (3,303 | ) | (843 | ) | (640 | ) | 41 | ||||||||||||||||||
| Amortisation of purchased intangible assets | — | — | — | — | (443 | ) | — | (443 | ) | |||||||||||||||||||
| Write-down of goodwill and other intangible assets | — | — | — | (32,581 | ) | — | — | (32,581 | ) | |||||||||||||||||||
| Integration and restructuring costs | — | — | — | (1,321 | ) | (36 | ) | — | (1,357 | ) | ||||||||||||||||||
| Strategic disposals | — | 442 | 442 | — | — | — | 442 | |||||||||||||||||||||
| 18,675 | 7,193 | 25,868 | (55,478 | ) | (3,154 | ) | (8,072 | ) | (40,836 | ) | ||||||||||||||||||
| 2007 | ||||||||||||||||||||||||||||
| UK Retail | 3,230 | 2,508 | 5,738 | (3,525 | ) | (6 | ) | (975 | ) | 1,232 | ||||||||||||||||||
| UK Corporate | 2,252 | 1,227 | 3,479 | (1,378 | ) | (120 | ) | (178 | ) | 1,803 | ||||||||||||||||||
| Wealth | 653 | 465 | 1,118 | (613 | ) | (11 | ) | (3 | ) | 491 | ||||||||||||||||||
| Global Banking & Markets | 418 | 3,429 | 3,847 | (2,624 | ) | (133 | ) | (66 | ) | 1,024 | ||||||||||||||||||
| Global Transaction Services | 647 | 1,150 | 1,797 | (888 | ) | — | (14 | ) | 895 | |||||||||||||||||||
| Ulster Bank | 659 | 328 | 987 | (619 | ) | (5 | ) | (46 | ) | 317 | ||||||||||||||||||
| US Retail & Commercial | 1,613 | 801 | 2,414 | (1,312 | ) | (113 | ) | (246 | ) | 743 | ||||||||||||||||||
| RBS Insurance | 514 | 4,060 | 4,574 | (3,987 | ) | (45 | ) | — | 542 | |||||||||||||||||||
| Central items | 497 | 56 | 553 | 893 | (598 | ) | (3 | ) | 845 | |||||||||||||||||||
| Core | 10,483 | 14,024 | 24,507 | (14,053 | ) | (1,031 | ) | (1,531 | ) | 7,892 | ||||||||||||||||||
| Non-Core | 1,041 | 3,986 | 5,027 | (1,920 | ) | (561 | ) | (399 | ) | 2,147 | ||||||||||||||||||
| 11,524 | 18,010 | 29,534 | (15,973 | ) | (1,592 | ) | (1,930 | ) | 10,039 | |||||||||||||||||||
| Reconciling items | ||||||||||||||||||||||||||||
| RFS Holdings minority interest | 545 | 287 | 832 | (573 | ) | (58 | ) | (38 | ) | 163 | ||||||||||||||||||
| Amortisation of purchased intangible assets | — | — | — | (40 | ) | (222 | ) | — | (262 | ) | ||||||||||||||||||
| Integration and restructuring costs | — | — | — | (48 | ) | (60 | ) | — | (108 | ) | ||||||||||||||||||
| 12,069 | 18,297 | 30,366 | (16,634 | ) | (1,932 | ) | (1,968 | ) | 9,832 | |||||||||||||||||||
298
Financial statements
Notes on the accounts
| 2009 | 2008 | 2007 | ||||||||||||||||||||||||||||||||||
| Inter | Inter | Inter | ||||||||||||||||||||||||||||||||||
| External | segment | Total | External | segment | Total | External | segment | Total | ||||||||||||||||||||||||||||
| Total revenue | £m | £m | £m | £m | £m | £m | £m | £m | £m | |||||||||||||||||||||||||||
| UK Retail | 7,156 | 599 | 7,755 | 8,416 | 1,652 | 10,068 | 8,376 | 1,689 | 10,065 | |||||||||||||||||||||||||||
| UK Corporate | 4,563 | 118 | 4,681 | 8,309 | 225 | 8,534 | 7,877 | 43 | 7,920 | |||||||||||||||||||||||||||
| Wealth | 813 | 820 | 1,633 | 1,125 | 2,122 | 3,247 | 1,082 | 2,218 | 3,300 | |||||||||||||||||||||||||||
| Global Banking & Markets | 13,756 | 9,142 | 22,898 | 11,059 | 11,078 | 22,137 | 6,803 | 6,462 | 13,265 | |||||||||||||||||||||||||||
| Global Transaction Services | 2,923 | 60 | 2,983 | 2,937 | 81 | 3,018 | 2,940 | 77 | 3,017 | |||||||||||||||||||||||||||
| Ulster Bank | 1,604 | 104 | 1,708 | 2,762 | 748 | 3,510 | 2,500 | 197 | 2,697 | |||||||||||||||||||||||||||
| US Retail & Commercial | 4,080 | 378 | 4,458 | 4,200 | 475 | 4,675 | 4,370 | 504 | 4,874 | |||||||||||||||||||||||||||
| RBS Insurance | 5,018 | 19 | 5,037 | 5,040 | 33 | 5,073 | 5,221 | 89 | 5,310 | |||||||||||||||||||||||||||
| Central items | 787 | 10,825 | 11,612 | 1,166 | 13,388 | 14,554 | 1,650 | 9,973 | 11,623 | |||||||||||||||||||||||||||
| Core | 40,700 | 22,065 | 62,765 | 45,014 | 29,802 | 74,816 | 40,819 | 21,252 | 62,071 | |||||||||||||||||||||||||||
| Non-Core | 3,358 | 1,292 | 4,650 | 4,242 | 1,657 | 5,899 | 10,678 | 2,778 | 13,456 | |||||||||||||||||||||||||||
| 44,058 | 23,357 | 67,415 | 49,256 | 31,459 | 80,715 | 51,497 | 24,030 | 75,527 | ||||||||||||||||||||||||||||
| Reconciling items | ||||||||||||||||||||||||||||||||||||
| RFS Holdings minority interest | 11,127 | (1,044 | ) | 10,083 | 9,703 | (24 | ) | 9,679 | 1,534 | (255 | ) | 1,279 | ||||||||||||||||||||||||
| Gain on redemption of own debt | 3,790 | — | 3,790 | — | — | — | — | — | — | |||||||||||||||||||||||||||
| Strategic disposals | 132 | — | 132 | 442 | — | 442 | — | — | — | |||||||||||||||||||||||||||
| Eliminations | — | (22,313 | ) | (22,313 | ) | — | (31,435 | ) | (31,435 | ) | — | (23,775 | ) | (23,775 | ) | |||||||||||||||||||||
| 59,107 | — | 59,107 | 59,401 | — | 59,401 | 53,031 | — | 53,031 | ||||||||||||||||||||||||||||
| 2009 | 2008 | 2007 | ||||||||||||||||||||||||||||||||||
| Inter | Inter | Inter | ||||||||||||||||||||||||||||||||||
| External | segment | Total | External | segment | Total | External | segment | Total | ||||||||||||||||||||||||||||
| Total income | £m | £m | £m | £m | £m | £m | £m | £m | £m | |||||||||||||||||||||||||||
| UK Retail | 5,157 | (76 | ) | 5,081 | 5,499 | (377 | ) | 5,122 | 6,091 | (353 | ) | 5,738 | ||||||||||||||||||||||||
| UK Corporate | 4,422 | (840 | ) | 3,582 | 6,372 | (2,635 | ) | 3,737 | 5,723 | (2,244 | ) | 3,479 | ||||||||||||||||||||||||
| Wealth | 409 | 700 | 1,109 | (761 | ) | 1,820 | 1,059 | (956 | ) | 2,074 | 1,118 | |||||||||||||||||||||||||
| Global Banking & Markets | 10,125 | 884 | 11,009 | 1,336 | 1,378 | 2,714 | 3,171 | 676 | 3,847 | |||||||||||||||||||||||||||
| Global Transaction Services | 2,438 | 49 | 2,487 | 1,967 | 464 | 2,431 | 2,153 | (356 | ) | 1,797 | ||||||||||||||||||||||||||
| Ulster Bank | 1,003 | 31 | 1,034 | 1,315 | (276 | ) | 1,039 | 1,422 | (435 | ) | 987 | |||||||||||||||||||||||||
| US Retail & Commercial | 2,380 | 344 | 2,724 | 2,141 | 446 | 2,587 | 1,944 | 470 | 2,414 | |||||||||||||||||||||||||||
| RBS Insurance | 4,475 | (15 | ) | 4,460 | 4,413 | 17 | 4,430 | 4,567 | 7 | 4,574 | ||||||||||||||||||||||||||
| Central items | (2,854 | ) | 3,094 | 240 | (3,841 | ) | 4,353 | 512 | (2,948 | ) | 3,501 | 553 | ||||||||||||||||||||||||
| Core | 27,555 | 4,171 | 31,726 | 18,441 | 5,190 | 23,631 | 21,167 | 3,340 | 24,507 | |||||||||||||||||||||||||||
| Non-Core | 616 | (2,917 | ) | (2,301 | ) | 1,620 | (4,652 | ) | (3,032 | ) | 7,968 | (2,941 | ) | 5,027 | ||||||||||||||||||||||
| 28,171 | 1,254 | 29,425 | 20,061 | 538 | 20,599 | 29,135 | 399 | 29,534 | ||||||||||||||||||||||||||||
| Reconciling items | ||||||||||||||||||||||||||||||||||||
| RFS Holdings minority interest | 6,597 | (1,254 | ) | 5,343 | 5,365 | (538 | ) | 4,827 | 1,231 | (399 | ) | 832 | ||||||||||||||||||||||||
| Gain on redemption of own debt | 3,790 | — | 3,790 | — | — | — | — | — | — | |||||||||||||||||||||||||||
| Strategic disposals | 132 | — | 132 | 442 | — | 442 | — | — | — | |||||||||||||||||||||||||||
| 38,690 | — | 38,690 | 25,868 | — | 25,868 | 30,366 | — | 30,366 | ||||||||||||||||||||||||||||
299
Notes on the accounts continued
38 Segmental analysis continued
| Group | ||||||||||||||||||||||||||||||||||||
| 2009 | 2008 | 2007 | ||||||||||||||||||||||||||||||||||
| Cost to | Cost to | Cost to | ||||||||||||||||||||||||||||||||||
| acquire | acquire | acquire | ||||||||||||||||||||||||||||||||||
| fixed assets | fixed assets | fixed assets | ||||||||||||||||||||||||||||||||||
| and intangible | and intangible | and intangible | ||||||||||||||||||||||||||||||||||
| Assets | Liabilities | assets | Assets | Liabilities | assets | Assets | Liabilities | assets | ||||||||||||||||||||||||||||
| £m | £m | £m | £m | £m | £m | £m | £m | £m | ||||||||||||||||||||||||||||
| UK Retail | 110,987 | 91,755 | — | 102,429 | 82,721 | 4 | 100,318 | 80,586 | 1 | |||||||||||||||||||||||||||
| UK Corporate | 114,854 | 89,306 | 598 | 120,990 | 84,076 | 1,418 | 103,332 | 68,643 | 1,467 | |||||||||||||||||||||||||||
| Wealth | 17,952 | 36,273 | 11 | 16,130 | 35,079 | 41 | 14,041 | 34,591 | 34 | |||||||||||||||||||||||||||
| Global Banking & Markets | 826,054 | 822,830 | 513 | 1,395,032 | 1,456,138 | 880 | 975,978 | 978,866 | 497 | |||||||||||||||||||||||||||
| Global Transaction Services | 18,380 | 64,684 | 17 | 22,162 | 54,259 | 7 | 21,821 | 58,148 | 8 | |||||||||||||||||||||||||||
| Ulster Bank | 44,021 | 40,597 | — | 49,107 | 47,672 | 1 | 42,453 | 44,004 | 32 | |||||||||||||||||||||||||||
| US Retail & Commercial | 75,369 | 72,407 | 179 | 88,673 | 89,254 | 204 | 67,099 | 55,874 | 171 | |||||||||||||||||||||||||||
| RBS Insurance | 11,973 | 7,775 | 33 | 11,018 | 7,510 | 61 | 10,574 | 7,036 | 92 | |||||||||||||||||||||||||||
| Central items | 82,041 | 150,739 | 804 | 70,217 | 157,331 | 1,235 | 3,054 | 72,946 | 1,001 | |||||||||||||||||||||||||||
| Core | 1,301,631 | 1,376,366 | 2,155 | 1,875,758 | 2,014,040 | 3,851 | 1,338,670 | 1,400,694 | 3,303 | |||||||||||||||||||||||||||
| Non-Core | 220,850 | 66,152 | 3,259 | 342,935 | 140,338 | 2,225 | 256,396 | 135,943 | 1,583 | |||||||||||||||||||||||||||
| 1,522,481 | 1,442,518 | 5,414 | 2,218,693 | 2,154,378 | 6,076 | 1,595,066 | 1,536,637 | 4,886 | ||||||||||||||||||||||||||||
| Reconciling item | ||||||||||||||||||||||||||||||||||||
| RFS Holdings minority interest | 174,005 | 159,337 | 296 | 182,959 | 166,776 | 174 | 245,763 | 212,766 | 675 | |||||||||||||||||||||||||||
| 1,696,486 | 1,601,855 | 5,710 | 2,401,652 | 2,321,154 | 6,250 | 1,840,829 | 1,749,403 | 5,561 | ||||||||||||||||||||||||||||
Note:
(1) Segmental results for 2008 and 2007 have been restated to reflect transfers of businesses between segments in 2009.
Segmental analysis of goodwill is as follows:
| Reportable segments | ||||||||||||||||||||||||||||||||||||||||||||
| RFS | ||||||||||||||||||||||||||||||||||||||||||||
| Global | Global | US | Holdings | |||||||||||||||||||||||||||||||||||||||||
| UK | UK | Banking | Transaction | Ulster | Retail & | RBS | Non- | minority | ||||||||||||||||||||||||||||||||||||
| Retail | Corporate | Wealth | & Markets | Services | Bank | Commercial | Insurance | Core | interest | Total | ||||||||||||||||||||||||||||||||||
| £m | £m | £m | £m | £m | £m | £m | £m | £m | £m | £m | ||||||||||||||||||||||||||||||||||
| At 1 January 2007 | 2,803 | 2,741 | 746 | 1,065 | 1,657 | 820 | 5,429 | 1,064 | 1,564 | — | 17,889 | |||||||||||||||||||||||||||||||||
Currency translation and other adjustments | — | — | 7 | 137 | 18 | 38 | (103 | ) | — | 133 | 957 | 1,187 | ||||||||||||||||||||||||||||||||
| Acquisitions | — | — | — | 2,989 | 721 | — | 66 | — | 2,677 | 17,464 | 23,917 | |||||||||||||||||||||||||||||||||
| Goodwill written off | — | — | — | — | — | — | — | — | (40 | ) | — | (40 | ) | |||||||||||||||||||||||||||||||
| At 1 January 2008 | 2,803 | 2,741 | 753 | 4,191 | 2,396 | 858 | 5,392 | 1,064 | 4,334 | 18.421 | 42,953 | |||||||||||||||||||||||||||||||||
| Transfers to disposal groups | — | — | — | — | — | — | — | — | — | (3,692 | ) | (3,692 | ) | |||||||||||||||||||||||||||||||
Currency translation and other adjustments | — | — | 56 | 879 | 685 | 133 | 2,013 | 7 | 801 | 4,336 | 8,905 | |||||||||||||||||||||||||||||||||
| Acquisitions | — | — | — | 147 | 35 | — | — | — | 342 | — | 524 | |||||||||||||||||||||||||||||||||
| Disposals | — | — | — | — | — | — | — | — | (49 | ) | (3,017 | ) | (3,066 | ) | ||||||||||||||||||||||||||||||
Write-down of goodwill | — | (46 | ) | (9 | ) | (5,179 | ) | (44 | ) | (991 | ) | (4,382 | ) | (42 | ) | (4,831 | ) | (14,538 | ) | (30,062 | ) | |||||||||||||||||||||||
| At 1 January 2009 | 2,803 | 2,695 | 800 | 38 | 3,067 | — | 3,023 | 1,029 | 597 | 1,510 | 15,562 | |||||||||||||||||||||||||||||||||
| Transfers to disposal groups | — | — | — | — | — | — | — | (238 | ) | — | (238 | ) | ||||||||||||||||||||||||||||||||
Currency translation and other adjustments | — | — | (12 | ) | (1 | ) | (233 | ) | — | (302 | ) | (8 | ) | (34 | ) | (107 | ) | (697 | ) | |||||||||||||||||||||||||
| Write-down of goodwill | — | — | — | — | — | — | (66 | ) | (297 | ) | — | (363 | ) | |||||||||||||||||||||||||||||||
| At 31 December 2009 | 2,803 | 2,695 | 788 | 37 | 2,834 | — | 2,721 | 955 | 28 | 1,403 | 14,264 | |||||||||||||||||||||||||||||||||
300
Financial statements
Notes on the accounts
(b) Geographical segments
The geographical analyses in the tables below have been compiled on the basis of location of office where the transactions are recorded.
| Group | ||||||||||||||||||||
| Rest of | ||||||||||||||||||||
| UK | USA | Europe | the World | Total | ||||||||||||||||
| 2009 | £m | £m | £m | £m | £m | |||||||||||||||
| Total revenue | 28,490 | 10,783 | 16,102 | 3,732 | 59,107 | |||||||||||||||
| Net interest income | 7,824 | 2,974 | 4,348 | 1,358 | 16,504 | |||||||||||||||
| Net fees and commissions | 3,670 | 1,589 | 1,297 | 453 | 7,009 | |||||||||||||||
| Income from trading activities | 106 | 2,470 | 636 | 669 | 3,881 | |||||||||||||||
| Other operating income/(loss) | 6,067 | 119 | (102 | ) | (332 | ) | 5,752 | |||||||||||||
| Insurance premium income (net of reinsurers’ share) | 4,872 | – | 672 | – | 5,544 | |||||||||||||||
| Total income | 22,539 | 7,152 | 6,851 | 2,148 | 38,690 | |||||||||||||||
| Operating profit/(loss) before tax | 1,856 | 97 | (3,526 | ) | (1,022 | ) | (2,595 | ) | ||||||||||||
| Total assets | 949,765 | 338,649 | 320,008 | 88,064 | 1,696,486 | |||||||||||||||
| Total liabilities | 873,716 | 322,698 | 321,133 | 84,308 | 1,601,855 | |||||||||||||||
| Net assets attributable to equity owners and minority interests | 76,049 | 15,951 | (1,125 | ) | 3,756 | 94,631 | ||||||||||||||
| Contingent liabilities and commitments | 175,392 | 93,694 | 65,026 | 17,549 | 351,661 | |||||||||||||||
| Cost to acquire property, plant and equipment and intangible assets | 1,974 | 390 | 3,252 | 94 | 5,710 | |||||||||||||||
| 2008 | ||||||||||||||||||||
| Total revenue | 23,748 | 8,518 | 21,112 | 6,023 | 59,401 | |||||||||||||||
| Net interest income | 9,853 | 2,790 | 5,018 | 1,014 | 18,675 | |||||||||||||||
| Net fees and commissions | 3,728 | 1,492 | 1,648 | 577 | 7,445 | |||||||||||||||
| (Loss)/income from trading activities | (7,103 | ) | (1,604 | ) | (552 | ) | 782 | (8,477 | ) | |||||||||||
| Other operating income/(loss) | 2,337 | 49 | (528 | ) | 41 | 1,899 | ||||||||||||||
| Insurance premium income (net of reinsurers’ share) | 5,190 | — | 1,136 | — | 6,326 | |||||||||||||||
| Total income | 14,005 | 2,727 | 6,722 | 2,414 | 25,868 | |||||||||||||||
| Operating (loss)/profit before tax | (8,158 | ) | (5,809 | ) | (26,883 | ) | 14 | (40,836 | ) | |||||||||||
| Total assets | 1,304,714 | 607,511 | 368,290 | 121,137 | 2,401,652 | |||||||||||||||
| Total liabilities | 1,253,814 | 592,272 | 361,590 | 113,478 | 2,321,154 | |||||||||||||||
| Net assets attributable to equity owners and minority interests | 50,900 | 15,239 | 6,700 | 7,659 | 80,498 | |||||||||||||||
| Contingent liabilities and commitments | 200,763 | 131,435 | 79,941 | 21,122 | 433,261 | |||||||||||||||
| Cost to acquire property, plant and equipment and intangible assets | 3,415 | 445 | 2,204 | 186 | 6,250 |
301
Notes on the accounts continued
38 Segmental analysis continued
| Group | ||||||||||||||||||||
| Rest of | ||||||||||||||||||||
| UK | USA | Europe | the World | Total | ||||||||||||||||
| 2007 | £m | £m | £m | £m | £m | |||||||||||||||
| Total revenue | 33,743 | 8,570 | 8,140 | 2,578 | 53,031 | |||||||||||||||
| Net interest income | 8,350 | 2,054 | 1,510 | 155 | 12,069 | |||||||||||||||
| Net fees and commissions | 3,933 | 1,176 | 560 | 416 | 6,085 | |||||||||||||||
| Income/(loss) from trading activities | 1,252 | (486 | ) | 348 | 178 | 1,292 | ||||||||||||||
| Other operating income | 3,844 | 260 | 587 | 142 | 4,833 | |||||||||||||||
| Insurance premium income (net of reinsurers’ share) | 5,562 | — | 525 | — | 6,087 | |||||||||||||||
| Total income | 22,941 | 3,004 | 3,530 | 891 | 30,366 | |||||||||||||||
| Operating profit before tax | 7,761 | 719 | 1,136 | 216 | 9,832 | |||||||||||||||
| Total assets | 938,064 | 340,170 | 422,058 | 140,537 | 1,840,829 | |||||||||||||||
| Total liabilities | 902,340 | 326,499 | 392,362 | 128,202 | 1,749,403 | |||||||||||||||
| Net assets attributable to equity owners and minority interests | 35,724 | 13,671 | 29,696 | 12,335 | 91,426 | |||||||||||||||
| Contingent liabilities and commitments | 197,637 | 95,547 | 82,316 | 24,599 | 400,099 | |||||||||||||||
| Cost to acquire property, plant and equipment and intangible assets | 3,305 | 238 | 1,793 | 225 | 5,561 | |||||||||||||||
39 Directors’ and key management remuneration
| Group | |||||||||
| Directors’ remuneration | | 2009 £000 | 2008 £000 | ||||||
| Non-executive directors – emoluments | 823 | 1,408 | |||||||
| Chairmen and executive directors | – emoluments | 4,971 | 7,132 | ||||||
| – contributions and allowances in respect of defined | |||||||||
| contribution pension schemes | — | 3 | |||||||
| 5,794 | 8,543 | ||||||||
| – amounts receivable under long-term incentive plans | 1,103 | 646 | |||||||
| – gains on exercise of share options | — | 77 | |||||||
| 6,897 | 9,266 | ||||||||
Retirement benefits are accruing to one director (2008 – one) under defined benefit schemes. No directors (2008 – nil) are accruing benefits under defined contribution schemes.
The executive directors may also participate in the company’s executive share option and sharesave schemes and details of their interests in the company’s shares arising from their participation are given on page 189. Details of the remuneration received by each director during the year and each director’s pension arrangements are given on pages 188 to 192.
Compensation of key management
The aggregate remuneration of directors and other members of key management during the year was as follows:
| Group | ||||||||
| 2009 | 2008 | |||||||
| £000 | £000 | |||||||
| Short-term benefits | 29,292 | 16,813 | ||||||
| Post-employment benefits | 9,781 | 13,174 | ||||||
| Other long-term benefits | — | 496 | ||||||
| Termination benefits | — | 345 | ||||||
| Share-based payments | 8,953 | 2,078 | ||||||
| 48,026 | 32,906 | |||||||
302
Financial statements
Notes on the accounts
40 Transactions with directors and key management
| (a) | At 31 December 2009, the amounts outstanding in relation to transactions, arrangements and agreements entered into by authorised institutions in the Group, as defined in UK legislation, were £3,596,978 in respect of loans to 15 persons who were directors of the company at any time during the financial period. |
| (b) | For the purposes of IAS 24 ‘Related Party Disclosures’, key management comprise directors of the company and members of the Group Management Committee. The captions in the Group’s primary financial statements include the following amounts attributable, in aggregate, to key management: |
2009 £000 | 2008 £000 | |||||||
| Loans and advances to customers | 11,196 | 4,217 | ||||||
| Customer accounts | 11,713 | 9,572 | ||||||
Key management have banking relationships with Group entities which are entered into in the normal course of business and on substantially the same terms, including interest rates and security, as for comparable transactions with other persons of a similar standing or, where applicable, with other employees. These transactions did not involve more than the normal risk of repayment or present other unfavourable features.
Key management had no reportable transactions or balances with the company except for dividends.
41 Related parties
UK Government
On 1 December 2008, the UK Government through HM Treasury became the ultimate controlling party of The Royal Bank of Scotland Group plc. The UK Government’s shareholding is managed by UK Financial Investments Limited, a company wholly owned by the UK Government. As a result the UK Government and UK Government controlled bodies became related parties of the Group.
The Group enters into transactions with many of these bodies on an arms' length basis. The principal transactions during 2009 were: in April 2009, the redemption of its non-cumulative sterling preference shares and the placing and open offer underwritten by HM Treasury and in December 2009 the issue of B shares to HM Treasury (see Note 27); as well as the Asset Protection Scheme, Bank of England facilities and the issue of debt guaranteed by the UK Government described below. Other transactions include the payment of: taxes including UK corporation tax and value added tax; national insurance contributions; local authority rates; and regulatory fees and levies; together with banking transactions such as loans and deposits undertaken in the normal course of banker-customer relationships. The volume and diversity of these transactions are such that disclosure of their amounts is impractical.
As at 31 December 2009 and 2008 balances with the UK Government and UK Government controlled bodies were:
| 2009 | 2008 | |||||||||||||||||||||||||||||||
| Central | Banks, financial | Central | Banks, financial | |||||||||||||||||||||||||||||
| government | corporations | government | corporations | |||||||||||||||||||||||||||||
| (including the | Local | and public | 2009 | (including the | Local | and public | 2008 | |||||||||||||||||||||||||
| Bank of England) | government | corporations | Total | Bank of England) | government | corporations | Total | |||||||||||||||||||||||||
| £m | £m | £m | £m | £m | £m | £m | £m | |||||||||||||||||||||||||
| Assets | ||||||||||||||||||||||||||||||||
| Balances at central banks | 16,617 | — | — | 16,617 | 393 | — | — | 393 | ||||||||||||||||||||||||
| Loans and advances to banks | — | — | 664 | 664 | — | — | 1,081 | 1,081 | ||||||||||||||||||||||||
| Loans and advances to customers | 53 | 1,231 | 340 | 1,624 | 5 | 721 | 468 | 1,194 | ||||||||||||||||||||||||
| Debt securities | 19,681 | — | 100 | 19,781 | 21,628 | — | 113 | 21,741 | ||||||||||||||||||||||||
| Derivatives | 204 | 62 | 7 | 273 | 1,286 | 64 | 17 | 1,367 | ||||||||||||||||||||||||
| Other | 4,514 | — | 3 | 4,517 | 249 | — | — | 249 | ||||||||||||||||||||||||
| Liabilities | ||||||||||||||||||||||||||||||||
| Deposits by banks | — | — | 436 | 436 | 26,541 | — | 633 | 27,174 | ||||||||||||||||||||||||
| Customer accounts | 1,480 | 3,646 | 668 | 5,794 | 1,536 | 3,320 | 598 | 5,454 | ||||||||||||||||||||||||
| Derivatives | 156 | 39 | 628 | 823 | 276 | 78 | 29 | 383 | ||||||||||||||||||||||||
| Other | 118 | — | — | 118 | 176 | — | — | 176 | ||||||||||||||||||||||||
No impairment losses were recognised by the Group in 2009 or 2008 in respect of balances with UK Government and UK Government controlled bodies.
Notes:
| (1) | In addition to UK Government’s shareholding in the Group, the UK Government and UK Government controlled bodies may hold debt securities, subordinated liabilities and other liabilities or shares issued by the Group in the normal course of their business. It is not practicable to ascertain and disclose these amounts. |
| (2) | Certain of the liability balances are secured. |
303
Notes on the accounts continued
41 Related parties continued
Asset protection scheme
On 22 December 2009, the Group entered into an agreement (the Asset Protection Scheme (APS)) with HM Treasury (HMT), acting on behalf of the UK Government, under which the Group purchased credit protection over a portfolio of specified assets and exposures (covered assets) from HMT. The portfolio of covered assets has a par value of £282 billion. The protection is subject to a first loss of £60 billion and covers 90% of subsequent losses. Once the first loss has been exhausted, losses and recoveries in respect of assets for which a trigger event – failure to pay, bankruptcy or restructuring – has occurred are included in the balance receivable under the APS. Receipts from HMT will, over time, amount to 90% of cumulative losses (net of 90% of cumulative recoveries) on the portfolio of covered assets less the first loss amount. The Group has a right to terminate the APS at any time provided that the Financial Services Authority has confirmed in writing to HMT that it has no objection to the proposed termination. On termination the Group must pay HMT the higher of the regulatory capital relief received and £2.5 billion less premiums paid plus the aggregate of amounts received from the UK Government under the APS. In consideration for the protection provided by the APS, the Group paid an initial premium of £1,400 million on 31 December 2009. A further premium of £700 million is payable on 31 December 2010 and subsequently annual premiums of £500 million until the earlier of 2099 and the termination of the agreement.
The APS is a single contract providing credit protection in respect of a portfolio of financial assets. Under IFRS, credit protection is treated either as a financial guarantee contract or as a derivative financial instrument depending on the terms of the agreement and the nature of the protected assets and exposures. The Group has concluded, principally because the covered portfolio includes significant exposure in the form of derivatives, that the APS does not meet the criteria to be treated as a financial guarantee contract. The contract has therefore been accounted for as a derivative financial instrument: it was recognised initially and measured subsequently at fair value with changes in fair value recognised in profit or loss. There is no change in the recognition and measurement of the covered assets as a result of the APS. Impairment provisions on covered assets measured at amortised cost are assessed and charged in accordance with the Group’s accounting policy; held-for-trading assets, assets designated at fair value and available-for-sale assets within the APS portfolio continue to be measured at fair value with no adjustments to reflect the protection provided by the APS. There is no change in how gains and losses on the covered assets are recognised in the income statement or in other comprehensive income.
The Group also participates in a number of schemes operated by the Bank of England and the UK Government and made available to eligible banks and building societies.
Bank of England facilities include:
| • | Open market operations – these provide market participants with funding at market rates on a tender basis in the form of short and long-term repos on a wide range of collateral and outright purchases of high-quality bonds to enable them to meet the reserves that they must hold at the Bank of England. |
| • | US dollar repo operations – these commenced in September 2008 taking the form of an auction. Eligible collateral consists of securities routinely eligible in the Bank of England’s short-term repo open market operations together with conventional US Treasuries. |
| • | The special liquidity scheme – this was launched in April 2008 to allow financial institutions to swap temporarily illiquid assets for treasury bills, with fees charged based on the spread between 3-month LIBOR and the 3-month gilt repo rate. The scheme will operate for up to three years after the end of the drawdown period (30 January 2009) at the Bank of England’s discretion. |
As at 31 December 2009, the Group’s utilisation of these facilities amounted to £21.4 billion (2008 – £41.8 billion).
Government credit guarantee scheme – announced in October 2008, the scheme provides a guarantee on eligible new debt issued by qualifying institutions for a fee. The fee, payable to HM Treasury on guaranteed issues is based on a per annum rate of 50 basis points plus 100% of the institution’s median five-year Credit Default Swap (CDS) spread during the twelve months to 7 July 2008.
As at 31 December 2009, the Group had obtained funding from the Bank of England and issued debt guaranteed by the Government totalling £51.5 billion (2008 – £32.2 billion)
Other related parties
| (a) | In their roles as providers of finance, Group companies provide development and other types of capital support to businesses. These investments are made in the normal course of business and on arm’s-length terms. In some instances, the investment may extend to ownership or control over 20% or more of the voting rights of the investee company. However, these investments are not considered to give rise to transactions of a materiality requiring disclosure under IAS 24. |
| (b) | The Group recharges The Royal Bank of Scotland Group Pension Fund with the cost of administration services incurred by it. The amounts involved are not material to the Group. |
| (c) | In accordance with IAS 24, transactions or balances between Group entities that have been eliminated on consolidation are not reported. |
| (d) | The captions in the primary financial statements of the parent company include amounts attributable to subsidiaries. These amounts have been disclosed in aggregate in the relevant notes to the financial statements. |
42 Post balance sheet events
There have been no significant events between the year end and the date of approval of these accounts which would require a change to or disclosure in the accounts.
304
43 Consolidating financial information
The Royal Bank of Scotland plc ('RBS plc') is a wholly owned subsidiary of The Royal Bank of Scotland Group plc ('RBSG plc') and is able to offer and sell certain securities in the US from time to time pursuant to a registration statement on Form F-3 filed with the SEC with a full and unconditional guarantee from RBSG plc.
RBS plc utilises an exception provided in Rule 3-10 of Regulation S-X, and therefore does not file its financial statements with the SEC. In accordance with the requirements to qualify for the exception, presented below is condensed consolidating financial information for:
- RBSG plc on a stand-alone basis as guarantor ('RBSG Company');
- RBS plc on a stand-alone basis as issuer ('RBS Company');
- Non-guarantor subsidiaries of RBSG Company and RBS Company on a combined basis ('Subsidiaries');
- Consolidation adjustments; and
- RBSG plc consolidated amounts ('RBSG Group').
Under IAS 27, RBSG Company and RBS Company account for investments in their subsidiary undertakings at cost less impairment. Rule 3-10 of Regulation S-X requires a company to account for its investments in subsidiary undertakings using the equity method, which would increase/(decrease) the results for the period of RBSG Company and RBS Company in the information below by £(1,169) million and £825 million for the year ended 31 December 2009; £(14,108) million and £(7,610) million for the year ended 31 December 2008; £5,050 million and £(56) million for the year ended 31 December 2007. The net assets of RBSG Company and RBS Company in the information below would also be increased by £12,154 million and £9,533 million at 31 December 2009; £14,721 million and £11,913 million at 31 December 2008 and £28,161 million and £16,594 million at 31 December 2007.
CONSOLIDATING FINANCIAL INFORMATION
INCOME STATEMENTS
| RBSG | RBS | Consolidation | RBSG | |||||||||||||||||
| Company | Company | Subsidiaries | adjustments | Group | ||||||||||||||||
| For the year ended 31 December 2009 | £m | £m | £m | £m | £m | |||||||||||||||
| Net interest income | 313 | 3,776 | 12,831 | (416 | ) | 16,504 | ||||||||||||||
| Non-interest income (excluding insurance net premium income) | (1,572 | ) | 7,079 | 7,931 | 3,204 | 16,642 | ||||||||||||||
| Insurance net premium income | - | - | 5,544 | - | 5,544 | |||||||||||||||
| Total income | (1,259 | ) | 10,855 | 26,306 | 2,788 | 38,690 | ||||||||||||||
| Operating expenses | (27 | ) | (6,073 | ) | (14,429 | ) | (949 | ) | (21,478 | ) | ||||||||||
| Insurance net claims | - | - | (4,857 | ) | - | (4,857 | ) | |||||||||||||
| Impairment losses | - | (5,924 | ) | (9,061 | ) | 35 | (14,950 | ) | ||||||||||||
| Operating (loss) / profit before tax | (1,286 | ) | (1,142 | ) | (2,041 | ) | 1,874 | (2,595 | ) | |||||||||||
| Tax | (217 | ) | 602 | 446 | (460 | ) | 371 | |||||||||||||
| (Loss) / profit from continuing operations | (1,503 | ) | (540 | ) | (1,595 | ) | 1,414 | (2,224 | ) | |||||||||||
| Loss from discontinued operations, net of tax | - | - | (99 | ) | - | (99 | ) | |||||||||||||
| (Loss) / profit for the period | (1,503 | ) | (540 | ) | (1,694 | ) | 1,414 | (2,323 | ) | |||||||||||
| RBSG | RBS | Consolidation | RBSG | |||||||||||||||||
| Company | Company | Subsidiaries | adjustments | Group | ||||||||||||||||
| For the year ended 31 December 2008 | £m | £m | £m | £m | £m | |||||||||||||||
| Net interest income | (680 | ) | 4,742 | 14,591 | 22 | 18,675 | ||||||||||||||
| Non-interest income (excluding insurance net premium income) | (9,311 | ) | 1,379 | (2,444 | ) | 11,243 | 867 | |||||||||||||
| Insurance net premium income | - | - | 6,326 | - | 6,326 | |||||||||||||||
| Total income | (9,991 | ) | 6,121 | 18,473 | 11,265 | 25,868 | ||||||||||||||
| Operating expenses | (26 | ) | (6,487 | ) | (45,157 | ) | (2,532 | ) | (54,202 | ) | ||||||||||
| Insurance net claims | - | - | (4,430 | ) | - | (4,430 | ) | |||||||||||||
| Impairment losses | - | (2,007 | ) | (5,857 | ) | (208 | ) | (8,072 | ) | |||||||||||
Operating (loss) / profit before tax | (10,017 | ) | (2,373 | ) | (36,971 | ) | 8,525 | (40,836 | ) | |||||||||||
| Tax | 415 | 1,064 | 1,721 | (877 | ) | 2,323 | ||||||||||||||
(Loss) / profit from continuing operations | (9,602 | ) | (1,309 | ) | (35,250 | ) | 7,648 | (38,513 | ) | |||||||||||
| Profit from discontinued operations, net of tax | - | - | 3,971 | - | 3,971 | |||||||||||||||
(Loss) / profit for the year | (9,602 | ) | (1,309 | ) | (31,279 | ) | 7,648 | (34,542 | ) | |||||||||||
305
| RBSG | RBS | Consolidation | RBSG | |||||||||||||||||
| Company | Company | Subsidiaries | adjustments | Group | ||||||||||||||||
| For the year ended 31 December 2007 | £m | £m | £m | £m | £m | |||||||||||||||
| Net interest income | (343 | ) | 3,000 | 9,350 | 62 | 12,069 | ||||||||||||||
| Non-interest income (excluding insurance net premium income) | 2,716 | 11,088 | 6,731 | (8,325 | ) | 12,210 | ||||||||||||||
| Insurance net premium income | - | - | 6,087 | - | 6,087 | |||||||||||||||
| Total income | 2,373 | 14,088 | 22,168 | (8,263 | ) | 30,366 | ||||||||||||||
| Operating expenses | (1 | ) | (5,856 | ) | (8,308 | ) | 223 | (13,942 | ) | |||||||||||
| Insurance net claims | - | - | (4,624 | ) | - | (4,624 | ) | |||||||||||||
| Impairment losses | - | (473 | ) | (1,495 | ) | - | (1,968 | ) | ||||||||||||
| Operating profit/(loss) before tax | 2,372 | 7,759 | 7,741 | (8,040 | ) | 9,832 | ||||||||||||||
| Tax | 127 | (504 | ) | (1,591 | ) | (76 | ) | (2,044 | ) | |||||||||||
| Profit/(loss) from continuing operations | 2,499 | 7,255 | 6,150 | (8,116 | ) | 7,788 | ||||||||||||||
| Loss from discontinued operations, net of tax | - | - | (76 | ) | - | (76 | ) | |||||||||||||
| Profit/(loss) for the year | 2,499 | 7,255 | 6,074 | (8,116 | ) | 7,712 | ||||||||||||||
306
| Balance Sheets |
| RBSG | RBS | Consolidation | RBSG | |||||||||||||||||
| Company | Company | Subsidiaries | adjustments | Group | ||||||||||||||||
| At 31 December 2009 | £m | £m | £m | £m | £m | |||||||||||||||
| Assets | ||||||||||||||||||||
| Cash and balances at central banks | - | 21,099 | 31,162 | - | 52,261 | |||||||||||||||
| Loans and advances to banks | 31,238 | 77,365 | 305,163 | (322,013 | ) | 91,753 | ||||||||||||||
| Loans and advances to customers | 2,777 | 338,548 | 510,117 | (123,049 | ) | 728,393 | ||||||||||||||
| Debt securities | 1,286 | 214,598 | 141,004 | (89,634 | ) | 267,254 | ||||||||||||||
| Equity shares | - | 1,025 | 19,265 | (762 | ) | 19,528 | ||||||||||||||
| Investments in Group undertakings | 64,766 | 29,385 | 12,282 | (106,433 | ) | - | ||||||||||||||
| Settlement balances | 11 | 4,159 | 7,863 | - | 12,033 | |||||||||||||||
| Derivatives | 1,169 | 450,913 | 63,856 | (74,484 | ) | 441,454 | ||||||||||||||
| Intangible assets | - | 210 | 10,986 | 6,651 | 17,847 | |||||||||||||||
| Property, plant and equipment | - | 2,447 | 16,945 | 5 | 19,397 | |||||||||||||||
| Deferred taxation | 2 | 1,728 | 5,391 | (82 | ) | 7,039 | ||||||||||||||
| Prepayments, accrued income and other assets | 43 | 9,988 | 12,780 | (1,826 | ) | 20,985 | ||||||||||||||
| Assets of disposal groups | - | 7,150 | 11,392 | - | 18,542 | |||||||||||||||
| Total assets | 101,292 | 1,158,615 | 1,148,206 | (711,627 | ) | 1,696,486 | ||||||||||||||
| Liabilities | ||||||||||||||||||||
| Deposits by banks | 93 | 188,548 | 203,497 | (249,994 | ) | 142,144 | ||||||||||||||
| Customer accounts | 13,264 | 289,792 | 487,290 | (176,144 | ) | 614,202 | ||||||||||||||
| Debt securities in issue | 11,788 | 129,814 | 212,737 | (86,771 | ) | 267,568 | ||||||||||||||
| Settlement balances and short positions | - | 28,352 | 25,671 | (3,147 | ) | 50,876 | ||||||||||||||
| Derivatives | 446 | 430,005 | 68,174 | (74,484 | ) | 424,141 | ||||||||||||||
| Accruals, deferred income and other liabilities | 1,357 | 9,949 | 21,025 | (2,004 | ) | 30,327 | ||||||||||||||
| Retirement benefit liabilities | - | 16 | 1,057 | 1,890 | 2,963 | |||||||||||||||
| Deferred taxation | - | - | 3,340 | (529 | ) | 2,811 | ||||||||||||||
| Insurance liabilities | - | - | 10,281 | - | 10,281 | |||||||||||||||
| Subordinated liabilities | 8,762 | 30,513 | 18,428 | (20,051 | ) | 37,652 | ||||||||||||||
| Liabilities of disposal groups | - | 6,108 | 12,782 | - | 18,890 | |||||||||||||||
| Total liabilities | 35,710 | 1,113,097 | 1,064,282 | (611,234 | ) | 1,601,855 | ||||||||||||||
| Minority interests | - | - | 2,166 | 14,729 | 16,895 | |||||||||||||||
| Equity owners | 65,582 | 45,518 | 81,758 | (115,122 | ) | 77,736 | ||||||||||||||
| Total equity | 65,582 | 45,518 | 83,924 | (100,393 | ) | 94,631 | ||||||||||||||
| Total liabilities and equity | 101,292 | 1,158,615 | 1,148,206 | (711,627 | ) | 1,696,486 | ||||||||||||||
| RBSG | RBS | Consolidation | RBSG | |||||||||||||||||
| Company | Company | Subsidiaries | adjustments | Group | ||||||||||||||||
| At 31 December 2008 | £m | £m | £m | £m | £m | |||||||||||||||
| Assets | ||||||||||||||||||||
| Cash and balances at central banks | - | 3,714 | 8,686 | - | 12,400 | |||||||||||||||
| Loans and advances to banks | 27,031 | 91,717 | 222,172 | (202,723 | ) | 138,197 | ||||||||||||||
| Loans and advances to customers | - | 327,040 | 596,306 | (48,624 | ) | 874,722 | ||||||||||||||
| Debt securities | - | 159,698 | 151,004 | (43,153 | ) | 267,549 | ||||||||||||||
| Equity shares | - | 1,020 | 26,063 | (753 | ) | 26,330 | ||||||||||||||
| Investments in Group undertakings | 42,196 | 26,814 | 11,166 | (80,176 | ) | - | ||||||||||||||
| Settlement balances | - | 5,335 | 12,497 | - | 17,832 | |||||||||||||||
| Derivatives | 1,168 | 938,505 | 187,009 | (134,123 | ) | 992,559 | ||||||||||||||
| Intangible assets | - | 136 | 13,132 | 6,781 | 20,049 | |||||||||||||||
| Property, plant and equipment | - | 2,368 | 16,450 | 131 | 18,949 | |||||||||||||||
| Deferred taxation | 3 | 1,323 | 4,745 | 1,011 | 7,082 | |||||||||||||||
| Prepayments, accrued income and other assets | 489 | 5,930 | 18,423 | (440 | ) | 24,402 | ||||||||||||||
| Assets of disposal groups | - | - | 1,581 | - | 1,581 | |||||||||||||||
| Total assets | 70,887 | 1,563,600 | 1,269,234 | (502,069 | ) | 2,401,652 | ||||||||||||||
| Liabilities | ||||||||||||||||||||
| Deposits by banks | 1,802 | 201,266 | 205,036 | (150,060 | ) | 258,044 | ||||||||||||||
| Customer accounts | 26 | 229,266 | 496,037 | (85,817 | ) | 639,512 | ||||||||||||||
| Debt securities in issue | 14,179 | 115,149 | 213,859 | (42,898 | ) | 300,289 | ||||||||||||||
| Settlement balances and short positions | - | 29,361 | 25,258 | (342 | ) | 54,277 | ||||||||||||||
| Derivatives | 361 | 911,174 | 193,952 | (134,123 | ) | 971,364 | ||||||||||||||
| Accruals, deferred income and other liabilities | 47 | 9,618 | 22,491 | (674 | ) | 31,482 | ||||||||||||||
| Retirement benefit liabilities | - | 23 | 2,006 | 3 | 2,032 | |||||||||||||||
| Deferred taxation | - | - | 2,892 | 1,273 | 4,165 | |||||||||||||||
| Insurance liabilities | - | - | 9,976 | - | 9,976 | |||||||||||||||
| Subordinated liabilities | 10,314 | 33,698 | 23,455 | (18,313 | ) | 49,154 | ||||||||||||||
| Liabilities of disposal groups | - | - | 859 | - | 859 | |||||||||||||||
| Total liabilities | 26,729 | 1,529,555 | 1,195,821 | (430,951 | ) | 2,321,154 | ||||||||||||||
| Minority interests | - | - | 2,041 | 19,578 | 21,619 | |||||||||||||||
| Equity owners | 44,158 | 34,045 | 71,372 | (90,696 | ) | 58,879 | ||||||||||||||
| Total equity | 44,158 | 34,045 | 73,413 | (71,118 | ) | 80,498 | ||||||||||||||
| Total liabilities and equity | 70,887 | 1,563,600 | 1,269,234 | (502,069 | ) | 2,401,652 | ||||||||||||||
307
| RBSG | RBS | Consolidation | RBSG | |||||||||||||||||
| Company | Company | Subsidiaries | adjustments | Group | ||||||||||||||||
| At 31 December 2007 | £m | £m | £m | £m | £m | |||||||||||||||
| Assets | ||||||||||||||||||||
| Cash and balances at central banks | - | 3,333 | 14,533 | - | 17,866 | |||||||||||||||
| Loans and advances to banks | 7,686 | 91,982 | 289,000 | (169,208 | ) | 219,460 | ||||||||||||||
| Loans and advances to customers | 307 | 329,147 | 577,329 | (78,245 | ) | 828,538 | ||||||||||||||
| Debt securities | - | 107,250 | 189,302 | (1,896 | ) | 294,656 | ||||||||||||||
| Equity shares | - | 4,019 | 49,861 | (854 | ) | 53,026 | ||||||||||||||
| Investments in Group undertakings | 43,542 | 22,210 | 11,172 | (76,924 | ) | - | ||||||||||||||
| Settlement balances | - | 2,046 | 14,543 | - | 16,589 | |||||||||||||||
| Derivatives | 173 | 207,913 | 81,681 | (12,365 | ) | 277,402 | ||||||||||||||
| Intangible assets | - | 295 | 40,063 | 9,558 | 49,916 | |||||||||||||||
| Property, plant and equipment | - | 2,116 | 16,435 | 194 | 18,745 | |||||||||||||||
| Deferred taxation | - | 319 | 3,400 | (600 | ) | 3,119 | ||||||||||||||
| Prepayments, accrued income and other assets | 127 | 1,680 | 14,144 | (289 | ) | 15,662 | ||||||||||||||
| Assets of disposal groups | - | - | 45,850 | - | 45,850 | |||||||||||||||
| Total assets | 51,835 | 772,310 | 1,347,313 | (330,629 | ) | 1,840,829 | ||||||||||||||
| Liabilities | ||||||||||||||||||||
| Deposits by banks | 5,572 | 196,968 | 291,098 | (181,344 | ) | 312,294 | ||||||||||||||
| Customer accounts | - | 197,926 | 539,666 | (55,229 | ) | 682,363 | ||||||||||||||
| Debt securities in issue | 13,453 | 79,877 | 182,708 | (1,866 | ) | 274,172 | ||||||||||||||
| Settlement balances and short positions | - | 33,677 | 57,344 | - | 91,021 | |||||||||||||||
| Derivatives | 179 | 204,234 | 80,004 | (12,365 | ) | 272,052 | ||||||||||||||
| Accruals, deferred income and other liabilities | 8 | 5,783 | 29,517 | (1,100 | ) | 34,208 | ||||||||||||||
| Retirement benefit liabilities | - | 11 | 1,490 | (1,041 | ) | 460 | ||||||||||||||
| Deferred taxation | 3 | - | 5,065 | 332 | 5,400 | |||||||||||||||
| Insurance liabilities | - | - | 10,162 | - | 10,162 | |||||||||||||||
| Subordinated liabilities | 7,743 | 22,745 | 19,208 | (11,653 | ) | 38,043 | ||||||||||||||
| Liabilities of disposal groups | - | - | 29,228 | - | 29,228 | |||||||||||||||
| Total liabilities | 26,958 | 741,221 | 1,245,490 | (264,266 | ) | 1,749,403 | ||||||||||||||
| Minority interests | - | - | 3,195 | 35,193 | 38,388 | |||||||||||||||
| Equity owners | 24,877 | 31,089 | 98,628 | (101,556 | ) | 53,038 | ||||||||||||||
| Total equity | 24,877 | 31,089 | 101,823 | (66,363 | ) | 91,426 | ||||||||||||||
| Total liabilities and equity | 51,835 | 772,310 | 1,347,313 | (330,629 | ) | 1,840,829 | ||||||||||||||
308
| Cash Flow Statements |
| RBSG | RBS | Consolidation | RBSG | |||||||||||||||||
| Company | Company | Subsidiaries | adjustments | Group | ||||||||||||||||
| For the year ended 31 December 2009 | £m | £m | £m | £m | £m | |||||||||||||||
| Net cash flows from operating activities | 16,365 | 49,844 | 1,887 | (69,088 | ) | (992 | ) | |||||||||||||
| Net cash flows from investing activities | (15,720 | ) | (53,061 | ) | 50,103 | 18,732 | 54 | |||||||||||||
| Net cash flows from financing activities | 10,817 | 12,246 | 15,752 | (20,024 | ) | 18,791 | ||||||||||||||
| Effects of exchange rate changes on cash and cash equivalents | (83 | ) | (3,762 | ) | (7,356 | ) | 2,609 | (8,592 | ) | |||||||||||
| Net increase/(decrease) in cash and cash equivalents | 11,379 | 5,267 | 60,386 | (67,771 | ) | 9,261 | ||||||||||||||
| Cash and cash equivalents at the beginning of the period | 5,069 | 73,449 | 114,527 | (58,120 | ) | 134,925 | ||||||||||||||
| Cash and cash equivalents at the end of the period | 16,448 | 78,716 | 174,913 | (125,891 | ) | 144,186 | ||||||||||||||
| RBSG | RBS | Consolidation | RBSG | |||||||||||||||||
| Company | Company | Subsidiaries | adjustments | Group | ||||||||||||||||
| For the year ended 31 December 2008 | £m | £m | £m | £m | £m | |||||||||||||||
| Net cash flows from operating activities | (16,032 | ) | 29,425 | (100,181 | ) | 11,450 | (75,338 | ) | ||||||||||||
| Net cash flows from investing activities | (9,649 | ) | (54,131 | ) | 63,614 | 17,163 | 16,997 | |||||||||||||
| Net cash flows from financing activities | 28,416 | 8,057 | (9,659 | ) | (11,712 | ) | 15,102 | |||||||||||||
| Effects of exchange rate changes on cash and cash equivalents | 761 | 12,849 | 23,452 | (7,853 | ) | 29,209 | ||||||||||||||
| Net increase/(decrease) in cash and cash equivalents | 3,496 | (3,800 | ) | (22,774 | ) | 9,048 | (14,030 | ) | ||||||||||||
| Cash and cash equivalents at the beginning of the period | 1,573 | 77,249 | 137,301 | (67,168 | ) | 148,955 | ||||||||||||||
| Cash and cash equivalents at the end of the period | 5,069 | 73,449 | 114,527 | (58,120 | ) | 134,925 | ||||||||||||||
| RBSG | RBS | Consolidation | RBSG | |||||||||||||||||
| Company | Company | Subsidiaries | adjustments | Group | ||||||||||||||||
| For the year ended 31 December 2007 | £m | £m | £m | £m | £m | |||||||||||||||
| Net cash flows from operating activities | 18,353 | 14,876 | 13,654 | (21,279 | ) | 25,604 | ||||||||||||||
| Net cash flows from investing activities | (18,035 | ) | (3,640 | ) | 19,353 | 18,321 | 15,999 | |||||||||||||
| Net cash flows from financing activities | 536 | (174 | ) | 44,725 | (15,396 | ) | 29,691 | |||||||||||||
| Effects of exchange rate changes on cash and cash equivalents | 62 | 2,601 | 3,724 | (377 | ) | 6,010 | ||||||||||||||
| Net increase/(decrease) in cash and cash equivalents | 916 | 13,663 | 81,456 | (18,731 | ) | 77,304 | ||||||||||||||
| Cash and cash equivalents at the beginning of the period | 657 | 63,586 | 55,845 | (48,437 | ) | 71,651 | ||||||||||||||
| Cash and cash equivalents at the end of the period | 1,573 | 77,249 | 137,301 | (67,168 | ) | 148,955 | ||||||||||||||
309
Additional information
Contents
| 311 | Financial summary |
| 320 | Exchange rates |
| 321 | Economic and monetary environment |
| 322 | Supervision |
| 322 | Regulatory developments and reviews |
| 323 | Description of property and equipment |
| 324 | Major shareholders |
| 324 | Material contracts |
| 330 | ADR payment information |
310
Additional information
Financial summary
The Group’s financial statements are prepared in accordance with IFRS. Selected data under IFRS for each of the five years ended 31 December 2009 are presented on pages 311 to 320.
The dollar financial information included below has been converted from sterling at a rate of £1.00 to US$1.6167, being the Noon Buying Rate on 31 December 2009.
| Summary consolidated income statement | ||||||||||||||||||||||||
| 2009 $m | 2009 £m | 2008 £m | 2007 £m | 2006 £m | 2005 £m | |||||||||||||||||||
| Net interest income | 26,682 | 16,504 | 18,675 | 12,069 | 10,596 | 9,918 | ||||||||||||||||||
Non-interest income (1, 2) | 35,868 | 22,186 | 7,193 | 18,297 | 17,406 | 15,984 | ||||||||||||||||||
| Total income | 62,550 | 38,690 | 25,868 | 30,366 | 28,002 | 25,902 | ||||||||||||||||||
Operating expenses (3, 4, 5, 6, 7) | (34,723 | ) | (21,478 | ) | (54,202 | ) | (13,942 | ) | (12,480 | ) | (11,946 | ) | ||||||||||||
| Profit/(loss) before other operating charges and impairment losses | 27,827 | 17,212 | (28,334 | ) | 16,424 | 15,522 | 13,956 | |||||||||||||||||
| Insurance net claims | (7,852 | ) | (4,857 | ) | (4,430 | ) | (4,624 | ) | (4,458 | ) | (4,313 | ) | ||||||||||||
| Impairment | (24,170 | ) | (14,950 | ) | (8,072 | ) | (1,968 | ) | (1,878 | ) | (1,707 | ) | ||||||||||||
| Operating (loss)/profit before tax | (4,195 | ) | (2,595 | ) | (40,836 | ) | 9,832 | 9,186 | 7,936 | |||||||||||||||
| Tax | 600 | 371 | 2,323 | (2,044 | ) | (2,689 | ) | (2,378 | ) | |||||||||||||||
| (Loss)/profit from continuing operations | (3,595 | ) | (2,224 | ) | (38,513 | ) | 7,788 | 6,497 | 5,558 | |||||||||||||||
| (Loss)/profit from discontinued operations, net of tax | (160 | ) | (99 | ) | 3,971 | (76 | ) | — | — | |||||||||||||||
| (Loss)/profit for the year | (3,755 | ) | (2,323 | ) | (34,542 | ) | 7,712 | 6,497 | 5,558 | |||||||||||||||
| (Loss)/profit attributable to: | ||||||||||||||||||||||||
| Minority interests | 564 | 349 | (10,832 | ) | 163 | 104 | 57 | |||||||||||||||||
| Preference shareholders | 1,420 | 878 | 536 | 246 | 191 | 109 | ||||||||||||||||||
| Paid-in equity holders | 92 | 57 | 60 | — | — | — | ||||||||||||||||||
| Ordinary and B shareholders | (5,831 | ) | (3,607 | ) | (24,306 | ) | 7,303 | 6,202 | 5,392 | |||||||||||||||
Notes:
| (1) | Includes gains on strategic disposals of £132 million in 2009 (2008 – £442 million; 2007 and 2006 – nil; 2005 – £333 million). |
| (2) | Includes gain on redemption of own debt of £3,790 million in 2009. |
| (3) | Includes loss on sale of subsidiaries of £93 million in 2005. |
| (4) | Includes integration and restructuring costs of £1,286 million in 2009 (2008 – £1,357 million; 2007 – £108 million; 2006 – £134 million; 2005 – £458 million). |
| (5) | Includes purchased intangibles amortisation of £607 million in 2009 (2008 – £919 million; 2007 – £234 million; 2006 – £94 million; 2005 – £97 million). |
| (6) | Includes write-down of goodwill and other intangibles assets of £363 million in 2009 (2008 – £32,581 million). |
| (7) | Includes gains on pensions curtailment of £2,148 million in 2009. |
| Summary consolidated balance sheet | 2009 | 2009 | 2008 | 2007 | 2006 | 2005 | ||||||||||||||||||
$m | £m | £m | £m | £m | £m | |||||||||||||||||||
| Loans and advances | 1,325,930 | 820,146 | 1,012,919 | 1,047,998 | 549,499 | 487,813 | ||||||||||||||||||
| Debt securities and equity shares | 463,641 | 286,782 | 293,879 | 347,682 | 146,246 | 135,804 | ||||||||||||||||||
| Derivatives and settlement balances | 733,152 | 453,487 | 1,010,391 | 293,991 | 109,506 | 89,470 | ||||||||||||||||||
| Other assets | 219,986 | 136,071 | 84,463 | 151,158 | 51,581 | 51,542 | ||||||||||||||||||
| Total assets | 2,742,709 | 1,696,486 | 2,401,652 | 1,840,829 | 856,832 | 764,629 | ||||||||||||||||||
| Owners’ equity | 125,676 | 77,736 | 58,879 | 53,038 | 40,227 | 35,435 | ||||||||||||||||||
| Minority interests | 27,314 | 16,895 | 21,619 | 38,388 | 5,263 | 2,109 | ||||||||||||||||||
| Subordinated liabilities | 60,872 | 37,652 | 49,154 | 38,043 | 27,654 | 28,274 | ||||||||||||||||||
| Deposits | 1,222,785 | 756,346 | 897,556 | 994,657 | 516,365 | 453,274 | ||||||||||||||||||
| Derivatives, settlement balances and short positions | 767,960 | 475,017 | 1,025,641 | 363,073 | 152,988 | 128,228 | ||||||||||||||||||
| Other liabilities | 538,102 | 332,840 | 348,803 | 353,630 | 114,335 | 117,309 | ||||||||||||||||||
| Total liabilities and equity | 2,742,709 | 1,696,486 | 2,401,652 | 1,840,829 | 856,832 | 764,629 | ||||||||||||||||||
311
Additional information
| Other financial data | 2009 | 2008 | 2007 | 2006 | 2005 | |||||||||||||||
| (Loss)/earnings per ordinary and B share from continuing operations – pence | (6.3 | ) | (146.2 | ) | 64.0 | 54.4 | 47.3 | |||||||||||||
Diluted (loss)/earnings per ordinary and B share from continuing operations – pence (1) | (6.3 | ) | (146.2 | ) | 63.4 | 53.9 | 47.0 | |||||||||||||
| Dividends per ordinary share – pence | — | 19.3 | 27.0 | 21.6 | 17.0 | |||||||||||||||
Dividend payout ratio (2) | — | — | 43% | 45% | 41% | |||||||||||||||
| Share price per ordinary share at year end – £ | 0.292 | 0.494 | 3.72 | 5.56 | 4.90 | |||||||||||||||
| Market capitalisation at year end – £bn | 16.5 | 19.5 | 44.4 | 62.8 | 56.1 | |||||||||||||||
| Net asset value per ordinary and B share – £ | 0.65 | 1.15 | 3.74 | 3.24 | 2.83 | |||||||||||||||
Return on average total assets (3) | (0.18% | ) | (1.19% | ) | 0.65% | 0.74% | 0.73% | |||||||||||||
Return on average ordinary and B shareholders’ equity (4) | (7.2% | ) | (50.1% | ) | 18.7% | 18.5% | 17.5% | |||||||||||||
| Average owners’ equity as a percentage of average total assets | 2.8% | 2.9% | 3.9% | 4.4% | 4.5% | |||||||||||||||
| Risk asset ratio – Tier 1 | 14.1% | 10.0% | 7.3% | 7.5% | 7.6% | |||||||||||||||
| Risk asset ratio – Total | 16.1% | 14.1% | 11.2% | 11.7% | 11.7% | |||||||||||||||
Ratio of earnings to combined fixed charges and preference share dividends (5) | ||||||||||||||||||||
| – including interest on deposits | 0.81 | (0.29 | ) | 1.45 | 1.62 | 1.67 | ||||||||||||||
| – excluding interest on deposits | (0.19 | ) | (11.96 | ) | 5.73 | 6.12 | 6.05 | |||||||||||||
Ratio of earnings to fixed charges only (5) | ||||||||||||||||||||
| – including interest on deposits | 0.85 | (0.30 | ) | 1.47 | 1.64 | 1.69 | ||||||||||||||
| – excluding interest on deposits | (0.28 | ) | (14.71 | ) | 6.53 | 6.87 | 6.50 | |||||||||||||
Notes:
(1) | The number of ordinary shares in issue in prior years were adjusted retrospectively for the bonus element of the rights issue completed in June 2008 and the capitalisation issue in September 2008. The contingent agreement with HM Treasury enabling it to place up to 16 billion new B shares at 50p each had a dilutive effect in 2009. None of the convertible preference shares had a dilutive effect in 2009 and 2008. All the convertible preference shares had a dilutive effect in 2007, 2006 and 2005 and as such were included in the computation of diluted earnings per share. |
(2) | Dividend payout ratio represents the interim dividend paid and current year final dividend proposed as a percentage of profit attributable to ordinary and B shareholders before discontinued operations, integration and restructuring costs, amortisation of purchased intangibles and net gain on sale of strategic investments and subsidiaries (net of tax). |
(3) | Return on average total assets represents profit attributable to ordinary and B shareholders as a percentage of average total assets. |
(4) | Return on average ordinary and B shareholders’ equity represents profit attributable to ordinary and B shareholders expressed as a percentage of average ordinary and B shareholders’ equity. |
(5) | For this purpose, earnings consist of income before tax and minority interests, plus fixed charges less the unremitted income of associated undertakings (share of profits less dividends received). Fixed charges consist of total interest expense, including or excluding interest on deposits and debt securities in issue, as appropriate, and the proportion of rental expense deemed representative of the interest factor (one third of total rental expenses). |
312
Additional information continued
Financial summary continued
Analysis of loans and advances to customers
The following table analyses loans and advances to customers before provisions by remaining maturity, geographical area and type of customer.
Within 1 year £m | After 1 but within£m | After 5 years£m | 2009 Total £m | 2008 £m | 2007 £m | 2006 £m | 2005 £m | |||||||||||||||||||||||||
| UK | ||||||||||||||||||||||||||||||||
| Central and local government | 2,403 | 27 | 744 | 3,174 | 3,091 | 3,135 | 6,732 | 3,340 | ||||||||||||||||||||||||
| Manufacturing | 6,215 | 3,328 | 1,889 | 11,432 | 15,074 | 13,452 | 11,051 | 11,615 | ||||||||||||||||||||||||
| Construction | 4,603 | 1,677 | 1,500 | 7,780 | 10,171 | 10,202 | 8,251 | 7,274 | ||||||||||||||||||||||||
| Finance | 28,094 | 4,441 | 3,748 | 36,283 | 42,432 | 70,006 | 25,017 | 27,091 | ||||||||||||||||||||||||
| Service industries and business activities | 18,727 | 14,384 | 18,744 | 51,855 | 58,638 | 53,965 | 43,887 | 40,687 | ||||||||||||||||||||||||
| Agriculture, forestry and fishing | 1,233 | 365 | 1,315 | 2,913 | 2,972 | 2,473 | 2,767 | 2,645 | ||||||||||||||||||||||||
| Property | 15,557 | 18,301 | 15,037 | 48,895 | 52,127 | 50,051 | 39,296 | 32,899 | ||||||||||||||||||||||||
| Individuals – home mortgages | 1,642 | 3,122 | 87,819 | 92,583 | 80,967 | 73,916 | 70,884 | 65,286 | ||||||||||||||||||||||||
| – other | 16,917 | 3,996 | 4,341 | 25,254 | 26,989 | 28,186 | 27,922 | 26,323 | ||||||||||||||||||||||||
| Finance leases and instalment credit | 3,024 | 6,012 | 7,150 | 16,186 | 17,363 | 15,632 | 14,218 | 13,909 | ||||||||||||||||||||||||
| Accrued interest | 922 | 10 | 60 | 992 | 2,463 | 2,344 | 1,497 | 1,250 | ||||||||||||||||||||||||
| Total domestic | 99,337 | 55,663 | 142,347 | 297,347 | 312,287 | 323,362 | 251,522 | 232,319 | ||||||||||||||||||||||||
| Overseas residents | 32,666 | 36,049 | 21,176 | 89,891 | 119,656 | 98,845 | 69,242 | 52,234 | ||||||||||||||||||||||||
| Total UK offices | 132,003 | 91,712 | 163,523 | 387,238 | 431,943 | 422,207 | 320,764 | 284,553 | ||||||||||||||||||||||||
| Overseas | ||||||||||||||||||||||||||||||||
| US | 31,860 | 30,043 | 31,666 | 93,569 | 126,277 | 135,059 | 92,166 | 90,606 | ||||||||||||||||||||||||
| Rest of the World | 81,008 | 51,875 | 131,829 | 264,712 | 327,391 | 277,721 | 57,896 | 45,951 | ||||||||||||||||||||||||
| Total Overseas offices | 112,868 | 81,918 | 163,495 | 358,281 | 453,668 | 412,780 | 150,062 | 136,557 | ||||||||||||||||||||||||
| Loans and advances to customers – gross | 244,871 | 173,630 | 327,018 | 745,519 | 885,611 | 834,987 | 470,826 | 421,110 | ||||||||||||||||||||||||
| Loan impairment provisions | (17,126 | ) | (10,889 | ) | (6,449 | ) | (3,933 | ) | (3,884 | ) | ||||||||||||||||||||||
| Loans and advances to customers – net | 728,393 | 874,722 | 828,538 | 466,893 | 417,226 | |||||||||||||||||||||||||||
| Fixed rate | 53,294 | 40,920 | 144,542 | 238,756 | 183,693 | 351,336 | 115,240 | 100,748 | ||||||||||||||||||||||||
| Variable rate | 191,577 | 132,710 | 182,476 | 506,763 | 701,918 | 483,651 | 355,586 | 320,362 | ||||||||||||||||||||||||
| Loans and advances to customers – gross | 244,871 | 173,630 | 327,018 | 745,519 | 885,611 | 834,987 | 470,826 | 421,110 | ||||||||||||||||||||||||
Cross border exposures
Cross border exposures are defined as loans to banks and customers (including finance lease and instalment credit receivables) and other monetary assets, including non-local currency claims of overseas offices on local residents.
The Group monitors the geographical breakdown of these exposures based on the country of domicile of the borrower or guarantor of ultimate risk.
The table below sets out the Group’s cross border outstandings in excess of 0.75% of Group total assets (including acceptances), which totalled £1,696.5 billion at 31 December 2009 (2008 – £2,401.7 billion; 2007 – £1,840.8 billion). None of these countries has experienced repayment difficulties that have required restructuring of outstanding debt.
| 2009 | 2008 | 2007 | ||||||||||
| £m | £m | £m | ||||||||||
| United States | 74,409 | 91,544 | 91,653 | |||||||||
| Germany | 41,727 | 40,812 | 51,123 | |||||||||
| France | 37,489 | 58,251 | 65,430 | |||||||||
| Spain | 27,118 | 36,441 | 31,651 | |||||||||
| Netherlands | 20,262 | 34,283 | 27,707 | |||||||||
| Japan | 18,939 | * | 31,922 | |||||||||
| Republic of Ireland | 14,902 | 18,662 | 17,736 | |||||||||
| Italy | 14,412 | * | 23,925 | |||||||||
| Cayman Islands | * | 18,126 | 17,099 | |||||||||
| * Less than 0.75% of Group total assets. | ||||||||||||
313
Additional information
Loan impairment provisions
For a discussion of the factors considered in determining the amount of the provisions, see ‘Risk elements and impairments’ on page 95 and ‘Critical accounting policies – Loan impairment provisions’ on pages 211 and 212.
The following table shows the movements in loan impairment provisions.
| 2009 | 2008 | 2007 | 2006 | 2005 | |||||||||||||||
| £m | £m | £m | £m | £m | |||||||||||||||
| Provisions at the beginning of the year | |||||||||||||||||||
| Domestic | 4,474 | 3,258 | 3,037 | 2,759 | 2,675 | ||||||||||||||
| Foreign | 6,542 | 3,194 | 898 | 1,128 | 1,470 | ||||||||||||||
| Total | 11,016 | 6,452 | 3,935 | 3,887 | 4,145 | ||||||||||||||
| Transfer to disposal groups | |||||||||||||||||||
| Domestic | — | — | — | — | — | ||||||||||||||
| Foreign | (324 | ) | (767 | ) | — | — | — | ||||||||||||
| Total | (324 | ) | (767 | ) | — | — | — | ||||||||||||
| Currency translation and other adjustments | |||||||||||||||||||
| Domestic | (228 | ) | 107 | 5 | (17 | ) | (7 | ) | |||||||||||
| Foreign | (302 | ) | 1,334 | 178 | (44 | ) | 58 | ||||||||||||
| Total | (530 | ) | 1,441 | 183 | (61 | ) | 51 | ||||||||||||
| (Disposals)/acquisitions of businesses | |||||||||||||||||||
| Domestic | — | (108 | ) | 10 | — | — | |||||||||||||
| Foreign | (65 | ) | (70 | ) | 2,211 | — | — | ||||||||||||
| Total | (65 | ) | (178 | ) | 2,221 | — | — | ||||||||||||
| Amounts written-off | |||||||||||||||||||
| Domestic | (2,895 | ) | (1,446 | ) | (1,222 | ) | (1,360 | ) | (1,252 | ) | |||||||||
| Foreign | (4,044 | ) | (1,702 | ) | (789 | ) | (481 | ) | (788 | ) | |||||||||
| Total | (6,939 | ) | (3,148 | ) | (2,011 | ) | (1,841 | ) | (2,040 | ) | |||||||||
| Recoveries of amounts written-off in previous years | |||||||||||||||||||
| Domestic | 175 | 116 | 158 | 119 | 97 | ||||||||||||||
| Foreign | 224 | 203 | 184 | 96 | 75 | ||||||||||||||
| Total | 399 | 319 | 342 | 215 | 172 | ||||||||||||||
Charged to income statement (1) | |||||||||||||||||||
| Domestic | 5,370 | 2,698 | 1,420 | 1,663 | 1,376 | ||||||||||||||
| Foreign | 8,764 | 4,393 | 526 | 214 | 327 | ||||||||||||||
| Total | 14,134 | 7,091 | 1,946 | 1,877 | 1,703 | ||||||||||||||
| Unwind of discount | |||||||||||||||||||
| Domestic | (226 | ) | (151 | ) | (150 | ) | (127 | ) | (130 | ) | |||||||||
| Foreign | (182 | ) | (43 | ) | (14 | ) | (15 | ) | (14 | ) | |||||||||
| Total | (408 | ) | (194 | ) | (164 | ) | (142 | ) | (144 | ) | |||||||||
Provisions at the end of the year (2) | |||||||||||||||||||
| Domestic | 6,670 | 4,474 | 3,258 | 3,037 | 2,759 | ||||||||||||||
| Foreign | 10,613 | 6,542 | 3,194 | 898 | 1,128 | ||||||||||||||
| Total | 17,283 | 11,016 | 6,452 | 3,935 | 3,887 | ||||||||||||||
| Gross loans and advances to customers | |||||||||||||||||||
| Domestic | 297,347 | 312,287 | 323,362 | 251,522 | 232,319 | ||||||||||||||
| Foreign | 448,172 | 573,324 | 511,625 | 219,304 | 188,791 | ||||||||||||||
| Total | 745,519 | 885,611 | 834,987 | 470,826 | 421,110 | ||||||||||||||
Closing customer provisions as a % of gross loans and advances to customers (3) | |||||||||||||||||||
| Domestic | 2.24% | 1.43% | 1.01% | 1.21% | 1.19% | ||||||||||||||
| Foreign | 2.33% | 1.12% | 0.62% | 0.41% | 0.60% | ||||||||||||||
| Total | 2.30% | 1.23% | 0.77% | 0.84% | 0.92% | ||||||||||||||
| Customer charge to income statement as a % of gross loans and advances to customers | |||||||||||||||||||
| Domestic | 1.81% | 0.86% | 0.44% | 0.66% | 0.59% | ||||||||||||||
| Foreign | 1.95% | 0.75% | 0.10% | 0.10% | 0.17% | ||||||||||||||
| Total | 1.89% | 0.79% | 0.23% | 0.40% | 0.40% | ||||||||||||||
Notes:
(1) | Includes £34 million relating to loans and advances to banks (2008 – £118 million; 2007, 2006 and 2005 – nil). |
(2) | Includes closing provisions against loans and advances to banks of £157 million (2008 – £127 million; 2007 – £3 million; 2006 – £2 million; 2005 – £3 million). |
(3) | Closing customer provisions exclude closing provisions against loans and advances to banks. |
314
Additional information continued
Financial summary continued
Loan impairment provisions continued
The following table shows additional information in respect of the loan impairment provisions.
| 2009 | 2008 | 2007 | 2006 | 2005 | ||||||||||||||||
| £m | £m | £m | £m | £m | ||||||||||||||||
| Loan impairment provisions at end of year: | ||||||||||||||||||||
| – customers | 17,126 | 10,889 | 6,449 | 3,933 | 3,884 | |||||||||||||||
| – banks | 157 | 127 | 3 | 2 | 3 | |||||||||||||||
| 17,283 | 11,016 | 6,452 | 3,935 | 3,887 | ||||||||||||||||
| Average loans and advances to customers (gross) | 821,155 | 858,333 | 567,900 | 445,766 | 402,473 | |||||||||||||||
| As a % of average loans and advances to customers during the year: | ||||||||||||||||||||
| Total customer provisions charged to income statement | 1.72% | 0.81% | 0.34% | 0.42% | 0.42% | |||||||||||||||
| Amounts written-off (net of recoveries) – customers | 0.80% | 0.33% | 0.29% | 0.36% | 0.46% | |||||||||||||||
Analysis of closing loan impairment provisions
The following table analyses customer loan impairment provisions by geographical area and type of domestic customer.
| 2009 | 2008 | 2007 | 2006 | 2005 | ||||||||||||||||||||||||||||||||||||
| % of loans | % of loans | % of loans | % of loans | % of loans | ||||||||||||||||||||||||||||||||||||
| Closing | to total | Closing | to total | Closing | to total | Closing | to total | Closing | to total | |||||||||||||||||||||||||||||||
| provision | loans | provision | loans | provision | loans | provision | loans | provision | loans | |||||||||||||||||||||||||||||||
| £m | % | £m | % | £m | % | £m | % | £m | % | |||||||||||||||||||||||||||||||
| Domestic | ||||||||||||||||||||||||||||||||||||||||
| Central and | ||||||||||||||||||||||||||||||||||||||||
| local government | — | 0.4 | — | 0.3 | — | 0.4 | — | 1.4 | — | 0.8 | ||||||||||||||||||||||||||||||
| Manufacturing | 153 | 1.5 | 127 | 1.7 | 93 | 1.6 | 94 | 2.4 | 138 | 2.8 | ||||||||||||||||||||||||||||||
| Construction | 355 | 1.0 | 254 | 1.1 | 75 | 1.2 | 63 | 1.8 | 74 | 1.7 | ||||||||||||||||||||||||||||||
| Finance | 26 | 4.9 | 67 | 4.8 | 52 | 8.4 | 33 | 5.3 | 104 | 6.4 | ||||||||||||||||||||||||||||||
| Service industries and | ||||||||||||||||||||||||||||||||||||||||
| business activities | 962 | 7.0 | 778 | 6.6 | 562 | 6.5 | 647 | 9.3 | 647 | 9.7 | ||||||||||||||||||||||||||||||
| Agriculture, forestry | ||||||||||||||||||||||||||||||||||||||||
| and fishing | 20 | 0.4 | 19 | 0.3 | 21 | 0.3 | 25 | 0.6 | 26 | 0.6 | ||||||||||||||||||||||||||||||
| Property | 908 | 6.6 | 490 | 5.9 | 85 | 6.0 | 70 | 8.3 | 63 | 7.8 | ||||||||||||||||||||||||||||||
| Individuals | ||||||||||||||||||||||||||||||||||||||||
| – home mortgages | 196 | 12.4 | 36 | 9.1 | 36 | 8.8 | 37 | 15.1 | 36 | 15.5 | ||||||||||||||||||||||||||||||
| – other | 2,527 | 3.4 | 2,235 | 3.0 | 2,054 | 3.4 | 1,826 | 5.9 | 1,513 | 6.3 | ||||||||||||||||||||||||||||||
| Finance leases and | ||||||||||||||||||||||||||||||||||||||||
| instalment credit | 341 | 2.2 | 194 | 2.0 | 132 | 1.9 | 103 | 3.0 | 88 | 3.3 | ||||||||||||||||||||||||||||||
| Accrued interest | — | 0.1 | — | 0.3 | — | 0.3 | — | 0.3 | — | 0.3 | ||||||||||||||||||||||||||||||
| Total domestic | 5,488 | 39.9 | 4,200 | 35.1 | 3,110 | 38.8 | 2,898 | 53.4 | 2,689 | 55.2 | ||||||||||||||||||||||||||||||
| Foreign | 8,562 | 60.1 | 4,745 | 64.9 | 2,289 | 61.2 | 442 | 46.6 | 652 | 44.8 | ||||||||||||||||||||||||||||||
| Impaired book provisions | 14,050 | 100.0 | 8,945 | 100.0 | 5,399 | 100.0 | 3,340 | 100.0 | 3,341 | 100.0 | ||||||||||||||||||||||||||||||
| Latent book provisions | 3,076 | 1,944 | 1,050 | 593 | 543 | |||||||||||||||||||||||||||||||||||
| Total provisions | 17,126 | 10,889 | 6,449 | 3,933 | 3,884 | |||||||||||||||||||||||||||||||||||
315
Additional information
Analysis of write-offs
The following table analyses amounts written-off by geographical area and type of domestic customer.
| 2009 | 2008 | 2007 | 2006 | 2005 | ||||||||||||||||
| £m | £m | £m | £m | £m | ||||||||||||||||
| Domestic | ||||||||||||||||||||
| Manufacturing | 217 | 61 | 29 | 41 | 40 | |||||||||||||||
| Construction | 243 | 51 | 21 | 29 | 17 | |||||||||||||||
| Finance | 105 | 31 | 47 | 17 | 21 | |||||||||||||||
| Service industries and business activities | 702 | 299 | 190 | 212 | 176 | |||||||||||||||
| Agriculture, forestry and fishing | 3 | 5 | 4 | 5 | 4 | |||||||||||||||
| Property | 320 | 34 | 9 | 6 | 25 | |||||||||||||||
| Individuals – home mortgages | 2 | 1 | — | 5 | 4 | |||||||||||||||
| Individuals – others | 1,188 | 938 | 909 | 1,021 | 950 | |||||||||||||||
| Finance leases and instalment credit | 115 | 26 | 13 | 24 | 15 | |||||||||||||||
| Total domestic | 2,895 | 1,446 | 1,222 | 1,360 | 1,252 | |||||||||||||||
| Foreign | 4,044 | 1,702 | 789 | 481 | 788 | |||||||||||||||
Total write-offs (1) | 6,939 | 3,148 | 2,011 | 1,841 | 2,040 | |||||||||||||||
Note:
(1) Includes £2 million written-off in respect of loans and advances to banks in 2005.
Analysis of recoveries
The following table analyses recoveries of amounts written-off by geographical area and type of domestic customer.
| 2009 | 2008 | 2007 | 2006 | 2005 | ||||||||||||||||
| £m | £m | £m | £m | £m | ||||||||||||||||
| Domestic | ||||||||||||||||||||
| Manufacturing | 1 | 2 | — | — | 1 | |||||||||||||||
| Construction | — | — | — | — | 1 | |||||||||||||||
| Finance | 2 | 2 | — | — | — | |||||||||||||||
| Service industries and business activities | 13 | 12 | 7 | 5 | 2 | |||||||||||||||
| Property | — | — | — | 1 | 2 | |||||||||||||||
| Individuals – home mortgages | 3 | — | — | — | — | |||||||||||||||
| Individuals – others | 99 | 96 | 143 | 101 | 84 | |||||||||||||||
| Finance leases and instalment credit | 57 | 4 | 8 | 12 | 7 | |||||||||||||||
| Total domestic | 175 | 116 | 158 | 119 | 97 | |||||||||||||||
| Foreign | 224 | 203 | 184 | 96 | 75 | |||||||||||||||
| Total recoveries | 399 | 319 | 342 | 215 | 172 | |||||||||||||||
316
Additional information continued
Financial summary continued
Risk elements in lending and potential problem loans
The Group’s loan control and review procedures do not include the classification of loans as non-accrual, accruing past due, restructured and potential problem loans, as defined by the SEC in the US. The following table shows the estimated amount of loans that would be reported using the SEC’s classifications. The figures are stated before deducting the value of security held or related provisions.
| 2009 | 2008 | 2007 | 2006 | 2005 | ||||||||||||||||
| £m | £m | £m | £m | £m | ||||||||||||||||
Loans accounted for on a non-accrual basis (2): | ||||||||||||||||||||
| Domestic | 13,572 | 8,588 | 5,599 | 5,420 | 4,977 | |||||||||||||||
| Foreign | 21,453 | 10,891 | 4,763 | 812 | 949 | |||||||||||||||
| Total | 35,025 | 19,479 | 10,362 | 6,232 | 5,926 | |||||||||||||||
| Accruing loans which are contractually overdue | ||||||||||||||||||||
90 days or more as to principal or interest (3): | ||||||||||||||||||||
| Domestic | 2,224 | 1,201 | 217 | 81 | 2 | |||||||||||||||
| Foreign | 1,000 | 581 | 152 | 24 | 7 | |||||||||||||||
| Total | 3,224 | 1,782 | 369 | 105 | 9 | |||||||||||||||
| Loans not included above which are classified as | ||||||||||||||||||||
| "troubled debt restructurings" by the SEC: | ||||||||||||||||||||
| Domestic | — | — | — | — | 2 | |||||||||||||||
| Foreign | — | — | — | — | — | |||||||||||||||
| Total | — | — | — | — | 2 | |||||||||||||||
| Total risk elements in lending | 38,249 | 21,261 | 10,731 | 6,337 | 5,937 | |||||||||||||||
Potential problem loans (4): | ||||||||||||||||||||
| Domestic | 424 | 218 | 63 | 47 | 14 | |||||||||||||||
| Foreign | 585 | 8 | 608 | 5 | 5 | |||||||||||||||
| Total potential problem loans | 1,009 | 226 | 671 | 52 | 19 | |||||||||||||||
| Closing provisions for impairment as a % of total risk elements in lending | 46 | % | 52 | % | 60 | % | 62 | % | 65 | % | ||||||||||
| Closing provisions for impairment as a % of total risk elements in lending | ||||||||||||||||||||
| and potential problem loans | 45 | % | 51 | % | 57 | % | 62 | % | 65 | % | ||||||||||
| Risk elements in lending as a % of gross lending to customers excluding | ||||||||||||||||||||
reverse repos (5) | 5.35 | % | 2.51 | % | 1.55 | % | 1.55 | % | 1.60 | % | ||||||||||
Notes:
(1) | For the analysis above, “Domestic” consists of the United Kingdom domestic transactions of the Group. “Foreign” comprises the Group’s transactions conducted through offices outside the UK and through those offices in the UK specifically organised to service international banking transactions. |
(2) | All loans against which an impairment provision is held are reported in the non-accrual category. |
(3) | Loans where an impairment event has taken place but no impairment is recognised. This category is used for fully collateralised non-revolving credit facilities. |
(4) | Loans for which an impairment event has occurred but no impairment provision is necessary. This category is used for fully collateralised advances and revolving credit facilities where identification as 90 days overdue is not feasible. |
(5) | Gross of provisions and excluding reverse repurchase agreements. Includes gross lending relating to disposal groups in 2009. |
| 2009 | 2008 | 2007 | 2006 | 2005 | ||||||||||||||||
| £m | £m | £m | £m | £m | ||||||||||||||||
| Gross income not recognised but which would have been recognised | ||||||||||||||||||||
| under the original terms of non-accrual and restructured loans: | ||||||||||||||||||||
| Domestic | 625 | 393 | 390 | 370 | 334 | |||||||||||||||
| Foreign | 1,079 | 342 | 155 | 77 | 62 | |||||||||||||||
| 1,704 | 735 | 545 | 447 | 396 | ||||||||||||||||
Interest on non-accrual and restructured loans included in net interest income: | ||||||||||||||||||||
| Domestic | 226 | 150 | 165 | 142 | 130 | |||||||||||||||
| Foreign | 182 | 43 | 16 | 15 | 14 | |||||||||||||||
| 408 | 193 | 181 | 157 | 144 | ||||||||||||||||
317
Additional information
Analysis of deposits – product analysis
The following table shows the distribution of the Group’s deposits by type and geographical area.
| 2009 | 2008 | 2007 | ||||||||||
| £m | £m | £m | ||||||||||
| UK | ||||||||||||
| Domestic: | ||||||||||||
| Demand deposits | – interest-free | 45,855 | 43,376 | 43,721 | ||||||||
| – interest-bearing | 136,157 | 107,159 | 121,343 | |||||||||
| Time deposits | – savings | 67,450 | 88,434 | 41,185 | ||||||||
| – other | 65,937 | 130,951 | 207,263 | |||||||||
| Overseas residents: | ||||||||||||
| Demand deposits | – interest-free | 1,072 | 907 | 563 | ||||||||
| – interest-bearing | 13,618 | 16,320 | 25,129 | |||||||||
| Time deposits | – savings | 1,288 | 1,819 | 605 | ||||||||
| – other | 61,341 | 67,477 | 87,437 | |||||||||
| Total UK offices | 392,718 | 456,443 | 527,246 | |||||||||
| Overseas | ||||||||||||
| Demand deposits | – interest-free | 36,458 | 29,253 | 27,959 | ||||||||
| – interest-bearing | 91,482 | 92,354 | 70,758 | |||||||||
| Time deposits | – savings | 78,423 | 68,014 | 52,381 | ||||||||
| – other | 157,265 | 251,492 | 316,313 | |||||||||
| Total overseas offices | 363,628 | 441,113 | 467,411 | |||||||||
| Total deposits | 756,346 | 897,556 | 994,657 | |||||||||
| Held-for-trading | 106,477 | 137,080 | 125,917 | |||||||||
| Designated as at fair value through profit or loss | 8,580 | 8,054 | 7,505 | |||||||||
| Amortised cost | 641,289 | 752,422 | 861,235 | |||||||||
| Total deposits | 756,346 | 897,556 | 994,657 | |||||||||
| Overseas | ||||||||||||
| US | 126,075 | 153,163 | 152,324 | |||||||||
| Rest of the World | 237,553 | 287,950 | 315,087 | |||||||||
| Total overseas offices | 363,628 | 441,113 | 467,411 | |||||||||
318
Additional information continued
Financial summary continued
Short-term borrowings
2009 £m | 2008 £m | 2007 £m | ||||||||||
| Commercial paper | ||||||||||||
| Outstanding at year end | 44,473 | 78,581 | 78,612 | |||||||||
| Maximum outstanding at any month end during the year | 74,656 | 111,108 | 81,187 | |||||||||
| Approximate average amount during the year | 58,615 | 98,150 | 32,498 | |||||||||
| Approximate weighted average interest rate during the year | 1.2% | 3.3% | 4.8% | |||||||||
| Approximate weighted average interest rate at year end | 1.2% | 3.0% | 5.5% | |||||||||
| Other short-term borrowings | ||||||||||||
| Outstanding at year end | 138,951 | 194,346 | 280,526 | |||||||||
| Maximum outstanding at any month end during the year | 202,812 | 395,132 | 312,557 | |||||||||
| Approximate average amount during the year | 162,235 | 299,513 | 188,326 | |||||||||
| Approximate weighted average interest rate during the year | 1.4% | 3.2% | 4.6 | |||||||||
| Approximate weighted average interest rate at year end | 0.4% | 2.5% | 4.1 | |||||||||
Average interest rates during the year are computed by dividing total interest expense by the average amount borrowed. Average interest rates at year end are average rates for a single day and as such may reflect one-day market distortions which may not be indicative of generally prevailing rates. Original maturities of commercial paper are not in excess of one year. ‘Other short-term borrowings’ consist principally of borrowings in the money markets included within ‘Deposits by banks’ and ‘Customer accounts’ in the financial statements and generally have original maturities of one year or less.
Certificates of deposit and other time deposits
The following table shows details of the Group’s certificates of deposit and other time deposits over $100,000 or equivalent by remaining maturity.
| Over 3 months | Over 6 months | |||||||||||||||||||
| Within | but within | but within | Over | |||||||||||||||||
| 3 months | 6 months | 12 months | 12 months | Total | ||||||||||||||||
| 2009 | £m | £m | £m | £m | £m | |||||||||||||||
| UK based companies and branches | ||||||||||||||||||||
| Certificates of deposit | 13,329 | 6,673 | 2,795 | 3,240 | 26,037 | |||||||||||||||
| Other time deposits | 50,913 | 8,083 | 4,484 | 21,609 | 85,089 | |||||||||||||||
| Overseas based companies and branches | ||||||||||||||||||||
| Certificates of deposit | 24,157 | 8,503 | 2,567 | 218 | 35,445 | |||||||||||||||
| Other time deposits | 45,157 | 12,469 | 6,264 | 13,215 | 77,105 | |||||||||||||||
| Total | 133,556 | 35,728 | 16,110 | 38,282 | 223,676 | |||||||||||||||
| 2008 | ||||||||||||||||||||
| UK based companies and branches | ||||||||||||||||||||
| Certificates of deposit | 23,076 | 7,475 | 9,236 | 13 | 39,800 | |||||||||||||||
| Other time deposits | 62,623 | 7,665 | 5,939 | 12,359 | 88,586 | |||||||||||||||
| Overseas based companies and branches | ||||||||||||||||||||
| Certificates of deposit | 32,263 | 1,666 | 1,316 | — | 35,245 | |||||||||||||||
| Other time deposits | 111,542 | 13,498 | 7,983 | 15,641 | 148,664 | |||||||||||||||
| Total | 229,504 | 30,304 | 24,474 | 28,013 | 312,295 | |||||||||||||||
319
Additional information
Other contractual cash obligations
The table below summarises the Group’s other contractual cash obligations by payment date.
| Group | ||||||||||||||||||||||||
| 0-3 months | 3-12 months | 1-3 years | 3-5 years | 5-10 years | 10-20 years | |||||||||||||||||||
| 2009 | £m | £m | £m | £m | £m | £m | ||||||||||||||||||
| Operating leases | 140 | 339 | 965 | 726 | 1,219 | 1,836 | ||||||||||||||||||
| Contractual obligations to purchase goods or services | 180 | 300 | 168 | 16 | — | 1 | ||||||||||||||||||
| 320 | 639 | 1,133 | 742 | 1,219 | 1,837 | |||||||||||||||||||
| 2008 | ||||||||||||||||||||||||
| Operating leases | 146 | 433 | 976 | 751 | 1,448 | 1,851 | ||||||||||||||||||
| Contractual obligations to purchase goods or services | 237 | 892 | 486 | 208 | 303 | 1 | ||||||||||||||||||
| 383 | 1,325 | 1,462 | 959 | 1,751 | 1,852 | |||||||||||||||||||
The Group’s undrawn formal facilities, credit lines and other commitments to lend were £291,634 million (2008 – £352,398 million). While the Group has given commitments to provide these funds, some facilities may be subject to certain conditions being met by the counterparty. The Group does not expect all facilities to be drawn, and some may lapse before drawdown.
Exchange rates
Except as stated, the following tables show, for the dates or periods indicated, the Noon Buying Rate in New York for cable transfers in sterling as certified for customs purposes by the Federal Reserve Bank of New York.
| March | February | January | December | November | October | |||||||||||||||||||
| US dollars per £1 | 2010 | 2010 | 2010 | 2009 | 2009 | 2009 | ||||||||||||||||||
| Noon Buying Rate | ||||||||||||||||||||||||
| High | 1.5296 | 1.5968 | 1.6370 | 1.6641 | 1.6795 | 1.6610 | ||||||||||||||||||
| Low | 1.4884 | 1.5201 | 1.5912 | 1.5892 | 1.6383 | 1.5878 | ||||||||||||||||||
| 2009 | 2008 | 2007 | 2006 | 2005 | ||||||||||||||||||||
| Noon Buying Rate | ||||||||||||||||||||||||
| Period end rate | 1.6167 | 1.4619 | 1.9843 | 1.9586 | 1.7188 | |||||||||||||||||||
Average rate for the period (1) | 1.5707 | 1.8424 | 2.0073 | 1.8582 | 1.8147 | |||||||||||||||||||
Consolidation rate (2) | ||||||||||||||||||||||||
| Period end rate | 1.6222 | 1.4604 | 2.0043 | 1.9651 | 1.7214 | |||||||||||||||||||
| Average rate for the period | 1.5657 | 1.8528 | 2.0015 | 1.8436 | 1.8198 | |||||||||||||||||||
Notes:
(1) | The average of the Noon Buying Rates on the last business day of each month during the period. |
(2) | The rates used by the Group for translating US dollars into sterling in the preparation of its financial statements. |
(3) | On 23 April 2010, the Noon Buying Rate was £1.00 = US$1.5363 |
320
Additional information continued
Economic and monetary environment
Conditions remained difficult across much of the world economy in 2009. In the first three months of the year, the global slowdown intensified, with many industrialised economies recording the fastest contraction in output for a generation. The synchronised nature of the downturn resulted in a marked deterioration in international trade, as firms pared back inventories and cut orders. Financial market conditions remained turbulent, with equity prices touching a low of 60% below their 2007 peak in March, as rising job losses added to pressure on consumer spending. Policymakers took unprecedented steps to combat the decline, augmenting earlier fiscal stimulus packages and embarking on extraordinary monetary policy actions. A number of central banks cut interest rates further, made significant asset purchases and provided additional liquidity to financial markets. Growth in emerging markets held up moderately well by comparison, with the exception of Eastern European states that suffered acutely from balance of payments difficulties.
Signs of stabilisation began to emerge in the second quarter of 2009. Germany, France and Japan announced a return to economic growth in the three months to June, and the pace of recession abated elsewhere. Strains in money markets began to ease, as evidenced by a gradual decline in inter-bank lending markets towards policy rates and a narrowing of credit spreads. Asset prices began to recover from their first quarter trough, supported by substantial liquidity provision from central banks. Prospects for profitability and employment remained challenging, as workers continued to face difficult labour market conditions and revenues were squeezed. Commodity prices staged a recovery in the second half of 2009, supported by increased optimism for economic prospects and more resilient demand conditions in many emerging markets where growth is more resource intensive.
The UK economy contracted as much in the first quarter of 2009 as during the entire 1990s recession. Activity continued to contract in the second and third quarters, but the pace of decline moderated. Significant slack was evident with businesses operating well below full capacity and the unemployment rate rising to c.8%. Lower consumer spending acted as a significant drag on growth as households grappled with falling employment and weaker average earnings growth. Weak demand conditions at home and abroad, a high level of spare capacity and the uncertain outlook resulted in a sharp decline in business investment. Despite the early recovery in the UK's major trade partners, exports failed to deliver a significant boost. Sterling strengthened modestly from its January low in trade weighted terms, but remained at competitive levels against major currencies compared to the pre-crisis period. Inflation fell back from 5.2% in September 2008 to below the Bank of England’s 2% target in June. Inflation remained above 1% throughout the year – in contrast to bouts of falling prices in the US and euro area – in part the result of a weaker exchange rate.
The Bank Rate was reduced from 5.0% in October 2008 to 0.5% in March 2009. This brought the base rate to its lowest level in the Bank of England’s 316-year history. With interest rates approaching the zero bound, policymakers embarked on an asset purchase programme, know as quantitative easing (QE), to provide further support to the economy. Initially £75 billion was allocated for asset purchases, which was expanded to £200 billion over the course of the year. The impact of QE has been credited with reducing the long-term cost of borrowing for corporates and preventing deflation in the wider economy, though the counterfactual – the prevailing state of the world if QE was not undertaken – is unknown.
In the US, the recession was at its most severe in the first quarter of 2009. The economy contracted at 6.4% quarter-on-quarter annualised rate, but stabilised in the second quarter and returned to growth in the third quarter. Additional fiscal stimulus measures in 2009 helped to support spending on autos and encourage a return of buyers to the moribund housing market. Lower house prices also boosted affordability, and as prices bottomed out in the middle of the year, activity gradually picked up. But conditions remain difficult. Between January 2008 and December 2009 payroll employment declined by eight million, sixty percent of which occurred in 2009. Labour market weakness is likely to act as a drag on consumer demand for some time. Continued dollar weakness provided a boost to net exports in the second half of the year.
The Federal Reserve had lowered policy rates to 0.25% in December 2008, leaving no room for further rate cuts. Programmes to help normalise conditions in financial markets and support liquidity were extended in 2009. In an effort to lower long-term market interest rates, the Federal Reserve announced that it would purchase $200 billion of Government Sponsored Enterprise debt, $1.25 trillion of mortgage backed securities, and $300 billion of long-term treasury securities. Long yields fell somewhat in the middle of the year but recovered by year end.
The Eurozone entered 2009 on a similar footing to other developed economies, contracting sharply in the first quarter before returning to growth in the three months to September. However, there was significant variation in the performance of economies within the region. Germany’s downturn was deep, with activity contracting by 6.7% between the second quarter of 2008 and the first quarter of 2009. Growth returned in the second quarter of 2009. The recession in France was similarly short but not as deep (with a 3.5% contraction in output during the recession). Peripheral economies with higher debt levels, like Ireland and Spain, were hit hard by rapid and steep rises in unemployment and an extended period of contraction.
The European Central Bank reduced its main policy rate from 2.5% at the beginning of the year to 1% by May 2009, and embarked on a modest programme of asset purchases (€60 billion of covered bond purchases were announced in May to reduce longer rates). It also adopted a policy of unlimited liquidity provision to euro area banks. Nevertheless, lending to households and businesses fell, reducing the rate of money supply growth to almost zero at year end. Consumer price inflation across the single currency area was negative for six months, before returning to positive territory in October. The euro's strength helped to put downward pressure on import costs, but also threatened to act as a drag on the recovery by reducing the competitiveness of the region's exports in global markets.
The retrenchment in international trade in late 2008 had severe consequences for the economies in Asia Pacific, some of which saw exports fall in excess of 50% year on year. The intensification of the downturn in the first three months of 2009 further exacerbated this contraction, reducing industrial output and leading to rapid rises in unemployment. Government stimulus packages introduced at the end of 2008 bore fruit in the second quarter of the year, combining with industry restocking to mark a return to moderate growth across much of the region. Expansionary fiscal policy in China helped the economy to bounce back to 9% growth year on year in the third quarter of 2009, but here, as in many neighbouring economies, private sector demand remained soft, leaving economies reliant on government support in 2010.
321
Additional information
United Kingdom
The UK Financial Services Authority (FSA) is the consolidated supervisor of the Group. As at 31 December 2009, 30 companies in the Group (excluding subsidiaries of ABN AMRO), spanning a range of financial services sectors (banking, insurance and investment business), were authorised to conduct financial activities regulated by the FSA.
The UK authorised banks in the Group include the Royal Bank, NatWest, Coutts & Co and Ulster Bank Limited. Wholesale activities, other than Group Treasury activities, are concentrated in the Group’s Global Banking & Markets and Corporate Banking divisions, and are undertaken under the names of the Royal Bank and NatWest. UK retail banking activities are managed by the UK Retail division. The exception is Ulster Bank Limited, which is run as a separate division within the Group. Ulster Bank Group will move to a single brand in the Republic of Ireland, with First Active merging with Ulster Bank. Ulster Bank Limited provides banking services in Northern Ireland while the banking service in the Republic of Ireland is provided by Ulster Bank Ireland Limited and (for the time being) First Active plc, which are primarily supervised by the Irish Financial Regulator.
Investment management business is principally undertaken by companies in the Wealth Management division, including Coutts & Co, Adam & Company Investment Management Limited, and in the Global Banking & Markets division, through RBS Asset Management Limited.
General insurance business is principally undertaken by Direct Line Insurance plc and Churchill Insurance Company Limited. Life assurance business is principally undertaken by Royal Scottish Assurance plc and National Westminster Life Assurance Limited (in partnership with Aviva plc).
The Group is subject to extensive regulations that impose obligations on financial institutions to maintain appropriate policies, procedures and controls to ensure compliance with the rules and regulations to which they are subject.
United States
The Group is both a bank holding company and a financial holding company within the meaning of the US Bank Holding Company Act of 1956. As such, it is subject to the regulation and supervision of the Board of Governors of the Federal Reserve System (the “Federal Reserve”). Among other things, the Group’s direct and indirect activities and investments in the United States are limited to those that are ‘financial in nature’ or ‘incidental’ or ‘complementary’ to a financial activity, as determined by the Federal Reserve. The Group is also required to obtain the prior approval of the Federal Reserve before acquiring directly or indirectly, the ownership or control of more than 5% of any class of the voting shares of any US bank or holding company. Under current Federal Reserve policy, the Group is required to act as a source of financial strength for its US bank subsidiaries. Among other things, this source of strength obligation could require the Group to inject capital into any of its US bank subsidiaries if any of them became undercapitalised.
The Group is subject to extensive regulations that impose obligations on financial institutions to maintain appropriate policies, procedures and controls to insure compliance with the rules and regulations to which they are subject, in particular to detect, prevent and report money laundering and terrorist financing and to ensure compliance with economic sanctions against designated foreign countries, nationals and others. Anti-money laundering, anti-terrorism and economic sanctions regulations are a major focus of US government policy relating to financial institutions and are rigorously enforced by US government agencies.
The Group’s US bank and non-bank subsidiaries and the Royal Bank’s US branches are also subject to supervision and regulation by a variety of other US regulatory agencies. RBS Citizens NA is supervised by the Office of the Comptroller of the Currency, which is charged with the regulation and supervision of nationally chartered banks. Citizens Bank of Pennsylvania is subject to the regulation and supervision of the Pennsylvania Department of Banking and the US Federal Deposit Insurance Corporation. These banks represented approximately 80 percent and 20 percent of the assets of Citizens Financial Group, respectively, at 31 December 2009. Citizens Financial Group is under the supervision of the Federal Reserve as a bank holding company. The Royal Bank’s New York branch is supervised by the New York State Banking Department, and its Connecticut branch is supervised by the Connecticut Department of Banking. Both branches are also subject to supervisory oversight by the Federal Reserve, through the Federal Reserve Bank of Boston.
Reform proposals and pending legislation in the United States could result in the Group becoming subject to heightened regulatory requirements, including stricter capital requirements and leverage limits and activities restrictions.
The Group’s US broker dealer, RBS Securities Inc. (RBSSI), formerly known as Greenwich Capital Markets, Inc., is subject to regulation and supervision by the US Securities and Exchange Commission (SEC) and the Financial Industry Regulatory Authority (FINRA) with respect to its securities activities. The futures activities of RBSSI are subject to regulation and oversight by the US Commodity Futures Trading Commission (CFTC) and the Chicago Board of Trade (CBOT). The Group's US commodities business, RBS Sempra Commodities, is subject to regulation by the Federal Energy Regulatory Commission (FERC), the Commodity Futures Trading Commission (CFTC) and the Federal Reserve Bank of Boston.
ABN AMRO’s operations in the United States are subject to extensive regulation and supervision by both federal and state banking authorities. ABN AMRO is both a bank holding company and a financial holding company within the meaning of the US Bank Holding Company Act of 1956. As such, its direct and indirect activities and investments in the United States are generally subject to the bank regulatory restrictions and requirements described above.
Netherlands
The consolidated supervisor of RBS N.V. is the Dutch Central Bank, De Nederlandsche Bank (DNB). The DNB operates as prudential supervisor of banks, insurance companies and pension funds, and also as part of the European System of Central Banks.
Other jurisdictions
The Group operates in over 50 countries through a network of branches, local banks and non-bank subsidiaries and these activities are subject to supervision in most cases by a local regulator or central bank.
Regulatory developments and reviews
The Group works with domestic and international trade associations and proactively engages with regulators and other authorities such as the Basel Committee, the Committee of European Banking Supervisors and the EU Commission in order to understand the implications of proposed regulatory change and to contribute to the development of regulatory policy.
The Group and its subsidiaries have co-operated fully with various regulatory reviews and developments in the UK and internationally, including enquiries or investigations into alleged or possible breaches of regulations.
United Kingdom
In the UK, the Group has actively engaged with a large number of legislative and regulatory consultations. Reflecting global developments, financial stability – notably bank prudential requirements and depositor protection – has been a key focus for the UK regulatory authorities.
322
Additional information continued
The Group participated fully in the consultation processes on the Banking Reform Bill and the Financial Services Bill. It also engaged with policymakers on Lord Turner’s Review, ‘A regulatory response to the global banking crisis’, and its associated consultations. These set out a wide range of ideas and proposals, aimed at strengthening the resilience of the banking system and addressing perceived short-comings in existing regulation, notably with respect to the quantum and quality of bank regulatory capital. Many of these were subsequently reflected in more detailed proposals issued by the Basel Committee on Banking Supervision in December 2009 (see below).
Linked to these issues is the policy debate over systemic banks. The Group has contributed to responses to a number of systemic bank proposals and is participating in the FSA’s pilot for the development of Recovery and Resolution Plans (“Living Wills”). It will be developing suitable Recovery and Resolution Plans in line with forthcoming regulatory requirements.
Finally, the FSA has taken an active lead in implementing the G20’s principles on remuneration structures, introducing a Code on Remuneration Practices which formally took effect on 1 January 2010. During the second half of 2009, the Group engaged with FSA on its Code as it was developed, and put in place new governance processes and policies to deliver compliance. More information on these aspects can be found on page 181.
In addition to the above, the Group continued to comment on other specific regulatory and legal changes that could impact its business. Examples included the FSA’s retail distribution and mortgage market reviews; and the Department for Business, Innovation and Skills and HM Treasury’s consumer reforms, including with respect to credit card markets.
New requirements that took effect during the period under review include the EU’s Payment Services Directive (PSD), which came into force on 1 November 2009, and the FSA’s new liquidity regime for banks, whose systems and controls requirements took effect on 1 December 2009. The PSD provides an extensive regulatory framework for European payments markets, by opening up the provision of payment services to non-bank providers; increasing consumer protection through new rules on execution times, transparency of information, liability and pricing; and regulating providers of payment services through licensing. The new FSA liquidity regime will require much larger liquidity buffers to be held by specified banks, phased in over a number of years.
UK regulated firms within the Group are members of the Financial Services Compensation Scheme (FSCS), which provides compensation to eligible customers of authorised financial services firms that are unable to meet their obligations. The FSCS is funded through annual levies charged to UK regulated firms. These levies are apportioned between firms on the basis of their shares of the FSCS tariff base: in the case of deposit takers, this means that levies are determined by their share of protected deposits. As a result of FSCS involvement in a number of bank failures in 2008, there has been a significant impact on levies charged to deposit takers, as reflected in the accounts. Also a significant aspect of RBS’ response to regulatory developments during the year was addressing new requirements for banks to develop a ‘single customer view’ systems capability, tailored to generate information required by FSCS in order to facilitate the early payment by the Scheme of compensation to depositors. The industry is expected to have the prescribed Single Customer View in place by end-2010.
The FSA, in their 2009/10 Business Plan, emphasised the strengthening of their focus on ‘Treating Customers Fairly’. The Group continues to undertake a process of continuous improvement of management information, and root cause analysis of customer issues, in order to demonstrate its commitment to treating customers fairly throughout the product lifecycle.
The Group also continues to co-operate with the Information Commissioner’s Office, the UK’s independent public body set up to promote access to official information and to protect personal information. The Group continues to improve its processes in line with changing guidelines in order to meet information security requirements.
European Union/Global developments
In the EU, the Group has also responded to a number of proposals for regulatory and legislative change, including further proposed amendments to the Capital Requirements Directive and proposals for establishing new EU regulatory authorities, which are aimed at significantly strengthening EU level oversight and coordination of national supervisors. The Group also follows closely the work (and recommendations) of the G7 and G20, as well as international standard setters such as the Basel Committee on Banking Supervision. Of particular note was the Committee’s initial proposals for major changes to the quality and quantum of banks’ regulatory capital, which were published in December 2009. The Group is actively reviewing these, which the Basel Committee is aiming to finalise by end-2010, for implementation from end-2012 onwards.
United States
In the US the Group engages constructively with regulators and other bodies on regulatory and legislative change and seeks to ensure proper implementation and compliance. Current issues include mortgage reform and student lending.
Other jurisdictions
The Group is active in monitoring regulatory developments in each country in which it operates to ensure internal policies are sufficient to ensure the effective management of regulatory risk.
Description of property and equipment
The Group operates from a number of locations worldwide, principally in the UK. At 31 December 2009, the Royal Bank and NatWest had 649 and 1,612 retail branches, respectively, in the UK. Ulster Bank has a foot print of 238 branches and an extensive network of business banking offices across Northern Ireland and the Republic of Ireland. US Retail & Commercial had 1,512 retail banking offices (including in-store branches) covering Connecticut, Delaware, Illinois, Massachusetts, Michigan, New Hampshire, New Jersey, New York, Ohio, Pennsylvania, Rhode Island and Vermont. A substantial majority of the UK branches are owned by the Royal Bank, NatWest and their subsidiaries or are held under leases with unexpired terms of over 50 years. The Group’s principal properties include its headquarters at Gogarburn, Edinburgh, its principal offices in London at 135 and 280 Bishopsgate and the Drummond House administration centre located at South Gyle, Edinburgh.
323
Additional information
Total capital expenditure on premises (excluding investment properties), computers and other equipment in the year ended 31 December 2009 was £1,215 million (2008 – £1,406 million; 2007 – £1,792 million).
Major shareholders
Details of major shareholders of the company’s ordinary, B and preference shares are given on page 168.
In December 2008, The Solicitor for the Affairs of Her Majesty’s Treasury (HM Treasury) acquired 22,854 million ordinary shares representing 57.92% of the company’s issued ordinary share capital. During 2009, HM Treasury acquired a further 16,791 million ordinary shares raising their holding to 70.3% of the company’s issued ordinary share capital. In March 2010, the company converted 935,228 non-cumulative dollar preference shares in the company into ordinary shares resulting in approximately 1.6 billion ordinary shares being issued. This increase in the company's issued ordinary share capital resulted in HMT's holding in the company's ordinary shares reducing to approximately 68.4%.
In December 2009, HM Treasury acquired 51 billion B shares in the company representing the entire issued B share capital.
Other than detailed above, there have been no significant changes in the percentage ownership of major shareholders of the company’s ordinary, B and preference shares during the three years ended 24 February 2010. All shareholders within a class of the company’s shares have the same voting rights.
At 24 February 2010, the directors of the company had options to purchase a total of 12,138,546 ordinary shares of the company.
As at 31 December 2009, almost all of the company’s US$ denominated preference shares and American Depository Shares representing ordinary shares were held by shareholders registered in the US. All other shares were predominantly held by shareholders registered outside the US.
Material contracts
The company and its subsidiaries are party to various contracts in the ordinary course of business. Material contracts include the following:
Consortium and Shareholders Agreement (CSA)
On 28 May 2007, Fortis Bank Nederland, the company, Santander and RFS Holdings entered into the CSA. Fortis Bank Nederland acceded to the CSA on 26 July 2007. On 3 October 2008, the Dutch State acquired Fortis Bank Nederland. On 24 December 2008 the Dutch State acceded to the CSA following its acquisition of the shares held by Fortis Bank Nederland in RFS Holdings pursuant to a Deed of Accession entered into between RFS Holdings, the company, Fortis Bank Nederland, Santander and the Dutch State. On 1 April 2010 the CSA was restated. The CSA governs the relationships amongst the parties thereto in relation to the acquisition by RFS Holdings of ABN AMRO (now RBS Holdings N.V.) The CSA as restated details, inter alia, the equity interests in RFS Holdings, the governance of RFS Holdings, the arrangements for the transfer of certain ABN AMRO businesses, assets and liabilities to the Dutch State (previously Fortis Bank Nederland), the company and Santander, further funding obligations of the Dutch State, the company and Santander where funding is required by regulatory authorities in connection with the ABN AMRO businesses, the allocation of Core Tier 1 capital, the allocation of taxes and conduct of tax affairs and the steps that the Dutch State, the company and Santander expect to take to enable the company to become the sole shareholder of RFS Holdings.
Underwriting Agreement
On 22 April 2008, the company, Goldman Sachs International, Merrill Lynch International, UBS and the Royal Bank entered into an underwriting agreement, pursuant to which Merrill Lynch International, Goldman Sachs International and UBS agreed to procure subscribers for, or failing which themselves to subscribe for, ordinary shares not taken up under the Rights Issue, in each case at the relevant issue price. Pursuant to the underwriting agreement, the company agreed to pay certain fees and expenses to Merrill Lynch International, Goldman Sachs International and UBS in consideration for their underwriting commitment. The company gave certain representations and warranties and indemnities to those persons defined as underwriters in the Underwriting Agreement. The liabilities of the company were uncapped as to time and amount.
Sale of Angel Trains
On 6 August 2008, the company completed the sale of Angel Trains Group to a consortium advised by Babcock & Brown for an enterprise value of £3.6 billion.
Sale of Tesco Personal Finance
On 28 July 2008, the company announced that it had agreed to sell its 50 per cent. shareholding in Tesco Personal Finance to its joint venture partner Tesco plc for a cash consideration of £950 million, subject to transaction adjustments. As part of this transaction, the company agreed to continue to provide certain commercial services to Tesco Personal Finance post-completion. The sale completed on 19 December 2008.
First Placing and Open Offer Agreement
Pursuant to a placing and open offer agreement effective as of 13 October 2008 entered into between the company, UBS, Merrill Lynch International and HM Treasury, (i) the company agreed to invite qualifying shareholders to apply to acquire new shares at the issue price of 65.5 pence by way of the First Open Offer, (ii) UBS and Merrill Lynch International were appointed as joint sponsors, joint bookrunners and joint placing agents and agreed to use reasonable endeavours to procure placees to acquire the new shares at not less than the issue price of 65.5 pence on such terms as agreed by HM Treasury on the basis that the new shares placed were subject to clawback to the extent they were taken up under the First Open Offer and (iii) HM Treasury agreed that, to the extent not placed or taken up under the First Open Offer and subject to the terms and conditions set out in the First Placing and Open Offer Agreement, HM Treasury would acquire such new shares itself at the issue price of 65.5 pence.
In consideration of its services under the First Placing and Open Offer Agreement, HM Treasury was paid (i) a commission of 0.5 per cent. of the aggregate value of the new shares at the issue price of 65.5 pence per new share payable on Admission (as defined in the First Placing and Open Offer Agreement) and the second business day after the day on which the First Placing and Open Offer Agreement terminated and (ii) a further commission of 1 per cent. of the aggregate value of the new shares acquired by placees (including HM Treasury) at the issue price of 65.5 pence per new share payable on Admission (as defined in the First Placing and Open Offer Agreement). The company paid all legal and other costs and expenses of HM Treasury, those of UBS and Merrill Lynch International properly incurred and the costs and expenses of HM Treasury’s financial advisers incurred in connection with the First Placing and Open Offer and the preference share issue.
324
Additional information continued
The company also bore all costs and expenses relating to the First Placing and Open Offer and the preference share issue, including (but not limited to) the fees and expenses of its professional advisers, the cost of preparation, advertising, printing and distribution of the First Placing and Open Offer prospectus and all other documents connected with the First Placing and Open Offer and the preference share issue, the listing fees of the FSA, any charges by CREST and the fees of the London Stock Exchange and Euronext.
The company gave certain undertakings to HM Treasury in relation to such matters as mortgage lending, lending to SMEs and Board remuneration. These undertakings were aimed at ensuring that any State aid involved in the potential acquisition of new shares and the company’s potential participation in the Credit Guarantee Scheme to be promoted by HM Treasury as part of its support for the UK banking industry was compatible with the common market under EU law. These constraints will cease to apply when, broadly, it is determined that RBS is no longer in receipt of State aid.
The undertakings the company gave to HM Treasury included the following:
| (i) | no bonus would be awarded to any director for 2008 and any bonuses earned by directors in respect of 2009 will be paid in restricted shares, remuneration will seek to reward long-term value creation and not encourage excessive risk taking (short-term indicators will be taken into account only where fully consistent with long-term value creation and not encouraging excessive risk taking) and directors who are dismissed will receive a severance package which is reasonable and perceived as fair; |
| (ii) | to work with HM Treasury on the appointment of up to three new independent non-executive directors; |
| (iii) | to maintain its SME and mortgage lending availability to at least 2007 levels until the end of 2011 with the active marketing of competitively priced loan products; |
| (iv) | to increase its support to shared equity projects until the end of 2009 in order to assist those in difficulties with their mortgage payments to stay in their homes, either through individual bank schemes or paid into a central fund run by industry; and |
| (v) | to publish an annual report, for each year until 2011, on its lending to SMEs and establish transparent public reporting on both SME and mortgage lending as agreed with HM Treasury. |
The undertakings relating to SME and mortgage lending have been superseded by the Lending Commitments Letter outlined in the Lending Commitments Letter section below. In addition, the company agreed to limit its activities to the higher of: (i) the annual rate of growth of UK nominal GDP in the preceding year; and (ii) the average historical growth of the balance sheets in the UK banking sector during the period 1987-2007, unless there is evidence that the thresholds are exceeded for reasons unrelated to the provision of the aid.
Sale of Bank of China Investment
On 14 January 2009, pursuant to (i) a placing agreement entered into between the company, RBS China Investments S.à r.l. (a Luxembourg incorporated subsidiary of the company) and ABN AMRO Bank N.V., Hong Kong Branch, (ii) a placing agreement entered into between the company, RBS China Investments S.à r.l., ABN AMRO Bank N.V., Hong Kong Branch and Morgan Stanley & Co. International plc, and (iii) a share purchase agreement entered into between RBS China Investments S.à r.l., Primestar Resource Holdings Limited and Orientmax Capital Limited, the company (through RBS China Investments S.à r.l.) sold its entire 4.26 per cent. investment in Bank of China for HKD 18.4 billion.
Second Placing and Open Offer Agreement
Pursuant to a placing and open offer agreement dated 19 January 2009 entered into between the company, UBS, Merrill Lynch International and HM Treasury, (i) the company agreed to invite qualifying shareholders to apply to subscribe for new shares at the issue price of 31.75 pence per new share by way of the Second Open Offer, (ii) UBS and Merrill Lynch International were appointed as joint sponsors, joint bookrunners and joint placing agents and agreed to use reasonable endeavours to procure placees to subscribe for the new shares on such terms as may be agreed by the company and HM Treasury at not less than the issue price of 31.75 pence per new share on the basis that the new shares placed will be subject to clawback to the extent they are taken up under the Second Open Offer and (iii) HM Treasury agreed that, to the extent not placed or taken up under the Second Open Offer and subject to the terms and conditions set out in the Second Placing and Open Offer Agreement, HM Treasury will subscribe for such new shares itself at the issue price of 31.75 pence per new share.
Pursuant to the terms of the Second Placing and Open Offer Agreement, the aggregate proceeds of the Second Placing and Open Offer (net of expenses) were used in full to fund the redemption on Admission (as defined in the Second Placing and Open Offer Agreement) of the preference shares held by HM Treasury at 101 per cent. of their issue price (£5.05 billion) together with the accrued dividend on the preference shares (from and including 1 December 2008 to but excluding the date of Admission (as defined in the Second Placing and Open Offer Agreement)) and the commissions payable to HM Treasury under the Second Placing and Open Offer Agreement.
In consideration of the provision of its services under the Second Placing and Open Offer Agreement, the company paid to HM Treasury (i) a commission of 0.5 per cent. of the aggregate value of the new shares at the issue price of 31.75 pence per new share, payable on the earlier of Admission (as defined in the Second Placing and Open Offer Agreement) and the second business day after the day on which the Second Placing and Open Offer Agreement is terminated and (ii) a further commission of 1 per cent. of the aggregate value of the new shares subscribed for by placees at the issue price of 31.75 pence per new share payable on the date of Admission (as defined in the Second Placing and Open Offer Agreement).
The company paid to each of HM Treasury, UBS and Merrill Lynch International all legal and other costs and expenses (properly incurred in the case of UBS and Merrill Lynch International) and those of HM Treasury’s financial advisers, incurred in connection with the Second Placing and Open Offer, the redemption of the preference shares or any arrangements referred to in the Second Placing and Open Offer Agreement.
325
Additional information
The company also bore all costs and expenses relating to the Second Placing and Open Offer and the preference share redemption, including (but not limited to) the fees and expenses of its professional advisers, the cost of preparation, advertising, printing and distribution of the prospectus dated 16 March 2009 and all other documents connected with the Second Placing and Open Offer and the preference share redemption, the listing fees of the FSA, any charges by CREST and the fees of the London Stock Exchange and Euronext.
HM Treasury is entitled to novate its rights under the Second Placing and Open Offer Agreement to any entity that is owned, directly or indirectly, by HM Treasury.
The company gave certain representations and warranties and indemnities to each of HM Treasury, UBS and Merrill Lynch International under the Second Placing and Open Offer Agreement. The liabilities of the company are unlimited as to time and amount.
The company also gave HM Treasury the following undertakings:
| (i) | to extend the lending commitments made to HM Treasury in the First Placing and Open Offer Agreement in respect of the UK mortgage and SME lending markets. These commitments will now also apply to the company’s lending to larger commercial and industrial companies in the United Kingdom; and |
| (ii) | a commitment to increase the level at which competitively priced lending is made available and actively marketed by the Group in the United Kingdom by £6 billion. |
The company’s commitments described at (i) and (ii) above have been superseded by the Lending Commitments Letter (see below) pursuant to which the company has agreed, among other things, to lend £16 billion above the amount the company has budgeted to lend to UK businesses and £9 billion above the amount the company has budgeted to lend to UK homeowners in the year commencing 1 March 2009, with a commitment to lend at similar levels in the year commencing 1 March 2010. For further details see the Lending Commitments Letter section below.
Preference Share Subscription Agreement
Pursuant to a Preference Share Subscription Agreement effective as of 13 October 2008 between the company and HM Treasury, HM Treasury subscribed for, and the company allotted and issued to HM Treasury, the preference shares for a total consideration of £5 billion. The company and HM Treasury agreed that applications would be made to the UKLA for the preference shares to be admitted to the Official List and to the London Stock Exchange for the preference shares to be admitted to trading on the London Stock Exchange. Pursuant to the Preference Share Subscription Agreement, the company agreed to pay the costs and expenses of both parties in relation to the negotiation of the Preference Share Subscription Agreement and the subscription for, and allotment and issue of, the preference shares (including, without limitation, any stamp duty or stamp duty reserve tax). HM Treasury was entitled to novate its rights under the Preference Share Subscription Agreement to any entity that is owned, directly or indirectly, by HM Treasury.
The Preference Share Subscription Agreement was conditional on the First Placing and Open Offer Agreement becoming unconditional in accordance with its terms.
First Subscription and Transfer Agreements
In connection with the First Placing and Open Offer, the company, Merrill Lynch International, UBS, Computershare and Encuentro Limited entered into several agreements dated 4 November 2008, in respect of the subscription and transfer of ordinary shares and redeemable preference shares in Encuentro Limited. Under the terms of these agreements:
| (i) | the company and UBS and/or Merrill Lynch International agreed to acquire ordinary shares in Encuentro Limited and enter into put and call options in respect of the ordinary shares in Encuentro Limited subscribed for by UBS and/or Merrill Lynch that were exercisable if the First Placing and Open Offer did not proceed; |
| (ii) | Merrill Lynch International or UBS, as applicable, agreed to apply monies received from qualifying shareholders, placees or HM Treasury under the First Placing and Open Offer to subscribe for redeemable preference shares in Encuentro Limited to an aggregate value equal to such monies, after deduction of the amount of certain commissions and expenses; and |
| (iii) | the company agreed to allot and issue the new shares to those persons entitled thereto in consideration of Merrill Lynch International or UBS, as applicable, transferring its holding of redeemable preference shares and ordinary shares in Encuentro Limited to the company. |
Accordingly, instead of receiving cash as consideration for the issue of the new shares, at the conclusion of the First Placing and Open Offer, the company owned the entire issued ordinary and redeemable preference share capital of Encuentro Limited whose only assets were its cash reserves, which represented an amount equivalent to the net proceeds of the First Placing and Open Offer. The company was able to utilise this amount equivalent to the First Placing and Open Offer net proceeds by exercising its right of redemption over the redeemable preference shares it held in Encuentro Limited.
Qualifying shareholders were not party to these arrangements and so did not acquire any direct right against Merrill Lynch International, UBS and Computershare pursuant to these arrangements. The company was responsible for enforcing the other parties’ obligations thereunder.
Pre-accession Commitments Letter
On 26 February 2009, the Royal Bank entered into a deed poll in favour of HM Treasury, pursuant to which the Royal Bank gave a series of undertakings on behalf of each member of the Group, with immediate effect unless otherwise agreed, in relation to the provision of information and the management of the assets, commitments and exposures (the “Proposed Assets”) in the period prior to the Royal Bank’s proposed accession to and participation in the UK Government’s Asset Protection Scheme (APS).
The Royal Bank undertook to HM Treasury, among other things, to:
| (i) | provide all such assistance, information and data as is reasonably requested which is pertinent to the implementation of the APS and the Royal Bank’s potential participation in the APS; |
| (ii) | provide, as soon as practicable, an indicative list of the assets, commitments and exposures that the Royal Bank propose to include within the APS with a view to agreeing such list by 30 April 2009; |
326
Additional information continued
| (iii) | provide, as promptly as practicable, information and data relating to the Proposed Assets reasonably requested for due diligence purposes and to provide certain other information concerning the Group’s business and the financial performance and risk of the Proposed Assets; |
| (iv) | provide access to the Group’s premises, books, records, senior executives, relevant personnel and professional advisers on reasonable terms; |
| (v) | consult with HM Treasury regarding the management and operations of the Proposed Assets and to ensure that the management of the Proposed Assets is in accordance with usual business practices and also without regard to the possible benefits under the APS; |
| (vi) | develop and, subject to market conditions, implement a liability management plan which is designed to enable the Group to meet certain Core Tier 1 Capital targets for 2009; and |
| (vii) | use best endeavours (giving regard to reasonable operational requirements) to maintain regular, adequate and effective monitoring, reporting, risk management and audit controls and procedures in order, among other things, to ensure that risks relating to key business processes which affect the Proposed Assets are identified, assessed and reported and are managed and mitigated appropriately. |
In addition, the Royal Bank agreed in principle that, if and only if the Royal Bank accedes to the APS, it would not claim, and would disclaim, certain UK tax losses and allowances arising to members of the Group in respect of any accounting period ending on or after 31 December 2008, provided that this undertaking would not apply in respect of any such tax benefits arising in the earlier of (a) the first accounting period beginning more than five years after the relevant accession date and (b) the first accounting period beginning after the relevant accession date in which the Group becomes profitable.
The company’s commitments, described in this section have been superseded by the Scheme Rules and the Accession Agreement, (for details of the Accession agreement, see below), with the exception of a commitment to inform the Department for Business, Innovation and Skills prior to making significant reductions in the level of lending being made available to certain borrowers or counterparties, which will apply until 28 February 2011, in line with the duration of the commitments under the Lending Commitments Letter described below.
Lending Commitments Letter
On 26 February 2009, the company entered into a deed poll in favour of certain UK Government departments under which it undertook to support lending to creditworthy borrowers in the UK in a commercial manner with effect from 1 March 2009. On 18 May 2009, the company entered into an amendment to this deed poll which took effect from 29 May 2009 and on 20 November 2009, the company executed a further amendment to this deed poll. This lending commitment was a pre-requisite to the company’s participation in the APS and other Government backed schemes, the objective of which was to reinforce the stability of the financial system and support the recovery of the economy.
Pursuant to this lending commitment, the company agreed to increase its lending in the 12 months commencing 1 March 2009 from its UK banking operations to UK businesses by, in aggregate, £16 billion above the amount previously budgeted .
The company has also made a commitment to increase lending to homeowners, including first time buyers, in the United Kingdom. The company has undertaken to increase its residential mortgage lending by at least £9 billion above the amount previously budgeted in the 12 months commencing 1 March 2009.
Such additional lending is subject to the company’s ordinary course pricing and other terms, and certain commercial, risk, credit and regulatory considerations.
The company has also made a commitment to increase lending to homeowners, including first time buyers, in the United Kingdom. The company has undertaken to increase its residential mortgage lending by at least £9 billion above the amount previously budgeted in the 12 months commencing 1 March 2009 and to maintain in the 12 months commencing 1 March 2010 similar levels of residential mortgage lending as in the 12 months commencing 1 March 2009 subject to adjustment of the commitments by the UK Government departments from time to time.
The company’s compliance with its lending commitments is monitored by the UK Government, and is subject to a reporting process.
The company has also made certain undertakings as regards marketing in support of its lending commitments and certain other matters relating to its business and residential lending practices and policies. The lending commitments made in the deed poll supersede the commitments given by the company in the First Placing and Open Offer Agreement and the Second Placing and Open Offer Agreement.
On 23 March 2010, the company agreed with the UK government certain adjustments to the above lending commitments for the 2010 commitment period (the 12 month period commencing 1 March 2010), to reflect expected economic circumstances over the period. As part of the amended lending commitments, the company has committed, among other things, to make available gross new facilities, drawn or undrawn, of £50 billion to UK businesses in the period 1 March 2010 to 28 February 2011. In addition, the company has agreed with the UK government to make available £8 billion of net mortgage lending in the 2010 commitment period. This is a decrease of £1 billion on the net mortgage lending target that previously applied to the 2010 commitment period which ends on 28 February 2011, to reflect that the mortgage lending commitment for the 2009 commitment period was increased from £9 billion to £10 billion.
B Share Acquisition and Contingent Capital Agreement
On 26 November 2009, the company and HM Treasury entered into the Acquisition and Contingent Capital Agreement pursuant to which HM Treasury subscribed for the initial B shares and the Dividend Access Share (the “Acquisitions”) and agreed the terms of HM Treasury’s subscription for an additional £8 billion in aggregate in the form of further B Shares (the “Contingent B Shares”), which will be issued on the same terms as the initial B shares. The Acquisitions were subject to the satisfaction of various conditions, including the company having obtained the approval of its shareholders in relation to the Acquisitions.
The company and HM Treasury further agreed the terms of the £8 billion Contingent Subscription of the Contingent B Shares in the Acquisition and Contingent Capital Agreement. For a period of five years from 22 December 2009 or, if earlier, until the occurrence of a termination event or until the company decides (with FSA consent) to terminate such Contingent Subscription (the “Contingent Period”), if the Core Tier 1 ratio of the company falls below five per cent. (and if certain other conditions are met) HM Treasury has committed to subscribe for
327
the Contingent B Shares in no fewer than two tranches of £6 billion and £2 billion (or such smaller amounts as the company and HM Treasury may agree). Any unused portion of the £8 billion may be subscribed in one or more further tranches.
The company may, subject to certain conditions, at any time terminate the Contingent Subscription in whole or in part, with the consent of the FSA. The company is required to pay an annual fee, for the Contingent Period, in relation to the Acquisitions and the Contingent Subscription of £320 million less four per cent. per annum of the value of any B shares subscribed for under the Contingent Subscription. Such fee is payable in cash or, with HM Treasury’s consent, by waiving certain UK tax reliefs that are treated as deferred tax assets or through a further issue of B shares to HM Treasury. The annual fee ceases to be payable on termination of the Contingent Subscription and if the company terminates the Contingent Subscription in part, the fee will reduce proportionately.
The company gave certain representations and warranties to HM Treasury on the date of the Acquisitions and Contingent Capital Agreement, on the date the circular was posted to shareholders, on the first date on which all of the conditions precedent were satisfied, or waived, and on the date of the Acquisitions. The company has agreed to give such representations and warranties again on each date (if any) a Contingent Subscription is triggered and on each date (if any) on which B shares are issued pursuant to a Contingent Subscription.
The company agreed to reimburse HM Treasury for its expenses incurred in connection with the Acquisitions and agreed to do so in connection with the Contingent B shares, if the Contingent Subscription is exercised.
The company agreed to a number of undertakings, including with respect to: (i) restrictions on the payment of dividends or other distributions on, and the redemption of, certain securities; (ii) expectations regarding the repurchase of the B shares by the company; (iii) renegotiations of the terms of the Contingent Subscription as a result of future legislative or regulatory changes; (iv) negotiating in good faith to maintain the status of the B shares and Dividend Access Share as Core Tier 1 capital; and (v) restrictions in relation to the company’s share premium account.
HM Treasury has agreed to waive its statutory pre-emption rights arising out of the B shares and the Dividend Access Share in respect of any future issue of equity securities by the company other than B shares and has agreed to vote its B shares and the Dividend Access Share, as applicable, in favour of each special resolution to disapply its pre-emption rights under the B shares and/or the Dividend Access Share then held by HM Treasury every time they arise. The pre-emption rights arising out of the B shares and the Dividend Access Share will also be disapplied in the Articles of Association.
HM Treasury has agreed that it shall not be entitled to exercise its option to convert B shares into ordinary shares to the extent that it holds more than 75 per cent. of the ordinary shares of the company or to the extent that the exercise of such option would result in it holding more than 75 per cent. of the ordinary shares of the company.
HM Treasury has agreed that it shall not be entitled to vote the B shares or the Dividend Access Share to the extent that votes cast on such B shares and the Dividend Access Share, together with any other votes which HM Treasury is entitled to cast in respect of any other ordinary shares held by or on behalf of HM Treasury, would exceed 75 per cent. of the total votes eligible to be cast on a resolution proposed at a general meeting of the company.
For as long as it is a substantial shareholder of the company (within the meaning of the UKLA’s Listing Rules), HM Treasury has undertaken not to vote on related party transaction resolutions at general meetings and to direct that its affiliates do not so vote.
Accession Agreement and the UK Asset Protection Scheme Terms and Conditions
The company acceded to the APS through an accession agreement (the “Accession Agreement”) entered into with HM Treasury, which became effective on 22 December 2009. The Accession Agreement incorporates the terms and conditions of the APS set out in the document entitled ‘UK Asset Protection Scheme Terms and Conditions’ which is available on HM Treasury’s website (the ‘Scheme Conditions’). The Accession Agreement which incorporates the Scheme Conditions is accounted for as a credit derivative and it tailors the APS to the company (by, amongst other things, setting applicable bank-specific thresholds and addressing a limited number of other bank-specific issues).
Under the APS, HM Treasury is liable to make payments to the company in respect of a pre-defined pool of assets and exposures (the “Covered Assets”) in respect of which a specified failure to pay, bankruptcy or restructuring trigger occurs or is deemed to occur. Payments under the APS are intended to protect the company, over time, for 90% of the amount by which cumulative losses on the whole portfolio of Covered Assets (as reduced by cumulative recoveries on the portfolio) exceed a fixed first loss threshold of £60 billion. Cumulative losses (as reduced by cumulative recoveries) below the first loss threshold, and a 10% vertical slice of any cumulative losses (as reduced by cumulative recoveries) exceeding the first loss threshold, are for the account of the company.
Protection under the APS is, subject to various requirements under the Scheme Conditions, provided in respect of the Covered Assets on the company’s consolidated balance sheet as at 31 December 2008 with an aggregate covered amount of £282 billion. Protection under the APS may be lost or limited in certain specified circumstances, including the failure of a Covered Asset to satisfy certain asset eligibility criteria set out in the Scheme Conditions.
During the life of the APS, the company will pay HM Treasury a non-refundable annual fee (payable in advance) of £700 million per annum for the first three years of the APS and £500 million per annum until the earlier of (i) the date of termination of the APS and (ii) 31 December 2099. The annual fee can, subject to HM Treasury’s consent, be paid wholly or partly by means of the waiver of certain UK tax reliefs that are treated as deferred tax assets or funded by the issuance of additional B shares to HM Treasury.
328
Additional information continued
The company has the right, in certain circumstances, to withdraw from the APS permanently all or part of a Covered Asset. In addition, the company contractually has the right to terminate the APS exercisable at any time provided that the FSA has confirmed in writing to HM Treasury that it has no objection to the proposed termination. An exit fee and, potentially, a refund of HM Treasury’s net payments under the APS are payable by the company upon such termination. The Scheme Conditions also contain various provisions and restrictions on the management and administration of the Covered Assets and certain related assets. The company is obliged to manage such assets in accordance with the asset management objective, which is to maximise the expected net present value of such assets (discounted at an HM Treasury rate), including by minimising losses and potential losses and maximising recoveries and potential recoveries. The company also has monitoring and reporting obligations under the Scheme Conditions which are aimed at the transparency in respect of the Covered Assets to enable HM Treasury to manage and assess its exposure under the APS. In addition, the company has to establish a separate governance structure for the purposes of the APS. Further, the Scheme Conditions and the Accession Agreement also contain requirements for the development of a remuneration policy for the Group and specific remuneration requirements for certain officers and employees of the company.
HM Treasury has the right to appoint one or more step-in managers to exercise extensive step-in rights in relation to all or some of the Covered Assets upon the occurrence of certain specified trigger events.
Certain Scheme Conditions are subject to modification at any time with retrospective effect at the discretion of HM Treasury without the company’s consent. The modification rights arise broadly and subject to certain conditions where the operation, interpretation or application of such Scheme Conditions conflicts with any of the overriding general principles set out in the Scheme Conditions.
There are material restrictions on the form and substance of announcements or public statements (including any required by law or the rules of any securities exchange) made by the Group in relation to the APS or to HM Treasury in connection with the APS without HM Treasury’s consent.
In connection with its participation in the APS, the company has agreed to a number of behavioural commitments in respect of lending for businesses in the UK, personal current accounts in the UK as well as to develop and implement a capital optimisation exercise designed to increase the Group’s Core Tier 1 capital.
Second Subscription and Transfer Agreements
In connection with the B share Issue which took place on 22 December 2009, the company, HM Treasury and Aonach Mor Limited entered into several agreements, in respect of the subscription and transfer of ordinary shares and redeemable preference shares in Aonach Mor Limited. Under the terms of these agreements:
| (i) | the company and HM Treasury acquired ordinary shares in Aonach Mor Limited and entered into put and call options in respect of the ordinary shares in Aonach Mor Limited subscribed for by HM Treasury that would have been exercisable if the B share issue had not proceeded; |
| (ii) | HM Treasury applied monies paid under the B share issue to subscribe for redeemable preference shares in Aonach Mor Limited to an aggregate value equal to such monies; and |
| (iii) | the company allotted and issued the B shares to HM Treasury in consideration of HM Treasury transferring its holding of redeemable preference shares and ordinary shares in Aonach Mor Limited to the company. |
Accordingly, instead of receiving cash as consideration for the issue of the B shares, at the conclusion of the B share issue the company owned the entire issued ordinary and redeemable preference share capital of Aonach Mor Limited whose only assets are its cash reserves, which represent an amount equivalent to the proceeds of the B share issue. The company is able to utilise this amount equivalent to the B share issue net proceeds by exercising its right of redemption over the redeemable preference shares it holds in Aonach Mor Limited.
The Tax Loss Waiver
On 26 November 2009, the company entered into three agreements (together comprising the Tax Loss Waiver) which provide the right, at the company‘s option, subject to HM Treasury consent, to satisfy all or part of the annual fee in respect of the APS or the Contingent Subscription arrangement, and the exit fee payable in connection with any termination of the Group’s termination in the APS (but not the refund of the net payments it has received from HM Treasury under the APS), by waiving the entitlement to certain UK tax reliefs that are treated as deferred tax assets. The Tax Loss Waiver contains undertakings designed to prevent the Group from engaging in arrangements which have a main purpose of reducing the net cost to the Group of any waiver of tax reliefs pursuant to the Tax Loss Waiver.
329
Additional information
State Aid Commitment Deed
As a result of the State aid granted to the company, it was required to work with HM Treasury to submit a State aid restructuring plan to the European Commission, which has now been approved under the State aid rules. The company has agreed a series of measures to be implemented over a four year period, which supplement the measures in the company’s strategic plan.
The Group entered into a State Aid Commitment Deed with HM Treasury which provides that the Group will comply or procure compliance with these measures and behavioural commitments. The Group agreed to do all acts and things necessary to ensure HM Treasury’s compliance with its obligations under any European Commission decision approving State aid to the Group.
The State Aid Commitment Deed also provides that if the European Commission adopts a decision that the UK Government must recover any State aid (a “Repayment Decision”) and the recovery order of the Repayment Decision has not been annulled or suspended by the Court of First Instance or the European Court of Justice, then the Group must repay HM Treasury any aid ordered to be recovered under the Repayment Decision.
The State Aid Commitment Deed also provides for the Group’s undertakings in respect of State aid to be modified in certain limited circumstances. However, HM Treasury has undertaken that it will not, without the consent of the Group, agree modifications to the Group’s undertakings with respect to State aid which are significantly more onerous to the Group than those granted in order to obtain the State aid approval.
State Aid Costs Reimbursement Deed
Under the State Aid Costs Reimbursement Deed, the Group has agreed to reimburse HM Treasury for fees, costs and expenses associated with the State aid and State aid approval.
Exchange Offers and Tender Offers
Pursuant to two Dealer Management Agreements dated 26 March 2009 entered into between (i) RBS Financing Limited, the Royal Bank, UBS Limited and HSBC Bank plc and (ii) the company, RBS Financing Limited, Greenwich Capital Markets Inc., UBS Securities LLC and HSBC Securities (USA) Inc. and related offering memoranda dated the same date, RBS Financing Limited, a wholly-owned subsidiary of the company, invited (1) holders of certain existing Tier 1 capital and upper Tier 2 capital securities of the Group to offer to exchange any or all of such securities for new senior unsecured notes of the company and (2) holders of certain existing Tier 1 capital and upper Tier 2 capital securities of the Group to tender any or all of such securities for purchase for cash. As a result of the exchange offers and tender offers, the Group realised an aggregate pre-tax gain of £4.6 billion (including gains from associated hedges).
Agreement by RBS Sempra Commodities to sell its metals, oil and European energy business lines
On 16 February 2010, the company announced that RBS Sempra Commodities, a joint venture owned by RBS plc and Sempra Energy, had agreed to sell to J.P. Morgan its metals, oils and European energy business lines for a total cash consideration equal to tangible net asset value plus a premium of US$468 million, US$1.7 billion as at 30 November 2009 (unaudited), of which RBS's share post partner distributions will be approximately 47 per cent. Completion of the transaction is subject to certain conditions including regulatory approvals.
ADR payment information
Fees paid by ADR holders
The depositary collects its fees for delivery and surrender of ADSs directly from investors depositing shares or surrendering ADSs for the purpose of withdrawal or from intermediaries acting for them. The depositary collects fees for making distributions to investors by deducting those fees from the amounts distributed or by selling a portion of distributable property to pay the fees. The depositary may collect its annual fee for depositary services by deductions from cash distributions or by directly billing investors or by charging the book-entry system accounts of participants acting for them. The depositary may generally refuse to provide fee-attracting services until its fees for those services are paid.
Persons depositing or withdrawing shares must pay: | For: |
| $5.00 (or less) per 100 ADSs (or portion of 100 ADSs) | • | Issuance of ADSs, including issuances resulting from a distribution of shares or rights or other property | |
| • | Cancellation of ADSs for the purpose of withdrawal, including if the deposit agree-ment terminates | ||
| $.02 (or less) per ADS | • | Any cash distribution to ADS registered holders | |
| A fee equivalent to the fee that would be payable if securities distributed to you had been shares and the shares had been deposited for issuance of ADSs | • | Distribution of securities distributed to holders of deposited securities which are distributed by the depositary to ADS registered holders | |
| $.02 (or less) per ADSs per calendar year | • | Depositary services | |
| Registration or transfer fees | • | Transfer and registration of shares on our share register to or from the name of the depositary or its agent when you deposit or withdraw shares | |
| Expenses of the depositary | • | Cable, telex and facsimile transmissions (when expressly provided in the deposit agreement) | |
| • | Converting foreign currency to U.S. dollars | ||
| Taxes and other governmental charges the depositary or the custodian have to pay on any ADS or share underlying an ADS, for example, stock transfer taxes, stamp duty or withholding taxes | • | As necessary | |
| Any charges incurred by the depositary or its agents for servicing the deposited securities | • | As necessary |
Fees Incurred in Past Annual Period
From 1 January 2009 to 26 April 2010, the Company received from the depositary $850,000 for continuing annual stock exchange listing fees, standard out-of-pocket maintenance costs for the ADRs (consisting of the expenses of postage and envelopes for mailing annual and interim financial reports, printing and distributing dividend checks, electronic filing of U.S. Federal tax information, mailing required tax forms, stationery, postage, facsimile, and telephone calls), any applicable performance indicators relating to the ADR facility, underwriting fees and legal fees.
Fees to be Paid in the Future
The Bank of New York Mellon, as depositary, has agreed to reimburse the Company for expenses they incur that are related to establishment and maintenance expenses of the ADS program. The depositary has agreed to reimburse the Company for its continuing annual stock exchange listing fees. The depositary has also agreed to pay the standard out-of-pocket maintenance costs for the ADRs, which consist of the expenses of postage and envelopes for mailing annual and interim financial reports, printing and distributing dividend checks, electronic filing of U.S. Federal tax information, mailing required tax forms, stationery, postage, facsimile, and telephone calls. It has also agreed to reimburse the Company annually for certain investor relationship programs or special investor relations promotional activities. In certain instances, the depositary has agreed to provide additional payments to the Company based on any applicable performance indicators relating to the ADR facility. There are limits on the amount of expenses for which the depositary will reimburse the Company, but the amount of reimbursement available to the Company is not necessarily tied to the amount of fees the depositary collects from investors.
The depositary collects its fees for delivery and surrender of ADSs directly from investors depositing shares or surrendering ADSs for the purpose of withdrawal or from intermediaries acting for them. The depositary collects fees for making distributions to investors by deducting those fees from the amounts distributed or by selling a portion of distributable property to pay the fees. The depositary may collect its annual fee for depositary services by deduction from cash distributions or by directly billing investors or by charging the book-entry system accounts of participants acting for them. The depositary may generally refuse to provide fee-attracting services until its fees for those services are paid.
330
| Shareholder information |
| Contents |
332 | Financial calendar |
332 | Shareholder enquiries |
333 | Capital gains tax |
333 | Analyses of ordinary shareholders |
334 | Trading market |
337 | Dividend history |
338 | Taxation for US Holders |
342 | Exchange controls |
342 | Memorandum and Articles of Association |
342 | Incorporation and registration |
354 | Code of conduct |
354 | Documents on display |
355 | Glossary of terms |
360 | Important addresses |
360 | Principal offices |
331
Shareholder information
Financial calendar
| Annual General Meeting | 28 April 2010 at 1pm Edinburgh International Conference Centre, The Exchange, Morrison Street, Edinburgh |
| Interim results | August 2010 |
Shareholder enquiries
Shareholdings in the company may be checked by visiting the ‘Shareholder Services’ section of our website (www.rbs.com/shareholder). You will need the shareholder reference number printed on your share certificate or tax voucher to gain access to this information.
You may also check your shareholding by contacting our Registrar:
Computershare Investor Services PLC
The Pavilions
Bridgwater Road
Bristol BS99 6ZZ
Telephone: +44 (0)870 702 0135
Fax: +44 (0)870 703 6009
Web: www.investorcentre.co.uk/contactus
Shareholders may also download forms via the ‘Shareholder Services’ section of our website (www.rbs.com/shareholder).
Braille and audio Annual Review and Summary Financial Statement
Shareholders requiring a Braille or audio version of the Annual Review and Summary Financial Statement should contact the Registrar on +44 (0)870 702 0135.
ShareGift
The company is aware that shareholders who hold a small number of shares may be retaining these shares because dealing costs make it uneconomical to dispose of them. ShareGift, the charity share donation scheme is a free service operated by The Orr Mackintosh Foundation (registered charity 1052686) to enable shareholders to donate shares to charity.
Should you wish to donate your shares to charity in this way you should contact ShareGift for further information:
ShareGift, The Orr Mackintosh Foundation,
17 Carlton House Terrace, London SW1Y 5AH
Tel: +44 (0)20 7930 3737
www.sharegift.org
| Dividends | ||
| Payment dates: | ||
| Cumulative preference shares | 28 | May and 31 December 2010 |
| Non-cumulative preference shares | 31 | March, 30 June, |
| 30 | September and | |
| 31 | December 2010 | |
| Ex-dividend dates: | ||
| Cumulative preference shares | 28 | April 2010 |
| Record dates: | ||
| Cumulative preference shares | 30 | April 2010 |
For further information on the payment of dividends, see page 337.
Donating your shares in this way will not give rise to either a gain or a loss for UK capital gains tax purposes and you may be able to reclaim UK income tax on gifted shares. Further information can be obtained from HM Revenue & Customs.
Warning to shareholders – boiler room scams
Over the last few years, many companies have become aware that their shareholders have received unsolicited phone calls or correspondence concerning investment matters. These are typically from overseas based ‘brokers’ who target UK shareholders, offering to sell them what often turn out to be worthless or high risk shares in US or UK investments. These operations are commonly known as ‘boiler rooms’. These ‘brokers’ can be very persistent and extremely persuasive, and a 2006 survey by the Financial Services Authority (FSA) has reported that the average amount lost by investors is around £20,000.
It is not just the novice investor that has been duped in this way; many of the victims had been successfully investing for several years. Shareholders are advised to be very wary of any unsolicited advice, offers to buy shares at a discount or offers of free company reports. If you receive any unsolicited investment advice:
● | Make sure you get the correct name of the person and organisation; |
● | Check that they are properly authorised by the FSA before getting involved by visiting www.fsa.gov.uk/pages/register; |
● | Report the matter to the FSA either by calling +44 (0)300 500 5000 or visiting www.moneymadeclear.fsa.gov.uk; and |
● | If the calls persist, hang up. |
If you deal with an unauthorised firm, you will not be eligible to receive payment under the Financial Services Compensation Scheme. The FSA can be contacted by completing an online form at www.moneymadeclear.fsa.gov.uk/contactus.
Details of any share dealing facilities that the company endorses will be included in company mailings.
More detailed information on this or similar activity can be found on the FSA website www.moneymadeclear.fsa.gov.uk.
332
Shareholder information
Capital gains tax
For shareholders who held RBS ordinary shares at 31 March 1982, the market value of one ordinary share held was 103p. After adjusting for the following:
● | the 1 March 1985 rights issue; |
● | the 1 September 1989 capitalisation issue; |
● | the bonus issue of Additional Value Shares on 12 July 2000; |
● | the 8 May 2007 bonus issue; |
● | the 6 June 2008 rights issue; and |
● | the 15 September 2008 capitalisation issue, |
the adjusted 31 March 1982 base value of one ordinary share held currently is 83.3p. Further adjustments will be necessary for shareholders who took up their basic entitlement under the 1 December 2008 and/or 14 April 2009 open offers.
For shareholders who held NatWest ordinary shares at 31 March 1982, the market value of one ordinary share held was 91.2p for shareholders who accepted the basic terms of the RBS offer. This takes account of the following:
● | the August 1984 rights issue of NatWest ordinary shares; |
● | the June 1986 rights issue of NatWest ordinary shares; |
● | the June 1989 bonus issue of NatWest ordinary shares; |
● | the bonus issue of Additional Value Shares on 12 July 2000; |
● | the 8 May 2007 bonus issue; |
● | the 6 June 2008 rights issue; and |
● | the 15 September 2008 capitalisation issue. |
Further adjustments to the adjusted 31 March 1982 value will be necessary for shareholders who took up their basic entitlement under the 1 December 2008 and/or 14 April 2009 open offers.
The information set out above is intended as a general guide only and is based on current United Kingdom legislation and HM Revenue & Customs practice as at this date. This information deals only with the position of individual shareholders who are resident in the United Kingdom for tax purposes, who are the beneficial owners of their shares and who hold their shares as an investment. It does not deal with the position of shareholders other than individual shareholders, shareholders who are resident outside the United Kingdom for tax purposes or certain types of shareholders, such as dealers in securities.
| Analyses of ordinary shareholders | ||||||||||||
| Number | ||||||||||||
| of shares | ||||||||||||
| At 31 December 2009 | Shareholdings | – millions | % | |||||||||
| Individuals | 216,834 | 1,205.3 | 2.1 | |||||||||
| Banks and nominee companies | 19,579 | 54,118.0 | 96.0 | |||||||||
| Investment trusts | 169 | 37.1 | 0.1 | |||||||||
| Insurance companies | 223 | 3.7 | 0.1 | |||||||||
| Other companies | 1,654 | 694.6 | 1.2 | |||||||||
| Pension trusts | 39 | 2.7 | — | |||||||||
| Other corporate bodies | 99 | 304.3 | 0.5 | |||||||||
| 238,597 | 56,365.7 | 100.0 | ||||||||||
| Range of shareholdings: | ||||||||||||
| 1 – 1,000 | 75,577 | 32.9 | 0.1 | |||||||||
| 1,001 – 10,000 | 131,549 | 486.5 | 0.8 | |||||||||
| 10,001 – 100,000 | 29,634 | 673.7 | 1.2 | |||||||||
| 100,001 – 1,000,000 | 1,161 | 320.0 | 0.6 | |||||||||
| 1,000,001 – 10,000,000 | 473 | 1,601.3 | 2.8 | |||||||||
| 10,000,001 and over | 203 | 53,251.3 | 94.5 | |||||||||
| 238,597 | 56,365.7 | 100.0 | ||||||||||
333
Shareholder information continued
Trading market
Non-cumulative dollar preference shares
On 26 March 1997, 8 February 1999, 30 September 2004, 26 August 2004, 19 May 2005, 9 November 2005, 25 May 2006, 27 December 2006, 28 June 2007, 27 September 2007 and 4 October 2007 the company issued the following American Depository Shares (ADSs) representing non-cumulative dollar preference shares of the company, in the United States, which were outstanding at 31 December 2009:
8,000,000 Series F (“Series F ADSs”) representing 8,000,000 non-cumulative dollar preference shares, Series F;
12,000,000 Series H (“Series H ADSs”) representing 12,000,000 non-cumulative dollar preference shares, Series H;
34,000,000 Series L (“Series L ADSs”) representing 34,000,000 non-cumulative dollar preference shares, Series L;
37,000,000 Series M (“Series M ADSs”) representing 37,000,000 non-cumulative dollar preference shares, Series M;
40,000,000 Series N (“Series N ADSs”) representing 40,000,000 non-cumulative dollar preference shares, Series N;
22,000,000 Series P (“Series P ADSs”) representing 22,000,000 non-cumulative dollar preference shares, Series P;
27,000,000 Series Q (“Series Q ADSs”) representing 27,000,000 non-cumulative dollar preference shares, Series Q;
26,000,000 Series R (“Series R ADSs”) representing 26,000,000 non-cumulative dollar preference shares, Series R;
38,000,000 Series S (“Series S ADSs”) representing 38,000,000 non-cumulative dollar preference shares, Series S;
64,000,000 Series T (“Series T ADSs”) representing 64,000,000 non-cumulative dollar preference shares, Series T; and
15,000 Series U (“Series U ADSs”) representing 15,000 non-cumulative dollar preference shares, Series U.
Each of the respective ADSs set out above represents the right to receive one corresponding preference share, and is evidenced by an American Depository Receipt (ADR) and is listed on the New York Stock Exchange, a subsidiary of NYSE Euronext (NYSE).
The ADRs evidencing the ADSs above were issued pursuant to Deposit Agreements, among the company, The Bank of New York, as depository, and all holders from time-to-time of ADRs issued thereunder. Currently, there is no non-United States trading market for any of the non-cumulative dollar preference shares. All of the non-cumulative dollar preference shares are held by the depository, as custodian, in bearer form.
At 31 December 2009, there were 99 registered shareholders of Series F ADSs, 66 registered shareholders of Series H ADSs, 29 registered shareholders of Series L ADSs, 7 registered shareholders of Series M ADSs, 39 registered shareholders of Series N ADSs, 42 registered shareholders of Series P ADSs, 14 registered shareholders of Series Q ADSs, 2 registered shareholders of Series R ADSs, 5 registered shareholders of Series S ADSs, 24 registered shareholders of Series T ADSs and 1 registered shareholder of Series U ADSs.
PROs
In August 2001, the company issued US$1.2 billion of perpetual regulatory tier one securities (PROs) in connection with a public offering in the United States. The PROs are listed on the NYSE.
ADSs representing ordinary shares
In October 2007, the company listed ADSs, each representing one ordinary share nominal value 25p each (or a right to receive one ordinary share), and evidenced by an ADR or uncertificated securities, on the NYSE. With effect from 7 November 2008, the ratio of one ADS representing one ordinary share changed to one ADS representing 20 ordinary shares. As of 31 December 2009, 14.2 million ADSs were outstanding. The ADSs were issued in connection with the company’s bid for the outstanding share capital of ABN AMRO Holding N.V.
The ADSs described in the above paragraph were issued pursuant to a Deposit Agreement, among the company, The Bank of New York Mellon, as depository, and all owners and holders from time to time of ADSs issued thereunder. The ordinary shares of the company are listed and traded on the London Stock Exchange. All ordinary shares are deposited with the principal London office of The Bank of New York Mellon, as custodian for the depository.
334
Shareholder information
The following table shows, for the periods indicated, the high and low sales prices for each of the outstanding ADSs representing non-cumulative dollar preference shares and PROs, as reported on the NYSE or NASDAQ:
| Series F | Series H | Series L | Series M | Series N | Series P | Series Q | Series R | Series S | Series T | Series U | ||||
| Figures in US$ | ADSs | ADSs | ADSs | ADSs | ADSs | ADSs | ADSs | ADSs | ADSs | ADSs | ADSs | PROs(1 | ) | |
| By month | ||||||||||||||
| March 2010 | High | 20.51 | 19.58 | 16.61 | 14.23 | 13.95 | 14.07 | 14.21 | 13.92 | 14.12 | 14.94 | 66.00 | 84.75 | |
| Low | 19.31 | 18.55 | 15.55 | 12.70 | 12.63 | 12.63 | 13.08 | 12.56 | 13.01 | 13.76 | 61.50 | 80.63 | ||
| February 2010 | High | 19.76 | 18.71 | 15.97 | 13.22 | 13.23 | 13.01 | 13.32 | 13.22 | 13.33 | 14.24 | 61.50 | 80.75 | |
| Low | 17.42 | 16.21 | 14.31 | 11.35 | 11.23 | 11.18 | 11.68 | 11.09 | 11.65 | 12.56 | 55.50 | 77.50 | ||
| January 2010 | High | 18.34 | 17.26 | 14.60 | 13.45 | 13.40 | 13.22 | 13.60 | 13.03 | 13.45 | 14.62 | 66.00 | 77.67 | |
| Low | 16.57 | 15.10 | 13.67 | 11.50 | 11.40 | 11.15 | 11.81 | 11.02 | 11.73 | 12.90 | 54.00 | 67.13 | ||
| December 2009 | High | 16.04 | 15.19 | 13.40 | 11.36 | 11.29 | 11.06 | 11.29 | 11.06 | 11.25 | 12.08 | 54.00 | 69.25 | |
| Low | 15.34 | 14.16 | 12.70 | 10.25 | 10.10 | 10.10 | 10.53 | 9.87 | 10.22 | 10.96 | 47.00 | 62.00 | ||
| November 2009 | High | 17.06 | 15.90 | 13.65 | 11.25 | 11.05 | 11.16 | 11.69 | 11.05 | 11.12 | 11.83 | 48.50 | 62.25 | |
| Low | 13.26 | 12.80 | 10.13 | 8.41 | 8.38 | 8.20 | 8.41 | 8.33 | 8.36 | 9.21 | 43.00 | 60.12 | ||
| October 2009 | High | 14.82 | 14.09 | 11.77 | 11.00 | 11.00 | 11.00 | 11.41 | 11.00 | 11.15 | 12.47 | 51.95 | 60.38 | |
| Low | 12.40 | 11.59 | 9.51 | 9.40 | 9.50 | 9.28 | 9.91 | 9.17 | 9.75 | 10.73 | 45.00 | 55.62 | ||
| By quarter | ||||||||||||||
| 2010: First quarter | High | 20.51 | 19.58 | 16.61 | 14.23 | 13.95 | 14.07 | 14.21 | 13.92 | 14.12 | 14.94 | 66.00 | 84.75 | |
| Low | 16.57 | 15.10 | 13.67 | 11.35 | 11.23 | 11.15 | 11.68 | 11.02 | 11.65 | 12.56 | 54.00 | 67.13 | ||
2009: Fourth quarter | High | 17.06 | 15.90 | 13.65 | 11.36 | 11.29 | 11.16 | 11.69 | 11.06 | 11.25 | 12.47 | 54.00 | 69.25 | |
| Low | 12.40 | 11.59 | 9.51 | 8.41 | 8.38 | 8.20 | 8.41 | 8.33 | 8.36 | 9.21 | 43.00 | 55.62 | ||
| 2009: Third quarter | High | 18.30 | 16.46 | 13.14 | 14.07 | 14.11 | 13.91 | 15.15 | 13.63 | 14.45 | 16.48 | 57.50 | 55.63 | |
| Low | 12.50 | 10.79 | 9.00 | 9.26 | 9.14 | 9.10 | 9.69 | 8.94 | 9.50 | 10.66 | 39.00 | 50.25 | ||
| 2009: Second quarter | High | 15.73 | 14.10 | 11.36 | 12.80 | 12.54 | 12.36 | 13.20 | 11.98 | 13.11 | 14.24 | 43.25 | 50.50 | |
| Low | 6.99 | 6.13 | 4.90 | 5.62 | 5.40 | 5.25 | 5.76 | 5.25 | 5.74 | 6.00 | 21.25 | 28.00 | ||
| 2009: First quarter | High | 14.19 | 12.99 | 10.89 | 12.25 | 11.75 | 11.50 | 12.18 | 11.30 | 11.84 | 13.51 | 43.96 | 56.03 | |
| Low | 3.00 | 2.77 | 2.21 | 2.63 | 2.55 | 2.43 | 2.64 | 2.37 | 2.58 | 2.78 | 8.98 | 20.00 | ||
| 2008: Fourth quarter | High | 14.10 | 13.40 | 10.94 | 11.36 | 11.70 | 11.10 | 12.20 | 11.16 | 11.98 | 13.09 | 74.78 | 84.10 | |
| Low | 5.10 | 5.00 | 4.37 | 4.51 | 4.20 | 4.50 | 4.34 | 4.16 | 4.36 | 5.43 | 39.84 | 53.60 | ||
| 2008: Third quarter | High | 24.00 | 22.11 | 17.31 | 19.36 | 19.29 | 18.76 | 20.49 | 18.32 | 20.06 | 22.42 | 92.03 | 96.30 | |
| Low | 8.39 | 7.00 | 4.74 | 8.49 | 5.98 | 5.24 | 5.80 | 5.40 | 6.25 | 8.00 | 74.34 | 83.82 | ||
| 2008: Second quarter | High | 25.74 | 24.95 | 20.22 | 22.64 | 22.73 | 22.01 | 23.74 | 21.57 | 22.99 | 24.73 | 96.63 | 93.76 | |
| Low | 21.50 | 20.15 | 16.12 | 17.90 | 18.10 | 17.34 | 18.78 | 17.08 | 18.62 | 20.40 | 85.25 | 89.23 | ||
| 2008: First quarter | High | 25.59 | 25.30 | 22.27 | 24.12 | 24.01 | 23.85 | 24.95 | 23.52 | 24.66 | 25.66 | 105.61 | 107.55 | |
| Low | 24.50 | 24.00 | 18.05 | 20.60 | 19.78 | 20.05 | 21.80 | 19.79 | 20.77 | 23.95 | 86.13 | 93.76 | ||
| By year | ||||||||||||||
| 2009 | High | 18.30 | 16.46 | 13.65 | 14.07 | 14.11 | 13.91 | 15.15 | 13.63 | 14.45 | 16.48 | 57.50 | 69.25 | |
| Low | 3.00 | 2.77 | 2.21 | 2.63 | 2.55 | 2.43 | 2.64 | 2.37 | 2.58 | 2.78 | 8.98 | 20.00 | ||
| 2008 | High | 25.74 | 25.30 | 22.27 | 24.12 | 24.01 | 23.85 | 24.95 | 23.52 | 24.66 | 25.66 | 105.61 | 107.55 | |
| Low | 5.10 | 5.00 | 4.37 | 4.51 | 4.20 | 4.50 | 4.34 | 4.16 | 4.36 | 5.43 | 39.84 | 53.60 | ||
| 2007 | High | 26.50 | 25.85 | 24.75 | 25.99 | 25.75 | 25.83 | 26.91 | 25.50 | 25.20 | 25.48 | 107.98 | 122.07 | |
| Low | 23.60 | 22.70 | 17.90 | 19.68 | 19.50 | 19.25 | 20.71 | 18.96 | 20.26 | 22.61 | 98.34 | 100.49 | ||
| 2006 | High | 27.25 | 25.95 | 24.62 | 26.08 | 25.96 | 26.07 | 26.76 | — | — | — | — | 122.23 | |
| Low | 25.29 | 25.01 | 21.15 | 23.58 | 23.32 | 22.76 | 24.67 | — | — | — | — | 106.06 | ||
| 2005 | High | 28.00 | 26.19 | 24.99 | 26.75 | 26.23 | 25.50 | — | — | — | — | — | 129.57 | |
| Low | 26.02 | 25.20 | 22.67 | 24.77 | 24.70 | 24.60 | — | — | — | — | — | 116.70 | ||
Note:
| (1) | Price quoted as a % of US$1,000 nominal. |
335
Shareholder information continued
Ordinary shares
The following table shows, for the periods indicated, the high and low sales prices for the company’s ordinary shares on the London Stock Exchange, as derived from the Daily Official List of the UK Listing Authority and restated for the effect of the rights issue in June 2008 and the capitalisation issue in September 2008.
| By month | £ | By quarter | £ | By year | £ | |||||
| March 2010 | High | 0.4560 | 2010: First quarter | High | 0.4560 | 2009 | High | 0.5765 | ||
Low | 0.3669 | Low | 0.3125 | Low | 0.1030 | |||||
| February 2010 | High | 0.3861 | 2009: Fourth quarter | High | 0.5055 | 2008 | High | 3.7054 | ||
Low | 0.3125 | Low | 0.2841 | Low | 0.4140 | |||||
| January 2010 | High | 0.3834 | 2009: Third quarter | High | 0.5765 | 2007 | High | 6.0208 | ||
Low | 0.3210 | Low | 0.3546 | Low | 3.3265 | |||||
| December 2009 | High | 0.3512 | 2009: Second quarter | High | 0.4800 | 2006 | High | 5.5770 | ||
| Low | 0.2841 | Low | 0.2510 | Low | 4.6559 | |||||
| November 2009 | High | 0.3940 | 2009: First quarter | High | 0.5500 | 2005 | High | 5.1081 | ||
Low | 0.3299 | Low | 0.1030 | Low | 4.2456 | |||||
October 2009 | High | 0.5055 | 2008: Fourth quarter | High | 1.8620 | |||||
Low | 0.3960 | Low | 0.4140 | |||||||
| 2008: Third quarter | High | 2.4293 | ||||||||
| Low | 1.6098 | |||||||||
| 2008: Second quarter | High | 3.2156 | ||||||||
| Low | 2.0707 | |||||||||
| 2008: First quarter | High | 3.7054 | ||||||||
| Low | 2.5540 |
On 23 April 2010, the closing price of the ordinary shares on the London Stock Exchange was £0.5580, equivalent to $0.8573 per share translated at the Noon Buying Rate of $1.5363 per £1.00 on 23 April 2010.
| ADSs | ||||||||
The following table shows, for the periods indicated, the high and low sales prices for the company’s ordinary ADSs, as reported on the NYSE composite tape and restated for the effect of the rights issue in June 2008 and the capitalisation issue in September 2008. | ||||||||
| By month | US$ | By quarter | US$ | By year | US$ |
| March 2010 | High | 13.61 | 2010: First quarter | High | 13.61 | 2009 | High | 18.95 | ||
| Low | 10.95 | Low | 9.89 | Low | 3.33 |
| February 2010 | High | 11.91 | 2009: Fourth quarter | High | 16.00 | 2008 | High | 149.05 | ||
| Low | 9.89 | Low | 9.17 | Low | 12.20 | |||||
| January 2010 | High | 12.74 | 2009: Third quarter | High | 18.95 | 2007 | High | 189.25 | ||
| Low | 10.21 | Low | 11.45 | Low | 141.18 | |||||
| December 2009 | High | 11.49 | 2009: Second quarter | High | 14.85 | |||||
| Low | 9.17 | Low | 7.35 | |||||||
| November 2009 | High | 13.52 | 2009: First quarter | High | 16.70 | |||||
Low | 11.12 | Low | 3.33 | |||||||
October 2009 | High | 16.00 | 2008: Fourth quarter | High | 66.00 | |||||
Low | 12.96 | Low | 12.20 | |||||||
| 2008: Third quarter | High | 93.85 | ||||||||
| Low | 55.00 | |||||||||
| 2008: Second quarter | High | 129.96 | ||||||||
| Low | 83.71 | |||||||||
| 2008: First quarter | High | 149.05 | ||||||||
| Low | 105.18 |
With effect from 7 November 2008, the ratio of one ADS representing one ordinary share changed to one ADS representing 20 ordinary shares. The prices in the table have been adjusted accordingly.
On 23 April 2010, the closing price of the ordinary ADSs on the New York Stock Exchange was $17.30.
336
Shareholder information
Dividend history
Preference and other non-equity dividends
| 2009 | 2008 | 2007 | 2006 | 2005 | ||||||||||||||
| Subordinated | Subordinated | Subordinated | Subordinated | Subordinated | ||||||||||||||
| liabilities | Equity | liabilities | Equity | liabilities | Equity | liabilities | Equity | liabilities | Equity | |||||||||
| Amount per share | $ | £ | $ | £ | £ | £ | £ | £ | £ | £ | £ | £ | ||||||
Non-cumulative preference shares of US$0.01 | ||||||||||||||||||
| – Series D (redeemed March 2006) | — | — | — | — | 0.21 | 1.13 | ||||||||||||
| – Series E (redeemed January 2007) | — | — | — | 0.04 | 1.10 | 1.12 | ||||||||||||
| – Series F | 1.91 | 1.22 | 1.04 | 0.96 | 1.03 | 1.06 | ||||||||||||
| – Series G (redeemed January 2007) | — | — | — | 0.04 | 1.00 | 1.02 | ||||||||||||
| – Series H | 1.81 | 1.15 | 0.99 | 0.91 | 0.98 | 1.00 | ||||||||||||
| – Series I (redeemed March 2006) | — | — | — | — | 0.20 | 1.10 | ||||||||||||
| – Series J (redeemed November 2005) | — | — | — | — | — | 1.06 | ||||||||||||
| – Series K (redeemed January 2007) | — | — | — | 0.04 | 1.06 | 1.09 | ||||||||||||
| – Series L | 1.44 | 0.92 | 0.78 | 0.72 | 0.78 | 0.79 | ||||||||||||
| – Series M | 1.60 | 1.02 | 0.89 | 0.80 | 0.87 | 0.88 | ||||||||||||
| – Series N | 1.59 | 1.01 | 0.88 | 0.79 | 0.86 | 0.55 | ||||||||||||
| – Series P | 1.56 | 0.99 | 0.87 | 0.78 | 0.85 | 0.13 | ||||||||||||
| – Series Q | 1.69 | 1.07 | 0.94 | 0.84 | 0.53 | — | ||||||||||||
| – Series R | 1.53 | 0.97 | 0.85 | 0.77 | — | — | ||||||||||||
| – Series S | 1.65 | 1.05 | 0.92 | 0.41 | — | — | ||||||||||||
| – Series T | 1.81 | 1.15 | 1.01 | 0.23 | — | — | ||||||||||||
| – Series U | 7,640 | 5,019 | 3,935 | — | — | — | ||||||||||||
| Non-cumulative convertible | ||||||||||||||||||
| preference shares of US$0.01 | ||||||||||||||||||
| – Series 1 | 91.18 | 60.33 | 49.66 | 45.58 | 50.26 | 50.33 | ||||||||||||
| – Series 2 (redeemed March 2005) | — | — | — | — | — | 11.60 | ||||||||||||
| – Series 3 (redeemed December 2005) | — | — | — | — | — | 43.03 | ||||||||||||
| Non-cumulative convertible | ||||||||||||||||||
| preference shares of €0.01 | ||||||||||||||||||
| – Series 1 (redeemed March 2005) | — | — | — | — | — | 11.54 | ||||||||||||
Non-cumulative preference shares of €0.01 | ||||||||||||||||||
| – Series 1 | 79.96 | 49.46 | 46.53 | 39.63 | 37.18 | 41.14 | ||||||||||||
| – Series 2 | 74.36 | 46.00 | 41.79 | 35.52 | 36.22 | — | ||||||||||||
| – Series 3 | 5,052 | 3,125 | 2,782 | — | — | — | ||||||||||||
| Non-cumulative convertible | ||||||||||||||||||
| preference shares of £0.01 | ||||||||||||||||||
| – Series 1 | 119.43 | 73.87 | 73.87 | 73.87 | 73.87 | 73.87 | ||||||||||||
| Non-cumulative preference | ||||||||||||||||||
| shares of £1 | ||||||||||||||||||
| – Series 1 | 131.96 | 81.62 | 80.73 | — | — | — | ||||||||||||
| – Series 2 (redeemed April 2009) | 88.45 | 54.71 | — | — | — | — | ||||||||||||
The Group has undertaken that, unless otherwise agreed with the European Commission, neither the company nor any of its direct or indirect subsidiaries (excluding companies in the ABN AMRO Group) will pay external investors any dividends or coupons on existing hybrid capital instruments (including preference shares, B shares and upper and lower tier 2 instruments) from a date starting not later than 30 April 2010 and for a period of two years thereafter (“the deferral period”), or exercise any call rights in relation to these capital instruments between 24 November 2009 and the end of the deferral period, unless there is a legal obligation to do so. Hybrid capital instruments issued after 24 November 2009 will generally not be subject to the restriction on dividend or coupon payments or call options.
For further information, see Note 7 on the accounts.
337
Shareholder information continued
| Ordinary dividends | |||||
Ordinary dividends per share for prior years in the table below were restated for the effect of the rights issue in June 2008 and the capitalisation issue in September 2008. | |||||
| 2009 | 2008 | 2007 | 2006 | 2005 | ||||||||||||||||
Amount per share and American Depository Share (1) | pence | pence | pence | pence | pence | |||||||||||||||
Interim (2) | — | — | 8.5 | 6.8 | 5.4 | |||||||||||||||
Final (3) | — | — | 19.3 | 18.5 | 14.8 | |||||||||||||||
| Total dividends on equity shares | — | — | 27.8 | 25.3 | 20.2 | |||||||||||||||
Notes:
| (1) | Each American Depository Share represents 20 ordinary shares. The historical amounts listed in the table apply to the ordinary shares, as the American Depositary Shares were not issued until October 2007 as described above under Trading Market. |
| (2) | In 2008, the company issued new ordinary shares by way of a capitalisation issue rather than paying an interim dividend. |
| (3) | Final dividends for each year were proposed in the indicated year and paid in the following year. |
For further information, see Note 8 on the accounts.
Taxation for US Holders
The following discussion summarises certain US federal and UK tax consequences of the acquisition, ownership and disposition of ordinary shares, non-cumulative dollar preference shares, ADSs representing ordinary shares (ordinary ADSs), ADSs representing non-cumulative dollar preference shares (preference ADSs) or PROs by a beneficial owner that is a citizen or resident of the United States or that otherwise will be subject to US federal income tax on a net income basis in respect of the ordinary shares, non-cumulative dollar preference shares, ordinary ADSs, preference ADSs or PROs (a US Holder). This summary assumes that a US Holder is holding ordinary shares, non-cumulative dollar preference shares, ordinary ADSs, preference ADSs or PROs, as applicable, as capital assets. This summary does not address the tax consequences to a US Holder (i) that is resident (or, in the case of an individual, ordinarily resident) in the UK for UK tax purposes, (ii) that carries on a trade, profession or vocation through a branch, agency or permanent establishment in the UK in connection with which their ordinary shares, non-cumulative preference shares, ordinary ADSs, preference ADSs or PROs, are held, used or acquired, or (iii) generally, that is a corporation which alone or together with one or more associated companies, controls, directly or indirectly, 10% or more of the voting stock of the company, nor does this summary address the tax consequences to US Holders subject to special rules, such as certain financial institutions, dealers or traders in securities who use a mark-to-market method of tax accounting, persons holding ordinary shares, non-cumulative dollar preference shares, ordinary ADSs, preference ADSs or PROs as part of a hedging transaction, straddle, wash sale, conversion transaction or integrated transaction or persons entering into a constructive sale with respect to such securities, persons whose functional currency for US federal income tax purposes is not the US dollar, entities classified as partnerships for US federal income tax purposes, tax-exempt entities or persons that own or are deemed to own 10% or more of the voting stock of the company.
The statements and practices set forth below regarding US and UK tax laws, including the US/UK double taxation convention relating to income and capital gains which entered into force on 31 March 2003 (the Treaty), and the US/UK double taxation convention relating to estate and gift taxes (the Estate Tax Treaty), are based on those laws and practices as in force and as applied in practice on the date of this report. This summary is not exhaustive of all possible tax considerations and holders are advised to satisfy themselves as to the overall tax consequences, including specifically the consequences under US federal, state, local and other laws, and possible changes in taxation law, of the acquisition, ownership and disposition of ordinary shares, non-cumulative dollar preference shares, ordinary ADSs, preference ADSs or PROs by consulting their own tax advisers.
The following discussion assumes that the company is not, and will not become, a passive foreign investment company (PFIC) – see ‘Passive Foreign Investment Company considerations’ on page 342.
338
Shareholder information
Ordinary shares, preference shares, ordinary ADSs and preference ADSs
Taxation of dividends
For the purposes of the Treaty, the Estate Tax Treaty and the US Internal Revenue Code of 1986 as amended (the Code), US Holders of ordinary ADSs and preference ADSs should be treated as owners of the ordinary shares and the non-cumulative dollar preference shares underlying such ADSs.
The US Treasury has expressed concerns that parties to whom depositary receipts are released before shares are delivered to the depositary, or intermediaries, in the chain of ownership between US holders and the issuer of the security underlying the depositary receipts may be taking actions that are inconsistent with the claiming of foreign tax credits for US holders of depositary receipts. Such actions would also be inconsistent with the claiming of the reduced rate of US tax applicable to dividends received by certain non-corporate US holders. Accordingly, the availability of the reduced tax rate for dividends received by certain non-corporate US holders of ordinary ADSs could be affected by actions taken by such parties or intermediaries.
The company is not required to withhold UK tax at source from dividend payments it makes or from any amount (including any amounts in respect of accrued dividends) distributed by the company. US Holders who are not resident or ordinarily resident in the UK and who do not carry on a trade, profession or vocation in the UK through a branch, agency or permanent establishment in connection with which their ordinary shares, non-cumulative preference shares, ordinary ADSs or preference ADSs are held, used or acquired will not be subject to UK tax in respect of any dividends received on the relevant shares or ADSs.
Distributions by the company (other than certain pro rata distributions of ordinary shares or rights to receive such shares) will constitute foreign source dividend income for US federal income tax purposes to the extent paid out of the current or accumulated earnings and profits of the company, as determined for US federal income tax purposes. Because the company does not maintain calculations of its earnings and profits under US federal income tax principles, it is expected that distributions will be reported to US Holders as dividends. Payments will not be eligible for the dividends-received deduction generally allowed to corporate US holders.
Subject to applicable limitations that may vary depending upon a holder’s individual circumstances, dividends paid to certain non-corporate US Holders in taxable years beginning before 1 January 2011 will be taxable at a maximum tax rate of 15%. Non-corporate US Holders should consult their own tax advisers to determine whether they are subject to any special rules that limit their ability to be taxed at this favourable rate.
Dividends will be included in a US Holder’s income on the date of the US Holder’s (or in the case of ADSs, the depositary’s) receipt of the dividend. The amount of any dividend paid in pounds sterling or euros to be taken into income by a US Holder will be the US dollar amount calculated by reference to the relevant exchange rate in effect on the date of such receipt regardless of whether the payment is in fact converted into US dollars. If the dividend is converted into US dollars on the date of receipt, the US Holder generally should not be required to recognise foreign currency gain or loss in respect of the dividend income. If the amount of such dividend is not converted into US dollars on the date of receipt, the US Holder may have foreign currency gain or loss.
Taxation of capital gains
A US Holder that is not resident (or, in the case of an individual, ordinarily resident) in the UK will not normally be liable for UK tax on capital gains realised on the disposition of an ordinary share, a non-cumulative dollar preference share, an ordinary ADS or a preference ADS unless at the time of the disposal, in the case of a corporate US Holder, such US Holder carries on a trade in the UK through a permanent establishment or, in the case of any other US Holder, such US Holder carries on a trade, profession or vocation in the UK through a UK branch or agency and, in each case, such ordinary share, non-cumulative dollar preference share, ordinary ADS or preference ADS is or has been used, held or acquired by or for the purposes of such trade (or profession or vocation), carried on through such permanent establishment, branch or agency. Special rules apply to individuals who are temporarily not resident or ordinarily resident in the UK.
A US Holder will, upon the sale or other disposition of an ordinary share, a non-cumulative dollar preference share, an ordinary ADS or a preference ADS, or upon the redemption of a non-cumulative dollar preference share or preference ADS, generally recognise capital gain or loss for US federal income tax purposes (assuming that in the case of a redemption of a non-cumulative dollar preference share or a preference ADS, such US Holder does not own, and is not deemed to own, any ordinary shares or ordinary ADSs of the company) in an amount equal to the difference between the amount realised (excluding in the case of a redemption any amount treated as a dividend for US federal income tax purposes, which will be taxed accordingly) and the US Holder’s tax basis in such share or ADS. This capital gain or loss will be long-term capital gain or loss if the US Holder held the share or ADS so sold, disposed or redeemed for more than one year.
A US Holder who is liable for both UK and US tax on a gain recognised��on the disposal of an ordinary share, a non-cumulative dollar preference share, an ordinary ADS or a preference ADS will generally be entitled, subject to certain limitations, to credit the UK tax against its US federal income tax liability in respect of such gain.
339
Shareholder information continued
Estate and gift tax
Subject to the discussion of the Estate Tax Treaty in the next paragraph, ordinary shares, non-cumulative dollar preference shares, ordinary ADSs or preference ADSs beneficially owned by an individual may be subject to UK inheritance tax (subject to exemptions and reliefs) on the death of the individual or in certain circumstances, if such shares or ADSs are the subject of a gift (including a transfer at less than market value) by such individual. Inheritance tax is not generally chargeable on gifts to individuals made more than seven years before the death of the donor. Ordinary shares, non-cumulative dollar preference shares, ordinary ADSs or preference ADSs held by the trustees of a settlement may also be subject to UK inheritance tax. Special rules apply to such settlements.
An ordinary share, a non-cumulative dollar preference share, an ordinary ADS or a preference ADS beneficially owned by an individual, whose domicile is determined to be the United States for purposes of the Estate Tax Treaty and who is not a national of the UK, will not be subject to UK inheritance tax on the individual’s death or on a lifetime transfer of such share or ADS, except in certain cases where the share or ADS (i) is comprised in a settlement (unless, at the time of the settlement, the settlor was domiciled in the United States and was not a national of the UK); (ii) is part of the business property of a UK permanent establishment of an enterprise; or (iii) pertains to a UK fixed base of an individual used for the performance of independent personal services. The Estate Tax Treaty generally provides a credit against US federal estate or gift tax liability for the amount of any tax paid in the UK in a case where the ordinary share, non-cumulative dollar preference share, ordinary ADS or preference ADS is subject to both UK inheritance tax and US federal estate or gift tax.
UK stamp duty and stamp duty reserve tax (SDRT)
The following is a summary of the UK stamp duty and SDRT consequences of transferring an ADS or ADR in registered form (otherwise than to the custodian on cancellation of the ADS) or of transferring an ordinary share or a non-cumulative dollar preference share. A transfer of a registered ADS or ADR executed and retained in the United States will not give rise to stamp duty and an agreement to transfer a registered ADS or ADR will not give rise to SDRT. Stamp duty or SDRT will normally be payable on or in respect of transfers of ordinary shares or non-cumulative dollar preference shares and accordingly any holder who acquires or intends to acquire ordinary shares or non-cumulative dollar preference shares is advised to consult its own tax advisers in relation to stamp duty and SDRT.
PROs
United States
Payments of interest on a PRO (including any UK withholding tax, as to which see below) will constitute foreign source dividend income for US federal income tax purposes to the extent paid out of the current or accumulated earnings and profits of the company, as determined for US federal income tax purposes. Because the company does not maintain calculations of its earnings and profits under US federal income tax principles, it is expected that distributions will be reported to US Holders as dividends. Payments will not be eligible for the dividends-received deduction generally allowed to corporate US holders. A US Holder who is entitled under the Treaty to a refund of UK tax, if any, withheld on a payment will not be entitled to claim a foreign tax credit with respect to such tax.
Subject to applicable limitations that may vary depending upon a holder’s individual circumstances, dividends paid to certain non-corporate US Holders in taxable years beginning before 1 January 2011 will be taxable at a maximum tax rate of 15%. Non-corporate US Holders should consult their own tax advisers to determine whether they are subject to any special rules that limit their ability to be taxed at this favourable rate. A US Holder will, upon the sale, exchange or redemption of a PRO, generally recognise capital gain or loss for US federal income tax purposes (assuming that in the case of a redemption, such US Holder does not own, and is not deemed to own, any ordinary shares or ordinary ADSs of the company) in an amount equal to the difference between the amount realised (excluding any amount in respect of mandatory interest and any missed payments which are to be satisfied on a missed payment satisfaction date, which would be treated as ordinary income) and the US Holder’s tax basis in the PRO.
A US Holder who is liable for both UK and US tax on gain recognised on the disposal of PROs will generally be entitled, subject to certain limitations, to credit the UK tax against its US federal income tax liability in respect of such gain.
340
Shareholder information
United Kingdom
Taxation of payments on the PROs
Payments on the PROs will constitute interest rather than dividends for UK withholding tax purposes. However, the PROs will constitute ‘quoted eurobonds’ within the meaning of section 987 of the Income Tax Act 2007 and therefore payments of interest will not be subject to withholding or deduction for or on account of UK taxation as long as the PROs remain at all times listed on a ‘recognised stock exchange’ within the meaning of section 1005 of the Income Tax Act 2007, such as the main market of the New York Stock Exchange. In all other cases, an amount must be withheld on account of UK income tax at the basic rate (currently 20%) subject to any direction to the contrary by HM Revenue & Customs under the Treaty and except that the withholding obligation does not apply to payments to persons who the company reasonably believes are within the charge to corporation tax or fall within various categories enjoying a special tax status (including charities and pension funds), or are partnerships consisting of such persons (unless HM Revenue & Customs directs otherwise). Where interest has been paid under deduction of UK withholding tax, US Holders may be able to recover the tax deducted under the Treaty.
Any paying agent or other person by or through whom interest is paid to, or by whom interest is received on behalf of an individual, may be required to provide information in relation to the payment and the individual concerned to HM Revenue & Customs. HM Revenue & Customs may communicate this information to the tax authorities of other jurisdictions.
HM Revenue & Customs confirmed at around the time of the issue of the PROs that interest payments would not be treated as distributions for UK tax purposes by reason of (i) the fact that interest may be deferred under the terms of issue; or (ii) the undated nature of the PROs, provided that at the time an interest payment is made, the PROs are not held by a company which is ‘associated’ with the company or by a ‘funded company’. A company will be associated with the company if, broadly speaking, it is part of the same group as the company. A company will be a ‘funded company’ for these purposes if there are arrangements involving that company being put in funds (directly or indirectly) by the company, or an entity associated with the company. In this respect, HM Revenue & Customs has confirmed that a company holding an interest in the PROs which incidentally has banking facilities with any company associated with the company will not be a ‘funded company’ by virtue of such facilities.
Interest on the PROs constitutes UK source income for UK tax purposes and, as such, may be subject to income tax by direct assessment even where paid without withholding. However, interest with a UK source received without deduction or withholding on account of UK tax will not be chargeable to UK tax in the hands of a US Holder unless, in the case of a corporate US Holder, such US Holder carries on a trade in the UK through a UK permanent establishment or in the case of other US Holders, such persons carry on a trade, profession or vocation in the UK through a UK branch or agency in each case in connection with which the interest is received or to which the PROs are attributable. There are also exemptions for interest received by certain categories of agents (such as some brokers and investment managers).
EU Directive on taxation of savings income
The European Union has adopted a directive regarding the taxation of savings income. The Directive requires member states of the European Union to provide to the tax authorities of other member states details of payments of interest and other similar income paid by a person to an individual or certain other persons resident in another member state, except that Luxembourg and Austria may instead impose a withholding system for a transitional period unless during such period they elect otherwise.
Disposal (including redemption)
A disposal (including redemption) of PROs by a non-corporate US Holder will not give rise to any liability to UK taxation on capital gains unless the US Holder carries on a trade (which for this purpose includes a profession or a vocation) in the UK through a branch or agency and the PROs are, or have been, held or acquired for the purposes of that trade, carried on through such branch or agency.
A transfer of PROs by a US Holder will not give rise to a charge to UK tax on accrued but unpaid interest payments, unless the US Holder is an individual or other non-corporate taxpayer and at any time in the relevant year of assessment or accounting period carries on a trade, profession or vocation in the UK through a branch or agency to which the PROs are attributable.
Annual tax charges
Corporate US Holders of PROs may be subject to annual UK tax charges (or relief) by reference to fluctuations in exchange rates and in respect of profits, gains and losses arising from the PROs, but only if such corporate US Holders carry on a trade, profession or vocation in the UK through a UK permanent establishment to which the PROs are attributable.
341
Shareholder information continued
Inheritance tax
In relation to PROs held through DTC (or any other clearing system), the UK inheritance tax position is not free from doubt in respect of a lifetime transfer, or death of, a US Holder who is not domiciled nor deemed to be domiciled in the UK for inheritance tax purposes; HM Revenue & Customs is known to consider that the situs of securities held in this manner is not necessarily determined by the place where the securities are registered. In appropriate circumstances, there may be a charge to UK inheritance tax as a result of a lifetime transfer at less than market value by, or on the death of, such US Holder. Inheritance tax is not generally chargeable on gifts to individuals made more than seven years before the death of the donor. However, exemption from, or a reduction of, any such UK tax liability may be available under the Estate Tax Treaty (see below). US Holders should consult their professional advisers in relation to such potential liability. PROs beneficially owned by an individual, whose domicile is determined to be the United States for the purposes of the Estate Tax Treaty and who is not a national of the UK, will not be subject to UK inheritance tax on the individual’s death or on a lifetime transfer of the PRO, except in certain cases where the PRO (i) is comprised in a settlement (unless, at the time of the settlement, the settlor was domiciled in the United States and was not a national of the UK); (ii) is part of the business property of a UK permanent establishment of an enterprise; or (iii) pertains to a UK fixed base of an individual used for the performance of independent personal services. The Estate Tax Treaty generally provides a credit against US federal estate or gift tax liability for the amount of any tax paid in the UK in a case where the PRO is subject to both UK inheritance tax and US federal estate or gift tax.
Stamp duty and SDRT
No stamp duty, SDRT or similar tax is imposed in the UK on the issue, transfer or redemption of the PROs.
Passive Foreign Investment Company considerations
A foreign corporation will be a PFIC in any taxable year in which, after taking into account the income and assets of the corporation and certain subsidiaries pursuant to applicable ‘look-through rules’, either (i) at least 75% of its gross income is ‘passive income’ or (ii) at least 50% of the average value of its assets is attributable to assets which produce passive income or are held for the production of passive income. The company does not believe that it was a PFIC for its 2009 taxable year. Although interest income is generally passive income, a special rule allows banks to treat their banking business income as non-passive.
To qualify for this rule, a bank must satisfy certain requirements regarding its licensing and activities. The company believes that it currently meets these requirements. The company’s possible status as a PFIC must be determined annually, however, and may be subject to change if the company fails to qualify under this special rule for any year in which a US Holder holds ordinary shares, non-cumulative dollar preference shares, ordinary ADSs, preference ADSs or PROs. If the company were to be treated as a PFIC in any year during which a US Holder holds ordinary shares, non-cumulative dollar preference shares, ordinary ADSs, preference ADSs or PROs, US Holders would generally be subject to adverse US federal income tax consequences. Holders should consult their own tax advisers as to the potential application of the PFIC rules to the ownership and disposition of the company’s ordinary shares, non-cumulative dollar preference shares, ordinary ADSs, preference ADSs or PROs.
Exchange controls
The company has been advised that there are currently no UK laws, decrees or regulations which would prevent the import or export of capital, including the availability of cash or cash equivalents for use by the Group, or the remittance of dividends, interest or other payments to non-UK resident holders of the company’s securities.
There are no restrictions under the Articles of Association of the company or under UK law, as currently in effect, which limit the right of non-UK resident owners to hold or, when entitled to vote, freely to vote the company’s securities.
Memorandum and Articles of Association
The company’s Memorandum and Articles of Association as in effect at the date of this annual report are registered with the Registrar of Companies of Scotland.
The following information is a summary of certain terms of the company’s Memorandum of Association (the “Memorandum”) and Articles of Association (the “Articles”) as in effect at the date of this Annual Report and certain relevant provisions of the Companies Act 2006 (the “2006 Act”) where appropriate and as relevant to the holders of any class of share. The Articles were last amended on 15 December 2009. The amendments to the Articles were designed to (a) delete references in the Articles to the company’s authorised share capital now that the 2006 Act has abolished the requirement for a company to have an authorised share capital; and (b) make other amendments required in connection with the B Shares issue, the Dividend Access Share Issue the Non-Voting Deferred Shares Series B and the conversion of the company’s convertible preference shares. The following summary description is qualified in its entirety by reference to the terms and provisions of the Memorandum and Articles (and, in the case of the summary description of the non-cumulative preference shares, the B Shares and the Dividend Access Share, by reference to the terms of issue of those shares determined by the Directors pursuant to the Articles prior to allotment). The Memorandum and Articles are registered with the Registrar of Companies of Scotland. Holders of any class of share are encouraged to read the full Memorandum and Articles, which have been filed as an exhibit to this annual report on Form 20-F.
Incorporation and registration
The company was incorporated and registered in Scotland under the Companies Act 1948 as a limited company on 25 March 1968 under the name National and Commercial Banking Group Limited. On 10 March 1982, it changed its name to its present name and was registered under the Companies Acts 1948 to 1980 as a public company with limited liability. The company is registered under Company No. SC 45551.
Purpose and objects
The Memorandum provides, amongst other things, that its objects are to carry on the business of banking in all or any of its aspects and to carry on the business of a holding company. The company’s objects are set out in full in clause 4 of the Memorandum and in terms of the 2006 Act are now deemed to form part of the Articles.
Directors
At each annual general meeting of the company, any Director appointed since the last annual general meeting and any Directors who were not appointed at one of the preceeding two annual general meetings shall retire from office and may offer themselves for re-election by the members. Directors may be appointed by the company by ordinary resolution or by the Board. A director appointed by the Board holds office only until the next annual general meeting, whereupon he will be eligible for re-election. Unless and until otherwise determined by ordinary resolution, the directors (other than alternate directors) shall be not more than twenty five. There is no stipulation in the Articles regarding a minimum number of directors; under the 2006 Act, and in the absence of express provision, the minimum number is two.
342
Shareholder information
A director shall not vote at a meeting of the Board or a committee of the Board on any resolution of the Board concerning a matter in which he has an interest (otherwise than by virtue of his interest in shares, debentures or other securities of, or otherwise in or through, the company) which (together with any interest of any person connected with him) is, to his knowledge, material unless his interests arises only because the resolution relates to one or more of the following matters:
i. the giving of any security or indemnity to him pursuant to the Articles or in respect of money lent, or obligations incurred, by him at the request of, or for the benefit of, the company or any of its subsidiary undertakings;
ii. the giving of any security or indemnity to a third party in respect of a debt or obligation of the company or any of its subsidiary undertakings for which he has assumed responsibility (in whole or in part) under a guarantee or indemnity or by the giving of security;
iii. a proposal concerning an offer of shares, debentures or other securities of the company, or any of its subsidiary undertakings, for subscription or purchase, in which offer he is, or may be, entitled to participate as a holder of securities or in the underwriting or sub-underwriting of which he is to participate;
iv. any proposal concerning any other body corporate in which he is interested, directly or indirectly, whether as an officer or shareholder or otherwise, provided that he is not the holder of shares representing one per cent or more of any class of the equity share capital of such body corporate;
v. any proposal concerning the adoption, modification or operation of a pension fund or retirement, death or disability benefits scheme or employees’ share scheme which relates both to directors and employees of the company or a subsidiary of the company and does not provide any privilege or advantage in respect of any director which it does not accord to the employees to which the fund or scheme relates;
vi. a contract or arrangement for the benefit of the employees of the company or any of its subsidiary undertakings which does not accord him any privilege or advantage not generally accorded to the employees to whom the contract or arrangement relates; and
vii. a proposal concerning any insurance which the company proposes to purchase and/or maintain for the benefit of any directors or for persons who include directors of the company.
Under the 2006 Act, a director must avoid a situation where he has, or can have, a direct or indirect interest that conflicts, or possibly may conflict, with the company’s interests. The 2006 Act allows directors of public companies, where appropriate, to authorise conflicts and potential conflicts where the articles of association contain a provision to this effect. The 2006 Act also allows the articles of association to contain other provisions for dealing with directors’ conflicts of interest to avoid a breach of duty.
343
Shareholder information continued
Authorisation of any matter pursuant to Clause 100 must be approved in accordance with normal board procedures by directors who have no interest in the matter being considered. In taking the decision, the directors must act in a way they consider, in good faith, will be most likely to promote the company’s success. Any authorisation of a matter may be given on or subject to such conditions or limitations as the directors determine, whether at the time of authorisation or subsequently, including providing for the exclusion of the interested directors from the receipt of information or participation in discussion relating to the matter authorised by the directors and providing that interested directors in receipt of confidential information from a third party are not obliged to disclose such information to the company or use the information in relation to the company’s affairs. Any authorization may be terminated by the directors at any time.
A director is not, except as otherwise agreed by him, accountable to the company for any benefit which he, or a person connected with him, derives from any matter authorised by the directors and any contract, transaction or arrangement relating to such matter is not liable to be avoided on the grounds of such benefit.
Borrowing powers
The directors may exercise all the powers of the company to borrow money and to mortgage or charge its undertaking, property and uncalled capital and to issue debentures and other securities, whether outright or as collateral security for any debt, guarantee, liability or obligation of the company, or of any third party.
Qualifying shareholding
Directors are not required to hold any shares of the company by way of qualification.
Classes of shares
The company has issued and outstanding the following 5 general classes of shares, namely ordinary shares, preference shares, non-voting deferred shares, B Shares and a Dividend Access Share, to which the provisions set forth below apply. In addition, the company has authorized as part of its share capital Additional Value Shares (“AVSs”). All of the issued AVSs were converted into non-voting deferred shares in December 2003. The terms of those AVSs are set out in Schedule 4 to the Articles. The terms of the issued B Shares (designated Series 1 Class B Shares) and the Dividend Access Share (designated a Series 1 Dividend Access Share) were determined by the directors pursuant to the Articles prior to the time of allotment, and apply as if they were set out in the Articles.
Dividends
General
Subject to the provisions of the 2006 Act and clause 133 of the Articles, the company may, by ordinary resolution, declare dividends on ordinary shares save that no dividend shall be payable except out of profits available for distribution, or in excess of the amount recommended by the Board or in contravention of the special rights attaching to any share. Any dividend which has remained unclaimed for 12 years from the date of declaration shall be forfeited and shall revert to the company. The company may cease sending dividend warrants and cheques by post or otherwise to a member if such instruments have been returned undelivered to, or left uncashed by, that member on at least two consecutive occasions, or, following one such occasion, reasonable enquiries have failed to establish any new address or account of the registered holder. The company may resume sending warrants and cheques if the holder requests such recommencement in writing.
344
Shareholder information
Each cumulative preference share confers the right to a fixed cumulative preferential dividend payable half-yearly. Each non-cumulative preference share confers the right to a preferential dividend (not exceeding a specified amount) payable in the currency of the relevant share. The rate of such dividend and the date of payment thereof, together with the terms and conditions of the dividend, are as may be determined by the directors prior to allotment. Cumulative preference share dividends are paid in priority to any dividend on any other class of share.
The non-cumulative preference shares rank for dividend after the cumulative preference shares but rank pari passu with each other and any shares expressed to rank, in terms of participation in the profits of the company, in some or all respects pari passu therewith and otherwise in priority to dividends payable on the ordinary shares and any other share capital in the company.
The directors may resolve prior to the issue and allotment of any series of non-cumulative preference shares that full dividends in respect of a particular dividend payment date will not be declared and paid if, (i) in its sole and absolute discretion, the directors resolve prior to the relevant dividend payment date that such dividend (or part thereof) shall not be paid and/or (ii) in the opinion of the directors, payment of a dividend would cause a breach of the UK Financial Services Authority’s capital adequacy requirements applicable to the company or its subsidiaries, or subject to the next following paragraph, insufficient distributable profits of the company are available to cover the payment in full of all dividends after having paid any dividends payable on any of the cumulative preference shares.
If dividends will be paid but, in the opinion of the directors, insufficient distributable profits of the company are available to cover the payment in full of dividends after having paid any dividends payable on any of the cumulative preference shares, dividends will be declared by the directors, pro rata on the non-cumulative preference shares to the extent of the available distributable profits.
The non-cumulative preference shares will carry no further rights to participate in the profits of the company and if, and to the extent, any dividend or part of any dividend is on any occasion not paid for any of the reasons described above, holders of non-cumulative preference shares will have no claim in respect of such non-payment.
If any dividend is not payable for the reasons described in clause (ii) of the third paragraph of this subsection, the directors may pay a special dividend not exceeding US$0.01, £0.01 or €0.01 (depending on the currency of the relevant preference share) per share.
345
Shareholder information continued
If the dividend payable on any series of non-cumulative preference shares on the most recent payment date is not paid in full, or if a sum is not set aside to provide for such payment in full, in either case for the reasons set forth in clause (ii) of the third paragraph of this subsection, no dividends may be declared on any other share capital of the company and no sum may be set aside for the payment of a dividend on any other share capital (in each case other than the cumulative preference shares), unless, on the date of declaration, an amount equal to the dividend payable in respect of the then current dividend period for such series of non-cumulative preference shares is set aside for payment in full on the next dividend payment date.
If any dividend payable on the non-cumulative preference shares is not paid in full or if a sum is not set aside to provide for such payment in full (in either case for the reasons set forth in clause (ii) of the third paragraph of this subsection), the company may not redeem or purchase or otherwise acquire any other share capital of the company and may not set aside any sum nor establish any sinking fund for its redemption, purchase or other such acquisition, until such time as dividends have been declared and paid in full in respect of successive dividend periods together aggregating not less than twelve months.
The non-payment of any dividend (in full or in part) by reason of the exercise of the directors’ discretion referred to in clause (i) of the third paragraph of this subsection, shall not prevent or restrict (a) the declaration and payment of dividends on any other series of non-cumulative preference shares or on any non-cumulative preference shares expressed to rank pari passu with the non-cumulative preference shares, (b) the setting aside of sums for the payment of such dividends, (c) except as set forth in the following paragraph, the redemption, purchase or other acquisition of shares in the company by the company, or (d) except as set forth in the following paragraph, the setting aside of sums, or the establishment of sinking funds, for any such redemption, purchase or other acquisition by the company.
If dividends are not declared and paid in full on any series of non-cumulative preference shares as a result of the directors’ discretion referred to in clause (i) of the third paragraph of this subsection, then the company may not redeem, purchase or otherwise acquire for any consideration any share capital ranking after such preference shares, and may not set aside any sum nor establish any sinking fund for the redemption, purchase or other acquisition thereof, until such time as the company has declared and paid in full dividends on such series of non-cumulative preference shares in respect of successive dividend periods together aggregating no less than twelve months. In addition, no dividend may be declared or paid on any of the company’s share capital ranking after such preference shares until the dividend in respect of a particular dividend payment date payable on the preference shares to which the directors’ discretion in clause (i) of the third paragraph of this subsection applies has been declared and paid in full.
Non-voting deferred shares
The holders of non-voting deferred shares are not entitled to the payment of any dividend or other distribution.
346
Shareholder information
Prior to the occurrence of a Trigger Event (as defined below) in respect of any Series 1 Class B Shares, those Series 1 Class B Shares rank equally with the holders of ordinary shares in respect of any cash dividends, and each Series 1 Class B Share will entitle its holder to the same cash dividend as is (or may, at the election of a holder of the ordinary share, be) payable to the holder of one ordinary share, as adjusted from time to time to reflect any consolidation, reclassification or subdivision in relation to the ordinary shares.
If a Trigger Event has occurred in respect of any Series 1 Class B Shares, the Series 1 Class B Shares in respect of which the Trigger Event has occurred will rank pari passu with the holders of the ordinary shares in respect of any dividends paid on the ordinary shares. Each Series 1 Class B Share will entitle its holder to the same dividend as is (or may, at the election of a holder of an ordinary share, be) payable to the holder of one (as adjusted from time to time) ordinary share. If a bonus issue of fully paid ordinary shares is made to holders of ordinary shares in lieu of a dividend, a holder of a Series 1 Class B Share in respect of which the Trigger Event has occurred will be entitled to receive the same number of ordinary shares as is payable to the holder of one (as adjusted from time to time) ordinary share, save that if the issue of such ordinary share(s) to such holder would result in it holding directly or indirectly more than 75% of the total issued ordinary shares, then such holder will instead receive further Series 1 Class B Shares of the same value.
A Trigger Event occurs in relation to the Series 1 Class B Shares in issue at the relevant time, if the daily volume weighted average price of the company’s ordinary shares on the London Stock Exchange equals or exceeds £0.65 per ordinary share (subject to adjustment) for 20 or more complete dealing days in any period of 30 consecutive dealing days.
Dividend Access Share
Subject to the discretions, limitations and qualifications described in this subsection, non-cumulative dividends on the Series 1 Dividend Access Share will be payable from 22 December 2009 in respect of the period up to and including the Series 1 Class B Dividend Stop Date (if any).
The company will pay dividends on the Series 1 Dividend Access Share when, as and if declared by its board of directors or a duly authorised committee of such board of directors (the ‘‘board of directors’’). Subject to the discretions, limitations and qualifications described in this section, the Series 1 Dividend Access Share will entitle the holder to receive out of the distributable profits of the company a non-cumulative dividend at the rate described below (the ‘‘Dividend Access Share Dividend’’), in priority to the payment of any dividend to the holders of any class of ordinary share or Class B Share and pari passu in such regard with the holder of any other dividend access share then in issue. The board of directors may in its sole and absolute discretion resolve that no Dividend Access Share Dividend shall be paid on a Dividend Access Share Dividend payment date.
The board of directors will, by 31 October in each financial year of the company, decide whether or not to pay an interim dividend on the ordinary shares or make an interim Ordinary Share Bonus Issue in that financial year. If it is decided that an
347
Shareholder information continued
interim dividend on the ordinary shares or an interim Ordinary Share Bonus Issue is to be paid or made in any financial year, the corresponding semi-annual (hereinafter referred to as ‘‘first semi-annual’’) Dividend Access Share Dividend or Bonus Issue on the Series 1 Dividend Access Share in the same financial year will be paid or made at the time set out below. The record date for any first semi-annual Dividend Access Share Dividend or Bonus Issue on the Series 1 Dividend Access Share will be the same as the record date for any interim dividend on the ordinary shares or interim Ordinary Share Bonus Issue in the relevant financial year or otherwise will be three business days before 31 October in each year. If paid or made, the first semi-annual Dividend Access Share Dividend or Bonus Issue on the Series 1 Dividend Access Share in a financial year will be paid or made on the same date that the corresponding interim dividend on the ordinary shares is paid or interim Ordinary Share Bonus Issue is made. If it is decided that no such interim dividend on the ordinary shares or interim Ordinary Share Bonus Issue will be paid or made in a financial year, the first semi-annual Dividend Access Share Dividend or Bonus Issue on the Series 1 Dividend Access Share in such financial year will, if to be paid or made, be so paid or made on 31 October in such financial year (commencing in 2010).
The board of directors will, by 31 May in each financial year of the company, decide whether or not to recommend a dividend on the ordinary shares or make an Ordinary Share Bonus Issue which is expressed to be a final dividend for the immediately preceding financial year. If it is decided that such a dividend on the ordinary shares or Ordinary Share Bonus Issue is to be recommended and is subsequently approved by shareholders, the corresponding semi-annual (hereinafter referred to as ‘‘second semi-annual’’) Dividend Access Share Dividend or Bonus Issue on the Series 1 Dividend Access Share expressed to be for the corresponding period will be paid at the time set out below. The record date for any second semi-annual Dividend Access Share Dividend or Bonus Issue on the Series 1 Dividend Access Share will be the same as the record date for any final dividend on the ordinary shares or final Ordinary Share Bonus Issue for the relevant financial year or otherwise will be three business days before 31 May in each year. If paid or made, the second semi-annual Dividend Access Share Dividend or Bonus Issue on the Series 1 Dividend Access Share in a financial year will be paid or made on the same date that the corresponding final dividend on the ordinary shares is paid or final Ordinary Share Bonus Issue is made. If it is decided that no such final dividend on the ordinary shares or Ordinary Share Bonus Issue will be paid or made in any year (the ‘‘current year’’) for the immediately preceding financial year, any second semi-annual Dividend Access Share Dividend or Bonus Issue on the Series 1 Dividend Access Share expressed to be for the corresponding period will, if to be paid or made, be so paid or made on 31 May in the current year (commencing in 2010).
Any first semi-annual Dividend Access Share Dividend or second semi-annual Dividend Access Share Dividend will only be paid if (to the extent legally required) profits are available for distribution and are permitted by law to be distributed.
If paid or made, the first semi-annual Dividend Access Share Dividend on the Series 1 Dividend Access Share will be equivalent to (A) the greater of:
| (i) | 7% of the Reference Amount multiplied by the actual number of days in the period from (but excluding) the immediately preceding Relevant Date (or, if none, 22 December 2009), to (and including) the current Relevant Date (or, if there has occurred prior to such current Relevant Date a Series 1 Class B Dividend Stop Date in respect of any Series 1 Class B Shares, then in respect of those Series 1 Class B Shares, to (and including) such earlier Series 1 Class B Dividend Stop Date), divided by 365 (or 366 in a leap year) and |
348
Shareholder information
| (ii) | if a cash dividend or cash dividends on the ordinary shares or Ordinary Share Bonus Issue(s) is/are paid or made in the period from (but excluding) the immediately preceding Relevant Date (or, if none, 22 December 2009) to (and including) the current Relevant Date (or, if there has occurred prior to such current Relevant Date a Series 1 Class B Dividend Stop Date in respect of any Series 1 Class B Shares, then in respect of those Series 1 Class B Shares, to (and including) such earlier Series 1 Class B Dividend Stop Date), 250% (as adjusted from time to time as described in the terms of issue of the Series 1 Dividend Access Share, the ‘‘Participation Rate’’) of the aggregate fair market value (as defined in the terms of issue of the Series 1 Dividend Access Share) of such cash dividend or cash dividends or Ordinary Share Bonus Issue per ordinary share multiplied by the then Reference Series 1 Class B Shares Number. Where a dividend in cash is announced which may at the election of a shareholder or shareholders be satisfied by the issue or delivery of ordinary shares in an Ordinary Share Bonus Issue, or where an Ordinary Share Bonus Issue is announced which may at the election of a shareholder or shareholders be satisfied by the payment of cash, then the fair market value of such dividend or Ordinary Share Bonus Issue will be deemed to be the amount of the dividend in cash or of the payment in cash (as the case may be) |
less (B) the fair market value (as defined in the terms of issue of the Series 1 Dividend Access Share) of the aggregate amount of any dividend or distribution paid or made on the Series 1 Class B Shares and/or on any ordinary shares issued on conversion of the B Shares (regardless of who holds such Series 1 Class B Shares or ordinary shares at the relevant time) in the period from (but excluding) the immediately preceding Relevant Date (or, if none, 22 December 2009) to (and including) the current Relevant Date (or, if there has occurred prior to such current Relevant Date a Series 1 Class B Dividend Stop Date in respect of any Series 1 Class B Shares, then in respect of those Series 1 Class B Shares to (and including) such earlier Series 1 Class B Dividend Stop Date), provided that the first semi-annual Dividend Access Share Dividend will never be less than zero.
If paid or made, the second semi-annual Dividend Access Share Dividend on the Series 1 Dividend Access Share will be equivalent to (A) the greater of:
| (i) | 7 per cent. of the Reference Amount multiplied by the actual number of days in the period from (but excluding) the Relevant Date falling on (or nearest to) one year prior to the current Relevant Date (or, if none, 22 December 2009) to (and including) the current Relevant Date (or, if there has occurred prior to such current Relevant Date a Series 1 Class B Dividend Stop Date in respect of any Series 1 Class B Shares, then in respect of those Series 1 Class B Shares, to (and including) such earlier Series 1 Class B Dividend Stop Date) divided by 365 (or 366 in a leap year) and |
| (ii) | if a cash dividend or cash dividends on the ordinary shares or Ordinary Share Bonus Issue(s) is/are paid or made in the period from (but excluding) the Relevant Date falling on (or nearest to) one year prior to the current Relevant Date (or, if none, 22 December 2009) to (and including) the current Relevant Date (or, if there has occurred prior to such current Relevant Date a Series 1 Class B Dividend Stop Date in respect of any Series 1 Class B Shares, then in respect of those Series 1 Class B Shares, to (and including) such earlier Series 1 Class B Dividend Stop Date) the Participation Rate of the aggregate fair market value of such cash dividend(s) or Ordinary Share Bonus Issue(s) per ordinary share multiplied by the then Reference Series 1 Class B Shares Number. Where a dividend in cash is announced which may at the election of a shareholder or shareholders be satisfied by the issue or delivery of ordinary shares in an Ordinary Share Bonus Issue, or where an Ordinary Share Bonus Issue is announced which may at the election of a shareholder or shareholders be satisfied by the payment of cash, then the fair market value of such dividend or Ordinary Share Bonus Issue will be deemed to be the amount of the dividend in cash or of the payment in cash (as the case may be) |
less (B) the fair market value of the aggregate amount of any dividend or distribution paid or made on the Series 1 Class B Shares and/or on any ordinary shares issued on conversion of the Series 1 Class B Shares (regardless of who holds such Series 1 Class B Shares or ordinary shares at the relevant time) in the period from (but excluding) the Relevant Date falling on (or nearest to) one year prior to the current Relevant Date (or, if none, 22 December 2009) to (and including) the current Relevant Date (or, if there has occurred prior to such current Relevant Date a Series 1 Class B Dividend Stop Date in respect of any Series 1 Class B Shares, then in respect of those Series 1 Class B Shares to (and including) such earlier Series 1 Class B Dividend Stop Date) and less the fair market value of the immediately preceding first semi-annual Dividend Access Share Dividend or Bonus Issue paid or made (if any), provided that the second semi-annual Dividend Access Share Dividend will never be less than zero.
If the Participation Rate is adjusted during the course of a financial year, the amount of the semi-annual Dividend Access Share Dividend in such financial year, if determined by reference to the Participation Rate, will itself be adjusted in such manner as the Independent Financial Adviser (acting as an expert) considers appropriate to take account of the date(s) on which the adjustment(s) to the Participation Rate become effective. A written opinion of the Independent Financial Adviser will be conclusive and binding on all parties, save in the case of manifest error.
In the event of a change in the frequency of dividend payments on the ordinary shares such that they are not paid semi-annually consistent with the payment of Dividend Access Share Dividends on the Series 1 Dividend Access Share, the company will make such changes to the Dividend Access Share Dividend payment arrangements described above as, following consultation with the Independent Financial Adviser (acting as an expert), it determines are fair and reasonable to take account of such changed frequency.
Non-cumulative dividends on the Series 1 Dividend Access Share will be payable in respect of the period up to and including the Series 1 Class B Dividend Stop Date (if any). After the Series 1 Class B Dividend Stop Date (if any), the right of the holder of the Series 1 Dividend Access Share to Dividend Access Share Dividends in respect of any Series 1 Class B Shares in issue during each of the 30 consecutive dealing days during which the Trigger Event occurs will cease, but this is without prejudice to the right to Dividend Access Share Dividends in respect of any Series 1 Class B Shares not in issue on each such day.
Bonus Issue of Series 1 Class B Shares on the Series 1 Dividend Access Share: If the board of directors decides to pay a Dividend Access Share Dividend and either (i) no dividend has been paid on the ordinary shares and/or distribution made thereon in respect of the corresponding period, or (ii) a dividend has been paid and/or a distribution has been made on the ordinary shares otherwise than in cash in respect of the corresponding period, the board of directors may in its discretion determine that such Dividend Access Share Dividend will be paid in whole or in part by the company issuing Series 1 Class B Shares, credited as fully paid, to the holder of the Series 1 Dividend Access Share. The number of such further Series 1 Class B Shares to be issued to the holder will be such number of Series 1 Class B Shares as is certified by an Independent Financial Adviser (acting as an expert) to be as nearly as possible equal to (but not greater than) the cash amount (disregarding any tax credit) of such semi-annual Dividend Access Share Dividend or part thereof otherwise payable to such holder of the Series 1 Dividend Access Share, based on the fair market value of a Series 1 Class B Share at the time of such determination. A written opinion of such Independent Financial Adviser will be conclusive and binding on all parties, save in the case of manifest error. The additional Series 1 Class B Shares will rank pari passu in all respects with the fully paid Series 1 Class B Shares then in issue save only as regards participation in the relevant dividend.
349
Shareholder information continued
| (i) | may not, and will procure that no subsidiary undertaking of the company will, declare or pay dividends or other distributions on any Parity Securities (whether in cash or otherwise, and whether payable on the same date as the relevant Dividend Access Share Dividend or subsequently) or make any Ordinary Share Bonus Issue (whether to be made on the same date as the relevant Dividend Access Share Dividend or subsequently), and the company may not, and will procure that no subsidiary undertaking of the company shall, set aside any sum for the payment of these dividends or distributions; and |
| (ii) | may not, and will procure that no subsidiary undertaking of the company will, redeem, purchase or otherwise acquire (whether on the same date as the relevant Dividend Access Share Dividend is payable or subsequently) for any consideration any of its Parity Securities or any depository or other receipts or certificates representing Parity Securities (other than any such purchases or acquisitions which are made in connection with any Employee Share Scheme (as defined in the terms of issue of the Series 1 Dividend Access Share)) and (save as aforesaid) the company may not, and will procure that no subsidiary undertaking of the company shall, set aside any sum or establish any sinking fund (whether on the same date as the relevant Dividend Access Share Dividend is payable or subsequently) for the redemption, purchase or other acquisition of Parity Securities or any depositary or other receipts or certificates representing Parity Securities, in each case until such time as Dividend Access Share Dividends are no longer payable or payment of Dividend Access Share Dividends in cash or otherwise has resumed in full, as the case may be. |
Definitions in relation to this Dividend Access Share subsection
“Bonus Issue” means a bonus issue of Series 1 Class B Shares to the holder of the Series 1 Dividend Access Share.
“Independent Financial Adviser” means an independent financial institution appointed by the company and approved by HM Treasury.
“Ordinary Share Bonus Issue” means a bonus issue of fully paid ordinary shares to holders of ordinary shares in lieu of a dividend.
“Parity Securities” means ordinary shares, Series 1 Class B Shares and any other securities of the company or its subsidiary undertakings which rank pari passu with the ordinary shares, and/or Series 1 Class B Shares on a return of capital on a winding up, either issued by the company or issued by a subsidiary undertaking of the company with terms attached which benefit from a guarantee or support agreement entered into by the company which ranks pari passu with the ordinary shares, and/or Series 1 Class B Shares on a return of capital on a winding up.
‘‘Reference Amount’’ means £25,500,000,000 plus the aggregate Relevant Amount of any further Series 1 Class B Shares issued by the company to HM Treasury after 22 December 2009 and before the record date for the relevant Dividend Access Share Dividend, less the aggregate Relevant Amount of any Series 1 Class B Shares which were in issue during the 30 consecutive dealing days during which a Series 1 Class B Dividend Trigger Event occurred. “Reference Series 1 Class B Shares Number” means the Reference Amount divided by the Relevant Amount.
“Relevant Amount” means £0.50 (subject to adjustment from time to time to reflect any consolidation, redesignation or subdivision in relation to the Series 1 Class B Shares) per Series 1 Class B Share.
“Relevant Date” means in respect of any semi-annual Dividend Access Share Dividend or Bonus Issue, the date on which the company pays or makes the same or (subject to adjustment for a change to the company’s accounting reference date), if the same is not paid or made, means 31 October of the relevant year in the case of a first semi-annual Dividend Access Share Dividend or Bonus Issue, and 31 May of the relevant year in the case of a second semi-annual Dividend Access Share Dividend or Bonus Issue.
“Series 1 Class B Dividend Stop Date” means the date falling 20 days after the Series 1 Class B Dividend Trigger Event.
“Series 1 Class B Dividend Trigger Event” means, in relation to the Series 1 Class B Shares in issue at the relevant time, the daily volume weighted average price of the company’s ordinary shares on the London Stock Exchange equals or exceeds £0.65 per ordinary share (subject to adjustment) for 20 or more complete dealing days in any period of 30 consecutive dealing days.
350
Shareholder information
Cumulative preference shares
In the event of a return of capital on a winding-up or otherwise, the holders of cumulative preference shares are entitled to receive out of the surplus assets of the company available for distribution amongst the members (i) in priority to the holders of the non-cumulative preference shares and any other shares ranking pari passu therewith, the arrears of any fixed dividends including the amount of any dividend due for a payment after the date of commencement of any winding-up or liquidation but which is payable in respect of a half-year period ending on or before such date and (ii) pari passu with the holders of the non-cumulative preference shares and any other shares ranking pari passu therewith, the amount paid up or credited as paid up on such shares together with any premium.
Non-cumulative preference shares
Each non-cumulative preference share will confer on a winding up or liquidation (except (unless otherwise provided by the terms of issue) a redemption or purchase by the company of any shares in the capital of the company), the right to receive out of surplus assets of the company available for distribution amongst the members after payment of the arrears (if any) of the cumulative dividend on the cumulative preference shares and in priority to the holders of the ordinary shares, repayment of the amount paid up or credited as paid up on the non-cumulative preference shares together with any premium paid on issue pari passu with the holders of the cumulative preference shares and together with an amount equal to accrued and unpaid dividends.
Non-voting deferred shares
On a winding-up or other return of capital of the company, holders of non-voting deferred shares are entitled only to payment of the amounts paid up on the non-voting deferred shares, after repayment to the holders of ordinary shares of the nominal amount paid up on the ordinary shares held by them and payment of £100,000 on each ordinary share.
B Shares
On a winding-up, holders of the Series 1 Class B Shares will rank equally with the holders of the ordinary shares, the Series 1 Dividend Access Share and any other class of shares or securities of the company which rank equally with the Series 1 Class B Shares, the Series 1 Dividend Access Share or the ordinary shares on a winding-up or liquidation, and junior to all other shareholders and all creditors of the company. For these purposes, on a winding-up each holder of a Series 1 Class B Share will be deemed to hold one (as adjusted from time to time) ordinary share of the company for every Series 1 Class B Share held at the date of the commencement of such winding-up, and will be entitled to receive out of the surplus assets of the company remaining after payment of all prior-ranking claims, a sum equal to that payable to a holder of one (as adjusted) ordinary share in such event.
Dividend Access Share
On a winding-up, the holder of the Series 1 Dividend Access Share will rank equally with the holders of the ordinary shares, the Series 1 Class B Shares and any other class of shares or securities of the company which rank equally with the Series 1 Dividend Access Share, the Series 1 Class B Shares or the ordinary shares on a winding-up or liquidation, and junior to all other shareholders and all creditors of the company. For these purposes, on a winding-up the holder of the Series 1 Dividend Access Share will be deemed to hold one (as adjusted from time to time) ordinary share of the company, and will be entitled to receive out of the surplus assets of the company remaining after payment of all prior-ranking claims, a sum equal to that payable to a holder of one (as adjusted) ordinary share in such event.
General
On a winding-up of the company, the liquidator may, with the authority of any extraordinary resolution and any other sanction required by the Insolvency Act 1986 and subject to the rights attaching to any class of shares after payment of all liabilities, including the payment to holders of preference shares, divide amongst the members in specie or kind the whole or any part of the assets of the company or vest the whole or any part of the assets in trustees upon such trusts for the benefit of the members and may determine the scope and terms of those trusts. No member shall be compelled to accept any assets on which there is a liability.
Voting Rights
General
Subject to any rights or restrictions as to voting attaching to any shares or class of shares, on a show of hands every member who is present in person or by proxy at a general meeting shall have one vote and on a poll every member present in person or by proxy shall have one vote for each 25 pence in nominal amount of shares held by him. No member shall, unless the directors otherwise determine, be entitled to vote at a general meeting or at a separate meeting of the holders of shares in the capital of the company, either in person or by proxy, in respect of any share held by him unless all monies presently payable by him in respect of that share have been paid.
351
Shareholder information continued
Meetings are convened upon written notice of not less than 21 days in respect of annual general meetings of members and not less than 14 days in respect of other meetings of members.
Cumulative preference shares
At a general meeting of the company, every holder of a cumulative preference share who is present in person or by proxy shall be entitled to one vote on a show of hands and, on a poll, every person who is present in person or by proxy shall have one vote for each 25 pence in nominal amount of shares held. No member shall be entitled to vote any share in person or by proxy unless all moneys owed in respect of that share have been paid.
Non-cumulative preference shares
Holders of non-cumulative preference shares are not entitled to attend or vote at any general meeting unless the business of the meeting includes the consideration of a resolution for the winding-up of the company or any resolution directly varying or abrogating the rights attached to any such shares and then in such case only to speak to and vote upon any such resolution.
However, holders have the right to vote in respect of any matter when the dividend payable on their shares has not been declared in full for such number of dividend periods as the directors shall determine prior to the allotment thereof.
Whenever a holder is entitled to vote at a general meeting, on a show of hands every shareholder who is present in person has one vote and, on a poll, every such holder who is present in person or by proxy shall have such number of votes as may be determined by the directors prior to allotment.
Non-voting deferred shares
The holders of non-voting deferred shares are not entitled to receive notice of or to attend or vote at any general meeting of the company or otherwise receive any shareholder communication.
B Shares
Holders of the Series 1 Class B Shares are not entitled to attend or vote at any general meeting unless the business of the meeting includes the consideration of a resolution for the winding-up of the company or any resolution varying or abrogating the rights attached to any such shares and then in such case only to speak to and vote upon any such resolution.
If entitled to vote, each holder is entitled on a poll to two votes for each Series 1 Class B Share held.
Dividend Access Share
The holder of the Series 1 Dividend Access Share is not entitled to attend or vote at any general meeting unless the business of the meeting includes the consideration of a resolution for the winding-up of the company or any resolution varying or abrogating the rights attached to such share and then in such case only to speak to and vote upon any such resolution.
If entitled to vote, the holder is entitled on a poll to one vote.
Redemption
Except as set forth in the following paragraph, unless the directors determine, prior to allotment of any particular series of non-cumulative preference shares, that such series shall be non-redeemable, the preference shares will be redeemable at the option of the company on any date which (subject to certain exceptions described in the terms of such shares) falls no earlier than such date (if any) as may be fixed by the directors, prior to allotment of such shares. On redemption, there shall be paid on each non-cumulative preference share the aggregate of its nominal amount together with any premium paid on issue, where applicable a redemption premium and accruals of dividend.
Purchase
General
Subject to the 2006 Act, the company may, by special resolution, reduce its share capital, any capital redemption reserve and any share premium account or other undistributable reserve and may also, subject to the 2006 Act, the requirements of the London Stock Exchange and the rights attached to any class of shares, purchase its own shares (including redeemable shares).
352
Shareholder information
Non-cumulative preference shares and convertible preference shares
Subject to the 2006 Act, the company may purchase any non-cumulative preference shares and convertible preference shares upon such terms as the directors shall determine provided that, where the shares being purchased are listed on the London Stock Exchange, the purchase price payable, exclusive of expenses and accrued dividends, shall not exceed (a) in the case of a purchase in the open market, or by tender, the average of the closing middle market quotations of such shares for the 10 dealing days preceding the date of the purchase of (if higher), in the case of a purchase in the open market only, the market price on the date of purchase provided that such market price is not more than 105 per cent of such average and (b) in the case of a purchase by private treaty, 120 per cent of the closing middle market quotation of such shares for the last dealing day preceding the date of purchase; but so that this proviso shall not apply to any purchase of such shares made in the ordinary course of a business of dealing in securities. Upon the purchase of any such shares, the nominal amount of such shares shall thereafter be divided into, and reclassified as, ordinary shares.
Conversion rights
Convertible preference shares carry the right to convert into ordinary shares if they have not been the subject of a notice of redemption from the company, on or before a specified date determined by the directors. The right to convert will be exercisable by service of a conversion notice on the company within a specified period. The company will use reasonable endeavours to arrange the sale, on behalf of convertible preference shareholders who have submitted a conversion notice, of the ordinary shares which result from such conversion and to pay to them the proceeds of such sale so that they receive net proceeds equal to the nominal value of the convertible preference shares which were the subject of the conversion notice and any premium at which such shares were issued, provided that ordinary shares will not be sold at below a benchmark price (as determined prior to the issue of the relevant convertible preference shares by the directors).
B Shares
The B Shares are convertible into Ordinary Shares at HM Treasury’s option at an initial conversion price of £0.50 per share, subject to adjustment.
In December 2003, following the payment of aggregate dividends of £1 in respect of each AVS, all issued and outstanding AVSs were de-listed from the Official List and from trading on the London Stock Exchange’s market for listed securities and converted into non-voting deferred shares of £0.01 each.
Changes in share capital and variation of rights
Subject to the provisions of the 2006 Act and without prejudice to any rights attached to any existing shares or class of shares, any share may be issued with such rights or restrictions as the company may by ordinary resolution determine or, subject to and in default of such determination, as the Board shall determine. Subject to the provisions of the 2006 Act, the company may issue shares which are, or at the option of the company or the holder are liable, to be redeemed. Subject to the provisions of the 2006 Act and the Articles, unissued shares are at the disposal of the Board.
The company may by ordinary resolution: increase its share capital; consolidate and divide all or any of its share capital into shares of larger amount than its existing shares; subject to the provisions of the 2006 Act, subdivide its shares, or any of them, into shares of smaller amount than is fixed by the Memorandum; or cancel any shares which have not been taken or agreed to be taken by any person and diminish the amount of its share capital by the amount of the shares so cancelled.
Subject to the provisions of the 2006 Act, if at any time the capital of the company is divided into different classes of shares, the rights attached to any class of shares may (unless further conditions are provided by the terms of issue of the shares of that class) be varied or abrogated, whether or not the company is being wound up, either with the consent in writing of the holders of three-quarters in-nominal value of the issued shares of the class or with the sanction of an extraordinary resolution passed at a separate general meeting of holders of the shares of the class (but not otherwise).
To any such separate general meeting the provision of the Articles relating to general meetings will apply, save that:
(i) if at any adjourned meeting of such holders a quorum as defined above is not present, two people who hold shares of the class, or their proxies, are a quorum; and
(ii) any such holder present in person or by proxy may demand a poll
353
Shareholder information continued
The rights attaching to any class of shares having preferential rights are not, unless otherwise expressly provided by the terms of issue thereof, deemed to be varied by the creation or issue of further shares ranking, as regards participation in the profits or assets of the company, pari passu therewith, but in no respect in priority thereto.
Disclosure of interests in shares
The 2006 Act gives the company the power to require persons who it believes to be, or have been within the previous three years, interested in its shares, to disclose prescribed particulars of those interests. Failure to supply the information or supplying a statement which is materially false may lead to the Board imposing restrictions upon the relevant shares. The restrictions available are the suspension of voting or other rights conferred by membership in relation to meetings of the company in respect of the relevant shares and, additionally, in the case of a shareholding representing at least 0.25 per cent of the class of shares concerned, the withholding of payment of dividends on, and the restriction of transfers of, the relevant shares.
Limitations on rights to own share
There are no limitations imposed by UK law or the Memorandum and Articles on the right of non-residents or foreign persons to hold or vote the company's shares other than the limitations that would generally apply to all of the company's shareholders.
Members resident abroad
Members with registered addresses outside the United Kingdom are not entitled to receive notices from the company unless they have given the company an address within the United Kingdom at which such notices may be served.
Incorporation and registration
The company was incorporated and registered in Scotland under the Companies Act 1948 as a limited company on 25 March 1968 under the name National and Commercial Banking Group Limited. On 10 March 1982, it changed its name to its present name and was registered under the Companies Acts 1948 to 2006 as a public company with limited liability. The company is registered under Company No. SC 45551.
Code of conduct
As discussed on page 165, the Group has adopted a code of conduct applicable to all Group employees, which will be provided to any person without charge, upon request, by contacting Group Secretariat at the telephone number listed on page 360.
Documents on display
Documents concerning the company may be inspected at 36 St Andrew Square, Edinburgh, EH2 2YB.
Executive directors’ service contracts and copies of directors’ indemnities granted by the company in terms of section 236 of the Companies Act 2006 may be inspected at the company’s office at Gogarburn, Edinburgh, EH12 1HQ (telephone 0131 626 4114).
In addition, we file reports and other information with the SEC. You can read and copy these reports and other information at the SEC’s Public Reference Room at 100 F Street, N.E., Room 1580, Washington, D.C. 20549. You can call the SEC at 1-800-SEC-0330 for further information on the Public Reference Room or contact the offices of The New York Stock Exchange, on which certain of our securities are listed, at 20 Broad Street, New York, New York 10005. The SEC also maintains a website at www.sec.gov which contains in electronic form each of the reports and other information that we have filed electronically with the SEC.
354
Shareholder information
Glossary of terms
Adjustable rate mortgage (ARM) – in the US a variable-rate mortgage. ARMs include: hybrid ARMs which typically have a fixed-rate period followed by an adjustable-rate period; interest-only ARMs where interest only is payable for a specified number of years, typically for three to ten years; and payment-option ARMs that allow the borrower to choose periodically between various payment options.
Alt-A (Alternative A-paper) are mortgage loans with a higher credit quality than sub-prime loans but with features that disqualify the borrower from a traditional prime loan. Alt-A lending characteristics include limited documentation; high loan-to-value ratio; secured on non-owner occupied properties; and debt-to-income ratio above normal limits.
Arrears are the aggregate of contractual payments due on a debt that have not been met by the borrower. A loan or other financial asset is said to be ’in arrears’ when payments have not been made.
Asset-backed commercial paper (ABCP) – a form of asset-backed security generally issued by a commercial paper conduit.
Asset-backed securities (ABS) are securities that represent interests in specific portfolios of assets. They are issued by a special purpose entity following a securitisation. The underlying portfolios commonly comprise residential or commercial mortgages but can include any class of asset that yields predictable cash flows. Payments on the securities depend primarily on the cash flows generated by the assets in the underlying pool and other rights designed to assure timely payment, such as guarantees or other credit enhancements. Collateralised bond obligations, collateralised debt obligations, collateralised loan obligations, commercial mortgage backed securities and residential mortgage backed securities are all types of ABS.
Assets under management are assets managed by the Group on behalf of clients.
Collateralised bond obligations (CBOs) are asset-backed securities for which the underlying asset portfolios are bonds, some of which may be sub-investment grade.
Collateralised debt obligations (CDOs) are asset-backed securities for which the underlying asset portfolios are debt obligations: either bonds (collateralised bond obligations) or loans (collateralised loan obligations) or both. The credit exposure underlying synthetic CDOs derives from credit default swaps. The CDOs issued by an individual vehicle are usually divided in different tranches: senior tranches (rated AAA), mezzanine tranches (AA to BB), and equity tranches (unrated). Losses are borne first by the equity securities, next by the junior securities, and finally by the senior securities; junior tranches offer higher coupons (interest payments) to compensate for their increased risk.
Collateralised debt obligation squared (CDO-squared) is a type of collateralised debt obligation where the underlying asset portfolio includes tranches of other CDOs.
Collateralised loan obligations (CLOs) are asset-backed securities for which the underlying asset portfolios are loans, often leveraged loans.
Collectively assessed loan impairment provisions – impairment loss provisions in respect of impaired loans, such as credit cards or personal loans, that are below individual assessment thresholds. Such provisions are established on a portfolio basis, taking account the level of arrears, security, past loss experience, credit scores and defaults based on portfolio trends.
Commercial mortgage backed securities (CMBS) are asset-backed securities for which the underlying asset portfolios are loans secured on commercial real estate.
Commercial paper (CP) comprises unsecured obligations issued by a corporate or a bank directly or secured obligations (asset-backed CP), often issued through a commercial paper conduit, to fund working capital. Maturities typically range from two to 270 days. However, the depth and reliability of some CP markets means that issuers can repeatedly roll over CP issuance and effectively achieve longer term funding. Commercial paper is issued in a wide range of denominations and can be either discounted or interest-bearing.
Commercial paper conduit is a special purpose entity that issues commercial paper and uses the proceeds to purchase or fund a pool of assets. The commercial paper is secured on the assets and is redeemed either by further commercial paper issuance, repayment of assets or liquidity drawings.
Commercial real estate – freehold and leasehold properties used for business activities. Commercial real estate includes office buildings, industrial property, medical centres, hotels, retail stores, shopping centres, agricultural land and buildings, warehouses, garages etc.
Constant proportion portfolio insurance notes (CPPI notes) – CPPI is the name given to a trading strategy that is designed to ensure that a fixed minimum return is achieved either at all times or more typically, at a set date in the future. Essentially the strategy involves continuously re-balancing the portfolio of investments during the term of the product between performance assets and safe assets using a pre-set formula. CPPI notes provide investors with a return linked to a CPPI portfolio.
Contractual maturity is the date in the terms of a financial instrument on which the last payment or receipt under the contract is due for settlement.
Core Tier 1 capital – called-up share capital and eligible reserves plus equity non-controlling interests, less intangible assets and other regulatory deductions.
Core Tier 1 capital ratio – core Tier 1 capital as a percentage of risk-weighted assets.
Cost:income ratio – operating expenses as a percentage of total income.
Covered mortgage bonds are debt securities backed by a portfolio of mortgages that is segregated from the issuer’s other assets solely for the benefit of the holders of the covered bonds.
Credit default swap (CDS) is a contract where the protection seller receives premium or interest-related payments in return for contracting to make payments to the protection buyer upon a defined credit event in relation to a reference financial asset or portfolio of financial assets. Credit events usually include bankruptcy, payment default and rating downgrades.
355
Shareholder information continued
Credit derivative product company (CDPC) is a special purpose entity that sells credit protection under credit default swaps or certain approved forms of insurance policies. Sometimes they can also buy credit protection. CDPCs are similar to monoline insurers. However, unlike monoline insurers, they are not regulated as insurers.
Credit derivatives are contractual agreements that provide protection against a credit event on one or more reference entities or financial assets. The nature of a credit event is established by the protection buyer and protection seller at the inception of a transaction, and such events include bankruptcy, insolvency or failure to meet payment obligations when due. The buyer of the credit derivative pays a periodic fee in return for a payment by the protection seller upon the occurrence, if any, of a credit event. Credit derivatives include credit default swaps, total return swaps and credit swap options.
Credit enhancements are techniques that improve the credit standing of financial obligations; generally those issued by an SPE in a securitisation. External credit enhancements include financial guarantees and letters of credit from third-party providers. Internal enhancements include excess spread – the difference between the interest rate received on the underlying portfolio and the coupon on the issued securities; and over-collateralisation – on securitisation, the value of the underlying portfolio is greater than the securities issued.
Credit risk assets – loans and advances (including overdraft facilities), instalment credit, finance lease receivables and other traded instruments across all customer types.
Credit risk spread is the difference between the coupon on a debt instrument and the benchmark or the risk-free interest rate for the instrument’s maturity structure. It is the premium over the risk-free rate required by the market for the credit quality of an individual debt instrument.
Credit valuation adjustments are adjustments to the fair values of derivative assets to reflect the creditworthiness of the counterparty.
Currency swap – an arrangement in which two parties exchange specific principal amounts of different currencies at inception and subsequently interest payments on the principal amounts. Often, one party will pay a fixed interest rate, while the other will pay a floating exchange rate (though there are also fixed-fixed and floating-floating arrangements). At the maturity of the swap, the principal amounts are usually re-exchanged.
Customer accounts comprise money deposited with the Group by counterparties other than banks and classified as liabilities. They include demand, savings and time deposits; securities sold under repurchase agreements; and other short term deposits. Deposits received from banks are classified as deposits by banks.
Debt restructuring – see renegotiated loans.
Debt securities are transferable instruments creating or acknowledging indebtedness. They include debentures, bonds, certificates of deposit, notes and commercial paper. The holder of a debt security is typically entitled to the payment of principal and interest, together with other contractual rights under the terms of the issue, such as the right to receive certain information. Debt securities are generally issued for a fixed term and redeemable by the issuer at the end of that term. Debt securities can be secured or unsecured.
Debt securities in issue comprise unsubordinated debt securities issued by the Group. They include commercial paper, certificates of deposit, bonds and medium-term notes.
Deferred tax asset – income taxes recoverable in future periods as a result of deductible temporary differences – temporary differences between the accounting and tax base of an asset or liability that will result in tax deductible amounts in future periods – and the carry-forward of tax losses and unused tax credits.
Deferred tax liability – income taxes payable in future periods as a result of taxable temporary differences (temporary differences between the accounting and tax base of an asset or liability that will result in taxable amounts in future periods).
Defined benefit obligation – the present value of expected future payments required to settle the obligations of a defined benefit plan resulting from employee service.
Defined benefit plan – pension or other post-retirement benefit plan other than a defined contribution plan.
Defined contribution plan – pension or other post-retirement benefit plan where the employer’s obligation is limited to its contributions to the fund.
Delinquency - a debt or other financial obligation is considered delinquent when one or more contractual payments are overdue. Delinquency is usually defined in terms of days past due. Delinquent and in arrears are synonymous.
Deposits by banks comprise money deposited with the Group by banks and recorded as liabilities. They include money-market deposits, securities sold under repurchase agreements, federal funds purchased and other short term deposits. Deposits received from customers are recorded as customer accounts.
Derivative – a contract or agreement whose value changes with changes in an underlying index such as interest rates, foreign exchange rates, share prices or indices and which requires no initial investment or an initial investment that is smaller than would be required for other types of contracts with a similar response to market factors. The principal types of derivatives are: swaps, forwards, futures and options.
Discontinued operation is a component of the Group that either has been disposed of or is classified as held for sale. A discontinued operation is either: a separate major line of business or geographical area of operations or part of a single co-ordinated plan to dispose of a separate major line of business or geographical area of operations; or a subsidiary acquired exclusively with a view to resale.
Exposure at default (EAD) – an estimate of the expected level of utilisation of a credit facility at the time of a borrower’s default. The EAD may be higher than the current utilisation (e.g. in the case where further drawings may be made under a revolving credit facility prior to default) but will not typically exceed the total facility limit.
Fannie Mae (Federal National Mortgage Association) is a US Government Sponsored Enterprise. It buys mortgages, principally issued by banks, on the secondary market, pools them, and sells them as residential mortgage-backed securities to investors on the open market. Its obligations are not explicitly guaranteed by the full faith and credit of the US Government.
356
Shareholder information
Federal Home Loan Mortgage Corporation see Freddie Mac.
Federal National Mortgage Association see Fannie Mae.
FICO score – a FICO score is calculated using proprietary software developed by the Fair Isaac Corporation in the US from a consumer’s credit profile. The scores range between 300 and 850 and are used in credit decisions made by banks and other providers of credit.
First/second lien – a lien is a charge such as a mortgage held by one party, over property owned by a second party, as security for payment of some debt, obligation, or duty owed by that second party. The holder of a first lien takes precedence over all other encumbrances on that property i.e. second and subsequent liens.
Forward contract – a contract to buy (or sell) a specified amount of a physical or financial commodity, at an agreed price, at an agreed future date.
Freddie Mac (Federal Home Loan Mortgage Corporation) is a US Government Sponsored Enterprise. It buys mortgages, principally issued by thrifts, on the secondary market, pools them, and sells them as residential mortgage-backed securities to investors on the open market. Its obligations are not explicitly guaranteed by the full faith and credit of the US Government.
Futures contract is a contract which provides for the future delivery (or acceptance of delivery) of some type of financial instrument or commodity under terms established at the outset. Futures differ from forward contracts in that they are traded on recognised exchanges and rarely result in actual delivery; most contracts are closed out prior to maturity by acquisition of an offsetting position.
G10 - the Group of Ten comprises the eleven industrial countries (Belgium, Canada, France, Germany, Italy, Japan, the Netherlands, Sweden, Switzerland, the United Kingdom and the United States) that have agreed to participate in the IMF’s General Arrangements to Borrow.
Ginnie Mae (Government National Mortgage Association) is a US Government Agency that guarantees investors the timely payment of principal and interest on mortgage-backed securities for which the underlying asset portfolios comprise federally insured or guaranteed loans – mainly loans insured by the Federal Housing Administration or guaranteed by the Department of Veterans Affairs. Ginnie Mae obligations are fully and explicitly guaranteed as to the timely payment of principal and interest by the full faith and credit of the US Government.
Government Sponsored Enterprises (GSEs) are a group of financial services corporations created by the US Congress. Their function is to improve the efficiency of capital markets and to overcome statutory and other market imperfections which otherwise prevent funds from moving easily from suppliers of funds to areas of high loan demand. They include Fannie Mae and Freddie Mac.
Gross yield is the interest rate earned on average interest-earning assets i.e. interest income divided by average interest-earning assets.
Guaranteed mortgages are mortgages that are guaranteed by a government or government agency. In the US, government loan guarantee programmes are offered by the Federal Housing Administration, the Department of Veterans Affairs, and the Department of Agriculture’s Rural Housing Service. In the Netherlands, the Gemeentegarantie programme is run partly by the central government and partly by the municipalities.
Home equity loan is a type of loan in which the borrower uses the equity in their home as collateral. A home equity loan creates a charge against the borrower’s house.
Impaired loans – a loan or other financial asset or portfolio of financial assets classified as held-to-maturity, available-for-sale or loans and receivables is impaired if there is objective evidence that an event or events since initial recognition of the asset have adversely affected the amount or timing of future cash flows from the asset.
Impairment allowance – see loan impairment provisions.
Impairment losses – for impaired financial assets measured at amortised cost, impairment losses – the difference between carrying value and the present value of estimated future cash flows discounted at the asset’s original effective interest rate – are recognised in profit or loss and the carrying amount of the financial asset reduced by establishing a provision (allowance). For impaired available-for-sale financial assets, the cumulative loss that had been recognised directly in equity is removed from equity and recognised in profit or loss as an impairment loss.
Individually assessed loan impairment provisions – impairment loss provisions for individually significant impaired loans assessed on a case-by-case basis, taking into account the financial condition of the counterparty and any guarantor and the realisable value of any collateral held.
International Accounting Standards Board (IASB) is the independent standard-setting body of the IASC Foundation. Its members are responsible for the development and publication of International Financial Reporting Standards (IFRS) and for approving Interpretations of IFRS as developed by the International Financial Reporting Interpretations Committee (IFRIC).
Interest rate swap – a contract under which two counterparties agree to exchange periodic interest payments on a predetermined monetary principal, the notional amount.
Interest spread is the difference between the gross yield and the interest rate paid on average interest-bearing liabilities.
Investment grade generally represents a risk profile similar to a rating of a “BBB-”/”Baa3” or better, as defined by independent rating agencies.
Latent loss provisions – loan impairment provisions held against impairments in the performing loan portfolio that have been incurred as a result of events occurring before the balance sheet date but which have not been identified as impaired at the balance sheet. The Group has developed methodologies to estimate latent loss provisions that reflect historical loss experience (adjusted for current economic and credit conditions) and the period between an impairment occurring and a loan being identified and reported as impaired.
357
Shareholder information continued
Leveraged loans – funding (leveraged finance) provided to a business resulting in an overall level of debt that exceeds that which would be considered usual for the business or for the industry in which it operates. Leveraged finance is commonly employed to achieve a specific, often temporary, objective: to make an acquisition, to effect a buy-out or to repurchase shares.
Liquidity enhancements make funds available to ensure that the issuer of securities, usually a commercial paper conduit, can redeem the securities at maturity. They typically take the form of a committed facility from a third-party bank.
Loan impairment provisions – are established to recognise incurred impairment losses on a portfolio of loans classified as loans and receivables and carried at amortised cost. It has three components: individually assessed loan impairment provisions, collectively assessed loan impairment provisions and latent loss provisions.
Loan-to-value ratio – the amount of a secured loan as a percentage of the appraised value of the security e.g. the outstanding amount of a mortgage loan as a percentage of the property’s value.
Loss given default (LGD) – the economic loss that may occur in the event of default i.e. the actual loss – that part of the exposure that is not expected to be recovered – plus any costs of recovery.
Master netting agreement is an agreement between two counterparties that have multiple derivative contracts with each other that provides for the net settlement of all contracts through a single payment, in a single currency, in the event of default on, or termination of, any one contract.
Medium term notes (MTNs) are debt securities usually with a maturity of five to ten years, but the term may be less than one year or as long as 50 years. They can be issued on a fixed or floating coupon basis or with an exotic coupon; with a fixed maturity date (non-callable) or with embedded call or put options or early repayment triggers. MTNs are most generally issued as senior, unsecured debt.
Monoline insurers are entities that specialise in providing credit protection against the notional and interest cash flows due to the holders of debt instruments in the event of default. This protection is typically in the form of derivatives such as credit default swaps.
Mortgage-backed securities – are asset-backed securities for which the underlying asset portfolios are loans secured on property. See residential mortgage backed securities and commercial mortgage backed securities.
Mortgage servicing rights are the rights of a mortgage servicer to collect mortgage payments and forward them, after deducting a fee, to the mortgage lender.
Mortgage vintage – the year in which a mortgage loan was made to the customer.
Negative equity mortgages – mortgages where the value of the property mortgaged is less than the outstanding balance on the loan.
Net interest income is the difference between interest receivable on financial assets classified as loans and receivables or available-for-sale and interest payable on financial liabilities carried at amortised cost.
Net interest margin is net interest income as a percentage of average interest-earning assets.
Net principal exposure is the carrying value of a financial asset after taking account of credit protection purchased but excluding the effect of any counterparty credit valuation adjustment to that protection.
Non-accrual loans comprise all loans for which an impairment provision has been established; for collectively assessed loans, impairment loss provisions are not allocated to individual loans and the entire portfolio is included in non-accrual loans.
Non-conforming mortgages – mortgage loans that do not meet the requirements for sale to US Government agencies or US Government sponsored enterprises. These requirements include limits on loan-to-value ratios, loan terms, loan amounts, borrower creditworthiness and other requirements.
Option - an option is a contract that gives the holder the right but not the obligation to buy (or sell) a specified amount of the underlying physical or financial commodity, at a specific price, at an agreed date or over an agreed period. Options can be exchange-traded or traded over-the-counter.
Past due – a financial asset such as a loan is past due when the counterparty has failed to make a payment when contractually due.
Potential problem loans – are loans other than non-accrual loans, accruing loans which are contractually overdue 90 days or more as to principal or interest and troubled debt restructurings where known information about possible credit problems of the borrower causes management to have serious doubts about the borrower’s ability to meet the loan’s repayment terms.
Prime - prime mortgage loans generally have low default risk and are made to borrowers with good credit records and a monthly income that is at least three to four times greater than their monthly housing expense (mortgage payments plus taxes and other debt payments). These borrowers provide full documentation and generally have reliable payment histories.
Private equity investments are equity investments in operating companies not quoted on a public exchange. Capital for private equity investment is raised from retail or institutional investors and used to fund investment strategies such as leveraged buyouts, venture capital, growth capital, distressed investments and mezzanine capital.
Pro forma cost:income ratio – operating expenses excluding purchased intangibles amortisation, write-down of goodwill and other intangible assets, integration and restructuring costs and share of shared assets expressed as a percentage of total income excluding credit market write-downs and one-off items.
Probability of default (PD) – the likelihood that a customer will fail to make full and timely repayment of credit obligations over a one year time horizon.
Regular way purchase or sale is a purchase or sale of a financial asset under a contract whose terms require delivery of the asset within the time frame established generally by regulation or convention in the marketplace concerned.
358
Shareholder information
Renegotiated loans – loans are generally renegotiated (‘restructured’) either as part of the ongoing banking relationship with a creditworthy customer or in response to a borrower’s financial difficulties. In the latter case renegotiation may result in an extension of the due date of payment, a concessionary rate of interest or other changes in the terms of the loan; the loan continues to be overdue and will be individually impaired if the renegotiated payments of interest and principal are insufficient to recover the loan’s original carrying amount.
Repurchase agreement (Repo) see Sale and repurchase agreements.
Residential mortgage backed securities (RMBS) are asset-backed securities for which the underlying asset portfolios are residential mortgages.
Retail loans are loans made to individuals rather than institutions. The loans may be for car purchases, home purchases, medical care, home repair, holidays and other consumer uses.
Reverse repurchase agreement (Reverse repo) – see Sale and repurchase agreements.
Risk asset ratio (RAR) – total regulatory capital as a percentage of risk-weighted assets.
Risk elements in lending (REIL) comprise non-accrual loans, accruing loans which are contractually overdue 90 days or more as to principal or interest and troubled debt restructurings.
Risk-weighted assets – assets adjusted for their associated risks using weightings established in accordance with the Basel Capital Accord as implemented by the FSA. Certain assets are not weighted but deducted from capital.
Sale and repurchase agreements – in a sale and repurchase agreement one party, the seller, sells a financial asset to another party, the buyer, at the same time the seller agrees to reacquire, and the buyer to resell, the asset at a later date. From the seller’s perspective such agreements are repurchase agreements (repos) and from the buyer’s reverse repurchase agreements (reverse repos).
Securitisation is a process by which assets or cash flows are transformed into transferable securities. The underlying assets or cash flows are transferred by the originator or an intermediary, typically an investment bank, to a special purpose entity which issues securities to investors. Asset securitisations involve issuing debt securities (asset-backed securities) that are backed by the cash flows of income-generating assets (ranging from credit card receivables to residential mortgage loans). Liability securitisations typically involve issuing bonds that assume the risk of a potential insurance liability (ranging from a catastrophic natural event to an unexpected claims level on a certain product type).
Special purpose entity (SPE) is an entity created by a sponsor, typically a major bank, finance company, investment bank or insurance company. An SPE can take the form of a corporation, trust, partnership, corporation or a limited liability company. Its operations are typically limited for example in a securitisation to the acquisition and financing of specific assets or liabilities.
Structured Investment Vehicle (SIV) is a limited-purpose operating company that undertakes arbitrage activities by purchasing highly rated medium and long-term, fixed-income assets and funding itself with short-term, highly rated commercial paper and medium-term notes.
Structured notes are securities that pay a return linked to the value or level of a specified asset or index. Structured notes can be linked to equities, interest rates, funds, commodities and foreign currency.
Student loan related assets are assets that are referenced to underlying student loans.
Subordinated liabilities are liabilities which, in the event of insolvency or liquidation of the issuer, are subordinated to the claims of depositors and other creditors of the issuer.
Sub-prime – sub-prime mortgage loans are designed for customers with one or more high risk characteristics, such as: unreliable or poor payment histories; loan-to-value ratio of greater than 80%; high debt-to-income ratio; the loan is not secured on the borrower’s primary residence; or a history of delinquencies or late payments on the loan.
Super senior CDO is the most senior class of instrument issued by a CDO vehicle. They benefit from the subordination of all other instruments, including AAA-rated securities, issued by the CDO vehicle.
Tier 1 capital – core Tier 1 capital plus other Tier 1 securities in issue, less material holdings in financial companies.
Tier 1 capital ratio – Tier 1 capital as a percentage of risk-weighted assets.
Tier 2 capital – qualifying subordinated debt and other Tier 2 securities in issue, eligible collective impairment allowances, unrealised available for sale equity gains and revaluation reserves less certain regulatory deductions.
Troubled debt restructurings – comprise those loans that are troubled debt restructurings but that are not included in either non-accrual loans or in accruing loans which are contractually overdue 90 days or more as to principal or interest. A restructuring of a loan is a troubled debt restructuring if the lender, for economic or legal reasons related to the borrower’s financial difficulties, grants a concession to the borrower that it would not otherwise consider.
US Government National Mortgage Association see Ginnie Mae.
Unaudited – unaudited financial information is information that has not been subjected to the audit procedures undertaken by the Group’s auditors to enable them to express an opinion on the Group’s financial statements.
VaR is a technique that produces estimates of the potential change in the market value of a portfolio over a specified time horizon at given confidence levels.
Wrapped security – a wrapped security is a debt security where the holder benefits from credit protection provided by a third party, typically a financial guarantor or monoline insurer.
Write down – a reduction in the carrying value of an asset to record a decline in its fair value or value in use.
359
Shareholder information continued
| Important addresses | Principal offices |
| Shareholder enquiries | The Royal Bank of Scotland Group plc |
| Registrar | PO Box 1000 Gogarburn Edinburgh EH12 1HQ |
| Computershare Investor Services PLC | Telephone: +44 (0)131 626 0000 |
| The Pavilions | |
| Bridgwater Road | The Royal Bank of Scotland plc |
| Bristol BS99 6ZZ | PO Box 1000 Gogarburn Edinburgh EH12 1HQ |
| Telephone: +44 (0)870 702 0135 | 280 Bishopsgate London EC2M 4RB |
| Facsimile: +44 (0)870 703 6009 | |
| Website: www.investorcentre.co.uk/contactus | National Westminster Bank Plc |
| 135 Bishopsgate London EC2M 3UR | |
| ADR Depositary Bank | |
| BNY Mellon Shareowner Services | Citizens |
| PO Box 358516 | Citizens Financial Group, Inc. |
| Pittsburgh, PA 15252-8516 | One Citizens Plaza Providence Rhode Island 02903 USA |
| Telephone: +1 888 269 2377 (US callers) | |
| Telephone: +1 201 680 6825 (International) | Ulster Bank |
| Email: shrrelations@bnymellon.com | 11-16 Donegall Square East Belfast BT1 5UB |
| Website: www.bnymellon.com/shareowner | George’s Quay Dublin 2 |
| Group Secretariat | RBS Insurance |
| The Royal Bank of Scotland Group plc | Direct Line House 3 Edridge Road Croydon Surrey CR9 1AG |
| PO Box 1000 | Churchill Court Westmoreland Road Bromley Kent BR1 1DP |
| Gogarburn | |
| Edinburgh EH12 1HQ | RBS Holdings USA Inc. |
| Telephone: +44 (0)131 556 8555 | 600 Washington Blvd |
| Facsimile: +44 (0)131 626 3081 | Stamford CT |
| 06901 USA | |
| Investor Relations | |
| 280 Bishopsgate | Coutts Group |
| London EC2M 4RB | 440 Strand London WC2R 0QS |
| Telephone: +44 (0)207 672 1758 | |
| Facsimile: +44 (0)207 672 1801 | The Royal Bank of Scotland International Limited |
| Email: investor.relations@rbs.com | Royal Bank House 71 Bath Street |
| St Helier Jersey Channel Islands JE4 8PJ | |
| Registered office | |
| 36 St Andrew Square | NatWest Offshore |
| Edinburgh EH2 2YB | 23/25 Broad Street |
| Telephone: +44 (0)131 556 8555 | St Helier Jersey Channel Islands JE4 OYX |
| Registered in Scotland No. 45551 | |
| RBS Holdings N.V. | |
| Website | Gustav Mahlerlaan 10, PO Box 12925 |
| www.rbs.com | 1100 AX Amsterdam The Netherlands |
360
Exhibit Index
Exhibit Number | Description | |
| 1.1 | Memorandum and Articles of Association of The Royal Bank of Scotland Group plc | |
2.1† | Form of Deposit agreement among The Royal Bank of Scotland Group plc, The Bank of New York as Depositary, and all Owners and Holders from time to time of American Depositary Receipts issued thereunder | |
2.2‡ | Form of American Depositary Receipt for ordinary shares of the par value of £0.25 each | |
2.3§ | Letter dated May 12, 2008 from The Bank of New York Mellon as Depository to The Royal Bank of Scotland Group plc relating to the Prerelease of American Depository Receipts | |
| 2.4 | Neither The Royal Bank of Scotland Group plc nor The Royal Bank of Scotland plc is party to any single instrument relating to long-term debt pursuant to which a total amount of securities exceeding 10% of the Group’s total assets (on a consolidated basis) is authorised to be issued. Each of The Royal Bank of Scotland Group plc and The Royal Bank of Scotland plc hereby agrees to furnish to the Securities and Exchange Commission (the “Commission”), upon its request, a copy of any instrument defining the rights of holders of its long-term debt or the rights of holders of the long-term debt of any of its subsidiaries for which consolidated or unconsolidated financial statements are required to be filed with the Commission. | |
| 4.1* | Service agreement for Stephen Hester | |
| 4.2* | Service agreement amendment for Stephen Hester | |
| 4.3 | Service Agreement for Bruce Van Saun | |
| 4.4** | Form of Deed of Indemnity for Directors | |
| 4.5* | Amendment Agreement dated August 2008, relating to the Consortium and Shareholders’ Agreement dated 28 May 2007, among The Royal Bank of Scotland Group plc, Banco Santander, S.A., Fortis N.V., Fortis SA/NV and, by accession, Fortis Nederland (Holding) N.V., and RFS Holdings B.V. (as supplemented and amended by a Supplemental Consortium and Shareholders’ Agreement dated 17 September 2007) | |
| 4.6* | Deed of Accession dated December 2008 among The Royal Bank of Scotland Group plc, Banco Santander, S.A., Fortis Bank Nederland (Holding) N.V., The State of the Netherlands and RFS Holdings B.V. | |
| 4.7* | Underwriting Agreement dated 22 April 2008 among The Royal Bank of Scotland Group plc, Goldman Sachs International, Merrill Lynch International, UBS Limited and The Royal Bank of Scotland plc | |
| 4.8* | Share Purchase Agreement dated 13 June 2008 among The Royal Bank of Scotland Group plc and Willow Bidco Limited | |
| 4.9* | Share Purchase Agreement dated 28 July 2008 among The Royal Bank of Scotland Group plc and Tesco plc relating to the sale and purchase of part of the issues share capital of Tesco Personal Finance Group Limited | |
| 4.10* | Placing and Open Offer Agreement dated 13 October 2008 among The Royal Bank of Scotland Group plc, UBS Limited, Merrill Lynch International and The Commissioners of Her Majesty’s Treasury | |
| 4.11* | Preference Share Acquisition Agreement dated 13 October 2008 among The Commissioners of Her Majesty’s Treasury, The Royal Bank of Scotland Group plc and UBS Limited | |
| 4.12* | Amendment Agreement dated 13 October 2008 among The Royal Bank of Scotland Group plc, UBS Limited, Merrill Lynch International and the Commissioners of Her Majesty’s Treasury | |
| 4.13* | First Subscription and Transfer Agreement dated 4 November 2008 among UBS Limited, Merrill Lynch International, Encuentro Limited and The Royal Bank of Scotland Group plc | |
| 4.14* | Second Subscription and Transfer Agreement dated 4 November 2008 among UBS Limited, Merrill Lynch International, Encuentro Limited and The Royal Bank of Scotland Group plc | |
| 4.15* | Amendment Deed dated 28 November 2009 among UBS Limited, Merrill Lynch International, Encuentro Limited and The Royal Bank of Scotland Group plc | |
| 4.16* | Second Placing and Open Offer Agreement dated 19 January 2009 among The Royal Bank of Scotland Group plc, UBS Limited, Merrill Lynch International and The Commissioners of Her Majesty’s Treasury | |
| 4.17* | Pre-accession Commitments Deed poll dated 26 February 2009 by The Royal Bank of Scotland plc | |
4.18‡‡*** | Lending Commitments Deed poll dated 26 February 2009 by The Royal Bank of Scotland plc | |
| 4.19*** | Acquisition and contingent capital agreement dated 26 November 2009 among The Royal Bank of Scotland Group plc and The Commissioners of Her Majesty’s Treasury | |
| 4.20*** | Accession Agreement dated 26 November 2009 among The Commissioners of Her Majesty’s Treasury, The Royal Bank of Scotland plc and The Royal Bank of Scotland Group plc relating to the UK Asset Protection Scheme | |
| 4.21 | Agreements to forego Tax reliefs dated 26 November 2009 among The Commissioners of Her Majesty’s Treasury, The Commissioners for Her Majesty’s Revenue and Customs, The Royal Bank of Scotland plc, The Royal Bank of Scotland Group plc and ABN AMRO Bank N.V. in connection with an Exit Fee payable under an Accession Agreement relating to the UK Asset Protection Scheme | |
| 4.22 | Agreements to forego Tax reliefs dated 26 November 2009 among The Commissioners of Her Majesty’s Treasury, The Commissioners for Her Majesty’s Revenue and Customs, The Royal Bank of Scotland plc, The Royal Bank of Scotland Group plc and ABN AMRO Bank N.V. in connection with an Acquisition and Contingent Capital Agreement | |
| 4.23 | Agreements to forego Tax reliefs dated 26 November 2009 among The Commissioners of Her Majesty’s Treasury, The Commissioners for Her Majesty’s Revenue and Customs, The Royal Bank of Scotland plc, The Royal Bank of Scotland Group plc and ABN AMRO Bank N.V. in connection with an Accession Agreement relating to the UK Asset Protection Scheme | |
| 4.24*** | State Aid Commitment Deed dated 26 November 2009 among The Commissioners of Her Majesty’s Treasury and The Royal Bank of Scotland Group plc | |
| 4.25*** | State Aid Cost Reimbursement Deed dated 26 November 2009 among The Commissioners of Her Majesty’s Treasury and The Royal Bank of Scotland Group plc | |
| 4.26 | Amendment to the Lending Commitments Deed poll dated 23 March 2010 by The Royal Bank of Scotland plc | |
| 4.27*** | Restated Consortium and Shareholders’ Agreement dated 1 April 2010, among The Royal Bank of Scotland Group plc, Banco Santander, S.A., The State of the Netherlands and RFS Holdings B.V. | |
| 4.28 | UK Asset Protection Scheme Terms and Conditions | |
| 7.1 | Explanation of ratio calculations | |
| 8.1 | Principal subsidiaries of The Royal Bank of Scotland plc | |
| 12.1 | CEO certification required by Rule 13a-14(a) | |
| 12.2 | CFO certification required by Rule 13a-14(a) | |
| 13.1 | Certification required by Rule 13a-14(a) | |
| 15.1 | Consent of independent registered public accounting firm | |
| † | Previously filed and incorporated by reference to Exhibit 1 to the Registration Statement on Form F-6 (Registration No. 333-144756) (filed on 20 July 2007) | |
| ‡ | Previously filed and incorporated by reference to Exhibit A of Exhibit 1 to the Registration Statement on Form F-6 (Registration No. 333-144756) (filed on 20 July 2007) | |
| § | Previously filed and incorporated by reference to Exhibit 2.3 to the Group’s Annual Report on Form 20-F for the fiscal year ended 31 December 2007 (File No. 1-10306) | |
| * | Previously filed and incorporated by reference to Exhibit 4.1, 4.2, 4.8, 4.9, 4.12, 4.13, 4.14, 4.15, 4.16, 4.17, 4.18, 4.19, 4.20, 4.21 and 4.22 respectively to the Group’s Annual Report on Form 20-F for the fiscal year ended 31 December 2008 (file No. 1-10306) | |
| ** | Previously filed and incorporated by reference to Exhibit 4.11 to the Group’s Annual Report on Form 20-F for the fiscal year ended 31 December 2006 (file No. 1-10306) except that the sentence “PROVIDED THAT this Indemnity is given subject to the provisions of Section 309A Company Act 1985” has been replaced with “PROVIDED THAT this Indemnity is given subject to the provisions of Section 234 Company Act 2001”. | |
| *** | Confidential treatment has been requested. Confidential materials have been redacted and separately filed with the SEC. | |
| ‡‡ | Previously filed and incorporated by reference to Exhibit 4.3 to the Group’s Annual Report on Form 20-F/A for the fiscal year ended 31 December 2008 (File No. 1-10306) |
361
SIGNATURE
The registrant hereby certifies that it meets all of the requirements for filing on Form 20-F and that it has duly caused and authorized the undersigned to sign this annual report on its behalf.
The Royal Bank of Scotland Group plc
Registrant
/s/ Bruce Van Saun
Bruce Van Saun
Group Finance Director
April 27, 2010
362
Exhibit Index
Exhibit Number | Description | |
| 1.1 | Memorandum and Articles of Association of The Royal Bank of Scotland Group plc | |
2.1† | Form of Deposit agreement among The Royal Bank of Scotland Group plc, The Bank of New York as Depositary, and all Owners and Holders from time to time of American Depositary Receipts issued thereunder | |
2.2‡ | Form of American Depositary Receipt for ordinary shares of the par value of £0.25 each | |
2.3§ | Letter dated May 12, 2008 from The Bank of New York Mellon as Depository to The Royal Bank of Scotland Group plc relating to the Prerelease of American Depository Receipts | |
| 2.4 | Neither The Royal Bank of Scotland Group plc nor The Royal Bank of Scotland plc is party to any single instrument relating to long-term debt pursuant to which a total amount of securities exceeding 10% of the Group’s total assets (on a consolidated basis) is authorised to be issued. Each of The Royal Bank of Scotland Group plc and The Royal Bank of Scotland plc hereby agrees to furnish to the Securities and Exchange Commission (the “Commission”), upon its request, a copy of any instrument defining the rights of holders of its long-term debt or the rights of holders of the long-term debt of any of its subsidiaries for which consolidated or unconsolidated financial statements are required to be filed with the Commission. | |
| 4.1* | Service agreement for Stephen Hester | |
| 4.2* | Service agreement amendment for Stephen Hester | |
| 4.3 | Service Agreement for Bruce Van Saun | |
| 4.4** | Form of Deed of Indemnity for Directors | |
| 4.5* | Amendment Agreement dated August 2008, relating to the Consortium and Shareholders’ Agreement dated 28 May 2007, among The Royal Bank of Scotland Group plc, Banco Santander, S.A., Fortis N.V., Fortis SA/NV and, by accession, Fortis Nederland (Holding) N.V., and RFS Holdings B.V. (as supplemented and amended by a Supplemental Consortium and Shareholders’ Agreement dated 17 September 2007) | |
| 4.6* | Deed of Accession dated December 2008 among The Royal Bank of Scotland Group plc, Banco Santander, S.A., Fortis Bank Nederland (Holding) N.V., The State of the Netherlands and RFS Holdings B.V. | |
| 4.7* | Underwriting Agreement dated 22 April 2008 among The Royal Bank of Scotland Group plc, Goldman Sachs International, Merrill Lynch International, UBS Limited and The Royal Bank of Scotland plc | |
| 4.8* | Share Purchase Agreement dated 13 June 2008 among The Royal Bank of Scotland Group plc and Willow Bidco Limited | |
| 4.9* | Share Purchase Agreement dated 28 July 2008 among The Royal Bank of Scotland Group plc and Tesco plc relating to the sale and purchase of part of the issues share capital of Tesco Personal Finance Group Limited | |
| 4.10* | Placing and Open Offer Agreement dated 13 October 2008 among The Royal Bank of Scotland Group plc, UBS Limited, Merrill Lynch International and The Commissioners of Her Majesty’s Treasury | |
| 4.11* | Preference Share Acquisition Agreement dated 13 October 2008 among The Commissioners of Her Majesty’s Treasury, The Royal Bank of Scotland Group plc and UBS Limited | |
| 4.12* | Amendment Agreement dated 13 October 2008 among The Royal Bank of Scotland Group plc, UBS Limited, Merrill Lynch International and the Commissioners of Her Majesty’s Treasury | |
| 4.13* | First Subscription and Transfer Agreement dated 4 November 2008 among UBS Limited, Merrill Lynch International, Encuentro Limited and The Royal Bank of Scotland Group plc | |
| 4.14* | Second Subscription and Transfer Agreement dated 4 November 2008 among UBS Limited, Merrill Lynch International, Encuentro Limited and The Royal Bank of Scotland Group plc | |
| 4.15* | Amendment Deed dated 28 November 2009 among UBS Limited, Merrill Lynch International, Encuentro Limited and The Royal Bank of Scotland Group plc | |
| 4.16* | Second Placing and Open Offer Agreement dated 19 January 2009 among The Royal Bank of Scotland Group plc, UBS Limited, Merrill Lynch International and The Commissioners of Her Majesty’s Treasury | |
| 4.17* | Pre-accession Commitments Deed poll dated 26 February 2009 by The Royal Bank of Scotland plc | |
4.18‡‡*** | Lending Commitments Deed poll dated 26 February 2009 by The Royal Bank of Scotland plc | |
| 4.19 | Acquisition and contingent capital agreement dated 26 November 2009 among The Royal Bank of Scotland Group plc and The Commissioners of Her Majesty’s Treasury | |
| 4.20*** | Accession Agreement dated 26 November 2009 among The Commissioners of Her Majesty’s Treasury, The Royal Bank of Scotland plc and The Royal Bank of Scotland Group plc relating to the UK Asset Protection Scheme | |
| 4.21 | Agreements to forego Tax reliefs dated 26 November 2009 among The Commissioners of Her Majesty’s Treasury, The Commissioners for Her Majesty’s Revenue and Customs, The Royal Bank of Scotland plc, The Royal Bank of Scotland Group plc and ABN AMRO Bank N.V. in connection with an Exit Fee payable under an Accession Agreement relating to the UK Asset Protection Scheme | |
| 4.22 | Agreements to forego Tax reliefs dated 26 November 2009 among The Commissioners of Her Majesty’s Treasury, The Commissioners for Her Majesty’s Revenue and Customs, The Royal Bank of Scotland plc, The Royal Bank of Scotland Group plc and ABN AMRO Bank N.V. in connection with an Acquisition and Contingent Capital Agreement | |
| 4.23 | Agreements to forego Tax reliefs dated 26 November 2009 among The Commissioners of Her Majesty’s Treasury, The Commissioners for Her Majesty’s Revenue and Customs, The Royal Bank of Scotland plc, The Royal Bank of Scotland Group plc and ABN AMRO Bank N.V. in connection with an Accession Agreement relating to the UK Asset Protection Scheme | |
| 4.24*** | State Aid Commitment Deed dated 26 November 2009 among The Commissioners of Her Majesty’s Treasury and The Royal Bank of Scotland Group plc | |
| 4.25*** | State Aid Cost Reimbursement Deed dated 26 November 2009 among The Commissioners of Her Majesty’s Treasury and The Royal Bank of Scotland Group plc | |
| 4.26 | Amendment to the Lending Commitments Deed poll dated 23 March 2010 by The Royal Bank of Scotland plc | |
| 4.27*** | Restated Consortium and Shareholders’ Agreement dated 1 April 2010, among The Royal Bank of Scotland Group plc, Banco Santander, S.A., The State of the Netherlands and RFS Holdings B.V. | |
| 4.28 | UK Asset Protection Scheme Terms and Conditions | |
| 7.1 | Explanation of ratio calculations | |
| 8.1 | Principal subsidiaries of The Royal Bank of Scotland plc | |
| 12.1 | CEO certification required by Rule 13a-14(a) | |
| 12.2 | CFO certification required by Rule 13a-14(a) | |
| 13.1 | Certification required by Rule 13a-14(a) | |
| 15.1 | Consent of independent registered public accounting firm | |
| † | Previously filed and incorporated by reference to Exhibit 1 to the Registration Statement on Form F-6 (Registration No. 333-144756) (filed on 20 July 2007) | |
| ‡ | Previously filed and incorporated by reference to Exhibit A of Exhibit 1 to the Registration Statement on Form F-6 (Registration No. 333-144756) (filed on 20 July 2007) | |
| § | Previously filed and incorporated by reference to Exhibit 2.3 to the Group’s Annual Report on Form 20-F for the fiscal year ended 31 December 2007 (File No. 1-10306) | |
| * | Previously filed and incorporated by reference to Exhibit 4.1, 4.2, 4.8, 4.9, 4.12, 4.13, 4.14, 4.15, 4.16, 4.17, 4.18, 4.19, 4.20, 4.21 and 4.22 respectively to the Group’s Annual Report on Form 20-F for the fiscal year ended 31 December 2008 (file No. 1-10306) | |
| ** | Previously filed and incorporated by reference to Exhibit 4.11 to the Group’s Annual Report on Form 20-F for the fiscal year ended 31 December 2006 (file No. 1-10306) except that the sentence “PROVIDED THAT this Indemnity is given subject to the provisions of Section 309A Company Act 1985” has been replaced with “PROVIDED THAT this Indemnity is given subject to the provisions of Section 234 Company Act 2001”. | |
| *** | Confidential treatment has been requested. Confidential materials have been redacted and separately filed with the SEC. | |
| ‡‡ | Previously filed and incorporated by reference to Exhibit 4.3 to the Group’s Annual Report on Form 20-F/A for the fiscal year ended 31 December 2008 (File No. 1-10306) |
363