Exhibit (17)(a)
MASSMUTUAL SELECT FUNDS
This Prospectus describes the following Funds:
Fund Name | Class I | Class R5 | Service Class | Administrative Class | Class A | Class R4 | Class R3 | |||||||
MassMutual Select Total Return Bond Fund | MSPZX | MSPSX | MSPHX | MSPLX | MPTRX | MSPGX | MSPNX | |||||||
MassMutual Select Strategic Bond Fund | MSBZX | MBSSX | MBSYX | MSBLX | MSBAX | MSBRX | MSBNX | |||||||
MassMutual Select BlackRock Global Allocation Fund | MGJIX | MGSSX | MGSYX | MGSLX | MGJAX | MGJFX | MGJRX | |||||||
MassMutual Select Diversified Value Fund | MDDIX | MDVSX | MDVYX | MDDLX | MDDAX | MDDRX | MDVNX | |||||||
MassMutual Select Fundamental Value Fund | MFUZX | MVUSX | MFUYX | MFULX | MFUAX | MFUFX | MFUNX | |||||||
MassMutual Select Large Cap Value Fund | MLVZX | MLVSX | MMLYX | MLVLX | MMLAX | MLVFX | MLVNX | |||||||
MM S&P 500® Index Fund | MMIZX | MIEZX | MMIEX | MIEYX | MMFFX | MIEAX | MMINX | |||||||
MassMutual Select Focused Value Fund | MFVZX | MFVSX | MMFYX | MMFVX | MFVAX | MFVFX | MFVNX | |||||||
MassMutual Select Fundamental Growth Fund | MOTZX | MOTCX | MOTYX | MOTLX | MOTAX | MFGFX | MOTNX | |||||||
MassMutual Select Blue Chip Growth Fund | MBCZX | MBCSX | MBCYX | MBCLX | MBCGX | MBGFX | MBCNX | |||||||
MassMutual Select Growth Opportunities Fund | MMAZX | MGRSX | MAGYX | MAGLX | MMAAX | MMGFX | MMANX | |||||||
MassMutual Select Mid-Cap Value Fund | MLUZX | MLUSX | MLUYX | MLULX | MLUAX | MLUFX | MLUNX | |||||||
MassMutual Select Small Cap Value Equity Fund | MMQIX | MMQSX | MMQYX | MMQLX | MMQAX | MMQFX | MMQTX | |||||||
MassMutual Select Small Company Value Fund | MSVZX | MSVSX | MMVYX | MMYLX | MMYAX | MMVFX | MSVNX | |||||||
MM S&P® Mid Cap Index Fund | MDKZX | MDKIX | MDKSX | MDKYX | MDKAX | MDKFX | MDKTX | |||||||
MM Russell 2000® Small Cap Index Fund | MCJZX | MCJIX | MCJSX | MCJYX | MCJAX | MCJFX | MCJTX | |||||||
MassMutual Select Mid Cap Growth Equity II Fund | MEFZX | MGRFX | MEFYX | MMELX | MEFAX | MEFFX | MEFNX | |||||||
MassMutual Select Small Cap Growth Equity Fund | MSGZX | MSGSX | MSCYX | MSGLX | MMGEX | MSERX | MSGNX | |||||||
MassMutual Select Diversified International Fund | MMZIX | MMZSX | MMZYX | MMZLX | MMZAX | MMZFX | MMZTX | |||||||
MM MSCI EAFE® International Index Fund | MKRZX | MKRIX | MKRSX | MKRYX | MKRAX | MKRFX | MKRTX | |||||||
MassMutual Select Overseas Fund | MOSZX | MOSSX | MOSYX | MOSLX | MOSAX | MOSFX | MOSNX |
The Securities and Exchange Commission has not approved or disapproved these securities or passed upon the adequacy of this Prospectus. Any statement to the contrary is a crime.
PROSPECTUS
February 1, 2017
– 1 –
MASSMUTUAL SELECT FUNDS
Supplement dated May 8, 2017 to the
Prospectus dated February 1, 2017
This supplement provides new and additional information beyond that contained in the Prospectus and any previous supplements. It should be retained and read in conjunction with the Prospectus and any previous supplements.
Effective immediately, the following information replaces similar information found on page 150 in the fourth paragraph of the section titled Buying, Redeeming, and Exchanging Shares:
Generally, you can exchange shares of one Fund for the same class of shares of another Fund, except in the case of the Total Return Bond Fund and S&P 500 Index Fund. For individual retirement accounts described in Code Section 408, Class R4 shares of the Total Return Bond Fund and S&P 500 Index Fund may only be exchanged for Class A shares of another Fund and Class A shares of any other Fund may only be exchanged for Class R4 shares of these Funds. An exchange is treated as a sale of shares in one Fund and a purchase of shares in another Fund at the NAV next determined after the exchange request is received and accepted by the transfer agent, MML Advisers, a broker-dealer, or another intermediary authorized for this purpose. Exchange requests involving a purchase into any Fund (except the Strategic Bond Fund), however, will not be accepted if you have already made a purchase followed by a redemption involving the same Fund within the last 60 days. This restriction does not apply to rebalancing trades executed by any of the MassMutual RetireSMARTSM Funds. This restriction does not apply to exchanges made pursuant to certain asset allocation programs, systematic exchange programs, and dividend exchange programs. If you place an order to exchange shares of one Fund for another through a broker-dealer or other intermediary then, in order for your exchange to be effected based on the Funds’ next determined NAVs, the broker-dealer or other intermediary must receive your request before the close of regular trading on the NYSE, and the broker-dealer or other intermediary must subsequently communicate the request properly to the Funds.
Effective immediately, the following information replaces similar information found on page 152 in the first paragraph of the section titled Determining Net Asset Value:
The NAV of each Fund’s shares is determined once daily as of the close of regular trading on the NYSE, on each Business Day. A “Business Day” is every day the NYSE is open. If the NYSE is scheduled to close early, the Business Day will be considered to end as of the time of the NYSE’s scheduled close. A Fund will not treat an intraday disruption in NYSE trading or other event that causes an unscheduled closing of the NYSE as a close of business of the NYSE for these purposes and will instead fair value securities in accordance with procedures approved annually by the Trustees, and under the general oversight of the Trustees. The NYSE normally closes at 4:00 p.m. Eastern Time, but may close earlier on some days. The NYSE currently is not open for trading on New Year’s Day, Martin Luther King, Jr. Day, President’s Day, Good Friday, Memorial Day, Independence Day, Labor Day, Thanksgiving Day, and Christmas Day. Each Fund calculates the NAV of each of its classes of shares by dividing the total value of the assets attributable to that class, less the liabilities attributable to that class, by the number of shares of that class that are outstanding. On holidays and other days when the NYSE is closed, each Fund’s NAV generally is not calculated and the Funds do not anticipate accepting buy or sell orders. However, the value of each Fund’s assets may still be affected on such days to the extent that a Fund holds foreign securities that trade on days that foreign securities markets are open.
PLEASE RETAIN THIS SUPPLEMENT FOR FUTURE REFERENCE
B3001M-17-05
– 2 –
MASSMUTUAL SELECT FUNDS
Supplement dated May 8, 2017 to the
Statement of Additional Information dated February 1, 2017
This supplement provides new and additional information beyond that contained in the Statement of Additional Information (“SAI”) and any previous supplements. It should be retained and read in conjunction with the SAI and any previous supplements.
Effective March 1, 2017, Michael Eldredge resigned as a Vice President of the Trust.
Effective immediately, the following information replaces similar information found on page B-6 under the heading S&P 500 Index Fund, S&P Mid Cap Index Fund, Russell 2000 Small Cap Index Fund, and MSCI EAFE International Index Fund in the section titled Additional Investment Policies:
Tracking Error. There are several reasons why the performance of the S&P 500 Index Fund, S&P Mid Cap Index Fund, Russell 2000 Small Cap Index Fund, and MSCI EAFE International Index Fund may not track its respective index exactly. Unlike the indexes, the Funds incur administrative expenses and transaction costs in trading stocks. In addition, the composition of the indexes and each Fund’s portfolio may occasionally diverge. Furthermore, the timing and magnitude of cash inflows from investors buying shares could create balances of uninvested cash for the Funds. Conversely, the timing and magnitude of cash outflows to investors selling shares could require ready reserves of uninvested cash. Either situation would likely cause a Fund’s performance to deviate from the “fully invested” index. The Funds’ subadviser, NTI, expects that, under normal circumstances, the annual performance of each Fund, before fees and expenses, will track the performance of the index within a 0.95 correlation coefficient.
Effective immediately, the following information replaces similar information found on page B-10 under the heading Banking Relationships in the section titled Additional Investment Policies:
NTI and its affiliates, including its parent Northern Trust Corporation, deal, trade, and invest for their own account and for the accounts of their clients in the types of securities in which the S&P 500 Index Fund, S&P Mid Cap Index Fund, Russell 2000 Small Cap Index Fund, and MSCI EAFE International Index Fund may invest and may have deposit, loan, and commercial banking relationships with the issuers of securities purchased by the Funds.
The following information replaces similar information found on page B-62 under the heading Trustee Compensation in the section titled Management of the Trust:
During 2016, the Trust, on behalf of each Fund, paid each of its Trustees who was not an officer or employee of MassMutual a fee of $18,375 per quarter plus a fee of $2,940 per in-person meeting attended plus a fee of $2,940 for the annual Contract Committee meeting. The Chairperson of the Board was paid an additional 50% of the quarterly fee, the in-person meeting fee, and the Contract Committee meeting fee. The Chairpersons of each of the Audit Committee and the Contract Committee were paid an additional 10% of the quarterly fee, the in-person meeting fee, and the Contract Committee meeting fee. The Chairpersons of each of the Nominating Committee and the Governance Committee were paid an additional 5% of the quarterly fee, the in-person meeting fee, and the Contract Committee meeting fee. Such Trustees who served on the Audit Committee, other than the Chairperson, were paid an additional 4% of the quarterly fee, the in-person meeting fee, and the Contract Committee meeting fee. No additional fees were paid for attending any other committee meetings or any special telephonic meetings. In addition, the Trust reimbursed out-of-pocket business travel expenses to such Trustees. Trustees who were officers or employees of MassMutual received no fees from the Trust.
Effective immediately, the following information replaces similar information found on page B-117 in the section titled Valuation of Portfolio Securities:
The NAV of each Fund’s shares is determined once daily as of the close of regular trading on the NYSE, on each day the NYSE is open for trading (a “business day”). The NYSE normally closes at 4:00 p.m. Eastern Time,
– 3 –
but may close earlier on some days. If the NYSE is scheduled to close early, the business day will be considered to end as of the time of the NYSE’s scheduled close. A Fund will not treat an intraday disruption in NYSE trading or other event that causes an unscheduled closing of the NYSE as a close of business of the NYSE for these purposes and will instead fair value securities in accordance with procedures approved annually by the Board, and under the general oversight of the Board. The NYSE currently is not open for trading on New Year’s Day, Martin Luther King, Jr. Day, President’s Day, Good Friday, Memorial Day, Independence Day, Labor Day, Thanksgiving Day, and Christmas Day. Each Fund calculates the NAV of each of its classes of shares by dividing the total value of the assets attributable to that class, less the liabilities attributable to that class, by the number of shares of that class that are outstanding. On holidays and other days when the NYSE is closed, each Fund’s NAV generally is not calculated and the Funds do not anticipate accepting buy or sell orders. However, the value of each Fund’s assets may still be affected on such days to the extent that a Fund holds foreign securities that trade on days that foreign securities markets are open.
PLEASE RETAIN THIS SUPPLEMENT FOR FUTURE REFERENCE
SAI B3001M-17-03
– 4 –
MASSMUTUAL SELECT FUNDS
Supplement dated June 30, 2017 to the
Statement of Additional Information dated February 1, 2017
This supplement provides new and additional information beyond that contained in the Statement of Additional Information (“SAI”) and any previous supplements. It should be retained and read in conjunction with the SAI and any previous supplements.
Effective immediately, the following information replaces similar information found on page B-42 under the heading Other Income- Producing Securities in the section titled Additional Investment Policies:
Other types of income-producing securities the Funds may purchase, include, but are not limited to, the following:
| • | Variable and floating rate obligations. Variable and floating rate securities are debt instruments that provide for periodic adjustments in the interest rate paid on the security and, under certain limited circumstances, may have varying principal amounts. Variable rate securities provide for a specified periodic adjustment in the interest rate, while floating rate securities have interest rates that may change with change to the level of prevailing interest rates or the issuer’s credit quality. These types of securities are relatively long-term instruments that often carry demand features permitting the holder to demand payment of principal at any time or at specified intervals prior to maturity. There is a risk that the current interest rate on variable and floating securities may not accurately reflect current market interest rates or adequately compensate the holder for the current creditworthiness of the issuer. Due to their variable- or floating-rate features, these instruments will generally pay higher levels of income in a rising interest rate environment and lower levels of income as interest rates decline. For the same reason, the market value of a variable- or floating-rate instrument is generally expected to have less sensitivity to fluctuations in market interest rates than a fixed-rate instrument, although the value of a floating-rate instrument may nonetheless decline as interest rates rise and due to other factors, such as changes in credit quality. Some variable or floating rate securities are structured with liquidity features such as (1) put options or tender options that permit holders (sometimes subject to conditions) to demand payment of the unpaid principal balance plus accrued interest from the issuers or certain financial intermediaries or (2) auction rate features, remarketing provisions, or other maturity-shortening devices designed to enable the issuer to refinance or redeem outstanding debt securities (market-dependent liquidity features). The market-dependent liquidity features may not operate as intended as a result of the issuer’s declining creditworthiness, adverse market conditions, or other factors or the inability or unwillingness of a participating broker-dealer to make a secondary market for such securities. As a result, variable or floating rate securities that include market-dependent liquidity features may lose value and the holders of such securities may be required to retain them for an extended period of time or until maturity. |
In order to use these investments most effectively, a Fund’s investment adviser or subadviser must correctly assess probable movements in interest rates. This involves different skills than those used to select most portfolio securities. If the investment adviser or subadviser incorrectly forecasts such movements, a Fund could be adversely affected by the use of variable or floating rate obligations.
| • | Standby commitments. These instruments, which are similar to a put, give a Fund the option to obligate a broker, dealer, or bank to repurchase a security held by the Fund at a specified price. |
| • | Tender option bonds. Tender option bonds are relatively long-term bonds that are coupled with the agreement of a third party, such as a broker, dealer, or bank, to grant the holders of such securities the option to tender the securities to the institution at periodic intervals. |
| • | Inverse floaters. Inverse floaters have variable interest rates that typically move in the opposite direction from movements in prevailing interest rates, most often short-term rates. Accordingly, the |
– 5 –
value of inverse floaters, or other obligations or certificates structured to have similar features, generally moves in the opposite direction from interest rates. The value of an inverse floater can be considerably more volatile than the value of other debt instruments of comparable maturity and credit quality. Inverse floaters incorporate varying degrees of leverage. Generally, greater leverage results in greater price volatility for any given change in interest rates. Inverse floaters may be subject to legal or contractual restrictions on resale and therefore may be less liquid than other types of securities. Similar to variable and floating rate obligations, effective use of inverse floaters requires skills different from those needed to select most portfolio securities. If movements in interest rates are incorrectly anticipated, a Fund could lose money or the NAV of its shares could decline by the use of inverse floaters.
| • | Strip bonds. Strip bonds are debt securities that are stripped of their interest, usually by a financial intermediary, after the securities are issued. The market value of these securities generally fluctuates more in response to changes in interest rates than interest-paying securities of comparable maturities. |
Standby commitments, tender option bonds, and instruments with demand features are primarily used by the Funds for the purpose of increasing the liquidity of a Fund’s portfolio.
Effective June 6, 2017, the following information supplements the information found under the heading Interested Trustee (which will now be known herewith as Interested Trustees) found on page B-55 in the section titled Management of the Trust:
| Teresa A. Hassara | Trustee of the Trust | |
| 100 Bright Meadow Blvd. | ||
Enfield, CT 06082-1981 Age: 55 Trustee since 2017 | ||
| Trustee of 93 portfolios in fund complex |
Head of Workplace Solutions (since 2017), MassMutual; President of Institutional Retirement (2009-2016), TIAA-CREF; Trustee (since 2017), MML Series Investment Fund (open-end investment company); Trustee (since 2017), MML Series Investment Fund II (open-end investment company); Trustee (since 2017), MassMutual Premier Funds (open-end investment company).
Effective June 7, 2017, the information for Brian K. Haendiges on page B-56 under the heading Principal Officers in the section titled Management of the Trust is hereby deleted.
Effective June 7, 2017, the following information supplements the information found on pages B-55 – B-57 under the heading Principal Officers in the section titled Management of the Trust:
Joseph Fallon 100 Bright Meadow Blvd. | Vice President of the Trust | |
Enfield, CT 06082-1981 Age: 42 Officer since 2015 | ||
Officer of 93 portfolios in fund complex |
Investment Director (since 2014), MML Advisers; Investment Director (since 2006), MassMutual; Vice President (since 2017), Assistant Vice President (2015-2017), MassMutual Premier Funds (open-end investment company); Vice President (since 2017), Assistant Vice President (2015-2017), MML Series Investment Fund (open-end investment company); Vice President (since 2017), Assistant Vice President (2015-2017), MML Series Investment Fund II (open-end investment company).
– 6 –
| Jill Nareau Robert | Vice President and Assistant Secretary of the Trust | |
| 100 Bright Meadow Blvd. | ||
| Enfield, CT 06082-1981 | ||
| Age: 45 | ||
| Officer since 2008 | ||
| Officer of 93 portfolios in fund complex |
Assistant Vice President and Counsel (since 2009), MassMutual; Assistant Secretary (since 2015), MML Advisers; Vice President and Assistant Secretary (since 2017), Assistant Secretary (2008-2017), MassMutual Premier Funds (open-end investment company); Vice President and Assistant Secretary (since 2017), Assistant Secretary (2008-2017), MML Series Investment Fund (open-end investment company); Vice President and Assistant Secretary (since 2017), Assistant Secretary (2008-2017), MML Series Investment Fund II (open-end investment company).
Effective June 7, 2017, the following information replaces similar information for Tina Wilson found on page B-57 under the heading Principal Officers in the section titled Management of the Trust:
| Tina Wilson | Vice President of the Trust | |
| 100 Bright Meadow Blvd. | ||
| Enfield, CT 06082-1981 | ||
| Age: 46 | ||
| Officer since 2016 | ||
| Officer of 93 portfolios in fund complex |
Vice President and Head of Investments (since 2016), MML Advisers; Senior Vice President (since 2014), Vice President (2009-2014), MassMutual; Vice President (since 2016), MassMutual Premier Funds (open-end investment company); President (since 2017), Vice President (2016-2017), MML Series Investment Fund (open-end investment company); President (since 2017), Vice President (2016-2017), MML Series Investment Fund II (open-end investment company).
Effective June 6, 2017, the following information replaces similar information found on page B-57 in the section titled Management of the Trust:
Each Trustee of the Trust serves until the next meeting of shareholders called for the purpose of electing Trustees and until the election and qualification of his or her successor or until he or she dies, resigns, or is removed. Notwithstanding the foregoing, unless the Trustees determine that it is desirable and in the best interest of the Trust that an exception to the retirement policy of the Trust be made, a Trustee shall retire and cease to serve as a Trustee upon the conclusion of the calendar year in which such Trustee attains the age of seventy-five years, however, with the exception of Mr. Robert E. Joyal, an interested Trustee of the Trust shall no longer serve as a Trustee if or when they are no longer an employee of MassMutual or an affiliate.
Effective June 6, 2017, the following information supplements the information found on pages B-57 and B-58 under the heading Additional Information About the Trustees in the section titled Management of the Trust:
Teresa A. Hassara – As an executive of financial services companies with over 30 years of experience, Ms. Hassara’s deep industry expertise includes executive roles encompassing all aspects of relationship management and service delivery, as well as in strategy and planning, product and services management, customer loyalty analytics, and participant education and advisory solutions for clients in both the public and private sectors. Ms. Hassara has spent the majority of that time with three companies: Bankers Trust, Fidelity Investments, and, most recently, TIAA-CREF, where she led the company’s Institutional Retirement business serving more than 16,000 higher education, state government, and other nonprofit organizations. Ms. Hassara has FINRA Series 6, 24, 26, and 63 registrations and holds a BA from Vanderbilt University and an MBA from The Wharton School.
– 7 –
Effective June 6, 2017, the Nominating Committee and the Governance Committee have been combined into one committee, which is now called the Nominating and Governance Committee.
Effective June 6, 2017, the following information replaces similar information found on pages B-58 – B-60 under the heading Board Committees and Meetings in the section titled Management of the Trust:
Nominating and Governance Committee. The Trust has a Nominating and Governance Committee, consisting of each Trustee who is not an “interested person” of the Trust. There are no regular meetings of the Nominating and Governance Committee, but rather meetings are held as appropriate. During the fiscal year ended September 30, 2016, while they were both individual committees (formerly the Nominating Committee and the Governance Committee), the Nominating Committee and Governance Committee each met once. The Nominating and Governance Committee (a) identifies individuals qualified to become independent members of the Funds’ Board in the event that a position currently filled by an Independent Trustee is vacated or created; (b) evaluates the qualifications of Independent Trustee candidates; (c) nominates Independent Trustee nominees for election or appointment to the Board; (d) sets any standards necessary or qualifications for service on the Board; (e) recommends periodically to the full Board an Independent Trustee to serve as Chairperson; (f) evaluates at least annually the independence and overall performance of counsel to the Independent Trustees; (g) annually reviews the compensation of the Independent Trustees; and (h) oversees board governance issues including, but not limited to, (i) evaluating the board and committee structure and the performance of Trustees, (ii) considering and addressing any conflicts, (iii) considering the retirement policies of the Board, and (iv) considering and making recommendations to the Board at least annually concerning the Trust’s directors and officers liability insurance coverage.
The Nominating and Governance Committee will consider and evaluate nominee candidates properly submitted by shareholders of the Trust in the same manner as it considers and evaluates candidates recommended by other sources. The Nominating and Governance Committee may also consider any other facts and circumstances attendant to such shareholder submission as may be deemed appropriate by the Nominating and Governance Committee, including, without limitation, the value of the Funds’ securities owned by the shareholder and the length of time such shares have been held by the shareholder. A recommendation of a shareholder of the Trust must be submitted as described below to be considered properly submitted for purposes of the Nominating and Governance Committee’s consideration. The shareholders of the Trust must submit any such recommendation (a “Shareholder Recommendation”) in writing to the Trust’s Nominating and Governance Committee, to the attention of the Secretary, at the address of the principal executive offices of the Trust, which is 100 Bright Meadow Blvd., Enfield, CT 06082-1981. The Shareholder Recommendation must be delivered to or mailed and received at the principal executive offices of the Trust at least 60 calendar days before the date of the meeting at which the Nominating and Governance Committee is to select a nominee for Independent Trustee. The Shareholder Recommendation must include: (i) a statement in writing setting forth: (A) the name, age, date of birth, phone number, business address, residence address, nationality, and pertinent qualifications of the person recommended by the shareholder (the “Shareholder Candidate”), including an explanation of why the shareholder believes the Candidate will make a good Trustee; (B) the class or series and number of all shares of the Funds owned of record or beneficially by the Shareholder Candidate, as reported to such shareholder by the Shareholder Candidate; (C) any other information regarding the Shareholder Candidate called for with respect to director nominees by paragraphs (a), (d), (e), and (f) of Item 401 of Regulation S-K or paragraph (b) of Item 22 of Rule 14a-101 (Schedule 14A) under the Securities Exchange Act of 1934, as amended (the “Exchange Act”), adopted by the SEC (or the corresponding provisions of any regulation or rule subsequently adopted by the SEC or any successor agency applicable to the Funds); (D) any other information regarding the Shareholder Candidate that would be required to be disclosed if the Shareholder Candidate were a nominee in a proxy statement or other filing required to be made in connection with solicitation of proxies for election of trustees or directors pursuant to Section 14 of the Exchange Act and the rules and regulations promulgated thereunder; and (E) whether the recommending shareholder believes that the Shareholder Candidate is or will be an “interested person” (as defined in Section 2(a)(19) of the 1940 Act) of the Funds and, if not an “interested person,” information regarding the Shareholder Candidate that will be sufficient for the Funds to make such determination; (ii) the written and signed consent of the Shareholder Candidate to be named as a nominee, consenting to (1) the disclosure, as may be necessary or appropriate, of such Shareholder Candidate’s information submitted in
– 8 –
accordance with (i) above; and (2) service as a Trustee if elected; (iii) the recommending shareholder’s name as it appears on the Funds’ books, the number of all shares of each series of the Funds owned beneficially and of record by the recommending shareholder; (iv) a description of all arrangements or understandings between the recommending shareholder and the Shareholder Candidate and any other person or persons (including their names) pursuant to which the Shareholder Recommendation is being made by the recommending shareholder; and (v) such other information as the Nominating and Governance Committee may require the Shareholder Candidate to furnish as it may reasonably require or deem necessary to determine the eligibility of such Shareholder Candidate to serve as a Trustee or to satisfy applicable law.
Shareholders may send other communications to the Trustees by addressing such correspondence directly to the Secretary of the Trust, c/o Massachusetts Mutual Life Insurance Company, 100 Bright Meadow Blvd., Enfield, CT 06082-1981. When writing to the Board, shareholders should identify themselves, the fact that the communication is directed to the Board, the Fund they are writing about, and any relevant information regarding their Fund holdings. Except as provided below, the Secretary shall either (i) provide a copy of each shareholder communication to the Board at its next regularly scheduled meeting or (ii) if the Secretary determines that the communication requires more immediate attention, forward the communication to the Board promptly after receipt. The Secretary will also provide a copy of each shareholder communication to the Trust’s Chief Compliance Officer.
The Secretary may, in good faith, determine that a shareholder communication should not be provided to the Board because it does not reasonably relate to the Trust or its operations, management, activities, policies, service providers, Board, officers, shareholders, or other matters relating to an investment in the Funds or is otherwise ministerial in nature (such as a request for Fund literature, share data, or financial information). The Secretary will provide to the Board on a quarterly basis a summary of the shareholder communications not provided to the Board by virtue of this paragraph.
Effective June 6, 2017, the following information replaces similar information found on page B-62 under the heading Trustee Compensation in the section titled Management of the Trust:
During 2017, the Trust, on behalf of each Fund, pays each of its Trustees who is not an officer or employee of MassMutual a fee of $20,000 per quarter plus a fee of $3,000 per in-person meeting attended plus a fee of $3,000 for the annual Contract Committee meeting. The Chairperson of the Board is paid an additional 50% of the quarterly fee, the in-person meeting fee, and the Contract Committee meeting fee. The Chairpersons of each of the Audit Committee and the Contract Committee are paid an additional 10% of the quarterly fee, the in-person meeting fee, and the Contract Committee meeting fee. The Chairperson of the Nominating and Governance Committee is paid an additional 5% of the quarterly fee, the in-person meeting fee, and the Contract Committee meeting fee. Such Trustees who serve on the Audit Committee, other than the Chairperson, are paid an additional 4% of the quarterly fee, the in-person meeting fee, and the Contract Committee meeting fee. No additional fees are paid for attending any other committee meetings or any special telephonic meetings. In addition, the Trust reimburses out-of-pocket business travel expenses to such Trustees. Trustees who are officers or employees of MassMutual receive no fees from the Trust.
Effective immediately, the information related to Charles Ko found on page B-315 under the heading Other Accounts Managed in the section titled Appendix C—Additional Portfolio Manager Information is hereby removed.
Effective immediately, the following information supplements similar information for Invesco Advisers, Inc. related to the MassMutual Select Small Company Value Fund found on page B-315 under the headings Other Accounts Managed and Ownership of Securities in the section titled Appendix C—Additional Portfolio Manager Information:
The portfolio managers of the Small Company Value Fund are Glen Murphy, Donna Chapman Wilson, Michael Abata, and Kenneth Masse.
– 9 –
Other Accounts Managed:
| Number of Accounts Managed* | Total Assets* | Number of Accounts Managed for which Advisory Fee is Performance- Based* | Total Assets* | |||||||||||||
Kenneth Masse | ||||||||||||||||
Registered investment companies** | 2 | | $94.3 million | | 0 | $ | 0 | |||||||||
Other pooled investment vehicles | 3 | | $124.0 million | | 0 | $ | 0 | |||||||||
Other accounts | 0 | $0 | 0 | $ | 0 | |||||||||||
| * | The information provided is as of April 30, 2017. |
| ** | Does not include the Small Company Value Fund. |
Ownership of Securities:
As of April 30, 2017, the portfolio manager did not own any shares of the Small Company Value Fund.
PLEASE RETAIN THIS SUPPLEMENT FOR FUTURE REFERENCE
SAI B3001M-17-04
– 10 –
MASSMUTUAL SELECT FUNDS
Select Diversified Value Fund
Supplement dated August 10, 2017 to the
Prospectus dated February 1, 2017 and the
Summary Prospectus dated February 1, 2017
This supplement provides new and additional information beyond that contained in the Prospectus and Summary Prospectus, and any previous supplements. It should be retained and read in conjunction with the Prospectus and Summary Prospectus, and any previous supplements.
Effective immediately, the information related to Adam C. Liebhoff for the Select Diversified Value Fund found under the heading Portfolio Managers in the section titled Management (Page 27 of the Prospectus), is hereby removed.
Effective immediately, the information related to Adam C. Liebhoff of Loomis, Sayles & Company, L.P. found under the heading Subadvisers and Portfolio Managers in the section titled Management of the Funds (page 137 of the Prospectus), is hereby removed.
PLEASE RETAIN THIS SUPPLEMENT FOR FUTURE REFERENCE
B3001M-17-08
DV-17-01
– 11 –
MASSMUTUAL SELECT FUNDS
Supplement dated August 10, 2017 to the
Statement of Additional Information dated February 1, 2017
This supplement provides new and additional information beyond that contained in the Statement of Additional Information (“SAI”) and any previous supplements. It should be retained and read in conjunction with the SAI and any previous supplements.
Effective immediately, the information related to Adam C. Liebhoff found on page B-324 under the heading Other Accounts Managed in the section titled Appendix C – Additional Portfolio Manager Information is hereby removed.
PLEASE RETAIN THIS SUPPLEMENT FOR FUTURE REFERENCE
SAI B3001M-17-06
– 12 –
MASSMUTUAL SELECT FUNDS
Supplement dated September 22, 2017 to the
Prospectus dated February 1, 2017
This supplement provides new and additional information beyond that contained in the Prospectus and any previous supplements. It should be retained and read in conjunction with the Prospectus and any previous supplements.
The following information pertains to the Large Cap Value Fund:
The Board of Trustees of the MassMutual Select Funds has approved the reorganization of the MassMutual Select Large Cap Value Fund (the “Fund”) into the MassMutual Select Diversified Value Fund. The reorganization is subject to approval by Massachusetts Mutual Life Insurance Company (“MassMutual”), in its capacity as the majority shareholder of the Fund. MassMutual anticipates approving the reorganization by written consent in January 2018. No assurance can be given that the reorganization will occur.
Under the terms of the proposed Agreement and Plan of Reorganization, the Fund’s assets and liabilities would be transferred to the MassMutual Select Diversified Value Fund in return for shares of the MassMutual Select Diversified Value Fund. Those shares would be distributed pro rata to shareholders of the Fund in exchange for their Fund shares. Shareholders of the Fund would thus become shareholders of the MassMutual Select Diversified Value Fund and would receive shares of the MassMutual Select Diversified Value Fund with a value equal to their shares of the Fund at the time of the reorganization. The reorganization is expected to be a tax-free event for federal income tax purposes.
The Fund seeks both capital growth and income as its investment objective, while the MassMutual Select Diversified Value Fund seeks as its objective to achieve long-term growth of capital and income by investing primarily in a diversified portfolio of equity securities of larger, well-established companies.
Descriptions of the MassMutual Select Diversified Value Fund and the terms of the reorganization will be contained in a combined prospectus/information statement, which is expected to be mailed to shareholders of the Fund in December 2017.
The foregoing is not an offer to sell, nor a solicitation of an offer to buy, shares of the MassMutual Select Diversified Value Fund, nor is it a solicitation of any proxy. For more information regarding the MassMutual Select Diversified Value Fund, or to receive a free copy of a prospectus/information statement relating to the reorganization (and containing important information about fees, expenses, and risk considerations) once a registration statement relating to the reorganization has been filed with the Securities and Exchange Commission and becomes effective, please call 1-888-309-3539. The prospectus/information statement will also be available for free on the Securities and Exchange Commission’s Web site (http://www.sec.gov). Please read the prospectus/information statement carefully before making any investment decisions.
Effective immediately, the section entitled “Purchase and Sale of Fund Shares” found on page 36 is restated in its entirety as follows:
PURCHASE AND SALE OF FUND SHARES
Shares of the Fund are generally available to retirement plans, other institutional investors, and individual retirement accounts. Fund shares are redeemable on any business day by written request, telephone, or internet (available to certain customers).
The Board of Trustees of the MassMutual Select Funds has approved the reorganization of the Fund into the MassMutual Select Diversified Value Fund. The reorganization is subject to approval by Massachusetts Mutual Life Insurance Company, in its capacity as the majority shareholder of the Fund, by written consent expected to be executed in January 2018. No assurance can be given that the reorganization will occur.
– 13 –
Descriptions of the MassMutual Select Diversified Value Fund and the terms of the reorganization will be contained in a combined prospectus/information statement, which is expected to be mailed to shareholders of the Fund in December 2017.
Effective September 21, 2017, T. Rowe Price Associates, Inc. (“T. Rowe Price”) replaced Loomis, Sayles & Company, L.P. (“Loomis Sayles”) as a co-subadviser of the Diversified Value Fund.
Effective September 21, 2017, the following information replaces similar information found on pages 24-25 for the Diversified Value Fund under the heading Principal Investment Strategies in the section titled Investments, Risks, and Performance:
The Fund invests primarily in stocks of companies that the subadvisers believe are undervalued in the marketplace. While the Fund does not limit its investments to issuers in a particular capitalization range, the subadvisers currently focus on securities of larger size companies. The Fund normally invests at least 80% of its net assets (plus the amount of any borrowings for investment purposes) in stocks, securities convertible into stocks, and other securities, such as warrants and stock rights, whose value is based on stock prices. The Fund typically invests most of its assets in securities of U.S. companies, but may invest up to 25% of its total assets in foreign securities and American Depositary Receipts (“ADRs”), including emerging market securities. The Fund is managed by two subadvisers, T. Rowe Price Associates, Inc. (“T. Rowe Price”) and Brandywine Global Investment Management, LLC (“Brandywine Global”), each being responsible for a portion of the portfolio, but not necessarily equally weighted. The Fund may hold a portion of its assets in cash or cash equivalents.
Brandywine Global invests in securities that meet its value criteria, primarily, price-to-earnings, price-to-book, price momentum, and share change and quality, based on both quantitative and fundamental analysis. Brandywine Global expects to hold approximately 150-250 stocks under normal market conditions.
Brandywine Global invests in securities of companies that meet its value criteria based on both quantitative and fundamental analysis. Brandywine Global’s investment process begins with a valuation screen that identifies large cap stocks with favorable financial ratios. A quantitative deselection process is then applied to eliminate equities that have poor price momentum or high share issuance. Finally Brandywine Global performs a thorough fundamental analysis which seeks to identify and eliminate (de-select) companies with deteriorating fundamentals, anticipated earnings declines, or material write-offs. Brandywine Global may also consider additional factors in its selection process.
Brandywine Global typically sells a security of a company when Brandywine Global believes it is no longer a large capitalization value company, if the company’s fundamentals deteriorate, when an investment opportunity arises that Brandywine Global believes is more compelling, or in order to realize gains or limit potential losses. However, Brandywine Global may retain securities of companies that no longer meet its initial purchase criteria.
T. Rowe Price typically employs a “value” approach in selecting investments, using internal research to identify companies that appear to be undervalued by various measures and may be temporarily out of favor but have good prospects for capital appreciation and dividend growth. T. Rowe Price generally looks for companies in the aggregate with one or more of the following: an established operating history; above-average dividend yield and low price/earnings ratio relative to the S&P 500® Index; a sound balance sheet and other positive financial characteristics; and low stock price relative to T. Rowe Price’s view of the company’s underlying value as measured by assets, cash flow, or business franchises. T. Rowe Price generally seeks investments in large-capitalization companies and the yield of the portion of the Fund managed by T. Rowe Price is expected to normally exceed the yield of the S&P 500 Index. T. Rowe Price may sell securities for a variety of reasons, such as to secure gains, limit losses, or redeploy assets into more promising opportunities.
In pursuing its investment objective, each of Brandywine Global and T. Rowe Price has the discretion to purchase some securities that do not meet its normal investment criteria, as described above, when it believes there is an opportunity for substantial appreciation (such as, for example, Brandywine Global or T. Rowe Price believes a security could increase in value as a result of a change in management, an extraordinary corporate event, a new product introduction or innovation, or a favorable competitive development).
– 14 –
Effective September 21, 2017, the REIT Risk found on page 26 is hereby deleted for the Diversified Value Fund under the heading Principal Risks in the section titled Investments, Risks, and Performance.
Effective September 21, 2017, the following information replaces the information found on page 27 for the Diversified Value Fund under the heading Portfolio Managers in the section titled Management:
Subadvisers: Brandywine Global Investment Management, LLC (“Brandywine Global”)
T. Rowe Price Associates, Inc. (“T. Rowe Price”)
Portfolio Managers:
Joseph J. Kirby is a Portfolio Manager at Brandywine Global. He has managed the Fund since January 2010.
Henry F. Otto is a Managing Director and Portfolio Manager at Brandywine Global. He has managed the Fund since January 2010.
Steven M. Tonkovich is a Managing Director and Portfolio Manager at Brandywine Global. He has managed the Fund since January 2010.
John D. Linehan, CFA, is a Vice President and Portfolio Manager at T. Rowe Price. He has managed the Fund since September 2017.
Effective September 21, 2017, the following information supplements the information for Loomis Sayles found under the heading Subadvisers and Portfolio Managers on page 137 in the section titled Management of the Funds:
Effective September 21, 2017, T. Rowe Price replaced Loomis Sayles as a co-subadviser of the Diversified Value Fund, therefore all references to Loomis Sayles as subadviser for the Diversified Value Fund are removed.
Effective September 21, 2017, the following information replaces the first sentence found on page 140 for T. Rowe Price under the heading Subadvisers and Portfolio Managers in the section titled Management of the Funds:
T. Rowe Price Associates, Inc. (“T. Rowe Price”), located at 100 East Pratt Street, Baltimore, Maryland 21202, manages a portion of the portfolio of the Diversified Value Fund, Equity Opportunities Fund, Blue Chip Growth Fund, Mid Cap Growth Fund, and Small Company Value Fund.
Effective September 21, 2017, the following information supplements the information found on pages 140-141 for T. Rowe Price under the heading Subadvisers and Portfolio Managers in the section titled Management of the Funds:
T. Rowe Price replaced Loomis Sayles as a co-subadviser of the Diversified Value Fund on September 21, 2017.
Effective September 21, 2017, the following information replaces similar information for John D. Linehan, CFA found on pages 140-141 for T. Rowe Price under the heading Subadvisers and Portfolio Managers in the section titled Management of the Funds:
John D. Linehan, CFA
is the portfolio manager of a portion of the Diversified Value Fund and Equity Opportunities Fund. Mr. Linehan, investment advisory committee chairman, has day-to-day responsibility for managing the portfolio and works with the committee in developing and executing the portfolio’s investment program. He is a Vice President and Portfolio Manager for T. Rowe Price. Mr. Linehan joined T. Rowe Price in 1998 and has 25 years of investment experience. During the past five years, he has served as a portfolio manager and the head of U.S. Equity for T. Rowe Price.
PLEASE RETAIN THIS SUPPLEMENT FOR FUTURE REFERENCE
B3001M-17-09
– 15 –
MASSMUTUAL SELECT FUNDS
Supplement dated September 22, 2017 to the
Statement of Additional Information dated February 1, 2017
This supplement provides new and additional information beyond that contained in the Statement of Additional Information (“SAI”) and any previous supplements. It should be retained and read in conjunction with the SAI and any previous supplements.
Effective September 21, 2017, T. Rowe Price Associates, Inc. (“T. Rowe Price”) replaced Loomis, Sayles & Company, L.P. (“Loomis Sayles”) as a co-subadviser of the Diversified Value Fund.
Effective September 21, 2017, the following information replaces similar information for the Diversified Value Fund found on page B-3 in the section titled General Information:
The subadvisers for the Diversified Value Fund are Brandywine Global Investment Management, LLC (“Brandywine Global”), located at 2929 Arch Street, 8th Floor, Philadelphia, Pennsylvania 19104, and T. Rowe Price Associates, Inc. (“T. Rowe Price”), located at 100 East Pratt Street, Baltimore, Maryland 21202.
Effective September 21, 2017, the following information replaces the first sentence of the third paragraph on page B-43 in the section titled Additional Investment Policies under the heading Other Investment Companies:
T. Rowe Price may invest the assets of the Diversified Value Fund, Equity Opportunities Fund, Blue Chip Growth Fund, Mid Cap Growth Fund, or Small Company Value Fund, respectively, into money market funds managed pursuant to applicable SEC exemptive orders.
Effective September 21, 2017, the following information replaces similar information found on page B-52 in the section titled Investment Restrictions of the Funds under the heading Non-Fundamental Investment Restrictions of the Funds:
(4) to the extent that shares of the Fund are purchased or otherwise acquired by other series of the Trust, acquire any securities of registered open-end investment companies or registered unit investment trusts in reliance on Section 12(d)(1)(F) or Section 12(d)(1)(G) of the 1940 Act, except this restriction shall not prohibit the investment by the Diversified Value Fund, Equity Opportunities Fund, Blue Chip Growth Fund, Mid Cap Growth Fund, or the Small Company Value Fund in money market funds managed by T. Rowe Price pursuant to an exemptive order.
Effective September 21, 2017, the following information replaces the second paragraph under the heading Unaffiliated Subadvisers found on page B-97 in the section titled Investment Advisory and Other Service Agreements:
Brandywine Global and T. Rowe Price both act as subadvisers for the Diversified Value Fund. Brandywine Global is a wholly-owned, independently operated subsidiary of Legg Mason, Inc., and is headquartered in Philadelphia with an office in San Francisco. Brandywine Global also operates two affiliated companies with offices in Singapore and London. T. Rowe Price is a wholly-owned subsidiary of T. Rowe Price Group, Inc., a publicly traded financial services holding company.
Loomis Sayles and T. Rowe Price both act as subadvisers for the Blue Chip Growth Fund. Loomis Sayles is an indirect subsidiary of Natixis Global Asset Management, L.P. which owns, in addition to Loomis Sayles, a number of other asset management and distribution and service entities. Natixis Global Asset Management, L.P. is part of Natixis Global Asset Management, an international asset management group based in Paris, France, that is in turn owned by Natixis, a French investment banking and financial services firm. Natixis is principally owned by BPCE, France’s second largest banking group. The group includes two autonomous and complimentary retail banking networks consisting of the Caisse d’Epargne regional savings banks and the
– 16 –
Banque Populaire regional cooperative banks. Loomis Sayles also provides subadvisory services for the MML Equity Fund, a series of MML Series Investment Fund II, a registered, open-end investment company for which MML Advisers serves as investment adviser.
Effective September 21, 2017, the information for Loomis Sayles related to the Diversified Value Fund found on page B-97 in the section titled Unaffiliated Subadvisers is hereby removed.
Effective September 21, 2017, the information under Loomis Sayles related to the Diversified Value Fund found on page B-324 in the section titled Appendix C—Additional Portfolio Manager Information is hereby removed.
Effective September 21, 2017, the following information supplements similar information for T. Rowe Price related to the Diversified Value Fund found on page B-341 in the section titled Appendix C—Additional Portfolio Manager Information:
The portfolio manager of the Diversified Value Fund is John D. Linehan.
Other Accounts Managed:
| Number of Accounts Managed* | Total Assets* | Number of Accounts Managed for which Advisory Fee is Performance- Based* | Total Assets* | |||||||||||||
John D. Linehan | ||||||||||||||||
Registered investment companies** | 9 | $ | 42,560,659,764 | 0 | $ | 0 | ||||||||||
Other pooled investment vehicles | 6 | $ | 11,543,013,307 | 0 | $ | 0 | ||||||||||
Other accounts | 41 | $ | 6,271,814,922 | 0 | $ | 0 | ||||||||||
| * | The information provided is as of July 31, 2017. |
| ** | Does not include the Diversified Value Fund. |
Ownership of Securities:
As of July 31, 2017, the portfolio manager did not own any shares of the Diversified Value Fund.
PLEASE RETAIN THIS SUPPLEMENT FOR FUTURE REFERENCE
SAI B3001M-17-07
– 17 –
| Table Of Contents | Page | |||
About the Funds | ||||
| 20 | ||||
| 26 | ||||
| 32 | ||||
| 40 | ||||
| 44 | ||||
| 48 | ||||
| 54 | ||||
| 58 | ||||
| 62 | ||||
| 66 | ||||
| 72 | ||||
| 76 | ||||
| 82 | ||||
| 86 | ||||
| 92 | ||||
| 96 | ||||
| 100 | ||||
| 104 | ||||
| 110 | ||||
| 116 | ||||
| 122 | ||||
Additional Information Regarding Investment Objectives and Principal Investment Strategies | 127 | |||
| 130 | ||||
| 130 | ||||
Management of the Funds | ||||
| 146 | ||||
| 146 | ||||
About the Classes of Shares – I, R5, Service, Administrative, A, R4, and R3 Shares | 160 | |||
| 161 | ||||
| 163 | ||||
Distribution Plans, Shareholder Servicing, and Payments to Intermediaries | 164 | |||
| 166 | ||||
| 167 | ||||
| 167 | ||||
| 168 | ||||
| 170 | ||||
| 173 | ||||
| 195 | ||||
– 18 –
[THIS PAGE INTENTIONALLY LEFT BLANK]
MassMutual Select Total Return Bond Fund
INVESTMENT OBJECTIVE
This Fund seeks maximum total return, consistent with preservation of capital and prudent investment management.
FEES AND EXPENSES OF THE FUND
This table describes the fees and expenses that you may pay if you buy and hold shares of the Fund. For Class A shares, you may qualify for sales charge discounts if you invest, or agree to invest in the future, at least $25,000 in MassMutual funds. More information about these and other discounts is available in the section titled Sales Charges by Class beginning on page 145 of the Fund’s Prospectus or from your financial professional.
Shareholder Fees (fees paid directly from your investment)
| Class I | Class R5 | Service Class | Administrative Class | Class A | Class R4 | Class R3 | ||||||||
Maximum Sales Charge (Load) Imposed on Purchases (as a % of offering price) | None | None | None | None | 4.75% | None | None | |||||||
Maximum Deferred Sales Charge (Load) (as a % of the lower of the original offering price or redemption proceeds) | None | None | None | None | None | None | None |
Annual Fund Operating Expenses (expenses that you pay each year as a percentage of the value of your investment)
| Class I | Class R5 | Service Class | Administrative Class | Class A | Class R4 | Class R3 | ||||||||
Management | .30% | .30% | .30% | .30% | .30% | .30% | .30% | |||||||
Distribution and Service (Rule 12b-1) Fees | None | None | None | None | .25% | .25% | .50% | |||||||
Other Expenses | .04% | .14% | .24% | .34% | .34% | .24% | .24% | |||||||
Total Annual Fund Operating Expenses | .34% | .44% | .54% | .64% | .89% | .79% | 1.04% |
| (1) | Management Fees have been restated to reflect current fees. |
Example
This example is intended to help you compare the cost of investing in the Fund with the cost of investing in other mutual funds. It assumes that you invest $10,000 in each share class of the Fund for the time periods indicated and then redeem all of your shares at the end of those periods. For Class A shares, the example includes the initial sales charge. The example also assumes that your investment earns a 5% return each year and that the Fund’s operating expenses are exactly as described in the preceding table. Although your actual costs may be higher or lower, based on these assumptions your costs would be:
| 1 Year | 3 Years | 5 Years | 10 Years | |||||||||||||
Class I | $ | 35 | $ | 109 | $ | 191 | $ | 431 | ||||||||
Class R5 | $ | 45 | $ | 141 | $ | 246 | $ | 555 | ||||||||
Service Class | $ | 55 | $ | 173 | $ | 302 | $ | 677 | ||||||||
Administrative Class | $ | 65 | $ | 205 | $ | 357 | $ | 798 | ||||||||
Class A | $ | 562 | $ | 745 | $ | 945 | $ | 1,519 | ||||||||
Class R4 | $ | 81 | $ | 252 | $ | 439 | $ | 978 | ||||||||
Class R3 | $ | 106 | $ | 331 | $ | 574 | $ | 1,271 | ||||||||
Portfolio Turnover
The Fund pays transaction costs, such as commissions, when it buys and sells securities (or “turns over” its portfolio). A higher portfolio turnover rate may indicate higher transaction costs and may result in higher taxes when Fund shares are held in a taxable account. These costs, which are not reflected in annual fund operating expenses or in the example, affect the Fund’s performance. During the most recent fiscal year, the Fund’s portfolio turnover rate was 264% of the average value of its portfolio.
INVESTMENTS, RISKS, AND PERFORMANCE
Principal Investment Strategies
Under normal circumstances, the Fund invests at least 80% of its net assets (plus the amount of any borrowings for investment purposes) in a diversified portfolio of investment grade fixed income securities (rated Baa3 or higher by Moody’s, BBB- or higher by Standard & Poor’s, BBB- or higher by Fitch, or A-2 by S&P, P-2 by Moody’s, or F-2 by Fitch for short-term debt obligations, or, if unrated, determined
– 20 –
by the Fund’s subadviser, Metropolitan West Asset Management, LLC (“MetWest”), to be of comparable quality). These typically include bonds, notes, collateralized bond obligations, collateralized debt obligations, mortgage-related and asset-backed securities, municipal securities, private placements, and securities subject to legal restrictions on resale pursuant to Rule 144A. These investments may have interest rates that are fixed, variable, or floating. The Fund invests in securities of varying maturities issued by domestic and foreign corporations and governments (and their agencies and instrumentalities). MetWest focuses the Fund’s portfolio holdings in areas of the bond market (based on quality, sector, coupon, or maturity) that the subadviser believes to be relatively undervalued.
The Fund may invest up to 20% of its net assets in below investment grade debt securities (“junk” or “high yield” bonds), including securities in default and bank loans. In the event that a security is downgraded after its purchase by the Fund, the Fund may continue to hold the security if MetWest considers doing so would be consistent with the Fund’s investment objective.
The Fund may invest up to 25% of its total assets in foreign securities that are denominated in U.S. dollars. The Fund may also invest up to 15% of its total assets in foreign securities that are not denominated in U.S. dollars and up to 10% of its total assets in emerging market foreign securities.
The Fund may but will not necessarily engage in foreign currency forward transactions to take long or short positions in foreign currencies in order to seek to enhance the Fund’s investment return or to seek to hedge or to attempt to protect against adverse changes in currency exchange rates. In pursuing its investment objective, the Fund may (but is not obligated to) use a wide variety of exchange-traded and over-the-counter derivatives, including options, futures contracts, and swap contracts for hedging or investment purposes as a substitute for investing directly in securities or to adjust various portfolio characteristics, including the duration (interest rate volatility) of the Fund’s portfolio. Use of derivatives by the Fund may create investment leverage.
The Fund may purchase and sell securities on a when-issued, delayed delivery, or forward commitment basis. The Fund may normally short sell up to 25% of the value of its total assets for hedging or investment purposes.
The Fund may also invest in money market securities, including commercial paper. The Fund may enter into repurchase agreement transactions. The Fund may hold a portion of its assets in cash or cash equivalents. The Fund may enter into dollar roll or reverse repurchase agreement transactions.
MetWest intends for the Fund’s portfolio duration to be between two to eight years. The dollar-weighted average maturity of the Fund’s portfolio is expected to range from two to fifteen years. Duration measures the price sensitivity of a bond to changes in interest rates. Duration is the dollar weighted average time to maturity of a bond utilizing the present value of all future cash flows.
MetWest employs a value-oriented fixed income management philosophy with a goal of consistently outperforming the portfolio benchmark while maintaining volatility similar to the benchmark. The investment process is predicated on a long-term economic outlook, which is determined by the investment team on a quarterly basis and is reviewed constantly. Investments are characterized by diversification among the sectors of the fixed income marketplace. The investment management team seeks to achieve the desired outperformance through the measured and disciplined application of five fixed income management strategies which include duration management, yield curve positioning, sector allocation, security selection, and opportunistic execution.
The first three strategies are top-down in orientation and start with a decision of where within the plus-or-minus one year range around the benchmark the duration should be established. Then comes a determination of how the overall average duration is to be effected – with a concentration of intermediate maturity issues or a combination of long- and short-term issues. The relative value decision regarding where to overweight/underweight sectors, including governments, agencies, corporates, mortgages, or asset-backed securities, is dependent on the current market environment. Bottom-up security selection involves the day-to-day fundamental analysis of available bond market opportunities, while execution is characterized by the aggressive and informed negotiation of the prices at which transactions take place.
The Fund expects that it will engage in active and frequent trading and so will typically have a relatively high portfolio turnover rate.
– 21 –
Principal Risks
The following are the Principal Risks of the Fund. The value of your investment in the Fund could go down as well as up. You can lose money by investing in the Fund.
Bank Loans Risk Many of the risks associated with bank loans are similar to the risks of investing in below investment grade debt securities. Changes in the financial condition of the borrower or economic conditions or other circumstances may reduce the capacity of the borrower to make principal and interest payments on such instruments and may lead to defaults. Senior secured bank loans are typically supported by collateral; however the value of the collateral may be insufficient to cover the amount owed to the Fund, or the Fund may be prevented or delayed from realizing on the collateral. Some loans may be unsecured; unsecured loans generally present a greater risk of loss to the Fund if the issuer defaults. If the Fund relies on a third party to administer a loan, the Fund is subject to the risk that the third party will fail to perform its obligations. In addition, if the Fund holds only a participation interest in a loan made by a third party, the Fund’s receipt of payments on the loan will depend on the third party’s willingness and ability to make those payments to the Fund. The settlement time for certain loans is longer than the settlement time for many other types of investments, and the Fund may not receive the payment for a loan sold by it until well after the sale; that cash would be unavailable for payment of redemption proceeds or for reinvestment. Interests in other bank loans may not be readily marketable and may be subject to restrictions on resale. In some cases, negotiations involved in disposing of indebtedness may require weeks to complete. Consequently, some indebtedness may be difficult or impossible to dispose of readily at what the Fund believes to be a fair price.
Below Investment Grade Debt Securities Risk Below investment grade debt securities, commonly known as “junk” or “high yield” bonds, have speculative characteristics and involve greater volatility of price and yield, greater risk of loss of principal and interest, and generally reflect a greater possibility of an adverse change in financial condition that could affect an issuer’s ability to honor its obligations.
Cash Position Risk If the Fund holds a significant portion of its assets in cash or cash equivalents, its investment returns may be adversely affected and the Fund may not achieve its investment objective.
Credit Risk Credit risk is the risk that an issuer, guarantor, or liquidity provider of a fixed-income
security held by the Fund may be unable or unwilling, or may be perceived (whether by market participants, ratings agencies, pricing services or otherwise) as unable or unwilling, to make timely principal and/or interest payments, or to otherwise honor its obligations. The Fund may also be exposed to the credit risk of its counterparty to repurchase agreements, reverse repurchase agreements, swap transactions, and other derivatives transactions, and to the counterparty’s ability or willingness to perform in accordance with the terms of the transaction. The value of such transactions to the Fund will depend on the willingness and ability of the counterparty to perform its obligations, including among other things the obligation to return collateral or margin to the Fund.
Defaulted and Distressed Securities Risk Because the issuer of such securities is in default and is likely to be in distressed financial condition, repayment of defaulted securities and obligations of distressed issuers (including insolvent issuers or issuers in payment or covenant default, in workout or restructuring, or in bankruptcy or insolvency proceedings) is uncertain.
Derivatives Risk Derivatives can be highly volatile and involve risks different from, and potentially greater than, direct investments, including risks of imperfect correlation between the value of derivatives and underlying assets, counterparty default, potential losses that partially or completely offset gains, and illiquidity. Derivatives can create investment leverage. Losses from derivatives can be substantially greater than the derivatives’ original cost and can sometimes be unlimited. If the value of a derivative does not correlate well with the particular market or asset class the derivative is designed to provide exposure to, the derivative may not have the effect anticipated. Derivatives can also reduce the opportunity for gains or result in losses by offsetting positive returns in other investments. Many derivatives are traded in the over-the-counter market and not on exchanges.
Dollar Roll and Reverse Repurchase Agreement Transaction Risk These transactions generally create leverage and subject the Fund to the credit risk of the counterparty.
Fixed Income Securities Risk The values of fixed income securities typically will decline during periods of rising interest rates, and can also decline in response to changes in the financial condition of the issuer, borrower, counterparty, or underlying collateral assets, or changes in market, economic, industry, political, and regulatory conditions
– 22 –
affecting a particular type of security or issuer or fixed income securities generally. Certain events, such as market or economic developments, regulatory or government actions, natural disasters, terrorist attacks, war, and other geopolitical events can have a dramatic adverse effect on the debt market and the overall liquidity of the market for fixed income securities. During those periods, the Fund may experience high levels of shareholder redemptions, and may have to sell securities at times when the Fund would otherwise not do so, and potentially at unfavorable prices. Certain securities may be difficult to value during such periods. Fixed income securities are subject to interest rate risk (the risk that the value of a fixed income security will fall when interest rates rise), extension risk (the risk that the average life of a security will be extended through a slowing of principal payments), prepayment risk (the risk that a security will be prepaid and the Fund will be required to reinvest at a less favorable rate), and credit risk. These risks may be heightened due to the current historically low interest rate environment.
Foreign Investment Risk; Emerging Markets Risk; Currency Risk Investments in securities of non-U.S. issuers (including depositary receipts) entail risks not typically associated with investing in securities of U.S. issuers. Similar risks may apply to securities traded on a U.S. securities exchange that are issued by companies with significant exposure to non-U.S. countries. In certain countries, legal remedies available to investors may be more limited than those available with regard to U.S. investments. Because non-U.S. securities are normally denominated and traded in currencies other than the U.S. dollar, the value of the Fund’s assets may be affected favorably or unfavorably by currency exchange rates, exchange control regulations, and restrictions or prohibitions on the repatriation of non-U.S. currencies. Income and gains with respect to investments in certain countries may be subject to withholding and other taxes. There may be less information publicly available about a non-U.S. company than about a U.S. company, and many non-U.S. companies are not subject to accounting, auditing, and financial reporting standards, regulatory framework and practices comparable to those in the U.S. Foreign investments may be subject to the risks of seizure by a foreign government, imposition of restrictions on the exchange or export of foreign currency, other economic sanctions, and tax increases. The securities of some non-U.S. companies, especially those in emerging markets, are less liquid and at times more volatile than securities of
comparable U.S. companies. Emerging markets securities are subject to greater risks than securities issued in developed foreign markets, including less liquidity, greater price volatility, higher relative rates of inflation, greater political, economic, and social instability, greater custody and operational risks, and greater volatility in currency exchange rates. Non-U.S. transaction costs, such as brokerage commissions and custody costs may be higher than in the United States. In addition, there may be a possibility of nationalization or expropriation of assets, imposition of currency exchange controls, confiscatory taxation, political or financial instability, and diplomatic developments that could adversely affect the values of the Fund’s investments in certain non-U.S. countries.
Frequent Trading/Portfolio Turnover Risk Portfolio turnover generally involves some expense to the Fund and may result in the realization of taxable capital gains (including short-term gains). The trading costs and tax effects associated with portfolio turnover may adversely affect the Fund’s performance.
Inflation Risk The value of assets or income from the Fund’s investments will be less in the future as inflation decreases the value of money. As inflation increases, the value of the Fund’s assets can decline as can the value of the Fund’s distributions.
Leveraging Risk Instruments and transactions, including derivatives, dollar rolls, and reverse repurchase agreement transactions, that create leverage may cause the value of an investment in the Fund to be more volatile, could result in larger losses than if they were not used, and tend to compound the effects of other risks.
Liquidity Risk Certain securities may be difficult (or impossible) to sell or positions difficult to close out at a desirable time and price, and the Fund may be required to hold an illiquid investment that is declining in value, or it may be required to sell certain illiquid investments at a price or time that is not advantageous in order to meet redemptions or other cash needs. Some securities may be subject to restrictions on resale. There can be no assurance that there will be a liquid market for instruments held by the Fund at any time.
Management Risk The Fund relies on the manager’s investment analysis and its selection of investments to achieve its investment objective. There can be no assurance that the Fund will achieve the intended results and the Fund may incur significant losses.
– 23 –
Market Risk The value of the Fund’s portfolio securities may decline, at times sharply and unpredictably, as a result of unfavorable market-induced changes affecting particular industries, sectors, or issuers. Stock markets can decline significantly in response to issuer, market, economic, industry, political, regulatory, geopolitical and other conditions, as well as investor perceptions of these conditions. The Fund is subject to risks affecting issuers, such as management performance, financial leverage, industry problems, and reduced demand for goods or services.
Mortgage- and Asset-Backed Securities Risk Investments in mortgage- and asset-backed securities subject the Fund to credit risk, interest rate risk, extension risk, and prepayment risk, among other risks. Mortgage-backed and asset-backed securities not issued by a government agency generally involve greater credit risk than securities issued by government agencies. Payment of principal and interest generally depends on the cash flows generated by the underlying assets and the terms of the security. The types of mortgages (for example, residential or commercial mortgages) underlying securities held by the Fund may differ and be affected differently by market factors. Investments that receive only the interest portion or the principal portion of payments on the underlying assets may be highly volatile. The market for mortgage- and asset-backed securities has recently experienced high volatility and a lack of liquidity. As a result, the value of many of these securities has significantly declined.
Repurchase Agreement Risk These transactions must be fully collateralized at all times, but involve some risk to a Fund if the other party should default on its obligation and the Fund is delayed or prevented from recovering the collateral.
Short Sales Risk If the Fund sells a security short, it will make money if the security’s price goes down (in an amount greater than any transaction costs) and will lose money if the security’s price goes up. There is no limit on the amount of money the Fund may lose on a short sale. The Fund may not be able to close out a short sale when it might wish to do so, or may only do so at an unfavorable price. Short sales can involve leverage. If the Fund invests the proceeds from short positions in other securities the Fund could lose money both on the short positions and on the securities in which it has invested the short proceeds.
Sovereign Debt Obligations Risk Investments in debt securities issued by governments or by government
agencies and instrumentalities involve the risk that the governmental entities responsible for repayment may be unable or unwilling to pay interest and repay principal when due. Many sovereign debt obligations may be rated below investment grade (“junk” or “high yield” bonds). Any restructuring of a sovereign debt obligation held by the Fund will likely have a significant adverse effect on the value of the obligation. In the event of default of sovereign debt, the Fund may be unable to pursue legal action against the sovereign issuer or to realize on collateral securing the debt.
U.S. Government Securities Risk Obligations of certain U.S. Government agencies and instrumentalities are not backed by the full faith and credit of the U.S. Government, and there can be no assurance that the U.S. Government would provide financial support to such agencies and instrumentalities.
Valuation Risk The Fund is subject to the risk of mispricing or improper valuation of its investments, in particular to the extent that its securities are fair valued.
When-Issued, Delayed Delivery, TBA, and Forward Commitment Transaction Risk These transactions may create leverage and involve a risk of loss if the value of the securities declines prior to settlement.
Performance Information
The following bar chart and table provide some indication of the risks of investing in the Fund. The bar chart shows changes in the Fund’s performance from year to year for Class I shares. The table shows how the Fund’s average annual returns for 1 and 5 years, and since inception, compare with those of a broad measure of market performance. The Fund’s name and investment strategy changed on October 27, 2014. The performance results shown below would not necessarily have been achieved had the Fund’s current investment strategy been in effect for the entire period for which performance results are presented. Performance for Class A shares of the Fund for periods prior to its inception date (04/01/14) is based on the performance of Class R5 shares, adjusted for Class A expenses. Performance for Class A shares of the Fund reflects any applicable sales charge. Past performance (before and after taxes) is not necessarily an indication of how the Fund will perform in the future. More up-to-date performance information is available at http://www.massmutual.com/funds or by calling 1-888-309-3539.
– 24 –
Annual Performance
Class I Shares
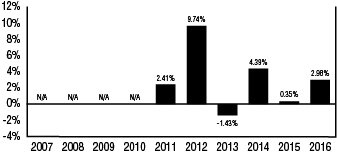
| Highest Quarter: | 3Q ’12, | 3.36% | Lowest Quarter: | 2Q ’13, | - | 3.30% |
After-tax returns are calculated using the historical highest individual federal marginal income tax rates and do not reflect the impact of state and local taxes. Actual after-tax returns depend on an investor’s tax situation and may differ from those shown. After-tax returns are not relevant to investors who hold Fund shares through tax-advantaged arrangements, such as
401(k) plans or individual retirement accounts. After-tax returns are shown for Class I only. After-tax returns for other classes will vary.
Average Annual Total Returns
(for the periods ended December 31, 2016)
| One Year | Five Years | Since Inception (07/06/10) | ||||||||||||
| Class I | Return Before Taxes | 2.98% | 3.13% | 3.27% | ||||||||||
| Return After Taxes on Distributions | 1.01% | 1.68% | 1.89% | |||||||||||
| Return After Taxes on Distributions and Sales of Fund Shares | 1.84% | 1.83% | 2.01% | |||||||||||
| Class R5 | Return Before Taxes | 2.87% | 2.99% | 3.12% | ||||||||||
| Service Class | Return Before Taxes | 2.86% | 2.90% | 3.03% | ||||||||||
| Administrative Class | Return Before Taxes |
|
2.71% |
|
|
2.80% |
|
|
2.92% |
| ||||
| Class A | Return Before Taxes | -2.46% | 1.59% | 1.71% | ||||||||||
| Class R4 | Return Before Taxes | 2.53% | 2.67% | 2.82% | ||||||||||
| Class R3 | Return Before Taxes | 2.25% | 2.42% | 2.56% | ||||||||||
| Bloomberg Barclays U.S. Aggregate Bond Index (reflects no deduction for fees, expenses, or taxes) | 2.65% | 2.23% | 3.10% | |||||||||||
MANAGEMENT
Investment Adviser: MML Investment Advisers, LLC (“MML Advisers”)
Subadviser: Metropolitan West Asset Management, LLC (“MetWest”)
Portfolio Managers:
Tad Rivelle is the Chief Investment Officer and a Generalist Portfolio Manager at MetWest. He has managed the Fund since October 2014.
Laird R. Landmann is the President and a Generalist Portfolio Manager at MetWest. He has managed the Fund since October 2014.
Stephen M. Kane, CFA is a Group Managing Director and Generalist Portfolio Manager at MetWest. He has managed the Fund since October 2014.
Bryan T. Whalen, CFA is a Group Managing Director and Generalist Portfolio Manager at MetWest. He has managed the Fund since October 2014.
PURCHASE AND SALE OF FUND SHARES
Shares of the Fund are generally available to retirement plans, other institutional investors, and individual retirement accounts. Fund shares are redeemable on any business day by written request, telephone or internet (available to certain customers).
TAX INFORMATION
The Fund intends to make distributions that may be taxed as ordinary income, qualified dividend income, or capital gains, unless you are an investor eligible for preferential tax treatment.
PAYMENTS TO BROKER-DEALERS AND OTHER FINANCIAL INTERMEDIARIES
If you purchase the Fund through a broker-dealer or other financial intermediary, the intermediary may receive a one-time or continuing payments from the Fund, MML Advisers or its affiliates, or others for the sale of Fund shares or continuing shareholder services provided by the intermediary. These payments may create a conflict of interest by influencing the broker-dealer or other intermediary to recommend the Fund over another investment. You should contact your intermediary to obtain more information about the compensation it may receive in connection with your investment.
– 25 –
MassMutual Select Strategic Bond Fund
INVESTMENT OBJECTIVE
This Fund seeks a superior total rate of return by investing in fixed income instruments.
FEES AND EXPENSES OF THE FUND
This table describes the fees and expenses that you may pay if you buy and hold shares of the Fund. For Class A shares, you may qualify for sales charge discounts if you invest, or agree to invest in the future, at least $25,000 in MassMutual funds. More information about these and other discounts is available in the section titled Sales Charges by Class beginning on page 145 of the Fund’s Prospectus or from your financial professional.
Shareholder Fees (fees paid directly from your investment)
| Class I | Class R5 | Service Class | Administrative Class | Class A | Class R4 | Class R3 | ||||||||
Maximum Sales Charge (Load) Imposed on Purchases (as a % of offering price) | None | None | None | None | 4.75% | None | None | |||||||
Maximum Deferred Sales Charge (Load) (as a % of the lower of the original offering price or redemption proceeds) | None | None | None | None | None | None | None |
Annual Fund Operating Expenses (expenses that you pay each year as a percentage of the value of your investment)
| Class I | Class R5 | Service Class | Administrative Class | Class A | Class R4 | Class R3 | ||||||||
Management Fees | .42% | .42% | .42% | .42% | .42% | .42% | .42% | |||||||
Distribution and Service (Rule 12b-1) Fees | None | None | None | None | .25% | .25% | .50% | |||||||
Other Expenses | .12% | .22% | .32% | .42% | .42% | .32% | .32% | |||||||
Total Annual Fund Operating Expenses | .54% | .64% | .74% | .84% | 1.09% | .99% | 1.24% | |||||||
Expense Reimbursement | (.06%) | (.06%) | (.06%) | (.06%) | (.06%) | (.06%) | (.06%) | |||||||
Total Annual | .48% | .58% | .68% | .78% | 1.03% | .93% | 1.18% |
| (1) | The expenses in the above table reflect a written agreement by MML Advisers to cap the fees and expenses of the Fund (other than extraordinary litigation and legal expenses, Acquired Fund fees and expenses, interest expense, short sale dividend and loan expense, or other non-recurring or unusual expenses such as organizational expenses and shareholder meeting expenses) through January 31, 2018, to the extent that Total Annual Fund Operating Expenses after Expense Reimbursement would otherwise exceed .48%, .58%, .68%, .78%, 1.03%, .93%, and 1.18% for Classes I, R5, Service, Administrative, A, R4, and R3, respectively. The Total Annual Fund Operating Expenses after Expense Reimbursement shown in the above table may exceed these amounts, because, as noted in the previous sentence, certain fees and expenses are excluded from the cap. The agreement can only be terminated by mutual consent of the Board of Trustees on behalf of the Fund and MML Advisers. |
Example
This example is intended to help you compare the cost of investing in the Fund with the cost of investing in other mutual funds. It assumes that you invest $10,000 in each share class of the Fund for the time periods indicated and then redeem all of your shares at the end of those periods. For Class A shares, the example includes the initial sales charge. The example also assumes that your investment earns a 5% return each year and that the Fund’s operating expenses are exactly as described in the preceding table. Although your actual costs may be higher or lower, based on these assumptions your costs would be:
| 1 Year | 3 Years | 5 Years | 10 Years | |||||||||||||
Class I | $ | 49 | $ | 167 | $ | 296 | $ | 671 | ||||||||
Class R5 | $ | 59 | $ | 199 | $ | 351 | $ | 793 | ||||||||
Service Class | $ | 69 | $ | 231 | $ | 406 | $ | 913 | ||||||||
Administrative Class | $ | 80 | $ | 262 | $ | 460 | $ | 1,032 | ||||||||
Class A | $ | 575 | $ | 799 | $ | 1,042 | $ | 1,735 | ||||||||
Class R4 | $ | 95 | $ | 309 | $ | 541 | $ | 1,208 | ||||||||
Class R3 | $ | 120 | $ | 387 | $ | 675 | $ | 1,495 | ||||||||
Portfolio Turnover
The Fund pays transaction costs, such as commissions, when it buys and sells securities (or “turns over” its portfolio). A higher portfolio turnover rate may indicate higher transaction costs and may result in higher taxes when Fund shares are held in a taxable account. These costs, which are not reflected in annual fund operating expenses or in the example, affect the Fund’s performance. During the most recent fiscal year, the Fund’s portfolio turnover rate was 207% of the average value of its portfolio.
INVESTMENTS, RISKS, AND PERFORMANCE
Principal Investment Strategies
Under normal circumstances, the Fund invests at least 80% of its net assets (plus the amount of any borrowings for investment purposes) in U.S.
– 26 –
dollar-denominated fixed income securities and other debt instruments of domestic and foreign entities, including corporate bonds, securities issued or guaranteed as to principal or interest by the U.S. Government or its agencies or instrumentalities, mortgage-backed or asset-backed securities, and money market instruments. The Fund may invest up to 20% of its total assets in non-U.S. dollar-denominated securities of these entities. The Fund may also invest in emerging markets. The Fund may but will not necessarily engage in foreign currency transactions, including forward contracts, options on currency, futures contracts, and swap contracts, to attempt to seek to hedge or to protect against adverse changes in currency exchange rates. In pursuing its investment objective, the Fund may (but is not obligated to) use a wide variety of additional exchange-traded and over-the-counter derivatives, including futures contracts (for hedging purposes or to adjust various portfolio characteristics, including the duration (interest rate volatility) of the Fund’s portfolio); interest rate swaps (for hedging purposes or to adjust various portfolio characteristics, including the duration (interest rate volatility) of the Fund’s portfolio); credit default swaps (for hedging purposes, to earn additional income, or as a substitute for direct investments); and hybrid instruments (as a substitute for direct investments). The Fund may also purchase and sell exchange-traded and over-the-counter options for hedging purposes, to adjust various portfolio characteristics, including the duration (interest rate volatility) of the Fund’s portfolio, or as a substitute for direct investments. Use of derivatives by the Fund may create investment leverage. The Fund may also invest in money market securities, including commercial paper. The Fund may hold a portion of its assets in cash or cash equivalents. The Fund is managed by two subadvisers, each being responsible for a portion of the portfolio, but not necessarily equally weighted.
The Fund invests primarily in investment grade securities (rated Baa or higher by Moody’s or BBB or higher by Standard & Poor’s, or, if unrated, determined by the subadviser to be of comparable quality), but may invest up to 25% of the portfolio in below investment grade debt securities (“junk” or “high yield” bonds), including securities in default. In the event that a security is downgraded after its purchase by the Fund, the Fund may continue to hold the security if Western Asset Management Company (“Western Asset”), a subadviser of the Fund, considers that doing so would be consistent with the Fund’s investment objective. The Fund may invest in domestic and foreign issuer loans and loan
participations that pay interest at rates that float or reset periodically at a margin above a generally recognized base lending rate. Certain fixed income securities in which the Fund may invest pay interest at variable or floating rates. Variable rate securities tend to reset at specified intervals, while floating rate securities may reset upon a change in a specified index rate. In most cases, these reset provisions reduce the impact of changes in market interest rates on the value of the security. However, some securities do not track the underlying index directly, but reset based on formulas that may produce a leveraging effect; others may also provide for interest payments that vary inversely with market rates. The market prices of these securities may fluctuate significantly when interest rates change. The Fund may invest in loans of companies whose financial condition is troubled or uncertain and that may be involved in bankruptcy proceedings, reorganizations, or financial restructurings. The Fund may also acquire, and subsequently hold, warrants and other equity interests. The Fund’s effective duration is normally expected to be between three and seven years. If the Fund’s effective duration falls outside of this range, the Fund will take action to bring it within its expected range within a reasonable period of time. Duration measures the price sensitivity of a bond to changes in interest rates. Duration is the dollar weighted average time to maturity of a bond utilizing the present value of all future cash flows. Effective duration measures the price sensitivity of a bond with embedded options to changes in interest rates. It provides a more accurate measure of price volatility when, due to the embedded options, the cash flow characteristics of the bond change as interest rates shift.
Western Asset invests in the fixed income markets seeking to exceed returns of the Fund’s benchmark while approximating benchmark risk. Western Asset focuses on sector allocation, issue selection, duration weighting, and term structure when buying and selling securities for the Fund. Western Asset emphasizes diversification, the use of multiple strategies and identification of long-term trends. The three key factors that determine the allocation decisions for the Fund are: Western Asset’s broad economic outlook, its review of historical yield spreads for debt instruments versus Treasuries, and its evaluation of changes in credit quality and the corresponding impact on prices. Western Asset will determine the portion of the Fund’s assets to be allocated to non-U.S. dollar denominated securities from time to time. Western Asset Management Company Limited (“Western Asset Limited”), an
– 27 –
affiliate of Western Asset, has subadvisory responsibility for Western Asset’s non-U.S. dollar denominated investments. Western Asset Limited will select such investments based on its consideration of factors such as relative interest rates, inflation rates, exchange rates, monetary and fiscal policies, and trade and current account balances.
The Fund expects that it will engage in active and frequent trading and so will typically have a relatively high portfolio turnover rate.
Principal Risks
The following are the Principal Risks of the Fund. The value of your investment in the Fund could go down as well as up. You can lose money by investing in the Fund.
Bank Loans Risk Many of the risks associated with bank loans are similar to the risks of investing in below investment grade debt securities. Changes in the financial condition of the borrower or economic conditions or other circumstances may reduce the capacity of the borrower to make principal and interest payments on such instruments and may lead to defaults. Senior secured bank loans are typically supported by collateral; however the value of the collateral may be insufficient to cover the amount owed to the Fund, or the Fund may be prevented or delayed from realizing on the collateral. Some loans may be unsecured; unsecured loans generally present a greater risk of loss to the Fund if the issuer defaults. If the Fund relies on a third party to administer a loan, the Fund is subject to the risk that the third party will fail to perform its obligations. In addition, if the Fund holds only a participation interest in a loan made by a third party, the Fund’s receipt of payments on the loan will depend on the third party’s willingness and ability to make those payments to the Fund. The settlement time for certain loans is longer than the settlement time for many other types of investments, and the Fund may not receive the payment for a loan sold by it until well after the sale; that cash would be unavailable for payment of redemption proceeds or for reinvestment. Interests in other bank loans may not be readily marketable and may be subject to restrictions on resale. In some cases, negotiations involved in disposing of indebtedness may require weeks to complete. Consequently, some indebtedness may be difficult or impossible to dispose of readily at what the Fund believes to be a fair price.
Below Investment Grade Debt Securities Risk Below investment grade debt securities, commonly known as “junk” or “high yield” bonds, have
speculative characteristics and involve greater volatility of price and yield, greater risk of loss of principal and interest, and generally reflect a greater possibility of an adverse change in financial condition that could affect an issuer’s ability to honor its obligations.
Cash Position Risk If the Fund holds a significant portion of its assets in cash or cash equivalents, its investment returns may be adversely affected and the Fund may not achieve its investment objective.
Credit Risk Credit risk is the risk that an issuer, guarantor, or liquidity provider of a fixed-income security held by the Fund may be unable or unwilling, or may be perceived (whether by market participants, ratings agencies, pricing services or otherwise) as unable or unwilling, to make timely principal and/or interest payments, or to otherwise honor its obligations. The Fund may also be exposed to the credit risk of its counterparty to repurchase agreements, reverse repurchase agreements, swap transactions, and other derivatives transactions, and to the counterparty’s ability or willingness to perform in accordance with the terms of the transaction. The value of such transactions to the Fund will depend on the willingness and ability of the counterparty to perform its obligations, including among other things the obligation to return collateral or margin to the Fund.
Defaulted and Distressed Securities Risk Because the issuer of such securities is in default and is likely to be in distressed financial condition, repayment of defaulted securities and obligations of distressed issuers (including insolvent issuers or issuers in payment or covenant default, in workout or restructuring, or in bankruptcy or insolvency proceedings) is uncertain.
Derivatives Risk Derivatives can be highly volatile and involve risks different from, and potentially greater than, direct investments, including risks of imperfect correlation between the value of derivatives and underlying assets, counterparty default, potential losses that partially or completely offset gains, and illiquidity. Derivatives can create investment leverage. Losses from derivatives can be substantially greater than the derivatives’ original cost and can sometimes be unlimited. If the value of a derivative does not correlate well with the particular market or asset class the derivative is designed to provide exposure to, the derivative may not have the effect anticipated. Derivatives can also reduce the opportunity for gains or result in losses by offsetting positive returns in other investments. Many derivatives are traded in the over-the-counter market and not on exchanges.
– 28 –
Fixed Income Securities Risk The values of fixed income securities typically will decline during periods of rising interest rates, and can also decline in response to changes in the financial condition of the issuer, borrower, counterparty, or underlying collateral assets, or changes in market, economic, industry, political, and regulatory conditions affecting a particular type of security or issuer or fixed income securities generally. Certain events, such as market or economic developments, regulatory or government actions, natural disasters, terrorist attacks, war, and other geopolitical events can have a dramatic adverse effect on the debt market and the overall liquidity of the market for fixed income securities. During those periods, the Fund may experience high levels of shareholder redemptions, and may have to sell securities at times when the Fund would otherwise not do so, and potentially at unfavorable prices. Certain securities may be difficult to value during such periods. Fixed income securities are subject to interest rate risk (the risk that the value of a fixed income security will fall when interest rates rise), extension risk (the risk that the average life of a security will be extended through a slowing of principal payments), prepayment risk (the risk that a security will be prepaid and the Fund will be required to reinvest at a less favorable rate), and credit risk. These risks may be heightened due to the current historically low interest rate environment.
Foreign Investment Risk; Emerging Markets Risk; Currency Risk Investments in securities of non-U.S. issuers (including depositary receipts) entail risks not typically associated with investing in securities of U.S. issuers. Similar risks may apply to securities traded on a U.S. securities exchange that are issued by companies with significant exposure to non-U.S. countries. In certain countries, legal remedies available to investors may be more limited than those available with regard to U.S. investments. Because non-U.S. securities are normally denominated and traded in currencies other than the U.S. dollar, the value of the Fund’s assets may be affected favorably or unfavorably by currency exchange rates, exchange control regulations, and restrictions or prohibitions on the repatriation of non-U.S. currencies. Income and gains with respect to investments in certain countries may be subject to withholding and other taxes. There may be less information publicly available about a non-U.S. company than about a U.S. company, and many non-U.S. companies are not subject to accounting, auditing, and financial reporting standards, regulatory framework and practices comparable to those in the U.S. Foreign investments may be subject to the risks of seizure by a foreign government, imposition of restrictions on the
exchange or export of foreign currency, other economic sanctions, and tax increases. The securities of some non-U.S. companies, especially those in emerging markets, are less liquid and at times more volatile than securities of comparable U.S. companies. Emerging markets securities are subject to greater risks than securities issued in developed foreign markets, including less liquidity, greater price volatility, higher relative rates of inflation, greater political, economic, and social instability, greater custody and operational risks, and greater volatility in currency exchange rates. Non-U.S. transaction costs, such as brokerage commissions and custody costs may be higher than in the United States. In addition, there may be a possibility of nationalization or expropriation of assets, imposition of currency exchange controls, confiscatory taxation, political or financial instability, and diplomatic developments that could adversely affect the values of the Fund’s investments in certain non-U.S. countries.
Frequent Trading/Portfolio Turnover Risk Portfolio turnover generally involves some expense to the Fund and may result in the realization of taxable capital gains (including short-term gains). The trading costs and tax effects associated with portfolio turnover may adversely affect the Fund’s performance.
Leveraging Risk Instruments and transactions, including derivatives, that create leverage may cause the value of an investment in the Fund to be more volatile, could result in larger losses than if they were not used, and tend to compound the effects of other risks.
Liquidity Risk Certain securities may be difficult (or impossible) to sell or positions difficult to close out at a desirable time and price, and the Fund may be required to hold an illiquid investment that is declining in value, or it may be required to sell certain illiquid investments at a price or time that is not advantageous in order to meet redemptions or other cash needs. Some securities may be subject to restrictions on resale. There can be no assurance that there will be a liquid market for instruments held by the Fund at any time.
Management Risk The Fund relies on the manager’s investment analysis and its selection of investments to achieve its investment objective. There can be no assurance that the Fund will achieve the intended results and the Fund may incur significant losses.
Market Risk The value of the Fund’s portfolio securities may decline, at times sharply and
– 29 –
unpredictably, as a result of unfavorable market-induced changes affecting particular industries, sectors, or issuers. Stock markets can decline significantly in response to issuer, market, economic, industry, political, regulatory, geopolitical and other conditions, as well as investor perceptions of these conditions. The Fund is subject to risks affecting issuers, such as management performance, financial leverage, industry problems, and reduced demand for goods or services.
Mortgage- and Asset-Backed Securities Risk Investments in mortgage- and asset-backed securities subject the Fund to credit risk, interest rate risk, extension risk, and prepayment risk, among other risks. Mortgage-backed and asset-backed securities not issued by a government agency generally involve greater credit risk than securities issued by government agencies. Payment of principal and interest generally depends on the cash flows generated by the underlying assets and the terms of the security. The types of mortgages (for example, residential or commercial mortgages) underlying securities held by the Fund may differ and be affected differently by market factors. Investments that receive only the interest portion or the principal portion of payments on the underlying assets may be highly volatile. The market for mortgage- and asset-backed securities has recently experienced high volatility and a lack of liquidity. As a result, the value of many of these securities has significantly declined.
Sovereign Debt Obligations Risk Investments in debt securities issued by governments or by government agencies and instrumentalities involve the risk that the governmental entities responsible for repayment may be unable or unwilling to pay interest and repay principal when due. Many sovereign debt obligations may be rated below investment grade (“junk” or “high yield” bonds). Any restructuring of a sovereign debt obligation held by the Fund will likely have a significant adverse effect on the value of the obligation. In the event of default of sovereign debt, the Fund may be unable to pursue legal action against the sovereign issuer or to realize on collateral securing the debt.
U.S. Government Securities Risk Obligations of certain U.S. Government agencies and instrumentalities are not backed by the full faith and credit of the U.S. Government, and there can be no assurance that the U.S. Government would provide financial support to such agencies and instrumentalities.
Valuation Risk The Fund is subject to the risk of mispricing or improper valuation of its investments, in particular to the extent that its securities are fair valued.
Performance Information
The following bar chart and table provide some indication of the risks of investing in the Fund. The bar chart shows changes in the Fund’s performance from year to year for Class R5 shares. The table shows how the Fund’s average annual returns for 1, 5, and 10 years compare with those of a broad measure of market performance. Performance for Class I and Class R4 shares of the Fund for periods prior to their inception date (04/01/14) is based on the performance of Class R5 shares, adjusted for Class R4 shares to reflect Class R4 expenses. Performance for Class A shares of the Fund reflects any applicable sales charge. Past performance (before and after taxes) is not necessarily an indication of how the Fund will perform in the future. More up-to-date performance information is available at http://www.massmutual.com/funds or by calling 1-888-309-3539.
Annual Performance
Class R5 Shares
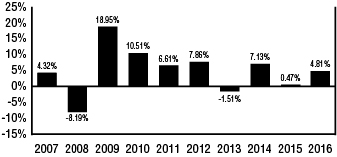
| Highest Quarter: | 2Q ’09, | 8.87% | Lowest Quarter: | 3Q ’08, | - | 6.06% |
After-tax returns are calculated using the historical highest individual federal marginal income tax rates and do not reflect the impact of state and local taxes. Actual after-tax returns depend on an investor’s tax situation and may differ from those shown. After-tax returns are not relevant to investors who hold Fund shares through tax-advantaged arrangements, such as 401(k) plans or individual retirement accounts. After-tax returns are shown for Class R5 only. After-tax returns for other classes will vary.
– 30 –
Average Annual Total Returns
(for the periods ended December 31, 2016)
| One Year | Five Years | Ten Years | ||||||||||||
| Class R5 | Return Before Taxes | 4.81% | 3.69% | 4.87% | ||||||||||
| Return After Taxes on Distributions | 3.60% | 2.32% | 3.11% | |||||||||||
| Return After Taxes on Distributions and Sales of Fund Shares | 2.72% | 2.23% | 3.06% | |||||||||||
| Class I | Return Before Taxes | 4.91% | 3.74% | 4.90% | ||||||||||
| Service Class | Return Before Taxes | 4.66% | 3.59% | 4.78% | ||||||||||
| Administrative Class | Return Before Taxes | 4.56% | 3.47% | 4.67% | ||||||||||
| Class A | Return Before Taxes | -0.60% | 2.21% | 3.90% | ||||||||||
| Class R4 | Return Before Taxes | 4.42% | 3.32% | 4.50% | ||||||||||
| Class R3 | Return Before Taxes | 4.21% | 2.99% | 4.12% | ||||||||||
| Bloomberg Barclays U.S. Aggregate Bond Index (reflects no deduction for fees, expenses, or taxes) | 2.65% | 2.23% | 4.34% | |||||||||||
MANAGEMENT
Investment Adviser: MML Investment Advisers, LLC (“MML Advisers”)
Subadvisers: Western Asset Management Company (“Western Asset”)
Western Asset Management Company Limited (“Western Asset Limited”)
Portfolio Managers:
S. Kenneth Leech is the Chief Investment Officer and a Portfolio Manager at Western Asset and Western Asset Limited. He has managed the Fund since March 2014.
Mark S. Lindbloom is a Portfolio Manager at Western Asset and Western Asset Limited. He has managed the Fund since its inception (December 2004).
Carl L. Eichstaedt, CFA is a Portfolio Manager at Western Asset and Western Asset Limited. He has managed the Fund since its inception (December 2004).
Michael C. Buchanan, CFA is the Deputy Chief Investment Officer and a Portfolio Manager at Western Asset and Western Asset Limited. He has managed the Fund since its inception (December 2004).
Chia-Liang Lian, CFA is the Head of Emerging Markets Debt and a Portfolio Manager at Western Asset and Western Asset Limited. He has managed the Fund since April 2015.
PURCHASE AND SALE OF FUND SHARES
Shares of the Fund are generally available to retirement plans, other institutional investors, and individual retirement accounts. Fund shares are redeemable on any business day by written request, telephone or internet (available to certain customers).
TAX INFORMATION
The Fund intends to make distributions that may be taxed as ordinary income, qualified dividend income, or capital gains, unless you are an investor eligible for preferential tax treatment.
PAYMENTS TO BROKER-DEALERS AND OTHER FINANCIAL INTERMEDIARIES
If you purchase the Fund through a broker-dealer or other financial intermediary, the intermediary may receive a one-time or continuing payments from the Fund, MML Advisers or its affiliates, or others for the sale of Fund shares or continuing shareholder services provided by the intermediary. These payments may create a conflict of interest by influencing the broker-dealer or other intermediary to recommend the Fund over another investment. You should contact your intermediary to obtain more information about the compensation it may receive in connection with your investment.
– 31 –
MassMutual Select BlackRock Global Allocation Fund
INVESTMENT OBJECTIVE
The Fund seeks long-term total return.
FEES AND EXPENSES OF THE FUND
This table describes the fees and expenses that you may pay if you buy and hold shares of the Fund. For Class A shares, you may qualify for sales charge discounts if you invest, or agree to invest in the future, at least $25,000 in MassMutual funds. More information about these and other discounts is available in the section titled Sales Charges by Class beginning on page 145 of the Fund’s Prospectus or from your financial professional.
Shareholder Fees (fees paid directly from your investment)
| Class I | Class R5 | Service Class | Administrative Class | Class A | Class R4 | Class R3 | ||||||||
Maximum Sales Charge (Load) Imposed on Purchases (as a % of offering price) | None | None | None | None | 5.75% | None | None | |||||||
Maximum Deferred Sales Charge (Load) (as a % of the lower of the original offering price or redemption proceeds) | None | None | None | None | None | None | None |
Annual Fund Operating Expenses (expenses that you pay each year as a percentage of the value of your investment)
| Class I | Class R5 | Service Class | Administrative Class | Class A | Class R4 | Class R3 | ||||||||
Management Fees | .78% | .78% | .78% | .78% | .78% | .78% | .78% | |||||||
Distribution and Service (Rule 12b-1) Fees | None | None | None | None | .25% | .25% | .50% | |||||||
Other Expenses | .19% | .29% | .39% | .49% | .49% | .39% | .39% | |||||||
Short Sale Dividend Expense | .01% | .01% | .01% | .01% | .01% | .01% | .01% | |||||||
Other Expenses of the Select Cayman Fund | .01% | .01% | .01% | .01% | .01% | .01% | .01% | |||||||
Remainder of Other Expenses | .17% | .27% | .37% | .47% | .47% | .37% | .37% | |||||||
Total Annual Fund | .97% | 1.07% | 1.17% | 1.27% | 1.52% | 1.42% | 1.67% | |||||||
Expense Reimbursement | (.17%) | (.17%) | (.17%) | (.17%) | (.17%) | (.17%) | (.17%) | |||||||
Total Annual | .80% | .90% | 1.00% | 1.10% | 1.35% | 1.25% | 1.50% |
| (1) | The expenses in the above table reflect a written agreement by MML Advisers to cap the fees and expenses of the Fund (other than extraordinary litigation and legal expenses, interest expense, short sale dividend and loan expense, Acquired Fund fees and expenses, or other non-recurring or unusual expenses such as organizational expenses and shareholder meeting expenses) through January 31, 2018, to the extent that Total Annual Fund Operating Expenses after Expense Reimbursement would otherwise exceed .79%, .89%, .99%, 1.09%, 1.34%, 1.24%, and 1.49% for Classes I, R5, Service, Administrative, A, R4, and R3, respectively. The Total Annual Fund Operating Expenses after Expense Reimbursement shown in the above table may exceed these amounts, because, as noted in the previous sentence, certain fees and expenses are excluded from the cap. The agreement can only be terminated by mutual consent of the Board of Trustees on behalf of the Fund and MML Advisers. |
Example
This example is intended to help you compare the cost of investing in the Fund with the cost of investing in other mutual funds. It assumes that you invest $10,000 in each share class of the Fund for the time periods indicated and then redeem all of your shares at the end of those periods. For Class A shares, the example includes the initial sales charge. The example also assumes that your investment earns a 5% return each year and that the Fund’s operating expenses are exactly as described in the preceding table. Although your actual costs may be higher or lower, based on these assumptions your costs would be:
| 1 Year | 3 Years | 5 Years | 10 Years | |||||||||||||
Class I | $ | 82 | $ | 292 | $ | 520 | $ | 1,174 | ||||||||
Class R5 | $ | 92 | $ | 323 | $ | 574 | $ | 1,290 | ||||||||
Service Class | $ | 102 | $ | 355 | $ | 627 | $ | 1,405 | ||||||||
Administrative Class | $ | 112 | $ | 386 | $ | 681 | $ | 1,519 | ||||||||
Class A | $ | 705 | $ | 1,012 | $ | 1,341 | $ | 2,270 | ||||||||
Class R4 | $ | 127 | $ | 433 | $ | 760 | $ | 1,687 | ||||||||
Class R3 | $ | 153 | $ | 510 | $ | 891 | $ | 1,962 | ||||||||
Portfolio Turnover
The Fund pays transaction costs, such as commissions, when it buys and sells securities (or “turns over” its portfolio). A higher portfolio turnover rate may indicate higher transaction costs and may result in higher taxes when Fund shares are held in a taxable account. These costs, which are not reflected in annual fund operating expenses or in the example, affect the Fund’s performance. During the most recent fiscal year, the Fund’s portfolio turnover rate was 171% of the average value of its portfolio.
– 32 –
INVESTMENTS, RISKS, AND PERFORMANCE
Principal Investment Strategies
The Fund seeks to achieve its objective by investing in both equity and debt securities, including money market securities and other short-term debt obligations, of issuers located around the world, including emerging markets, without limitation on the percentage of assets the Fund can invest in a particular type of security. Equity securities may include common stocks, preferred stocks, securities convertible into common or preferred stock, securities or other investments whose price is linked to the value of common stock, rights, and warrants, of issuers of any size, or type, including growth and value companies. The Fund may buy debt securities of varying maturities, debt securities paying a fixed or floating rate of interest, and debt securities of any kind, including, by way of example, securities issued or guaranteed by the U.S. Government or its agencies and instrumentalities, by foreign governments or international agencies or supranational entities, or by domestic or foreign private issuers, mortgage-backed or other asset-backed securities, debt securities convertible into equity securities, inflation-indexed bonds, structured notes, credit-linked notes, loan assignments, and loan participations. Debt securities in which the Fund invests may be investment grade debt securities, meaning that they will be rated at least Baa by Moody’s or BBB by Standard & Poor’s, or if unrated will be considered by the Fund’s subadviser, BlackRock Investment Management, LLC (“BlackRock”), to be of comparable quality, or below investment grade debt securities (“junk” or “high yield” bonds). The Fund may invest up to 35% of its total assets in below investment grade debt securities, corporate loans, and distressed securities. In the event that a security is downgraded after its purchase by BlackRock, BlackRock may continue to hold the security if BlackRock considers that doing so would be consistent with the Fund’s investment objective. BlackRock will invest in “junk” bonds, corporate loans, and distressed securities only when it believes that they will provide an attractive total return, relative to their risk, as compared to higher quality debt securities. BlackRock will invest in distressed securities when BlackRock believes they offer significant potential for higher returns or can be exchanged for other securities that offer this potential. However, there can be no assurance that the Fund will generally achieve these returns or that the issuer will make an exchange offer or adopt a plan of reorganization. The Fund may hold a portion of its assets in cash or cash equivalents.
In making investment decisions, BlackRock tries to identify the long term trends and changes that could benefit particular markets and/or industries relative to other markets and industries. BlackRock will consider a variety of factors when selecting the markets, such as the rate of economic growth, natural resources, capital reinvestment, and the social and political environment. In deciding between equity and debt investments, BlackRock looks at a number of factors, such as the relative opportunity for capital appreciation, capital recovery risk, dividend yields, and the level of interest rates paid on debt securities of different maturities. The Fund may invest in individual securities, baskets of securities, or particular measurements of value or rate, and may consider a variety of factors and systematic inputs. BlackRock may employ derivatives for a variety of reasons, including but not limited to, adjusting its exposures to markets, sectors, asset classes, and securities. As a result, the economic exposure of the Fund to any particular market, sector, or asset class may vary relative to the market value of any particular exposure.
The Fund seeks to reduce volatility by allocating its assets broadly across markets, industries, and issuers and without geographic or market capitalization limits. BlackRock uses the Fund’s investment flexibility to create a portfolio of assets allocated between equity and debt securities. The Fund may but will not necessarily engage in foreign currency transactions, including forward contracts, options on currency, futures contracts, and swap contracts, to take long or short positions in foreign currencies in order to seek to enhance the Fund’s investment return or to seek to hedge or to attempt to protect against adverse changes in currency exchange rates. In pursuing its investment objective, the Fund may (but is not obligated to) use a wide variety of additional exchange-traded and over-the-counter derivatives, including options, futures contracts, indexed securities (securities whose return is based on changes in the value of a designated index), inverse securities (securities whose values vary inversely with changes in a specified index or interest rate), forward contracts, and swap contracts for hedging or investment purposes as a substitute for investing directly in securities. Use of derivatives by the Fund may create investment leverage.
Under normal circumstances, the Fund anticipates it will allocate a substantial amount (approximately 40% or more — unless market conditions are not deemed favorable by BlackRock, in which case the Fund would invest at least 30%) of its total assets in
– 33 –
securities of (i) foreign government issuers, (ii) issuers organized or located outside the U.S., (iii) issuers which primarily trade in a market located outside the U.S., or (iv) issuers doing a substantial business outside the U.S., which the Fund considers to be companies that derive at least 50% of their revenue or profits from business outside the U.S. or have at least 50% of their sales or assets outside the U.S. The Fund will allocate its assets among various regions and countries, including the U.S. (but in no less than three different countries).
The Fund may invest a portion of its assets in real estate investment trusts (“REITs”) and securities related to real assets (like real estate or precious metals-related securities) such as stock, bonds, or convertible bonds issued by REITs or companies that mine precious metals. The Fund may purchase and sell securities on a when-issued, delayed delivery, or forward commitment basis. The Fund may sell securities short for hedging or investment purposes. The Fund will not make a short sale, other than a short sale “against the box,” if, after giving effect to such sale, the market value of all securities sold short exceeds 20% of its total assets.
The Fund may seek to provide exposure to the investment returns of real assets that trade in the commodity markets, including precious metals, agriculture, energy, livestock, or industrial metals. The Fund may obtain such exposure through, among other things, investments in issuers in commodities-related industries or in other investment vehicles that invest directly in commodities, commodities-related companies, or commodities-related investments, such as exchange-traded funds. The Fund may, but will not necessarily, invest in commodity-linked derivative instruments, including futures contracts, options, and swaps. In order to earn qualifying income under applicable tax rules from commodities and certain commodities-related investments, the Fund may invest up to 25% of its total assets in the MassMutual Select Cayman Global Allocation Fund I, Ltd. (the “Select Cayman Fund”), which was formed in the Cayman Islands and is a wholly-owned subsidiary of the Fund. The Select Cayman Fund may also hold cash and invest in other instruments, including fixed income securities, either as investments or to serve as margin or collateral for its derivative positions.
The Fund expects that it will engage in active and frequent trading and so will typically have a relatively high portfolio turnover rate.
Principal Risks
The following are the Principal Risks of the Fund. The value of your investment in the Fund could go down as well as up. You can lose money by investing in the Fund.
Bank Loans Risk Many of the risks associated with bank loans are similar to the risks of investing in below investment grade debt securities. Changes in the financial condition of the borrower or economic conditions or other circumstances may reduce the capacity of the borrower to make principal and interest payments on such instruments and may lead to defaults. Senior secured bank loans are typically supported by collateral; however the value of the collateral may be insufficient to cover the amount owed to the Fund, or the Fund may be prevented or delayed from realizing on the collateral. Some loans may be unsecured; unsecured loans generally present a greater risk of loss to the Fund if the issuer defaults. If the Fund relies on a third party to administer a loan, the Fund is subject to the risk that the third party will fail to perform its obligations. In addition, if the Fund holds only a participation interest in a loan made by a third party, the Fund’s receipt of payments on the loan will depend on the third party’s willingness and ability to make those payments to the Fund. The settlement time for certain loans is longer than the settlement time for many other types of investments, and the Fund may not receive the payment for a loan sold by it until well after the sale; that cash would be unavailable for payment of redemption proceeds or for reinvestment. Interests in other bank loans may not be readily marketable and may be subject to restrictions on resale. In some cases, negotiations involved in disposing of indebtedness may require weeks to complete. Consequently, some indebtedness may be difficult or impossible to dispose of readily at what the Fund believes to be a fair price.
Below Investment Grade Debt Securities Risk Below investment grade debt securities, commonly known as “junk” or “high yield” bonds, have speculative characteristics and involve greater volatility of price and yield, greater risk of loss of principal and interest, and generally reflect a greater possibility of an adverse change in financial condition that could affect an issuer’s ability to honor its obligations.
Cash Position Risk If the Fund holds a significant portion of its assets in cash or cash equivalents, its investment returns may be adversely affected and the Fund may not achieve its investment objective.
– 34 –
Commodities-Related Investments Risk Commodity prices (including precious metals) can be extremely volatile and exposure to commodities can cause the net asset value of the Fund’s shares to decline or fluctuate in a rapid and unpredictable manner. The values of physical commodities or commodity-linked derivative instruments may be affected by changes in overall market movements, real or perceived inflationary trends, commodity index volatility, changes in interest rates or currency exchange rates, population growth and changing demographics, international economic, political, and regulatory developments, or factors affecting a particular region, industry, or commodity. A liquid secondary market may not exist for certain commodity investments, which may make it difficult for the Fund to sell them at a desirable price or at the price at which it is carrying them.
Convertible Securities Risk Convertible securities are subject to the risks of both debt instruments and equity securities. The price of a convertible security may change in response to changes in price of the underlying equity security, the credit quality of the issuer, and interest rates. In general, the values of convertible securities tend to decline as interest rates rise and to rise when interest rates fall. A convertible security generally has less potential for gain or loss than the underlying equity security.
Credit Risk Credit risk is the risk that an issuer, guarantor, or liquidity provider of a fixed-income security held by the Fund may be unable or unwilling, or may be perceived (whether by market participants, ratings agencies, pricing services or otherwise) as unable or unwilling, to make timely principal and/or interest payments, or to otherwise honor its obligations. The Fund may also be exposed to the credit risk of its counterparty to repurchase agreements, reverse repurchase agreements, swap transactions, and other derivatives transactions, and to the counterparty’s ability or willingness to perform in accordance with the terms of the transaction. The value of such transactions to the Fund will depend on the willingness and ability of the counterparty to perform its obligations, including among other things the obligation to return collateral or margin to the Fund.
Defaulted and Distressed Securities Risk Because the issuer of such securities is in default and is likely to be in distressed financial condition, repayment of defaulted securities and obligations of distressed issuers (including insolvent issuers or issuers in payment or
covenant default, in workout or restructuring, or in bankruptcy or insolvency proceedings) is uncertain.
Derivatives Risk Derivatives can be highly volatile and involve risks different from, and potentially greater than, direct investments, including risks of imperfect correlation between the value of derivatives and underlying assets, counterparty default, potential losses that partially or completely offset gains, and illiquidity. Derivatives can create investment leverage. Losses from derivatives can be substantially greater than the derivatives’ original cost and can sometimes be unlimited. If the value of a derivative does not correlate well with the particular market or asset class the derivative is designed to provide exposure to, the derivative may not have the effect anticipated. Derivatives can also reduce the opportunity for gains or result in losses by offsetting positive returns in other investments. Many derivatives are traded in the over-the-counter market and not on exchanges.
Equity Securities Risk Although stocks may have the potential to outperform other asset classes over the long term, their prices tend to fluctuate more dramatically over the shorter term. These movements may result from factors affecting individual companies, or from broader influences like changes in interest rates, market conditions, investor confidence, or announcements of economic, political, or financial information. While potentially offering greater opportunities for capital growth than larger, more established companies, the stocks of smaller companies may be particularly volatile, especially during periods of economic uncertainty. These companies may face less certain growth prospects, or depend heavily on a limited line of products and services or the efforts of a small number of key management personnel.
Fixed Income Securities Risk The values of fixed income securities typically will decline during periods of rising interest rates, and can also decline in response to changes in the financial condition of the issuer, borrower, counterparty, or underlying collateral assets, or changes in market, economic, industry, political, and regulatory conditions affecting a particular type of security or issuer or fixed income securities generally. Certain events, such as market or economic developments, regulatory or government actions, natural disasters, terrorist attacks, war, and other geopolitical events can have a dramatic adverse effect on the debt market and the overall liquidity of the market for fixed income securities. During those periods, the Fund may experience high levels of shareholder redemptions, and
– 35 –
may have to sell securities at times when the Fund would otherwise not do so, and potentially at unfavorable prices. Certain securities may be difficult to value during such periods. Fixed income securities are subject to interest rate risk (the risk that the value of a fixed income security will fall when interest rates rise), extension risk (the risk that the average life of a security will be extended through a slowing of principal payments), prepayment risk (the risk that a security will be prepaid and the Fund will be required to reinvest at a less favorable rate), and credit risk. These risks may be heightened due to the current historically low interest rate environment.
Foreign Investment Risk; Emerging Markets Risk; Currency Risk Investments in securities of non-U.S. issuers (including depositary receipts) entail risks not typically associated with investing in securities of U.S. issuers. Similar risks may apply to securities traded on a U.S. securities exchange that are issued by companies with significant exposure to non-U.S. countries. In certain countries, legal remedies available to investors may be more limited than those available with regard to U.S. investments. Because non-U.S. securities are normally denominated and traded in currencies other than the U.S. dollar, the value of the Fund’s assets may be affected favorably or unfavorably by currency exchange rates, exchange control regulations, and restrictions or prohibitions on the repatriation of non-U.S. currencies. Income and gains with respect to investments in certain countries may be subject to withholding and other taxes. There may be less information publicly available about a non-U.S. company than about a U.S. company, and many non-U.S. companies are not subject to accounting, auditing, and financial reporting standards, regulatory framework and practices comparable to those in the U.S. Foreign investments may be subject to the risks of seizure by a foreign government, imposition of restrictions on the exchange or export of foreign currency, other economic sanctions, and tax increases. The securities of some non-U.S. companies, especially those in emerging markets, are less liquid and at times more volatile than securities of comparable U.S. companies. Emerging markets securities are subject to greater risks than securities issued in developed foreign markets, including less liquidity, greater price volatility, higher relative rates of inflation, greater political, economic, and social instability, greater custody and operational risks, and greater volatility in currency exchange rates. Non-U.S. transaction costs, such as brokerage commissions and custody costs may be higher than in the United States. In addition, there may
be a possibility of nationalization or expropriation of assets, imposition of currency exchange controls, confiscatory taxation, political or financial instability, and diplomatic developments that could adversely affect the values of the Fund’s investments in certain non-U.S. countries.
Frequent Trading/Portfolio Turnover Risk Portfolio turnover generally involves some expense to the Fund and may result in the realization of taxable capital gains (including short-term gains). The trading costs and tax effects associated with portfolio turnover may adversely affect the Fund’s performance.
Growth Company Risk The prices of growth securities are often highly sensitive to market fluctuations because of their heavy dependence on future earnings expectations, and can be more volatile than the market in general.
Large Company Risk Large-capitalization stocks as a group could fall out of favor with the market, causing the Fund to underperform investments that focus on small- or medium-capitalization stocks. Larger, more established companies may be slow to respond to challenges and may grow more slowly than smaller companies.
Leveraging Risk Instruments and transactions, including derivatives, that create leverage may cause the value of an investment in the Fund to be more volatile, could result in larger losses than if they were not used, and tend to compound the effects of other risks.
Liquidity Risk Certain securities may be difficult (or impossible) to sell or positions difficult to close out at a desirable time and price, and the Fund may be required to hold an illiquid investment that is declining in value, or it may be required to sell certain illiquid investments at a price or time that is not advantageous in order to meet redemptions or other cash needs. Some securities may be subject to restrictions on resale. There can be no assurance that there will be a liquid market for instruments held by the Fund at any time.
Management Risk The Fund relies on the manager’s investment analysis and its selection of investments to achieve its investment objective. There can be no assurance that the Fund will achieve the intended results and the Fund may incur significant losses.
Market Risk The value of the Fund’s portfolio securities may decline, at times sharply and
– 36 –
unpredictably, as a result of unfavorable market-induced changes affecting particular industries, sectors, or issuers. Stock markets can decline significantly in response to issuer, market, economic, industry, political, regulatory, geopolitical and other conditions, as well as investor perceptions of these conditions. The Fund is subject to risks affecting issuers, such as management performance, financial leverage, industry problems, and reduced demand for goods or services.
Mortgage- and Asset-Backed Securities Risk Investments in mortgage- and asset-backed securities subject the Fund to credit risk, interest rate risk, extension risk, and prepayment risk, among other risks. Mortgage-backed and asset-backed securities not issued by a government agency generally involve greater credit risk than securities issued by government agencies. Payment of principal and interest generally depends on the cash flows generated by the underlying assets and the terms of the security. The types of mortgages (for example, residential or commercial mortgages) underlying securities held by the Fund may differ and be affected differently by market factors. Investments that receive only the interest portion or the principal portion of payments on the underlying assets may be highly volatile. The market for mortgage- and asset-backed securities has recently experienced high volatility and a lack of liquidity. As a result, the value of many of these securities has significantly declined.
Preferred Stock Risk Like other equity securities, preferred stock is subject to the risk that its value may decrease based on actual or perceived changes in the business or financial condition of the issuer. In addition, changes in interest rates may adversely affect the value of a preferred stock that pays a fixed dividend.
Real Estate Risk; REIT Risk Real estate-related investments may decline in value as a result of factors affecting the real estate industry, such as the supply of real property in certain markets, changes in zoning laws, environmental regulations and other governmental action, delays in completion of construction, changes in real estate values, changes in property taxes, levels of occupancy, losses due to natural disasters, and local and regional market conditions. Investments in REITs may be subject to risks similar to those associated with direct investment in real estate, as well as additional risks associated with equity investments.
Risk of Investment in Other Funds or Pools The Fund is indirectly exposed to all of the risks of the underlying funds, including exchange-traded funds, in which it invests, including the risk that the underlying funds will not perform as expected. The Fund indirectly pays a portion of the expenses incurred by the underlying funds.
Select Cayman Fund Risk The Fund’s investments in the Select Cayman Fund expose the Fund to the risks associated with that entity’s investments, which are generally the risks of commodities-related investments. The Select Cayman Fund is not subject to the investor protections of the Investment Company Act of 1940, as amended (the “1940 Act”). Changes in U.S. or Cayman laws could result in increased expense or the inability of the Fund to operate as intended, which could adversely affect the investment returns of the Fund. There is no guarantee that the investment objective of the Select Cayman Fund will be achieved.
Short Sales Risk If the Fund sells a security short, it will make money if the security’s price goes down (in an amount greater than any transaction costs) and will lose money if the security’s price goes up. There is no limit on the amount of money the Fund may lose on a short sale. The Fund may not be able to close out a short sale when it might wish to do so, or may only do so at an unfavorable price. Short sales can involve leverage. If the Fund invests the proceeds from short positions in other securities the Fund could lose money both on the short positions and on the securities in which it has invested the short proceeds.
Smaller and Mid-Cap Company Risk Market risk and liquidity risk are particularly pronounced for securities of smaller companies, which may trade less frequently and in smaller volumes than more widely-held securities, and may fluctuate in price more than other securities. Their shares can be less liquid than those of larger companies, especially during market declines. Smaller companies may have limited product lines, markets, or financial resources and may be dependent on a limited management group; they may have been recently organized and have little or no track record of success.
Sovereign Debt Obligations Risk Investments in debt securities issued by governments or by government agencies and instrumentalities involve the risk that the governmental entities responsible for repayment may be unable or unwilling to pay interest and repay principal
– 37 –
when due. Many sovereign debt obligations may be rated below investment grade (“junk” or “high yield” bonds). Any restructuring of a sovereign debt obligation held by the Fund will likely have a significant adverse effect on the value of the obligation. In the event of default of sovereign debt, the Fund may be unable to pursue legal action against the sovereign issuer or to realize on collateral securing the debt.
Structured Notes Risk Structured notes and other related instruments purchased by the Fund are generally privately negotiated debt obligations where the principal and/or interest is determined by reference to the performance of a specific asset, benchmark asset, market, or interest rate (“reference measure”). The purchase of structured notes exposes the Fund to the credit risk of the issuer of the structured product. Structured notes may be leveraged, increasing the volatility of each structured note’s value relative to the change in the reference measure. Structured notes may also be less liquid and more difficult to price accurately than less complex securities and instruments or more traditional debt securities.
U.S. Government Securities Risk Obligations of certain U.S. Government agencies and instrumentalities are not backed by the full faith and credit of the U.S. Government, and there can be no assurance that the U.S. Government would provide financial support to such agencies and instrumentalities.
Valuation Risk The Fund is subject to the risk of mispricing or improper valuation of its investments, in particular to the extent that its securities are fair valued.
Value Company Risk The value investment approach entails the risk that the market will not recognize a security’s intrinsic value for a long time, or that a stock the investment adviser or subadviser judges to be undervalued may actually be appropriately priced.
When-Issued, Delayed Delivery, TBA, and Forward Commitment Transaction Risk These transactions may create leverage and involve a risk of loss if the value of the securities declines prior to settlement.
Performance Information
The following bar chart and table provide some indication of the risks of investing in the Fund. The bar chart shows changes in the Fund’s performance from year to year for Class R5 shares. The table shows how the Fund’s average annual returns for
1 and 5 years, and since inception, compare with those of a broad measure of market performance and additional indexes, including an index that provides a comparison relevant to the Fund’s fixed income investments (Citigroup World Government Bond Index) and a hypothetical custom index which comprises the S&P 500 (36%), FTSE World ex U.S. (24%), BofA Merrill Lynch Current 5-Year U.S. Treasury (24%), and Citigroup Non-U.S. Dollar World Government Bond (16%) Indexes (Custom Global Allocation Index). Performance for Class I, Class R4, and Class R3 shares of the Fund for periods prior to their inception date (04/01/14) is based on the performance of Class R5 shares, adjusted for Class R4 and Class R3 shares to reflect Class R4 and Class R3 expenses, respectively. Performance for Class A shares of the Fund reflects any applicable sales charge. Past performance (before and after taxes) is not necessarily an indication of how the Fund will perform in the future. More up-to-date performance information is available at http://www.massmutual.com/funds or by calling 1-888-309-3539.
Annual Performance
Class R5 Shares
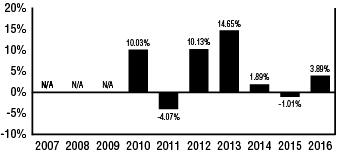
| Highest Quarter: | 3Q ’10, | 8.99% | Lowest Quarter: | 3Q ’11, | - | 11.11% |
After-tax returns are calculated using the historical highest individual federal marginal income tax rates and do not reflect the impact of state and local taxes. Actual after-tax returns depend on an investor’s tax situation and may differ from those shown. After-tax returns are not relevant to investors who hold Fund shares through tax-advantaged arrangements, such as 401(k) plans or individual retirement accounts. After-tax returns are shown for Class R5 only. After-tax returns for other classes will vary.
– 38 –
Average Annual Total Returns
(for the periods ended December 31, 2016)
One Year | Five Years | Since Inception (12/01/09) | ||||||||||||
| Class R5 | Return Before Taxes | 3.89% | 5.76% | 4.68% | ||||||||||
Return After Distributions | 3.69% | 4.39% | 3.58% | |||||||||||
Return After Distributions Fund Shares | 2.37% | 4.33% | 3.56% | |||||||||||
| Class I | Return Before Taxes | 3.95% | 5.84% | 4.73% | ||||||||||
| Service Class | Return Before Taxes | 3.82% | 5.68% | 4.60% | ||||||||||
| Administrative Class | Return Before Taxes | 3.67% | 5.54% | 4.50% | ||||||||||
| Class A | Return Before Taxes | -2.50% | 4.05% | 3.34% | ||||||||||
| Class R4 | Return Before Taxes | 3.60% | 5.43% | 4.34% | ||||||||||
| Class R3 | Return Before Taxes | 3.28% | 5.16% | 4.08% | ||||||||||
| FTSE World Index (reflects no deduction for fees, expenses, or taxes) | 8.65% | 10.36% | 8.32% | |||||||||||
| Citigroup World Government Bond Index (reflects no deduction for fees, expenses, or taxes) | 1.60% | -0.99% | 0.15% | |||||||||||
| Custom Global Allocation Index (reflects no deduction for fees, expenses, or taxes) | 6.06% | 6.66% | 6.28% | |||||||||||
MANAGEMENT
Investment Adviser: MML Investment Advisers, LLC (“MML Advisers”)
Subadviser: BlackRock Investment Management, LLC (“BlackRock”)
Portfolio Managers:
Dennis W. Stattman, CFA is a Managing Director at BlackRock. He has managed the Fund since its inception (December 2009).
Dan Chamby, CFA is a Managing Director at BlackRock. He has managed the Fund since its inception (December 2009).
Russ Koesterich, CFA is a Managing Director at BlackRock. He has managed the Fund since January 2017.
David Clayton, CFA is a Managing Director at BlackRock. He has managed the Fund since January 2017.
Kent Hogshire, CFA is a Managing Director at BlackRock. He has managed the Fund since January 2017.
PURCHASE AND SALE OF FUND SHARES
Shares of the Fund are generally available to retirement plans, other institutional investors, and individual retirement accounts. Fund shares are redeemable on any business day by written request, telephone or internet (available to certain customers).
TAX INFORMATION
The Fund intends to make distributions that may be taxed as ordinary income, qualified dividend income, or capital gains, unless you are an investor eligible for preferential tax treatment.
PAYMENTS TO BROKER-DEALERS AND OTHER FINANCIAL INTERMEDIARIES
If you purchase the Fund through a broker-dealer or other financial intermediary, the intermediary may receive a one-time or continuing payments from the Fund, MML Advisers or its affiliates, or others for the sale of Fund shares or continuing shareholder services provided by the intermediary. These payments may create a conflict of interest by influencing the broker-dealer or other intermediary to recommend the Fund over another investment. You should contact your intermediary to obtain more information about the compensation it may receive in connection with your investment.
– 39 –
MassMutual Select Diversified Value Fund
INVESTMENT OBJECTIVE
This Fund seeks to achieve long-term growth of capital and income by investing primarily in a diversified portfolio of equity securities of larger, well-established companies.
FEES AND EXPENSES OF THE FUND
This table describes the fees and expenses that you may pay if you buy and hold shares of the Fund. For Class A shares, you may qualify for sales charge discounts if you invest, or agree to invest in the future, at least $25,000 in MassMutual funds. More information about these and other discounts is available in the section titled Sales Charges by Class beginning on page 145 of the Fund’s Prospectus or from your financial professional.
Shareholder Fees (fees paid directly from your investment)
| Class I | Class R5 | Service Class | Administrative Class | Class A | Class R4 | Class R3 | ||||||||
Maximum Sales Charge (Load) Imposed on Purchases (as a % of offering price) | None | None | None | None | 5.75% | None | None | |||||||
Maximum Deferred Sales Charge (Load) (as a % of the lower of the original offering price or redemption proceeds) | None | None | None | None | None | None | None |
Annual Fund Operating Expenses (expenses that you pay each year as a percentage of the value of your investment)
| Class I | Class R5 | Service Class | Administrative Class | Class A | Class R4 | Class R3 | ||||||||
Management Fees | .50% | .50% | .50% | .50% | .50% | .50% | .50% | |||||||
Distribution and Service | None | None | None | None | .25% | .25% | .50% | |||||||
Other Expenses | .07% | .17% | .27% | .37% | .37% | .27% | .27% | |||||||
Total Annual Fund Operating Expenses | .57% | .67% | .77% | .87% | 1.12% | 1.02% | 1.27% |
Example
This example is intended to help you compare the cost of investing in the Fund with the cost of investing in
other mutual funds. It assumes that you invest $10,000 in each share class of the Fund for the time periods indicated and then redeem all of your shares at the end of those periods. For Class A shares, the example includes the initial sales charge. The example also assumes that your investment earns a 5% return each year and that the Fund’s operating expenses are exactly as described in the preceding table. Although your actual costs may be higher or lower, based on these assumptions your costs would be:
| 1 Year | 3 Years | 5 Years | 10 Years | |||||||||||||
Class I | $ | 58 | $ | 183 | $ | 318 | $ | 714 | ||||||||
Class R5 | $ | 68 | $ | 214 | $ | 373 | $ | 835 | ||||||||
Service Class | $ | 79 | $ | 246 | $ | 428 | $ | 954 | ||||||||
Administrative Class | $ | 89 | $ | 278 | $ | 482 | $ | 1,073 | ||||||||
Class A | $ | 683 | $ | 911 | $ | 1,156 | $ | 1,860 | ||||||||
Class R4 | $ | 104 | $ | 325 | $ | 563 | $ | 1,248 | ||||||||
Class R3 | $ | 129 | $ | 403 | $ | 697 | $ | 1,534 | ||||||||
Portfolio Turnover
The Fund pays transaction costs, such as commissions, when it buys and sells securities (or “turns over” its portfolio). A higher portfolio turnover rate may indicate higher transaction costs and may result in higher taxes when Fund shares are held in a taxable account. These costs, which are not reflected in annual fund operating expenses or in the example, affect the Fund’s performance. During the most recent fiscal year, the Fund’s portfolio turnover rate was 39% of the average value of its portfolio.
INVESTMENTS, RISKS, AND PERFORMANCE
Principal Investment Strategies
The Fund normally invests at least 80% of its net assets (plus the amount of any borrowings for investment purposes) in stocks, securities convertible into stocks, and other securities, such as warrants and stock rights, whose value is based on stock prices. The Fund typically invests most of its assets in securities of U.S. companies, but may invest up to 25% of its total assets in foreign securities and American Depositary Receipts (“ADRs”), including emerging market securities. The Fund is managed by two subadvisers, each being responsible for a portion of the portfolio, but not necessarily equally weighted. The Fund may invest in real estate investment trusts (“REITs”) and securities subject to legal restrictions on resale pursuant to Rule 144A. The Fund may hold a portion of its assets in cash or cash equivalents.
– 40 –
Brandywine Global Investment Management, LLC (“Brandywine Global”) invests in securities that meet its value criteria, primarily, price-to-earnings, price-to-book, price momentum, and share change and quality, based on both quantitative and fundamental analysis. Brandywine Global expects to hold approximately 150-250 stocks under normal market conditions.
Brandywine Global invests in securities of companies that meet its value criteria based on both quantitative and fundamental analysis. Brandywine Global’s investment process begins with a valuation screen that identifies large cap stocks with favorable financial ratios. A quantitative deselection process is then applied to eliminate equities that have poor price momentum or high share issuance. Finally Brandywine Global performs a thorough fundamental analysis which seeks to identify and eliminate (de-select) companies with deteriorating fundamentals, anticipated earnings declines, or material write-offs. Brandywine Global may also consider additional factors in its selection process.
Brandywine Global typically sells a security of a company when Brandywine Global believes it is no longer a large capitalization value company, if the company’s fundamentals deteriorate, when an investment opportunity arises that Brandywine Global believes is more compelling, or in order to realize gains or limit potential losses. However, Brandywine Global may retain securities of companies that no longer meet its initial purchase criteria.
Loomis, Sayles & Company, L.P. (“Loomis Sayles”) generally looks for companies that it believes are undervalued by the market in relation to earnings, dividends, assets, and growth prospects. Loomis Sayles’ investments may include companies that have suffered significant business problems but that Loomis Sayles believes have favorable prospects for recovery. Loomis Sayles seeks to identify companies that it believes are, among other things, attractively valued based on Loomis Sayles’ estimate of intrinsic value. Loomis Sayles generally seeks to find value by selecting individual stocks that it believes are attractive, rather than by attempting to achieve investment growth by rotating the portfolio’s holdings among various sectors of the economy.
Principal Risks
The following are the Principal Risks of the Fund. The value of your investment in the Fund could go down as well as up. You can lose money by investing in the Fund.
Cash Position Risk If the Fund holds a significant portion of its assets in cash or cash equivalents, its investment returns may be adversely affected and the Fund may not achieve its investment objective.
Convertible Securities Risk Convertible securities are subject to the risks of both debt instruments and equity securities. The price of a convertible security may change in response to changes in price of the underlying equity security, the credit quality of the issuer, and interest rates. In general, the values of convertible securities tend to decline as interest rates rise and to rise when interest rates fall. A convertible security generally has less potential for gain or loss than the underlying equity security.
Equity Securities Risk Although stocks may have the potential to outperform other asset classes over the long term, their prices tend to fluctuate more dramatically over the shorter term. These movements may result from factors affecting individual companies, or from broader influences like changes in interest rates, market conditions, investor confidence, or announcements of economic, political, or financial information. While potentially offering greater opportunities for capital growth than larger, more established companies, the stocks of smaller companies may be particularly volatile, especially during periods of economic uncertainty. These companies may face less certain growth prospects, or depend heavily on a limited line of products and services or the efforts of a small number of key management personnel.
Foreign Investment Risk; Emerging Markets Risk; Currency Risk Investments in securities of non-U.S. issuers (including depositary receipts) entail risks not typically associated with investing in securities of U.S. issuers. Similar risks may apply to securities traded on a U.S. securities exchange that are issued by companies with significant exposure to non-U.S. countries. In certain countries, legal remedies available to investors may be more limited than those available with regard to U.S. investments. Because non-U.S. securities are normally denominated and traded in currencies other than the U.S. dollar, the value of the Fund’s assets may be affected favorably or unfavorably by currency exchange rates, exchange
– 41 –
control regulations, and restrictions or prohibitions on the repatriation of non-U.S. currencies. Income and gains with respect to investments in certain countries may be subject to withholding and other taxes. There may be less information publicly available about a non-U.S. company than about a U.S. company, and many non-U.S. companies are not subject to accounting, auditing, and financial reporting standards, regulatory framework and practices comparable to those in the U.S. Foreign investments may be subject to the risks of seizure by a foreign government, imposition of restrictions on the exchange or export of foreign currency, other economic sanctions, and tax increases. The securities of some non-U.S. companies, especially those in emerging markets, are less liquid and at times more volatile than securities of comparable U.S. companies. Emerging markets securities are subject to greater risks than securities issued in developed foreign markets, including less liquidity, greater price volatility, higher relative rates of inflation, greater political, economic, and social instability, greater custody and operational risks, and greater volatility in currency exchange rates. Non-U.S. transaction costs, such as brokerage commissions and custody costs may be higher than in the United States. In addition, there may be a possibility of nationalization or expropriation of assets, imposition of currency exchange controls, confiscatory taxation, political or financial instability, and diplomatic developments that could adversely affect the values of the Fund’s investments in certain non-U.S. countries.
Large Company Risk Large-capitalization stocks as a group could fall out of favor with the market, causing the Fund to underperform investments that focus on small- or medium-capitalization stocks. Larger, more established companies may be slow to respond to challenges and may grow more slowly than smaller companies.
Liquidity Risk Certain securities may be difficult (or impossible) to sell or positions difficult to close out at a desirable time and price, and the Fund may be required to hold an illiquid investment that is declining in value, or it may be required to sell certain illiquid investments at a price or time that is not advantageous in order to meet redemptions or other cash needs. Some securities may be subject to restrictions on resale. There can be no assurance that there will be a liquid market for instruments held by the Fund at any time.
Management Risk The Fund relies on the manager’s investment analysis and its selection of investments to achieve its investment objective. There can be no assurance that the Fund will achieve the intended results and the Fund may incur significant losses.
Market Risk The value of the Fund’s portfolio securities may decline, at times sharply and unpredictably, as a result of unfavorable market-induced changes affecting particular industries, sectors, or issuers. Stock markets can decline significantly in response to issuer, market, economic, industry, political, regulatory, geopolitical and other conditions, as well as investor perceptions of these conditions. The Fund is subject to risks affecting issuers, such as management performance, financial leverage, industry problems, and reduced demand for goods or services.
REIT Risk Investments in REITs may be subject to risks similar to those associated with direct investment in real estate, as well as additional risks associated with equity investments.
Valuation Risk The Fund is subject to the risk of mispricing or improper valuation of its investments, in particular to the extent that its securities are fair valued.
Value Company Risk The value investment approach entails the risk that the market will not recognize a security’s intrinsic value for a long time, or that a stock the investment adviser or subadviser judges to be undervalued may actually be appropriately priced.
Performance Information
The following bar chart and table provide some indication of the risks of investing in the Fund. The bar chart shows changes in the Fund’s performance from year to year for Class R5 shares. The table shows how the Fund’s average annual returns for 1, 5, and 10 years compare with those of a broad measure of market performance. Performance for Class I and Class R4 shares of the Fund for periods prior to their inception date (04/01/14) is based on the performance of Class R5 shares, adjusted for Class R4 shares to reflect Class R4 expenses. Performance for Class A shares of the Fund reflects any applicable sales charge. Past performance (before and after taxes) is not necessarily an indication of how the Fund will perform in the future. More up-to-date performance information is available at http://www.massmutual.com/funds or by calling 1-888-309-3539.
– 42 –
Annual Performance
Class R5 Shares
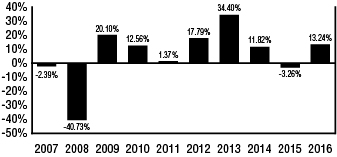
Highest Quarter: | 3Q ’09, | 18.89% | Lowest Quarter: | 4Q ’08, | - | 21.80% |
After-tax returns are calculated using the historical highest individual federal marginal income tax rates and do not reflect the impact of state and local taxes. Actual after-tax returns depend on an investor’s tax situation and may differ from those shown. After-tax returns are not relevant to investors who hold Fund shares through tax-advantaged arrangements, such as
401(k) plans or individual retirement accounts. After-tax returns are shown for Class R5 only. After-tax returns for other classes will vary.
Average Annual Total Returns
(for the periods ended December 31, 2016)
| One Year | Five Years | Ten Years | ||||||||||||
| Class R5 | Return Before Taxes | 13.24% | 14.16% | 4.39% | ||||||||||
| Return After Taxes on Distributions | 11.65% | 13.50% | 3.84% | |||||||||||
| Return After Taxes on Distributions and Sales of Fund Shares | 8.82% | 11.38% | 3.46% | |||||||||||
| Class I | Return Before Taxes | 13.39% | 14.22% | 4.42% | ||||||||||
Service Class | Return Before Taxes | 13.12% | 14.06% | 4.30% | ||||||||||
Administrative Class | Return Before Taxes | 13.01% | 13.93% | 4.18% | ||||||||||
| Class A | Return Before Taxes | 6.29% | 12.31% | 3.28% | ||||||||||
| Class R4 | Return Before Taxes | 12.90% | 13.77% | 4.03% | ||||||||||
| Class R3 | Return Before Taxes | 12.62% | 13.39% | 3.61% | ||||||||||
| Russell 1000 Value Index (reflects no deduction for fees, expenses, or taxes) | 17.34% | 14.80% | 5.72% | |||||||||||
MANAGEMENT
Investment Adviser: MML Investment Advisers, LLC (“MML Advisers”)
Subadvisers: Brandywine Global Investment Management, LLC (“Brandywine Global”)
Loomis, Sayles & Company, L.P. (“Loomis Sayles”)
Portfolio Managers:
Joseph J. Kirby is a Portfolio Manager at Brandywine Global. He has managed the Fund since January 2010.
Henry F. Otto is a Managing Director and Portfolio Manager at Brandywine Global. He has managed the Fund since January 2010.
Steven M. Tonkovich is a Managing Director and Portfolio Manager at Brandywine Global. He has managed the Fund since January 2010.
Arthur Barry, CFA is a Vice President and Portfolio Manager at Loomis Sayles. He has managed the Fund since January 2010.
Adam C. Liebhoff is a Vice President and Portfolio Manager at Loomis Sayles. He has managed the Fund since April 2015.
PURCHASE AND SALE OF FUND SHARES
Shares of the Fund are generally available to retirement plans, other institutional investors, and individual retirement accounts. Fund shares are redeemable on any business day by written request, telephone or internet (available to certain customers).
TAX INFORMATION
The Fund intends to make distributions that may be taxed as ordinary income, qualified dividend income, or capital gains, unless you are an investor eligible for preferential tax treatment.
PAYMENTS TO BROKER-DEALERS AND OTHER FINANCIAL INTERMEDIARIES
If you purchase the Fund through a broker-dealer or other financial intermediary, the intermediary may receive a one-time or continuing payments from the Fund, MML Advisers or its affiliates, or others for the sale of Fund shares or continuing shareholder services provided by the intermediary. These payments may create a conflict of interest by influencing the broker-dealer or other intermediary to recommend the Fund over another investment. You should contact your intermediary to obtain more information about the compensation it may receive in connection with your investment.
– 43 –
MassMutual Select Fundamental Value Fund
INVESTMENT OBJECTIVE
The Fund seeks long-term total return.
FEES AND EXPENSES OF THE FUND
This table describes the fees and expenses that you may pay if you buy and hold shares of the Fund. For Class A shares, you may qualify for sales charge discounts if you invest, or agree to invest in the future, at least $25,000 in MassMutual funds. More information about these and other discounts is available in the section titled Sales Charges by Class beginning on page 145 of the Fund’s Prospectus or from your financial professional.
Shareholder Fees (fees paid directly from your investment)
| Class I | Class R5 | Service Class | Administrative Class | Class A | Class R4 | Class R3 | ||||||||
Maximum Sales Charge (Load) Imposed on Purchases (as a % of offering price) | None | None | None | None | 5.75% | None | None | |||||||
Maximum Deferred Sales Charge (Load) (as a % of the lower of the original offering price or redemption proceeds) | None | None | None | None | None | None | None |
Annual Fund Operating Expenses (expenses that you pay each year as a percentage of the value of your investment)
| Class I | Class R5 | Service Class | Administrative Class | Class A | Class R4 | Class R3 | ||||||||
Management Fees | .60% | .60% | .60% | .60% | .60% | .60% | .60% | |||||||
Distribution and Service | None | None | None | None | .25% | .25% | .50% | |||||||
Other Expenses | .03% | .13% | .23% | .33% | .33% | .23% | .23% | |||||||
Total Annual Fund Operating Expenses | .63% | .73% | .83% | .93% | 1.18% | 1.08% | 1.33% |
Example
This example is intended to help you compare the cost of investing in the Fund with the cost of investing in other mutual funds. It assumes that you invest $10,000 in each share class of the Fund for the time periods indicated and then redeem all of your shares at the end of those periods. For Class A shares, the example includes the initial sales charge. The example also assumes that your investment earns a 5% return each year and that the Fund’s operating expenses are exactly as described in the preceding table. Although your actual costs may be higher or lower, based on these assumptions your costs would be:
| 1 Year | 3 Years | 5 Years | 10 Years | |||||||||||||
Class I | $ | 64 | $ | 202 | $ | 351 | $ | 786 | ||||||||
Class R5 | $ | 75 | $ | 233 | $ | 406 | $ | 906 | ||||||||
Service Class | $ | 85 | $ | 265 | $ | 460 | $ | 1,025 | ||||||||
Administrative Class | $ | 95 | $ | 296 | $ | 515 | $ | 1,143 | ||||||||
Class A | $ | 688 | $ | 928 | $ | 1,187 | $ | 1,924 | ||||||||
Class R4 | $ | 110 | $ | 343 | $ | 595 | $ | 1,317 | ||||||||
Class R3 | $ | 135 | $ | 421 | $ | 729 | $ | 1,601 | ||||||||
Portfolio Turnover
The Fund pays transaction costs, such as commissions, when it buys and sells securities (or “turns over” its portfolio). A higher portfolio turnover rate may indicate higher transaction costs and may result in higher taxes when Fund shares are held in a taxable account. These costs, which are not reflected in annual fund operating expenses or in the example, affect the Fund’s performance. During the most recent fiscal year, the Fund’s portfolio turnover rate was 16% of the average value of its portfolio.
INVESTMENTS, RISKS, AND PERFORMANCE
Principal Investment Strategies
The Fund invests primarily in equity securities of issuers that the Fund’s subadviser, Wellington Management Company LLP (“Wellington Management”), believes are undervalued. Under normal circumstances, the Fund invests at least 80% of its net assets (plus the amount of any borrowings for investment purposes) in equity securities. Equity securities include common stock, preferred stock, securities convertible into common or preferred stock, rights, and warrants. Although the Fund may invest in companies of any size, the Fund will tend to focus on companies with large market capitalizations (which Wellington Management believes are generally above $2 billion). The Fund may invest up
– 44 –
to 20% of its total assets in the securities of foreign issuers and American Depositary Receipts (“ADRs”), including emerging market securities. The Fund may hold a portion of its assets in cash or cash equivalents.
Wellington Management generally employs a bottom-up investment approach based on fundamental analysis of companies with large market capitalizations and estimated below-average projected price-to-earnings ratio. Based on its assessment of various company-specific factors, such as its business environment, management, balance sheet, income statement, cash flow, anticipated earnings, hidden or undervalued assets, dividends, and other related measures of value, Wellington Management seeks to identify what it considers to be overlooked or misunderstood companies with sound fundamentals. Wellington Management generally focuses on what it believes are securities of viable, growing businesses with good financial strength in industries that are temporarily out of favor and under-researched by institutions, but provide the potential for above-average total returns and sell at estimated below-average price-to-earnings multiples. Market timing is not employed, and limited consideration is given to macroeconomic analysis in establishing sector and industry weightings. Wellington Management may sell existing holdings as they approach their price targets.
Principal Risks
The following are the Principal Risks of the Fund. The value of your investment in the Fund could go down as well as up. You can lose money by investing in the Fund.
Cash Position Risk If the Fund holds a significant portion of its assets in cash or cash equivalents, its investment returns may be adversely affected and the Fund may not achieve its investment objective.
Convertible Securities Risk Convertible securities are subject to the risks of both debt instruments and equity securities. The price of a convertible security may change in response to changes in price of the underlying equity security, the credit quality of the issuer, and interest rates. In general, the values of convertible securities tend to decline as interest rates rise and to rise when interest rates fall. A convertible security generally has less potential for gain or loss than the underlying equity security.
Equity Securities Risk Although stocks may have the potential to outperform other asset classes over the
long term, their prices tend to fluctuate more dramatically over the shorter term. These movements may result from factors affecting individual companies, or from broader influences like changes in interest rates, market conditions, investor confidence, or announcements of economic, political, or financial information. While potentially offering greater opportunities for capital growth than larger, more established companies, the stocks of smaller companies may be particularly volatile, especially during periods of economic uncertainty. These companies may face less certain growth prospects, or depend heavily on a limited line of products and services or the efforts of a small number of key management personnel.
Foreign Investment Risk; Emerging Markets Risk; Currency Risk Investments in securities of non-U.S. issuers (including depositary receipts) entail risks not typically associated with investing in securities of U.S. issuers. Similar risks may apply to securities traded on a U.S. securities exchange that are issued by companies with significant exposure to non-U.S. countries. In certain countries, legal remedies available to investors may be more limited than those available with regard to U.S. investments. Because non-U.S. securities are normally denominated and traded in currencies other than the U.S. dollar, the value of the Fund’s assets may be affected favorably or unfavorably by currency exchange rates, exchange control regulations, and restrictions or prohibitions on the repatriation of non-U.S. currencies. Income and gains with respect to investments in certain countries may be subject to withholding and other taxes. There may be less information publicly available about a non-U.S. company than about a U.S. company, and many non-U.S. companies are not subject to accounting, auditing, and financial reporting standards, regulatory framework and practices comparable to those in the U.S. Foreign investments may be subject to the risks of seizure by a foreign government, imposition of restrictions on the exchange or export of foreign currency, other economic sanctions, and tax increases. The securities of some non-U.S. companies, especially those in emerging markets, are less liquid and at times more volatile than securities of comparable U.S. companies. Emerging markets securities are subject to greater risks than securities issued in developed foreign markets, including less liquidity, greater price volatility, higher relative rates of inflation, greater political, economic, and social instability, greater custody and operational risks, and greater volatility in currency exchange rates. Non-U.S. transaction costs,
– 45 –
such as brokerage commissions and custody costs may be higher than in the United States. In addition, there may be a possibility of nationalization or expropriation of assets, imposition of currency exchange controls, confiscatory taxation, political or financial instability, and diplomatic developments that could adversely affect the values of the Fund’s investments in certain non-U.S. countries.
Large Company Risk Large-capitalization stocks as a group could fall out of favor with the market, causing the Fund to underperform investments that focus on small- or medium-capitalization stocks. Larger, more established companies may be slow to respond to challenges and may grow more slowly than smaller companies.
Liquidity Risk Certain securities may be difficult (or impossible) to sell or positions difficult to close out at a desirable time and price, and the Fund may be required to hold an illiquid investment that is declining in value, or it may be required to sell certain illiquid investments at a price or time that is not advantageous in order to meet redemptions or other cash needs. Some securities may be subject to restrictions on resale. There can be no assurance that there will be a liquid market for instruments held by the Fund at any time.
Management Risk The Fund relies on the manager’s investment analysis and its selection of investments to achieve its investment objective. There can be no assurance that the Fund will achieve the intended results and the Fund may incur significant losses.
Market Risk The value of the Fund’s portfolio securities may decline, at times sharply and unpredictably, as a result of unfavorable market-induced changes affecting particular industries, sectors, or issuers. Stock markets can decline significantly in response to issuer, market, economic, industry, political, regulatory, geopolitical and other conditions, as well as investor perceptions of these conditions. The Fund is subject to risks affecting issuers, such as management performance, financial leverage, industry problems, and reduced demand for goods or services.
Preferred Stock Risk Like other equity securities, preferred stock is subject to the risk that its value may decrease based on actual or perceived changes in the business or financial condition of the issuer. In addition, changes in interest rates may adversely affect the value of a preferred stock that pays a fixed dividend.
Smaller and Mid-Cap Company Risk Market risk and liquidity risk are particularly pronounced for securities of smaller companies, which may trade less frequently and in smaller volumes than more widely-held securities, and may fluctuate in price more than other securities. Their shares can be less liquid than those of larger companies, especially during market declines. Smaller companies may have limited product lines, markets, or financial resources and may be dependent on a limited management group; they may have been recently organized and have little or no track record of success.
Valuation Risk The Fund is subject to the risk of mispricing or improper valuation of its investments, in particular to the extent that its securities are fair valued.
Value Company Risk The value investment approach entails the risk that the market will not recognize a security’s intrinsic value for a long time, or that a stock the investment adviser or subadviser judges to be undervalued may actually be appropriately priced.
Performance Information
The following bar chart and table provide some indication of the risks of investing in the Fund. The bar chart shows changes in the Fund’s performance from year to year for Class R5 shares. The table shows how the Fund’s average annual returns for 1, 5, and 10 years compare with those of a broad measure of market performance. Performance for Class I shares of the Fund for periods prior to its inception date (11/15/10) is based on the performance of Class R5 shares. Performance for Class R4 shares of the Fund for periods prior to its inception date (04/01/14) is based on the performance of Class R5 shares, adjusted for Class R4 expenses. Performance for Class A shares of the Fund reflects any applicable sales charge. Past performance (before and after taxes) is not necessarily an indication of how the Fund will perform in the future. More up-to-date performance information is available at http://www.massmutual.com/funds or by calling 1-888-309-3539.
Annual Performance
Class R5 Shares
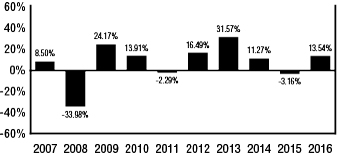
| Highest Quarter: | 2Q ’09, | 16.02% | Lowest Quarter: | 4Q ’08, | - | 19.40% |
– 46 –
After-tax returns are calculated using the historical highest individual federal marginal income tax rates and do not reflect the impact of state and local taxes. Actual after-tax returns depend on an investor’s tax situation and may differ from those shown. After-tax returns are not relevant to investors who hold Fund shares through tax-advantaged arrangements, such as
401(k) plans or individual retirement accounts. After-tax returns are shown for Class R5 only. After-tax returns for other classes will vary.
Average Annual Total Returns
(for the periods ended December 31, 2016)
| One Year | Five Years | Ten Years | ||||||||||||
| Class R5 | Return Before Taxes | 13.54% | 13.40% | 6.38% | ||||||||||
| Return After Taxes on Distributions | 11.12% | 11.10% | 4.95% | |||||||||||
| Return After Taxes on Distributions and Sales of Fund Shares | 9.69% | 10.56% | 5.00% | |||||||||||
| Class I | Return Before Taxes | 13.71% | 13.57% | 6.48% | ||||||||||
| Service Class | Return Before Taxes | 13.35% | 13.29% | 6.31% | ||||||||||
| Administrative Class | Return Before Taxes | 13.38% | 13.17% | 6.18% | ||||||||||
| Class A | Return Before Taxes | 6.50% | 11.55% | 5.28% | ||||||||||
| Class R4 | Return Before Taxes | 13.12% | 13.01% | 6.01% | ||||||||||
| Class R3 | Return Before Taxes | 12.86% | 12.65% | 5.64% | ||||||||||
| Russell 1000 Value Index (reflects no deduction for fees, expenses, or taxes) | 17.34% | 14.80% | 5.72% | |||||||||||
MANAGEMENT
Investment Adviser: MML Investment Advisers, LLC (“MML Advisers”)
Subadviser: Wellington Management Company LLP (“Wellington Management”)
Portfolio Manager: Karen H. Grimes, CFA is a Senior Managing Director and Equity Portfolio Manager at Wellington Management. She has managed the Fund since March 2008.
PURCHASE AND SALE OF FUND SHARES
Shares of the Fund are generally available to retirement plans, other institutional investors, and individual retirement accounts. Fund shares are redeemable on any business day by written request, telephone or internet (available to certain customers).
TAX INFORMATION
The Fund intends to make distributions that may be taxed as ordinary income, qualified dividend income, or capital gains, unless you are an investor eligible for preferential tax treatment.
PAYMENTS TO BROKER-DEALERS AND OTHER FINANCIAL INTERMEDIARIES
If you purchase the Fund through a broker-dealer or other financial intermediary, the intermediary may receive a one-time or continuing payments from the Fund, MML Advisers or its affiliates, or others for the sale of Fund shares or continuing shareholder services provided by the intermediary. These payments may create a conflict of interest by influencing the broker-dealer or other intermediary to recommend the Fund over another investment. You should contact your intermediary to obtain more information about the compensation it may receive in connection with your investment.
– 47 –
MassMutual Select Large Cap Value Fund
INVESTMENT OBJECTIVE
This Fund seeks both capital growth and income.
FEES AND EXPENSES OF THE FUND
This table describes the fees and expenses that you may pay if you buy and hold shares of the Fund. For Class A shares, you may qualify for sales charge discounts if you invest, or agree to invest in the future, at least $25,000 in MassMutual funds. More information about these and other discounts is available in the section titled Sales Charges by Class beginning on page 145 of the Fund’s Prospectus or from your financial professional.
Shareholder Fees (fees paid directly from your investment)
| Class I | Class R5 | Service Class | Administrative Class | Class A | Class R4 | Class R3 | ||||||||
Maximum Sales Charge (Load) Imposed on Purchases (as a % of offering price) | None | None | None | None | 5.75% | None | None | |||||||
Maximum Deferred Sales Charge (Load) (as a % of the lower of the original offering price or redemption proceeds) | None | None | None | None | None | None | None |
Annual Fund Operating Expenses (expenses that you pay each year as a percentage of the value of your investment)
| Class I | Class R5 | Service Class | Administrative Class | Class A | Class R4 | Class R3 | ||||||||
Management Fees | .60% | .60% | .60% | .60% | .60% | .60% | .60% | |||||||
Distribution and Service (Rule 12b-1) Fees | None | None | None | None | .25% | .25% | .50% | |||||||
Other Expenses | .10% | .20% | .30% | .40% | .40% | .30% | .30% | |||||||
Total Annual Fund Operating Expenses | .70% | .80% | .90% | 1.00% | 1.25% | 1.15% | 1.40% | |||||||
Expense Reimbursement | (.07%) | (.07%) | (.07%) | (.07%) | (.07%) | (.07%) | (.07%) | |||||||
Total Annual Fund Operating Expenses after Expense Reimbursement(1) | .63% | .73% | .83% | .93% | 1.18% | 1.08% | 1.33% |
| (1) | The expenses in the above table reflect a written agreement by MML Advisers to cap the fees and expenses of the Fund (other than extraordinary litigation and legal expenses, Acquired Fund fees and expenses, interest expense, short sale dividend and loan expense, or other non-recurring or unusual expenses such as organizational expenses and shareholder meeting expenses) through January 31, 2018, to the extent that Total Annual Fund Operating Expenses after Expense Reimbursement would otherwise exceed .63%, .73%, .83%, .93%, 1.18%, 1.08%, and 1.33% for Classes I, R5, Service, Administrative, A, R4, and R3, respectively. The Total Annual Fund Operating Expenses after Expense Reimbursement shown in the above table may exceed these amounts, because, as noted in the previous sentence, certain fees and expenses are excluded from the cap. The agreement can only be terminated by mutual consent of the Board of Trustees on behalf of the Fund and MML Advisers. |
Example
This example is intended to help you compare the cost of investing in the Fund with the cost of investing in other mutual funds. It assumes that you invest $10,000 in each share class of the Fund for the time periods indicated and then redeem all of your shares at the end of those periods. For Class A shares, the example includes the initial sales charge. The example also assumes that your investment earns a 5% return each year and that the Fund’s operating expenses are exactly as described in the preceding table. Although your actual costs may be higher or lower, based on these assumptions your costs would be:
| 1 Year | 3 Years | 5 Years | 10 Years | |||||||||||||
Class I | $ | 64 | $ | 217 | $ | 383 | $ | 864 | ||||||||
Class R5 | $ | 75 | $ | 248 | $ | 437 | $ | 983 | ||||||||
Service Class | $ | 85 | $ | 280 | $ | 492 | $ | 1,101 | ||||||||
Administrative Class | $ | 95 | $ | 311 | $ | 546 | $ | 1,218 | ||||||||
Class A | $ | 688 | $ | 942 | $ | 1,216 | $ | 1,994 | ||||||||
Class R4 | $ | 110 | $ | 358 | $ | 626 | $ | 1,391 | ||||||||
Class R3 | $ | 135 | $ | 436 | $ | 759 | $ | 1,674 | ||||||||
Portfolio Turnover
The Fund pays transaction costs, such as commissions, when it buys and sells securities (or “turns over” its portfolio). A higher portfolio turnover rate may indicate higher transaction costs and may result in higher taxes when Fund shares are held in a taxable account. These costs, which are not reflected in annual fund operating expenses or in the example, affect the Fund’s performance. During the most recent fiscal year, the Fund’s portfolio turnover rate was 8% of the average value of its portfolio.
– 48 –
INVESTMENTS, RISKS, AND PERFORMANCE
Principal Investment Strategies
The Fund invests primarily in large-capitalization companies that the Fund’s subadvisers believe are undervalued. The Fund is managed by two subadvisers, Barrow, Hanley, Mewhinney & Strauss, LLC (“Barrow Hanley”) and Huber Capital Management, LLC (“Huber Capital Management”), each being responsible for a portion of the portfolio, but not necessarily equally weighted. Under normal circumstances, the Fund invests at least 80% of its net assets (plus the amount of any borrowings for investment purposes) in the stocks of large-cap companies. The subadvisers currently define “large-cap” companies as those whose market capitalizations at the time of purchase are within the market capitalization range of companies included in the Russell 1000® Index (as of December 31, 2016, between $571 million and $618.04 billion). The Fund has the flexibility to invest in companies of any size and invest in non-equity securities. While most assets typically will be invested in equity securities of U.S. companies, the Fund may invest up to 20% of its total assets in foreign securities and American Depositary Receipts (“ADRs”), including emerging market securities. Equity securities may include common stocks, preferred stocks, securities convertible into common or preferred stock, rights, and warrants. The Fund may at times invest a substantial portion of its assets in obligations of issuers in one or more market, economic, or industry sectors. The Fund may hold a portion of its assets in cash or cash equivalents.
Barrow Hanley employs a value-based investment approach and may perform a number of analyses in considering whether to buy or sell a security for the Fund. In selecting investments for the Fund, Barrow Hanley typically seeks to exploit market inefficiencies by using proprietary research to identify large capitalization companies that it considers to be undervalued and to have the potential to generate superior returns while subjecting the Fund to below average levels of risk. Barrow Hanley typically invests in approximately 30-45 securities. Stocks purchased typically have a 25-year history of paying cash dividends. Barrow Hanley may consider selling a stock for the Fund if, in its judgment, the security has reached its valuation target, the company’s fundamentals begin to deteriorate, or other opportunities appear more attractive.
Huber Capital Management employs a value investing style, investing in stocks which, in Huber Capital Management’s opinion, trade at a significant discount to the present value of future cash flows.
Huber Capital Management attempts to identify out-of-favor stocks that represent solid fundamental value. Huber Capital Management identifies these investment opportunities by employing a disciplined, bottom-up investment process that emphasizes internally generated fundamental research. The process includes an initial review, in-depth analysis, and employment of Huber Capital Management’s proprietary valuation methodology.
Huber Capital Management’s decision to sell portfolio securities is based on valuation, risk, and portfolio guidelines. As individual stocks approach their intrinsic value or established target price and decline in their relative attractiveness, they become candidates for sale. Other sell decisions may occur because of deterioration in the fundamentals that supported the initial investment. Proceeds from sales are reinvested in companies that are more attractively valued based on the purchase disciplines.
Principal Risks
The following are the Principal Risks of the Fund. The value of your investment in the Fund could go down as well as up. You can lose money by investing in the Fund.
Cash Position Risk If the Fund holds a significant portion of its assets in cash or cash equivalents, its investment returns may be adversely affected and the Fund may not achieve its investment objective.
Convertible Securities Risk Convertible securities are subject to the risks of both debt instruments and equity securities. The price of a convertible security may change in response to changes in price of the underlying equity security, the credit quality of the issuer, and interest rates. In general, the values of convertible securities tend to decline as interest rates rise and to rise when interest rates fall. A convertible security generally has less potential for gain or loss than the underlying equity security.
Equity Securities Risk Although stocks may have the potential to outperform other asset classes over the long term, their prices tend to fluctuate more dramatically over the shorter term. These movements may result from factors affecting individual companies, or from broader influences like changes in interest rates, market conditions, investor confidence, or announcements of economic, political, or financial information. While potentially offering greater opportunities for capital growth than larger, more established companies, the stocks of smaller companies may be particularly volatile, especially
– 49 –
during periods of economic uncertainty. These companies may face less certain growth prospects, or depend heavily on a limited line of products and services or the efforts of a small number of key management personnel.
Foreign Investment Risk; Emerging Markets Risk; Currency Risk Investments in securities of non-U.S. issuers (including depositary receipts) entail risks not typically associated with investing in securities of U.S. issuers. Similar risks may apply to securities traded on a U.S. securities exchange that are issued by companies with significant exposure to non-U.S. countries. In certain countries, legal remedies available to investors may be more limited than those available with regard to U.S. investments. Because non-U.S. securities are normally denominated and traded in currencies other than the U.S. dollar, the value of the Fund’s assets may be affected favorably or unfavorably by currency exchange rates, exchange control regulations, and restrictions or prohibitions on the repatriation of non-U.S. currencies. Income and gains with respect to investments in certain countries may be subject to withholding and other taxes. There may be less information publicly available about a non-U.S. company than about a U.S. company, and many non-U.S. companies are not subject to accounting, auditing, and financial reporting standards, regulatory framework and practices comparable to those in the U.S. Foreign investments may be subject to the risks of seizure by a foreign government, imposition of restrictions on the exchange or export of foreign currency, other economic sanctions, and tax increases. The securities of some non-U.S. companies, especially those in emerging markets, are less liquid and at times more volatile than securities of comparable U.S. companies. Emerging markets securities are subject to greater risks than securities issued in developed foreign markets, including less liquidity, greater price volatility, higher relative rates of inflation, greater political, economic, and social instability, greater custody and operational risks, and greater volatility in currency exchange rates. Non-U.S. transaction costs, such as brokerage commissions and custody costs may be higher than in the United States. In addition, there may be a possibility of nationalization or expropriation of assets, imposition of currency exchange controls, confiscatory taxation, political or financial instability, and diplomatic developments that could adversely affect the values of the Fund’s investments in certain non-U.S. countries.
Large Company Risk Large-capitalization stocks as a group could fall out of favor with the market, causing the Fund to underperform investments that focus on small- or medium-capitalization stocks. Larger, more established companies may be slow to respond to challenges and may grow more slowly than smaller companies.
Liquidity Risk Certain securities may be difficult (or impossible) to sell or positions difficult to close out at a desirable time and price, and the Fund may be required to hold an illiquid investment that is declining in value, or it may be required to sell certain illiquid investments at a price or time that is not advantageous in order to meet redemptions or other cash needs. Some securities may be subject to restrictions on resale. There can be no assurance that there will be a liquid market for instruments held by the Fund at any time.
Management Risk The Fund relies on the manager’s investment analysis and its selection of investments to achieve its investment objective. There can be no assurance that the Fund will achieve the intended results and the Fund may incur significant losses.
Market Risk The value of the Fund’s portfolio securities may decline, at times sharply and unpredictably, as a result of unfavorable market-induced changes affecting particular industries, sectors, or issuers. Stock markets can decline significantly in response to issuer, market, economic, industry, political, regulatory, geopolitical and other conditions, as well as investor perceptions of these conditions. The Fund is subject to risks affecting issuers, such as management performance, financial leverage, industry problems, and reduced demand for goods or services.
Preferred Stock Risk Like other equity securities, preferred stock is subject to the risk that its value may decrease based on actual or perceived changes in the business or financial condition of the issuer. In addition, changes in interest rates may adversely affect the value of a preferred stock that pays a fixed dividend.
Sector Risk The Fund may allocate more of its assets to certain economic, market, or industry sectors than to others. This could increase the volatility of the Fund’s portfolio, and the Fund’s performance may be more susceptible to developments affecting issuers in those sectors than if the Fund invested more broadly.
Smaller and Mid-Cap Company Risk Market risk and liquidity risk are particularly pronounced for securities of smaller companies, which may trade less frequently and in smaller volumes than more widely-
– 50 –
held securities, and may fluctuate in price more than other securities. Their shares can be less liquid than those of larger companies, especially during market declines. Smaller companies may have limited product lines, markets, or financial resources and may be dependent on a limited management group; they may have been recently organized and have little or no track record of success.
Valuation Risk The Fund is subject to the risk of mispricing or improper valuation of its investments, in particular to the extent that its securities are fair valued.
Value Company Risk The value investment approach entails the risk that the market will not recognize a security’s intrinsic value for a long time, or that a stock the investment adviser or subadviser judges to be undervalued may actually be appropriately priced.
Performance Information
The following bar chart and table provide some indication of the risks of investing in the Fund. The bar chart shows changes in the Fund’s performance from year to year for Class R5 shares. The table shows how the Fund’s average annual returns for 1, 5, and 10 years compare with those of a broad measure of market performance. Performance for Class I and Class R4 shares of the Fund for periods prior to their inception date (04/01/14) is based on the performance of Class R5 shares, adjusted for Class R4 shares to reflect Class R4 expenses. Performance for Class A shares of the Fund reflects any applicable sales charge. Past performance (before and after taxes) is not necessarily an indication of how the Fund will perform in the future. More up-to-date performance information is available at http://www.massmutual.com/funds or by calling 1-888-309-3539.
Annual Performance
Class R5 Shares
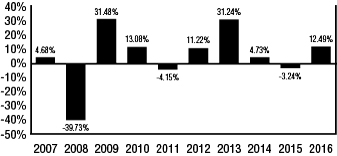
Highest Quarter: | 2Q ’09, | 21.10% | Lowest Quarter: | 4Q ’08, | - | 25.05% |
After-tax returns are calculated using the historical highest individual federal marginal income tax rates and do not reflect the impact of state and local taxes. Actual after-tax returns depend on an investor’s tax
situation and may differ from those shown. After-tax returns are not relevant to investors who hold Fund shares through tax-advantaged arrangements, such as 401(k) plans or individual retirement accounts. After-tax returns are shown for Class R5 only. After-tax returns for other classes will vary.
Average Annual Total Returns
(for the periods ended December 31, 2016)
| One Year | Five Years | Ten Years | ||||||||||||
| Class R5 | Return Before Taxes | 12.49% | 10.72% | 4.11% | ||||||||||
| Return After Taxes on Distributions | 10.59% | 6.93% | 2.10% | |||||||||||
| Return After Taxes on Distributions and Sales of Fund Shares | 8.66% | 8.16% | 3.10% | |||||||||||
| Class I | Return Before Taxes | 12.63% | 10.79% | 4.14% | ||||||||||
| Service Class | Return Before Taxes | 12.43% | 10.64% | 4.02% | ||||||||||
| Administrative Class | Return Before Taxes | 12.27% | 10.50% | 3.88% | ||||||||||
| Class A | Return Before Taxes | 5.56% | 8.94% | 3.00% | ||||||||||
| Class R4 | Return Before Taxes | 12.25% | 10.38% | 3.77% | ||||||||||
| Class R3 | Return Before Taxes | 11.86% | 10.02% | 3.37% | ||||||||||
| Russell 1000 Value Index (reflects no deduction for fees, expenses, or taxes) | 17.34% | 14.80% | 5.72% | |||||||||||
MANAGEMENT
Investment Adviser: MML Investment Advisers, LLC (“MML Advisers”)
Subadvisers: Barrow, Hanley, Mewhinney & Strauss, LLC (“Barrow Hanley”)
Huber Capital Management, LLC (“Huber Capital Management”)
Portfolio Managers:
Ray Nixon Jr. is an Executive Director and Portfolio Manager at Barrow Hanley. He has managed the Fund since August 2014.
Brian F. Quinn, CFA, is a Director and Portfolio Manager at Barrow Hanley. He has managed the Fund since August 2014.
Lewis Ropp is a Managing Director and Portfolio Manager at Barrow Hanley. He has managed the Fund since August 2014.
Joseph Huber is the Chief Executive Officer, the Chief Investment Officer, and a Portfolio Manager at Huber Capital Management. He has managed the Fund since September 2012.
– 51 –
PURCHASE AND SALE OF FUND SHARES
Shares of the Fund are generally available to retirement plans, other institutional investors, and individual retirement accounts. Fund shares are redeemable on any business day by written request, telephone or internet (available to certain customers).
TAX INFORMATION
The Fund intends to make distributions that may be taxed as ordinary income, qualified dividend income, or capital gains, unless you are an investor eligible for preferential tax treatment.
PAYMENTS TO BROKER-DEALERS AND OTHER FINANCIAL INTERMEDIARIES
If you purchase the Fund through a broker-dealer or other financial intermediary, the intermediary may receive a one-time or continuing payments from the Fund, MML Advisers or its affiliates, or others for the sale of Fund shares or continuing shareholder services provided by the intermediary. These payments may create a conflict of interest by influencing the broker-dealer or other intermediary to recommend the Fund over another investment. You should contact your intermediary to obtain more information about the compensation it may receive in connection with your investment.
– 52 –
[THIS PAGE INTENTIONALLY LEFT BLANK]
INVESTMENT OBJECTIVE
The Fund seeks to approximate as closely as practicable (before fees and expenses) the capitalization-weighted total rate of return of that portion of the U.S. market for publicly-traded common stocks composed of larger-capitalized companies.
FEES AND EXPENSES OF THE FUND
This table describes the fees and expenses that you may pay if you buy and hold shares of the Fund. For Class A shares, you may qualify for sales charge discounts if you invest, or agree to invest in the future, at least $25,000 in MassMutual funds. More information about these and other discounts is available in the section titled Sales Charges by Class beginning on page 145 of the Fund’s Prospectus or from your financial professional.
Shareholder Fees (fees paid directly from your investment)
| Class I | Class R5 | Service Class | Administrative Class | Class A | Class R4 | Class R3 | ||||||||
Maximum Sales Charge (Load) Imposed on Purchases (as a % of offering price) | None | None | None | None | 5.75% | None | None | |||||||
Maximum Deferred Sales Charge (Load) (as a % of the lower of the original offering price or redemption proceeds) | None | None | None | None | None | None | None |
Annual Fund Operating Expenses (expenses that you pay each year as a percentage of the value of your investment)
| Class I | Class R5 | Service Class | Administrative Class | Class A | Class R4 | Class R3 | ||||||||||
Management | .09% | .09% | .09% | .09% | .09% | .09% | .09% | |||||||||
Distribution and Service (Rule 12b-1) Fees | None | None | None | None | .25% | .25% | .50% | |||||||||
Other Expenses | .03% | .13% | .28% | .38% | .38% | .28% | .28% | |||||||||
Total Annual Fund Operating Expenses | .12% | .22% | .37% | .47% | .72% | .62% | .87% | |||||||||
Example
This example is intended to help you compare the cost of investing in the Fund with the cost of investing in other mutual funds. It assumes that you
invest $10,000 in each share class of the Fund for the time periods indicated and then redeem all of your shares at the end of those periods. For Class A shares, the example includes the initial sales charge. The example also assumes that your investment earns a 5% return each year and that the Fund’s operating expenses are exactly as described in the preceding table. Although your actual costs may be higher or lower, based on these assumptions your costs would be:
| 1 Year | 3 Years | 5 Years | 10 Years | |||||||||||||
Class I | $ | 12 | $ | 39 | $ | 68 | $ | 154 | ||||||||
Class R5 | $ | 23 | $ | 71 | $ | 124 | $ | 280 | ||||||||
Service Class | $ | 38 | $ | 119 | $ | 208 | $ | 468 | ||||||||
Administrative Class | $ | 48 | $ | 151 | $ | 263 | $ | 591 | ||||||||
Class A | $ | 644 | $ | 792 | $ | 953 | $ | 1,418 | ||||||||
Class R4 | $ | 63 | $ | 199 | $ | 346 | $ | 774 | ||||||||
Class R3 | $ | 89 | $ | 278 | $ | 482 | $ | 1,073 | ||||||||
Portfolio Turnover
The Fund pays transaction costs, such as commissions, when it buys and sells securities (or “turns over” its portfolio). A higher portfolio turnover rate may indicate higher transaction costs and may result in higher taxes when Fund shares are held in a taxable account. These costs, which are not reflected in annual fund operating expenses or in the example, affect the Fund’s performance. During the most recent fiscal year, the Fund’s portfolio turnover rate was 4% of the average value of its portfolio.
INVESTMENTS, RISKS, AND PERFORMANCE
Principal Investment Strategies
Under normal circumstances, the Fund invests at least 80% (and, typically, substantially all) of its net assets (plus the amount of any borrowings for investment purposes) in the equity securities of companies included within the S&P 500® Index* (“Index”). The Fund invests in the equity securities of companies included in the Index in weightings that approximate the relative composition of the securities
*The S&P 500 Index is a product of S&P Dow Jones Indices LLC (“SPDJI”), and has been licensed for use by MML Advisers. Standard & Poor’s®, S&P® and S&P 500® are registered trademarks of Standard & Poor’s Financial Services LLC (“S&P”); Dow Jones® is a registered trademark of Dow Jones Trademark Holdings LLC (“Dow Jones”); and these trademarks have been licensed for use by SPDJI and sublicensed for certain purposes by MML Advisers. The Fund is not sponsored, endorsed, sold or promoted by SPDJI, Dow Jones, S&P, their respective affiliates, and none of such parties make any representation regarding the advisability of investing in such product(s) nor do they have any liability for any errors, omissions, or interruptions of the S&P 500 Index.
– 54 –
contained in the Index, and in S&P 500 Index futures contracts. The Index is a widely recognized, unmanaged index representative of common stocks of larger capitalized U.S. companies. As of December 31, 2016, the market capitalization range of companies included in the Index was $2.82 billion to $618.04 billion. If the securities represented in the Index were to become concentrated in any particular industry, the Fund’s investments would likewise be concentrated in securities of issuers in that industry; the Index is not currently concentrated in any single industry.
The Fund is passively managed, which means it tries to duplicate the investment composition and performance of the Index by using computer programs and statistical procedures. The Fund’s subadviser, Northern Trust Investments, Inc. (“NTI”), will buy and sell securities in response to changes in the Index. The Fund may use Index futures contracts, a type of derivative, to gain exposure to the Index in lieu of investing in cash, or to reduce its exposure to the Index while it sells the securities in its portfolio. Use of Index futures contracts by the Fund may create investment leverage. Because the Fund, unlike the Index, is subject to fees and transaction expenses, the Fund’s returns are likely to be less than those of the Index. NTI expects that, under normal circumstances, the annual performance of the Fund, before fees and expenses, will track the performance of the Index within a 0.95 correlation coefficient.
Principal Risks
The following are the Principal Risks of the Fund. The value of your investment in the Fund could go down as well as up. You can lose money by investing in the Fund.
Cash Position Risk If the Fund holds a significant portion of its assets in cash or cash equivalents, its investment returns may be adversely affected and the Fund may not achieve its investment objective.
Derivatives Risk Derivatives can be highly volatile and involve risks different from, and potentially greater than, direct investments, including risks of imperfect correlation between the value of derivatives and underlying assets, counterparty default, potential losses that partially or completely offset gains, and illiquidity. Derivatives can create investment leverage. Losses from derivatives can be substantially greater than the derivatives’ original cost and can sometimes be unlimited. If the value of a derivative does not correlate well with the particular market or asset class the derivative is designed to provide exposure to, the derivative may not have the effect anticipated.
Derivatives can also reduce the opportunity for gains or result in losses by offsetting positive returns in other investments. Many derivatives are traded in the over-the-counter market and not on exchanges.
Equity Securities Risk Although stocks may have the potential to outperform other asset classes over the long term, their prices tend to fluctuate more dramatically over the shorter term. These movements may result from factors affecting individual companies, or from broader influences like changes in interest rates, market conditions, investor confidence, or announcements of economic, political, or financial information. While potentially offering greater opportunities for capital growth than larger, more established companies, the stocks of smaller companies may be particularly volatile, especially during periods of economic uncertainty. These companies may face less certain growth prospects, or depend heavily on a limited line of products and services or the efforts of a small number of key management personnel.
Indexing Risk The Fund’s performance may not track the performance of the index exactly due to a number of factors, including fees and expenses of the Fund, the Fund’s cash positions, and differences between securities held by the Fund and the securities comprising the index.
Industry Concentration Risk The Fund may concentrate its assets in a particular industry or group of industries. This could increase the volatility of the Fund’s portfolio, and the Fund’s performance may be more susceptible to developments affecting issuers in that industry or group of industries than if the Fund invested more broadly.
Large Company Risk Large-capitalization stocks as a group could fall out of favor with the market, causing the Fund to underperform investments that focus on small- or medium-capitalization stocks. Larger, more established companies may be slow to respond to challenges and may grow more slowly than smaller companies.
Management Risk The Fund relies on the manager’s investment analysis and its selection of investments to achieve its investment objective. There can be no assurance that the Fund will achieve the intended results and the Fund may incur significant losses.
Market Risk The value of the Fund’s portfolio securities may decline, at times sharply and unpredictably, as a result of unfavorable market-induced
– 55 –
changes affecting particular industries, sectors, or issuers. Stock markets can decline significantly in response to issuer, market, economic, industry, political, regulatory, geopolitical and other conditions, as well as investor perceptions of these conditions. The Fund is subject to risks affecting issuers, such as management performance, financial leverage, industry problems, and reduced demand for goods or services.
Valuation Risk The Fund is subject to the risk of mispricing or improper valuation of its investments, in particular to the extent that its securities are fair valued.
Performance Information
The following bar chart and table provide some indication of the risks of investing in the Fund. The bar chart shows changes in the Fund’s performance from year to year for Class R5 shares. The table shows how the Fund’s average annual returns for 1, 5, and 10 years compare with those of a broad measure of market performance. Performance for Class I shares of the Fund for periods prior to its inception date (12/07/11) is based on the performance of Service Class shares. Performance for Class A shares of the Fund for periods prior to its inception date (04/01/14) is based on the performance of Service Class shares, adjusted for Class A expenses. Performance for Class A shares of the Fund reflects any applicable sales charge. Past performance (before and after taxes) is not necessarily an indication of how the Fund will perform in the future. More up-to-date performance information is available at http://www.massmutual.com/funds or by calling 1-888-309-3539.
Annual Performance
Class R5 Shares
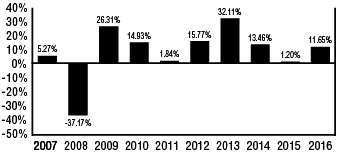
Highest Quarter: | 2Q ’09, | 15.79% | Lowest Quarter: | 4Q ‘08, | - | 22.02% |
After-tax returns are calculated using the historical highest individual federal marginal income tax rates and do not reflect the impact of state and local taxes. Actual after-tax returns depend on an investor’s tax situation and may differ from those shown. After-tax returns are not relevant to investors who hold Fund
shares through tax-advantaged arrangements, such as 401(k) plans or individual retirement accounts. After-tax returns are shown for Class R5 only. After-tax returns for other classes will vary.
Average Annual Total Returns
(for the periods ended December 31, 2016)
| One Year | Five Years | Ten Years | ||||||||||||
| Class R5 | Return Before Taxes | 11.65% | 14.42% | 6.73% | ||||||||||
| Return After Taxes on Distributions | 10.07% | 13.44% | 6.11% | |||||||||||
| Return After Taxes on Distributions and Sales of Fund Shares | 7.90% | 11.54% | 5.38% | |||||||||||
| Class I | Return Before Taxes | 11.80% | 14.57% | 6.68% | ||||||||||
| Service Class | Return Before Taxes | 11.56% | 14.22% | 6.52% | ||||||||||
| Administrative Class | Return Before Taxes | 11.37% | 14.15% | 6.46% | ||||||||||
| Class A | Return Before Taxes | 4.76% | 12.47% | 5.51% | ||||||||||
| Class R4 | Return Before Taxes | 11.26% | 13.94% | 6.27% | ||||||||||
| Class R3 | Return Before Taxes | 11.01% | 13.64% | 5.97% | ||||||||||
| S&P 500 Index (reflects no deduction for fees, expenses, or taxes) | 11.96% | 14.66% | 6.95% | |||||||||||
MANAGEMENT
Investment Adviser: MML Investment Advisers, LLC (“MML Advisers”)
Subadviser: Northern Trust Investments, Inc. (“NTI”)
Portfolio Manager: Brent Reeder is a Senior Vice President at NTI. He has managed the Fund since April 2007.
PURCHASE AND SALE OF FUND SHARES
Shares of the Fund are generally available to retirement plans, other institutional investors, and individual retirement accounts. Fund shares are redeemable on any business day by written request, telephone or internet (available to certain customers).
TAX INFORMATION
The Fund intends to make distributions that may be taxed as ordinary income, qualified dividend income, or capital gains, unless you are an investor eligible for preferential tax treatment.
– 56 –
PAYMENTS TO BROKER-DEALERS AND OTHER FINANCIAL INTERMEDIARIES
If you purchase the Fund through a broker-dealer or other financial intermediary, the intermediary may receive a one-time or continuing payments from the Fund, MML Advisers or its affiliates, or others for the sale of Fund shares or continuing shareholder
services provided by the intermediary. These payments may create a conflict of interest by influencing the broker-dealer or other intermediary to recommend the Fund over another investment. You should contact your intermediary to obtain more information about the compensation it may receive in connection with your investment.
– 57 –
MassMutual Select Focused Value Fund
INVESTMENT OBJECTIVE
This Fund seeks growth of capital over the long-term.
FEES AND EXPENSES OF THE FUND
This table describes the fees and expenses that you may pay if you buy and hold shares of the Fund. For Class A shares, you may qualify for sales charge discounts if you invest, or agree to invest in the future, at least $25,000 in MassMutual funds. More information about these and other discounts is available in the section titled Sales Charges by Class beginning on page 145 of the Fund’s Prospectus or from your financial professional.
Shareholder Fees (fees paid directly from your investment)
| Class I | Class R5 | Service Class | Administrative Class | Class A | Class R4 | Class R3 | ||||||||
Maximum Sales Charge (Load) Imposed on Purchases (as a % of offering price) | None | None | None | None | 5.75% | None | None | |||||||
Maximum Deferred Sales Charge (Load) (as a % of the lower of the original offering price or redemption proceeds) | None | None | None | None | None | None | None |
Annual Fund Operating Expenses (expenses that you pay each year as a percentage of the value of your investment)
| Class I | Class R5 | Service Class | Administrative Class | Class A | Class R4 | Class R3 | ||||||||
Management Fees | .69% | .69% | .69% | .69% | .69% | .69% | .69% | |||||||
Distribution and Service | None | None | None | None | .25% | .25% | .50% | |||||||
Other Expenses | .04% | .14% | .24% | .34% | .34% | .24% | .24% | |||||||
Total Annual Fund Operating Expenses | .73% | .83% | .93% | 1.03% | 1.28% | 1.18% | 1.43% |
Example
This example is intended to help you compare the cost of investing in the Fund with the cost of investing in other mutual funds. It assumes that you invest $10,000 in each share class of the Fund for the time periods indicated and then redeem all of your shares at the end of those periods. For Class A shares, the example
includes the initial sales charge. The example also assumes that your investment earns a 5% return each year and that the Fund’s operating expenses are exactly as described in the preceding table. Although your actual costs may be higher or lower, based on these assumptions your costs would be:
| 1 Year | 3 Years | 5 Years | 10 Years | |||||||||||||
Class I | $ | 75 | $ | 233 | $ | 406 | $ | 906 | ||||||||
Class R5 | $ | 85 | $ | 265 | $ | 460 | $ | 1,025 | ||||||||
Service Class | $ | 95 | $ | 296 | $ | 515 | $ | 1,143 | ||||||||
Administrative Class | $ | 105 | $ | 328 | $ | 569 | $ | 1,259 | ||||||||
Class A | $ | 698 | $ | 958 | $ | 1,237 | $ | 2,031 | ||||||||
Class R4 | $ | 120 | $ | 375 | $ | 649 | $ | 1,432 | ||||||||
Class R3 | $ | 146 | $ | 452 | $ | 782 | $ | 1,713 | ||||||||
Portfolio Turnover
The Fund pays transaction costs, such as commissions, when it buys and sells securities (or “turns over” its portfolio). A higher portfolio turnover rate may indicate higher transaction costs and may result in higher taxes when Fund shares are held in a taxable account. These costs, which are not reflected in annual fund operating expenses or in the example, affect the Fund’s performance. During the most recent fiscal year, the Fund’s portfolio turnover rate was 36% of the average value of its portfolio.
INVESTMENTS, RISKS, AND PERFORMANCE
Principal Investment Strategies
The Fund invests primarily in equity securities of U.S. companies that the Fund’s subadviser, Harris Associates L.P. (“Harris”), believes are undervalued. Equity securities may include common stocks, preferred stocks, securities convertible into common or preferred stocks, rights, and warrants, of issuers of any size. The Fund typically invests most of its assets in equity securities of U.S. companies, but may invest in foreign securities and American Depositary Receipts (“ADRs”), including emerging market securities. The Fund generally will not invest more than 25% of its total assets in foreign securities, and will not invest more than 5% of its total assets in emerging market securities. The Fund may hold a portion of its assets in cash or cash equivalents. The Fund is non-diversified, which means that it may hold larger positions in a smaller number of stocks than a diversified fund.
In selecting equity investments for the Fund, Harris uses a value investment philosophy. This investment
– 58 –
philosophy is based upon the belief that, over time, a company’s stock price converges with Harris’ estimate of its intrinsic or “true business value.” Harris seeks to identify companies that it believes have discounted stock prices compared to the companies’ “true business values.” By “true business value,” Harris means an estimate of the price a knowledgeable buyer would pay to acquire the entire business. Harris usually sells a stock when the price approaches its estimated worth. This means that Harris sets specific “buy” and “sell” targets for each stock held by the Fund. Harris also monitors each holding and adjusts those price targets as warranted to reflect changes in a company’s fundamentals.
Principal Risks
The following are the Principal Risks of the Fund. The value of your investment in the Fund could go down as well as up. You can lose money by investing in the Fund.
Cash Position Risk If the Fund holds a significant portion of its assets in cash or cash equivalents, its investment returns may be adversely affected and the Fund may not achieve its investment objective.
Convertible Securities Risk Convertible securities are subject to the risks of both debt instruments and equity securities. The price of a convertible security may change in response to changes in price of the underlying equity security, the credit quality of the issuer, and interest rates. In general, the values of convertible securities tend to decline as interest rates rise and to rise when interest rates fall. A convertible security generally has less potential for gain or loss than the underlying equity security.
Equity Securities Risk Although stocks may have the potential to outperform other asset classes over the long term, their prices tend to fluctuate more dramatically over the shorter term. These movements may result from factors affecting individual companies, or from broader influences like changes in interest rates, market conditions, investor confidence, or announcements of economic, political, or financial information. While potentially offering greater opportunities for capital growth than larger, more established companies, the stocks of smaller companies may be particularly volatile, especially during periods of economic uncertainty. These companies may face less certain growth prospects, or depend heavily on a limited line of products and services or the efforts of a small number of key management personnel.
Foreign Investment Risk; Emerging Markets Risk; Currency Risk Investments in securities of non-U.S. issuers (including depositary receipts) entail risks not typically associated with investing in securities of U.S. issuers. Similar risks may apply to securities traded on a U.S. securities exchange that are issued by companies with significant exposure to non-U.S. countries. In certain countries, legal remedies available to investors may be more limited than those available with regard to U.S. investments. Because non-U.S. securities are normally denominated and traded in currencies other than the U.S. dollar, the value of the Fund’s assets may be affected favorably or unfavorably by currency exchange rates, exchange control regulations, and restrictions or prohibitions on the repatriation of non-U.S. currencies. Income and gains with respect to investments in certain countries may be subject to withholding and other taxes. There may be less information publicly available about a non-U.S. company than about a U.S. company, and many non-U.S. companies are not subject to accounting, auditing, and financial reporting standards, regulatory framework and practices comparable to those in the U.S. Foreign investments may be subject to the risks of seizure by a foreign government, imposition of restrictions on the exchange or export of foreign currency, other economic sanctions, and tax increases. The securities of some non-U.S. companies, especially those in emerging markets, are less liquid and at times more volatile than securities of comparable U.S. companies. Emerging markets securities are subject to greater risks than securities issued in developed foreign markets, including less liquidity, greater price volatility, higher relative rates of inflation, greater political, economic, and social instability, greater custody and operational risks, and greater volatility in currency exchange rates. Non-U.S. transaction costs, such as brokerage commissions and custody costs may be higher than in the United States. In addition, there may be a possibility of nationalization or expropriation of assets, imposition of currency exchange controls, confiscatory taxation, political or financial instability, and diplomatic developments that could adversely affect the values of the Fund’s investments in certain non-U.S. countries.
Large Company Risk Large-capitalization stocks as a group could fall out of favor with the market, causing the Fund to underperform investments that focus on small- or medium-capitalization stocks. Larger, more established companies may be slow to respond to challenges and may grow more slowly than smaller companies.
– 59 –
Liquidity Risk Certain securities may be difficult (or impossible) to sell or positions difficult to close out at a desirable time and price, and the Fund may be required to hold an illiquid investment that is declining in value, or it may be required to sell certain illiquid investments at a price or time that is not advantageous in order to meet redemptions or other cash needs. Some securities may be subject to restrictions on resale. There can be no assurance that there will be a liquid market for instruments held by the Fund at any time.
Management Risk The Fund relies on the manager’s investment analysis and its selection of investments to achieve its investment objective. There can be no assurance that the Fund will achieve the intended results and the Fund may incur significant losses.
Market Risk The value of the Fund’s portfolio securities may decline, at times sharply and unpredictably, as a result of unfavorable market-induced changes affecting particular industries, sectors, or issuers. Stock markets can decline significantly in response to issuer, market, economic, industry, political, regulatory, geopolitical and other conditions, as well as investor perceptions of these conditions. The Fund is subject to risks affecting issuers, such as management performance, financial leverage, industry problems, and reduced demand for goods or services.
Non-Diversification Risk Because the Fund may invest a relatively large percentage of its assets in a single issuer or small number of issuers than a diversified fund, the Fund’s performance could be closely tied to the value of one issuer or a small number of issuers and could be more volatile than the performance of a diversified fund.
Preferred Stock Risk Like other equity securities, preferred stock is subject to the risk that its value may decrease based on actual or perceived changes in the business or financial condition of the issuer. In addition, changes in interest rates may adversely affect the value of a preferred stock that pays a fixed dividend.
Smaller and Mid-Cap Company Risk Market risk and liquidity risk are particularly pronounced for securities of smaller companies, which may trade less frequently and in smaller volumes than more widely-held securities, and may fluctuate in price more than other securities. Their shares can be less liquid than those of larger companies, especially during market declines. Smaller companies may have limited product lines, markets, or financial resources and
may be dependent on a limited management group; they may have been recently organized and have little or no track record of success.
Valuation Risk The Fund is subject to the risk of mispricing or improper valuation of its investments, in particular to the extent that its securities are fair valued.
Value Company Risk The value investment approach entails the risk that the market will not recognize a security’s intrinsic value for a long time, or that a stock the investment adviser or subadviser judges to be undervalued may actually be appropriately priced.
Performance Information
The following bar chart and table provide some indication of the risks of investing in the Fund. The bar chart shows changes in the Fund’s performance from year to year for Class R5 shares. The table shows how the Fund’s average annual returns for 1, 5, and 10 years compare with those of a broad measure of market performance. Performance for Class I shares of the Fund for periods prior to its inception date (11/15/10) is based on the performance of Class R5 shares. Performance for Class R4 shares of the Fund for periods prior to its inception date (04/01/14) is based on the performance of Class R5 shares, adjusted for Class R4 expenses. Performance for Class A shares of the Fund reflects any applicable sales charge. Past performance (before and after taxes) is not necessarily an indication of how the Fund will perform in the future. More up-to-date performance information is available at http://www.massmutual.com/funds or by calling 1-888-309-3539.
Annual Performance
Class R5 Shares
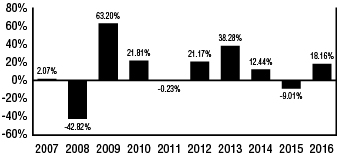
| Highest Quarter: | 3Q ’09, | 27.48% | Lowest Quarter: | 4Q ’08, | –26.95% |
After-tax returns are calculated using the historical highest individual federal marginal income tax rates and do not reflect the impact of state and local taxes. Actual after-tax returns depend on an investor’s tax situation and may differ from those shown. After-tax returns are not relevant to investors who hold Fund shares through tax-advantaged arrangements, such as
– 60 –
401(k) plans or individual retirement accounts. After-tax returns are shown for Class R5 only. After-tax returns for other classes will vary.
Average Annual Total Returns
(for the periods ended December 31, 2016)
One Year | Five Years | Ten Years | ||||||||||||
| Class R5 | Return Before Taxes | 18.16% | 15.16% | 8.90% | ||||||||||
| Return After Taxes on Distributions | 17.33% | 12.32% | 7.10% | |||||||||||
| Return After Taxes on Distributions and Sales of Fund Shares | 10.98% | 11.86% | 6.97% | |||||||||||
| Class I | Return Before Taxes | 18.26% | 15.27% | 8.96% | ||||||||||
| Service Class | Return Before Taxes | 17.98% | 15.04% | 8.78% | ||||||||||
| Administrative Class | Return Before Taxes | 17.92% | 14.90% | 8.64% | ||||||||||
| Class A | Return Before Taxes | 10.83% | 13.27% | 7.72% | ||||||||||
| Class R4 | Return Before Taxes | 17.71% | 14.77% | 8.52% | ||||||||||
| Class R3 | Return Before Taxes | 17.47% | 14.36% | 8.08% | ||||||||||
| Russell 1000 Index (reflects no deduction for fees, expenses, or taxes) | 12.05% | 14.69% | 7.08% | |||||||||||
MANAGEMENT
Investment Adviser: MML Investment Advisers, LLC (“MML Advisers”)
Subadviser: Harris Associates L.P. (“Harris”)
Portfolio Managers:
Anthony P. Coniaris, CFA is the Co-Chairman, a Portfolio Manager, and a U.S. Investment Analyst at Harris. He has managed the Fund since April 2015.
M. Colin Hudson, CFA is a Vice President, Portfolio Manager and U.S. Investment Analyst at Harris. He has managed the Fund since April 2015.
Robert F. Bierig is a Portfolio Manager and U.S. Investment Analyst at Harris. He has managed the Fund since April 2015.
PURCHASE AND SALE OF FUND SHARES
Shares of the Fund are generally available to retirement plans, other institutional investors, and individual retirement accounts. Fund shares are redeemable on any business day by written request, telephone or internet (available to certain customers).
TAX INFORMATION
The Fund intends to make distributions that may be taxed as ordinary income, qualified dividend income, or capital gains, unless you are an investor eligible for preferential tax treatment.
PAYMENTS TO BROKER-DEALERS AND OTHER FINANCIAL INTERMEDIARIES
If you purchase the Fund through a broker-dealer or other financial intermediary, the intermediary may receive a one-time or continuing payments from the Fund, MML Advisers or its affiliates, or others for the sale of Fund shares or continuing shareholder services provided by the intermediary. These payments may create a conflict of interest by influencing the broker-dealer or other intermediary to recommend the Fund over another investment. You should contact your intermediary to obtain more information about the compensation it may receive in connection with your investment.
– 61 –
MassMutual Select Fundamental Growth Fund
INVESTMENT OBJECTIVE
The Fund seeks long-term growth of capital.
FEES AND EXPENSES OF THE FUND
This table describes the fees and expenses that you may pay if you buy and hold shares of the Fund. For Class A shares, you may qualify for sales charge discounts if you invest, or agree to invest in the future, at least $25,000 in MassMutual funds. More information about these and other discounts is available in the section titled Sales Charges by Class beginning on page 145 of the Fund’s Prospectus or from your financial professional.
Shareholder Fees (fees paid directly from your investment)
| Class I | Class R5 | Service Class | Administrative Class | Class A | Class R4 | Class R3 | ||||||||
Maximum Sales Charge | None | None | None | None | 5.75% | None | None | |||||||
Maximum Deferred Sales Charge | None | None | None | None | None | None | None |
Annual Fund Operating Expenses (expenses that you pay each year as a percentage of the value of your investment)
| Class I | Class R5 | Service Class | Administrative Class | Class A | Class R4 | Class R3 | ||||||||||
Management Fees | .65% | .65% | .65% | .65% | .65% | .65% | .65% | |||||||||
Distribution and Service (Rule 12b-1) Fees | None | None | None | None | .25% | .25% | .50% | |||||||||
Other Expenses | .17% | .27% | .37% | .47% | .47% | .37% | .37% | |||||||||
Total Annual Fund Operating Expenses | .82% | .92% | 1.02% | 1.12% | 1.37% | 1.27% | 1.52% | |||||||||
Expense Reimbursement | (.12%) | (.12%) | (.12%) | (.12%) | (.12%) | (.12%) | (.12%) | |||||||||
Total Annual Fund Operating Expenses after Expense | .70% | .80% | .90% | 1.00% | 1.25% | 1.15% | 1.40% | |||||||||
| (1) | The expenses in the above table reflect a written agreement by MML Advisers to cap the fees and expenses of the Fund (other than extraordinary litigation and legal expenses, Acquired Fund fees and expenses, interest expense, short sale dividend |
| and loan expense, or other non-recurring or unusual expenses such as organizational expenses and shareholder meeting expenses) through January 31, 2018, to the extent that Total Annual Fund Operating Expenses after Expense Reimbursement would otherwise exceed .70%, .80%, .90%, 1.00%, 1.25%, 1.15%, and 1.40% for Classes I, R5, Service, Administrative, A, R4, and R3, respectively. The Total Annual Fund Operating Expenses after Expense Reimbursement shown in the above table may exceed these amounts, because, as noted in the previous sentence, certain fees and expenses are excluded from the cap. The agreement can only be terminated by mutual consent of the Board of Trustees on behalf of the Fund and MML Advisers. |
Example
This example is intended to help you compare the cost of investing in the Fund with the cost of investing in other mutual funds. It assumes that you invest $10,000 in each share class of the Fund for the time periods indicated and then redeem all of your shares at the end of those periods. For Class A shares, the example includes the initial sales charge. The example also assumes that your investment earns a 5% return each year and that the Fund’s operating expenses are exactly as described in the preceding table. Although your actual costs may be higher or lower, based on these assumptions your costs would be:
| 1 Year | 3 Years | 5 Years | 10 Years | |||||||||||||
Class I | $ | 72 | $ | 250 | $ | 443 | $ | 1,002 | ||||||||
Class R5 | $ | 82 | $ | 281 | $ | 498 | $ | 1,120 | ||||||||
Service Class | $ | 92 | $ | 313 | $ | 552 | $ | 1,237 | ||||||||
Administrative Class | $ | 102 | $ | 344 | $ | 605 | $ | 1,352 | ||||||||
Class A | $ | 695 | $ | 973 | $ | 1,271 | $ | 2,117 | ||||||||
Class R4 | $ | 117 | $ | 391 | $ | 685 | $ | 1,523 | ||||||||
Class R3 | $ | 143 | $ | 469 | $ | 818 | $ | 1,802 | ||||||||
Portfolio Turnover
The Fund pays transaction costs, such as commissions, when it buys and sells securities (or “turns over” its portfolio). A higher portfolio turnover rate may indicate higher transaction costs and may result in higher taxes when Fund shares are held in a taxable account. These costs, which are not reflected in annual fund operating expenses or in the example, affect the Fund’s performance. During the most recent fiscal year, the Fund’s portfolio turnover rate was 49% of the average value of its portfolio.
INVESTMENTS, RISKS, AND PERFORMANCE
Principal Investment Strategies
The Fund invests primarily in domestic equity securities that the Fund’s subadviser, Wellington Management Company LLP (“Wellington Management”), believes
– 62 –
offer the potential for long-term growth. Equity securities may include common stocks, preferred stocks, securities convertible into common or preferred stock, rights, and warrants, of issuers of any size. While most assets will be invested in equity securities of U.S. companies, the Fund may also invest up to 20% of its total assets in foreign securities and American Depositary Receipts (“ADRs”), including emerging market securities. The Fund may hold a portion of its assets in cash or cash equivalents.
Wellington Management generally employs a bottom-up stock selection process that utilizes fundamental analysis to identify specific securities within industries or sectors for purchase or sale. Wellington Management seeks to identify diversified sources of return based on its assessment of individual companies against the context of broader market factors by evaluating and ranking each stock on a consistent set of growth, quality, and valuation criteria.
In pursuing its investment objective, Wellington Management has the discretion to purchase some securities that do not meet its normal investment criteria, as described above, when it believes there is an opportunity for substantial appreciation (such as, for example, Wellington Management believes a security could increase in value as a result of a change in management, an extraordinary corporate event such as a merger, acquisition, or divestiture, a new product introduction or innovation, or a favorable competitive development). The Fund may sell securities for a variety of reasons, such as to secure gains, limit losses, or redeploy assets into more promising opportunities.
Principal Risks
The following are the Principal Risks of the Fund. The value of your investment in the Fund could go down as well as up. You can lose money by investing in the Fund.
Cash Position Risk If the Fund holds a significant portion of its assets in cash or cash equivalents, its investment returns may be adversely affected and the Fund may not achieve its investment objective.
Convertible Securities Risk Convertible securities are subject to the risks of both debt instruments and equity securities. The price of a convertible security may change in response to changes in price of the underlying equity security, the credit quality of the issuer, and interest rates. In general, the values of convertible securities tend to decline as interest rates rise and to rise when interest rates fall. A convertible
security generally has less potential for gain or loss than the underlying equity security.
Equity Securities Risk Although stocks may have the potential to outperform other asset classes over the long term, their prices tend to fluctuate more dramatically over the shorter term. These movements may result from factors affecting individual companies, or from broader influences like changes in interest rates, market conditions, investor confidence, or announcements of economic, political, or financial information. While potentially offering greater opportunities for capital growth than larger, more established companies, the stocks of smaller companies may be particularly volatile, especially during periods of economic uncertainty. These companies may face less certain growth prospects, or depend heavily on a limited line of products and services or the efforts of a small number of key management personnel.
Foreign Investment Risk; Emerging Markets Risk; Currency Risk Investments in securities of non-U.S. issuers (including depositary receipts) entail risks not typically associated with investing in securities of U.S. issuers. Similar risks may apply to securities traded on a U.S. securities exchange that are issued by companies with significant exposure to non-U.S. countries. In certain countries, legal remedies available to investors may be more limited than those available with regard to U.S. investments. Because non-U.S. securities are normally denominated and traded in currencies other than the U.S. dollar, the value of the Fund’s assets may be affected favorably or unfavorably by currency exchange rates, exchange control regulations, and restrictions or prohibitions on the repatriation of non-U.S. currencies. Income and gains with respect to investments in certain countries may be subject to withholding and other taxes. There may be less information publicly available about a non-U.S. company than about a U.S. company, and many non-U.S. companies are not subject to accounting, auditing, and financial reporting standards, regulatory framework and practices comparable to those in the U.S. Foreign investments may be subject to the risks of seizure by a foreign government, imposition of restrictions on the exchange or export of foreign currency, other economic sanctions, and tax increases. The securities of some non-U.S. companies, especially those in emerging markets, are less liquid and at times more volatile than securities of comparable U.S. companies. Emerging markets securities are subject to greater risks than securities issued in developed foreign markets, including less
– 63 –
liquidity, greater price volatility, higher relative rates of inflation, greater political, economic, and social instability, greater custody and operational risks, and greater volatility in currency exchange rates. Non-U.S. transaction costs, such as brokerage commissions and custody costs may be higher than in the United States. In addition, there may be a possibility of nationalization or expropriation of assets, imposition of currency exchange controls, confiscatory taxation, political or financial instability, and diplomatic developments that could adversely affect the values of the Fund’s investments in certain non-U.S. countries.
Growth Company Risk The prices of growth securities are often highly sensitive to market fluctuations because of their heavy dependence on future earnings expectations, and can be more volatile than the market in general.
Large Company Risk Large-capitalization stocks as a group could fall out of favor with the market, causing the Fund to underperform investments that focus on small- or medium-capitalization stocks. Larger, more established companies may be slow to respond to challenges and may grow more slowly than smaller companies.
Liquidity Risk Certain securities may be difficult (or impossible) to sell or positions difficult to close out at a desirable time and price, and the Fund may be required to hold an illiquid investment that is declining in value, or it may be required to sell certain illiquid investments at a price or time that is not advantageous in order to meet redemptions or other cash needs. Some securities may be subject to restrictions on resale. There can be no assurance that there will be a liquid market for instruments held by the Fund at any time.
Management Risk The Fund relies on the manager’s investment analysis and its selection of investments to achieve its investment objective. There can be no assurance that the Fund will achieve the intended results and the Fund may incur significant losses.
Market Risk The value of the Fund’s portfolio securities may decline, at times sharply and unpredictably, as a result of unfavorable market-induced changes affecting particular industries, sectors, or issuers. Stock markets can decline significantly in response to issuer, market, economic, industry, political, regulatory, geopolitical and other conditions, as well as investor perceptions of these conditions. The Fund is subject to risks affecting issuers, such as management performance, financial
leverage, industry problems, and reduced demand for goods or services.
Preferred Stock Risk Like other equity securities, preferred stock is subject to the risk that its value may decrease based on actual or perceived changes in the business or financial condition of the issuer. In addition, changes in interest rates may adversely affect the value of a preferred stock that pays a fixed dividend.
Smaller and Mid-Cap Company Risk Market risk and liquidity risk are particularly pronounced for securities of smaller companies, which may trade less frequently and in smaller volumes than more widely-held securities, and may fluctuate in price more than other securities. Their shares can be less liquid than those of larger companies, especially during market declines. Smaller companies may have limited product lines, markets, or financial resources and may be dependent on a limited management group; they may have been recently organized and have little or no track record of success.
Valuation Risk The Fund is subject to the risk of mispricing or improper valuation of its investments, in particular to the extent that its securities are fair valued.
Performance Information
The following bar chart and table provide some indication of the risks of investing in the Fund. The bar chart shows changes in the Fund’s performance from year to year for Class R5 shares. The table shows how the Fund’s average annual returns for 1, 5, and 10 years compare with those of a broad measure of market performance. Performance for Class I and Class R4 shares of the Fund for periods prior to their inception date (04/01/14) is based on the performance of Class R5 shares, adjusted for Class R4 shares to reflect Class R4 expenses. Performance for Class A shares of the Fund reflects any applicable sales charge. The Fund’s name, investment objective, and investment strategy changed on February 22, 2012 to permit the Fund to become “actively” managed. Because the Fund was previously “passively” managed, the performance results shown would likely be different had the Fund’s current investment objective and investment strategy been in effect for the entire period for which performance results are presented. Past performance (before and after taxes) is not necessarily an indication of how the Fund will perform in the future. More up-to-date performance information is
– 64 –
available at http://www.massmutual.com/funds or by calling 1-888-309-3539.
Annual Performance
Class R5 Shares
| Highest Quarter: | 2Q ’09, | 19.30% | Lowest Quarter: | 4Q ’08, | - | 24.08% |
After-tax returns are calculated using the historical highest individual federal marginal income tax rates and do not reflect the impact of state and local taxes. Actual after-tax returns depend on an investor’s tax situation and may differ from those shown. After-tax returns are not relevant to investors who hold Fund shares through tax-advantaged arrangements, such as
401(k) plans or individual retirement accounts. After-tax returns are shown for Class R5 only. After-tax returns for other classes will vary.
Average Annual Total Returns
(for the periods ended December 31, 2016)
| One Year | Five Years | Ten Years | ||||||||||||
| Class R5 | Return Before Taxes | 3.81% | 12.94% | 9.17% | ||||||||||
| Return After Taxes on Distributions | 0.72% | 10.74% | 8.09% | |||||||||||
| Return After Taxes on Distributions and Sales of Fund Shares | 4.76% | 10.25% | 7.48% | |||||||||||
| Class I | Return Before Taxes | 3.79% | 12.99% | 9.19% | ||||||||||
| Service Class | Return Before Taxes | 3.63% | 12.82% | 9.06% | ||||||||||
| Administrative Class | Return Before Taxes | 3.60% | 12.68% | 8.91% | ||||||||||
| Class A | Return Before Taxes | -2.78% | 11.07% | 7.97% | ||||||||||
| Class R4 | Return Before Taxes | 3.30% | 12.52% | 8.77% | ||||||||||
| Class R3 | Return Before Taxes | 3.21% | 12.13% | 8.33% | ||||||||||
| Russell 1000 Growth Index (reflects no deduction for fees, expenses, or taxes) | 7.08% | 14.50% | 8.33% | |||||||||||
MANAGEMENT
Investment Adviser: MML Investment Advisers, LLC (“MML Advisers”)
Subadviser: Wellington Management Company LLP (“Wellington Management”)
Portfolio Manager: Paul E. Marrkand, CFA is a Senior Managing Director and Equity Portfolio Manager at Wellington Management. He has managed the Fund since February 2012.
PURCHASE AND SALE OF FUND SHARES
Shares of the Fund are generally available to retirement plans, other institutional investors, and individual retirement accounts. Fund shares are redeemable on any business day by written request, telephone or internet (available to certain customers).
TAX INFORMATION
The Fund intends to make distributions that may be taxed as ordinary income, qualified dividend income, or capital gains, unless you are an investor eligible for preferential tax treatment.
PAYMENTS TO BROKER-DEALERS AND OTHER FINANCIAL INTERMEDIARIES
If you purchase the Fund through a broker-dealer or other financial intermediary, the intermediary may receive a one-time or continuing payments from the Fund, MML Advisers or its affiliates, or others for the sale of Fund shares or continuing shareholder services provided by the intermediary. These payments may create a conflict of interest by influencing the broker-dealer or other intermediary to recommend the Fund over another investment. You should contact your intermediary to obtain more information about the compensation it may receive in connection with your investment.
– 65 –
MassMutual Select Blue Chip Growth Fund
INVESTMENT OBJECTIVE
This Fund seeks growth of capital over the long term.
FEES AND EXPENSES OF THE FUND
This table describes the fees and expenses that you may pay if you buy and hold shares of the Fund. For Class A shares, you may qualify for sales charge discounts if you invest, or agree to invest in the future, at least $25,000 in MassMutual funds. More information about these and other discounts is available in the section titled Sales Charges by Class beginning on page 145 of the Fund’s Prospectus or from your financial professional.
Shareholder Fees (fees paid directly from your investment)
| Class I | Class R5 | Service Class | Administrative Class | Class A | Class R4 | Class R3 | ||||||||
Maximum Sales Charge (Load) Imposed on Purchases (as a % of offering price) | None | None | None | None | 5.75% | None | None | |||||||
Maximum Deferred Sales Charge (Load) (as a % of the lower of the original offering price or redemption proceeds) | None | None | None | None | None | None | None |
Annual Fund Operating Expenses (expenses that you pay each year as a percentage of the value of your investment)
| Class I | Class R5 | Service Class | Administrative Class | Class A | Class R4 | Class R3 | ||||||||||
Management Fees | .62% | .62% | .62% | .62% | .62% | .62% | .62% | |||||||||
Distribution and Service (Rule 12b-1) Fees | None | None | None | None | .25% | .25% | .50% | |||||||||
Other Expenses | .04% | .14% | .24% | .34% | .34% | .24% | .24% | |||||||||
Total Annual Fund Operating Expenses | .66% | .76% | .86% | .96% | 1.21% | 1.11% | 1.36% | |||||||||
Example
This example is intended to help you compare the cost of investing in the Fund with the cost of investing in other mutual funds. It assumes that you invest $10,000 in each share class of the Fund for the time periods indicated and then redeem all of your shares at the end of those periods. For Class A shares,
the example includes the initial sales charge. The example also assumes that your investment earns a 5% return each year and that the Fund’s operating expenses are exactly as described in the preceding table. Although your actual costs may be higher or lower, based on these assumptions your costs would be:
| 1 Year | 3 Years | 5 Years | 10 Years | |||||||||||||
Class I | $ | 67 | $ | 211 | $ | 368 | $ | 822 | ||||||||
Class R5 | $ | 78 | $ | 243 | $ | 422 | $ | 942 | ||||||||
Service Class | $ | 88 | $ | 274 | $ | 477 | $ | 1,061 | ||||||||
Administrative Class | $ | 98 | $ | 306 | $ | 531 | $ | 1,178 | ||||||||
Class A | $ | 691 | $ | 937 | $ | 1,202 | $ | 1,957 | ||||||||
Class R4 | $ | 113 | $ | 353 | $ | 612 | $ | 1,352 | ||||||||
Class R3 | $ | 138 | $ | 431 | $ | 745 | $ | 1,635 | ||||||||
Portfolio Turnover
The Fund pays transaction costs, such as commissions, when it buys and sells securities (or “turns over” its portfolio). A higher portfolio turnover rate may indicate higher transaction costs and may result in higher taxes when Fund shares are held in a taxable account. These costs, which are not reflected in annual fund operating expenses or in the example, affect the Fund’s performance. During the most recent fiscal year, the Fund’s portfolio turnover rate was 30% of the average value of its portfolio.
INVESTMENTS, RISKS, AND PERFORMANCE
Principal Investment Strategies
Under normal circumstances, the Fund invests at least 80% of net assets (plus the amount of any borrowings for investment purposes) in the common stocks of large- and medium-sized blue chip growth companies. The Fund is managed by two subadvisers, each being responsible for a portion of the portfolio, but not necessarily equally weighted. The Fund’s subadvisers, T. Rowe Price Associates, Inc. (“T. Rowe Price”) and Loomis, Sayles & Company, L.P. (“Loomis Sayles”), currently define blue chip growth companies to mean firms that, in their view, are well-established in their industries and have the potential for above-average earnings growth. Equity securities may include common stocks, preferred stocks, securities convertible into common or preferred stock, rights, and warrants. While most assets will be invested in equity securities of U.S. companies, the Fund may also invest up to 20% of its total assets in foreign securities and American Depositary Receipts
– 66 –
(“ADRs”), including emerging market securities. The Fund may hold a portion of its assets in cash or cash equivalents.
In selecting securities, T. Rowe Price generally seeks to identify companies with a leading market position, seasoned management, and strong financial fundamentals. T. Rowe Price believes that solid company fundamentals (with an emphasis on strong growth in earnings per share or operating cash flow) combined with a positive industry outlook may potentially reward investors with strong investment performance. It is anticipated that some of the companies targeted will have good prospects for dividend growth and T. Rowe Price may at times invest significantly in stocks of technology companies. T. Rowe Price may sell securities for a variety of reasons, such as to secure gains, limit losses, or redeploy assets into more promising opportunities.
In selecting securities, Loomis Sayles emphasizes companies with sustainable competitive advantages, long-term structural growth drivers, attractive cash flow returns on invested capital, and management teams focused on creating long-term value for shareholders. Loomis Sayles aims to invest in companies when they trade at a significant discount to Loomis Sayles’ estimate of intrinsic value. Loomis Sayles will consider selling a portfolio investment when (i) it believes an unfavorable structural change occurs within a given business or the markets in which it operates, (ii) a critical underlying investment assumption is flawed, (iii) a more attractive reward-to-risk opportunity becomes available, (iv) the current price fully reflects intrinsic value, or (v) for other investment reasons which it deems appropriate.
In pursuing its investment objective, each of T. Rowe Price and Loomis Sayles has the discretion to purchase some securities that do not meet its normal investment criteria, as described above, when it believes there is an opportunity for substantial appreciation (such as, for example, T. Rowe Price or Loomis Sayles believes a security could increase in value as a result of a change in management, an extraordinary corporate event, a new product introduction or innovation, or a favorable competitive development).
Principal Risks
The following are the Principal Risks of the Fund. The value of your investment in the Fund could go down as well as up. You can lose money by investing in the Fund.
Cash Position Risk If the Fund holds a significant portion of its assets in cash or cash equivalents, its investment returns may be adversely affected and the Fund may not achieve its investment objective.
Convertible Securities Risk Convertible securities are subject to the risks of both debt instruments and equity securities. The price of a convertible security may change in response to changes in price of the underlying equity security, the credit quality of the issuer, and interest rates. In general, the values of convertible securities tend to decline as interest rates rise and to rise when interest rates fall. A convertible security generally has less potential for gain or loss than the underlying equity security.
Equity Securities Risk Although stocks may have the potential to outperform other asset classes over the long term, their prices tend to fluctuate more dramatically over the shorter term. These movements may result from factors affecting individual companies, or from broader influences like changes in interest rates, market conditions, investor confidence, or announcements of economic, political, or financial information. While potentially offering greater opportunities for capital growth than larger, more established companies, the stocks of smaller companies may be particularly volatile, especially during periods of economic uncertainty. These companies may face less certain growth prospects, or depend heavily on a limited line of products and services or the efforts of a small number of key management personnel.
Foreign Investment Risk; Emerging Markets Risk; Currency Risk Investments in securities of non-U.S. issuers (including depositary receipts) entail risks not typically associated with investing in securities of U.S. issuers. Similar risks may apply to securities traded on a U.S. securities exchange that are issued by companies with significant exposure to non-U.S. countries. In certain countries, legal remedies available to investors may be more limited than those available with regard to U.S. investments. Because non-U.S. securities are normally denominated and traded in currencies other than the U.S. dollar, the value of the Fund’s assets may be affected favorably or unfavorably by currency exchange rates, exchange control regulations, and restrictions or prohibitions on the repatriation of non-U.S. currencies. Income and gains with respect to investments in certain countries may be subject to withholding and other taxes. There may be less information publicly available about a non-U.S. company than about a
– 67 –
U.S. company, and many non-U.S. companies are not subject to accounting, auditing, and financial reporting standards, regulatory framework and practices comparable to those in the U.S. Foreign investments may be subject to the risks of seizure by a foreign government, imposition of restrictions on the exchange or export of foreign currency, other economic sanctions, and tax increases. The securities of some non-U.S. companies, especially those in emerging markets, are less liquid and at times more volatile than securities of comparable U.S. companies. Emerging markets securities are subject to greater risks than securities issued in developed foreign markets, including less liquidity, greater price volatility, higher relative rates of inflation, greater political, economic, and social instability, greater custody and operational risks, and greater volatility in currency exchange rates. Non-U.S. transaction costs, such as brokerage commissions and custody costs may be higher than in the United States. In addition, there may be a possibility of nationalization or expropriation of assets, imposition of currency exchange controls, confiscatory taxation, political or financial instability, and diplomatic developments that could adversely affect the values of the Fund’s investments in certain non-U.S. countries.
Growth Company Risk The prices of growth securities are often highly sensitive to market fluctuations because of their heavy dependence on future earnings expectations, and can be more volatile than the market in general.
Large Company Risk Large-capitalization stocks as a group could fall out of favor with the market, causing the Fund to underperform investments that focus on small- or medium-capitalization stocks. Larger, more established companies may be slow to respond to challenges and may grow more slowly than smaller companies.
Liquidity Risk Certain securities may be difficult (or impossible) to sell or positions difficult to close out at a desirable time and price, and the Fund may be required to hold an illiquid investment that is declining in value, or it may be required to sell certain illiquid investments at a price or time that is not advantageous in order to meet redemptions or other cash needs. Some securities may be subject to restrictions on resale. There can be no assurance that there will be a liquid market for instruments held by the Fund at any time.
Management Risk The Fund relies on the manager’s investment analysis and its selection of investments
to achieve its investment objective. There can be no assurance that the Fund will achieve the intended results and the Fund may incur significant losses.
Market Risk The value of the Fund’s portfolio securities may decline, at times sharply and unpredictably, as a result of unfavorable market-induced changes affecting particular industries, sectors, or issuers. Stock markets can decline significantly in response to issuer, market, economic, industry, political, regulatory, geopolitical and other conditions, as well as investor perceptions of these conditions. The Fund is subject to risks affecting issuers, such as management performance, financial leverage, industry problems, and reduced demand for goods or services.
Preferred Stock Risk Like other equity securities, preferred stock is subject to the risk that its value may decrease based on actual or perceived changes in the business or financial condition of the issuer. In addition, changes in interest rates may adversely affect the value of a preferred stock that pays a fixed dividend.
Sector Risk The Fund may allocate more of its assets to certain economic, market, or industry sectors than to others. This could increase the volatility of the Fund’s portfolio, and the Fund’s performance may be more susceptible to developments affecting issuers in those sectors than if the Fund invested more broadly.
Smaller and Mid-Cap Company Risk Market risk and liquidity risk are particularly pronounced for securities of smaller companies, which may trade less frequently and in smaller volumes than more widely-held securities, and may fluctuate in price more than other securities. Their shares can be less liquid than those of larger companies, especially during market declines. Smaller companies may have limited product lines, markets, or financial resources and may be dependent on a limited management group; they may have been recently organized and have little or no track record of success.
Valuation Risk The Fund is subject to the risk of mispricing or improper valuation of its investments, in particular to the extent that its securities are fair valued.
Performance Information
The following bar chart and table provide some indication of the risks of investing in the Fund. The bar chart shows changes in the Fund’s performance
– 68 –
from year to year for Class R5 shares. The table shows how the Fund’s average annual returns for 1, 5, and 10 years compare with those of a broad measure of market performance and an additional index that provides a comparison for the Fund’s returns without regard to investment style (S&P 500 Index). Performance for Class I and Class R4 shares of the Fund for periods prior to their inception date (04/01/14) is based on the performance of Class R5 shares, adjusted for Class R4 shares to reflect Class R4 expenses. Performance for Class A shares of the Fund reflects any applicable sales charge. Past performance (before and after taxes) is not necessarily an indication of how the Fund will perform in the future. More up-to-date performance information is available at http://www.massmutual.com/funds or by calling 1-888-309-3539.
Annual Performance
Class R5 Shares
| Highest Quarter: | 1Q ’12, | 18.59% | Lowest Quarter: | 4Q ’08, | - | 24.74% |
After-tax returns are calculated using the historical highest individual federal marginal income tax rates and do not reflect the impact of state and local taxes. Actual after-tax returns depend on an investor’s tax situation and may differ from those shown. After-tax returns are not relevant to investors who hold Fund shares through tax-advantaged arrangements, such as
401(k) plans or individual retirement accounts. After-tax returns are shown for Class R5 only. After-tax returns for other classes will vary.
Average Annual Total Returns
(for the periods ended December 31, 2016)
One Year | Five Years | Ten Years | ||||||||||||
| Class R5 | Return Before Taxes | 2.26% | 15.69% | 8.58% | ||||||||||
| Return After Taxes on Distributions | 1.12% | 13.76% | 7.66% | |||||||||||
| Return After Taxes on Distributions and Sales of Fund Shares | 2.15% | 12.52% | 6.95% | |||||||||||
| Class I | Return Before Taxes | 2.43% | 15.75% | 8.61% | ||||||||||
| Service Class | Return Before Taxes | 2.16% | 15.59% | 8.50% | ||||||||||
| Administrative Class | Return Before Taxes | 2.11% | 15.43% | 8.34% | ||||||||||
| Class A | Return Before Taxes | -3.99% | 13.83% | 7.47% | ||||||||||
| Class R4 | Return Before Taxes | 1.97% | 15.31% | 8.22% | ||||||||||
| Class R3 | Return Before Taxes | 1.76% | 14.95% | 7.82% | ||||||||||
| Russell 1000 Growth Index (reflects no deduction for fees, expenses, or taxes) | 7.08% | 14.50% | 8.33% | |||||||||||
| S&P 500 Index (reflects no deduction for fees, expenses, or taxes) | 11.96% | 14.66% | 6.95% | |||||||||||
MANAGEMENT
Investment Adviser: MML Investment Advisers, LLC (“MML Advisers”)
Subadvisers: T. Rowe Price Associates, Inc. (“T. Rowe Price”)
Loomis, Sayles & Company, L.P. (“Loomis Sayles”)
Portfolio Managers:
Larry J. Puglia, CFA, CPA is a Vice President at T. Rowe Price. He has managed the Fund since February 2006.
Aziz V. Hamzaogullari, CFA is a Vice President at Loomis Sayles. He has managed the Fund since January 2015.
PURCHASE AND SALE OF FUND SHARES
Shares of the Fund are generally available to retirement plans, other institutional investors, and individual retirement accounts. Fund shares are redeemable on any business day by written request, telephone or internet (available to certain customers).
– 69 –
TAX INFORMATION
The Fund intends to make distributions that may be taxed as ordinary income, qualified dividend income, or capital gains, unless you are an investor eligible for preferential tax treatment.
PAYMENTS TO BROKER-DEALERS AND OTHER FINANCIAL INTERMEDIARIES
If you purchase the Fund through a broker-dealer or other financial intermediary, the intermediary may
receive a one-time or continuing payments from the Fund, MML Advisers or its affiliates, or others for the sale of Fund shares or continuing shareholder services provided by the intermediary. These payments may create a conflict of interest by influencing the broker-dealer or other intermediary to recommend the Fund over another investment. You should contact your intermediary to obtain more information about the compensation it may receive in connection with your investment.
– 70 –
[THIS PAGE INTENTIONALLY LEFT BLANK]
MassMutual Select Growth Opportunities Fund
INVESTMENT OBJECTIVE
This Fund seeks long-term capital appreciation.
FEES AND EXPENSES OF THE FUND
This table describes the fees and expenses that you may pay if you buy and hold shares of the Fund. For Class A shares, you may qualify for sales charge discounts if you invest, or agree to invest in the future, at least $25,000 in MassMutual funds. More information about these and other discounts is available in the section titled Sales Charges by Class beginning on page 145 of the Fund’s Prospectus or from your financial professional.
Shareholder Fees (fees paid directly from your investment)
| Class I | Class R5 | Service Class | Administrative Class | Class A | Class R4 | Class R3 | ||||||||
Maximum Sales Charge (Load) Imposed on Purchases (as a % of offering price) | None | None | None | None | 5.75% | None | None | |||||||
Maximum Deferred Sales Charge (Load) (as a % of the lower of the original offering price or redemption proceeds) | None | None | None | None | None | None | None |
Annual Fund Operating Expenses (expenses that you pay each year as a percentage of the value of your investment)
| Class I | Class R5 | Service Class | Administrative Class | Class A | Class R4 | Class R3 | ||||||||||
Management Fees | .70% | .70% | .70% | .70% | .70% | .70% | .70% | |||||||||
Distribution and Service | None | None | None | None | .25% | .25% | .50% | |||||||||
Other Expenses | .04% | .14% | .24% | .34% | .34% | .24% | .24% | |||||||||
Total Annual Fund Operating Expenses | .74% | .84% | .94% | 1.04% | 1.29% | 1.19% | 1.44% | |||||||||
Example
This example is intended to help you compare the cost of investing in the Fund with the cost of investing in other mutual funds. It assumes that you invest $10,000 in each share class of the Fund for the time periods
indicated and then redeem all of your shares at the end of those periods. For Class A shares, the example includes the initial sales charge. The example also assumes that your investment earns a 5% return each year and that the Fund’s operating expenses are exactly as described in the preceding table. Although your actual costs may be higher or lower, based on these assumptions your costs would be:
| 1 Year | 3 Years | 5 Years | 10 Years | |||||||||||||
Class I | $ | 76 | $ | 237 | $ | 411 | $ | 918 | ||||||||
Class R5 | $ | 86 | $ | 268 | $ | 466 | $ | 1,037 | ||||||||
Service Class | $ | 96 | $ | 300 | $ | 520 | $ | 1,155 | ||||||||
Administrative Class | $ | 106 | $ | 331 | $ | 574 | $ | 1,271 | ||||||||
Class A | $ | 699 | $ | 960 | $ | 1,242 | $ | 2,042 | ||||||||
Class R4 | $ | 121 | $ | 378 | $ | 654 | $ | 1,443 | ||||||||
Class R3 | $ | 147 | $ | 456 | $ | 787 | $ | 1,724 | ||||||||
Portfolio Turnover
The Fund pays transaction costs, such as commissions, when it buys and sells securities (or “turns over” its portfolio). A higher portfolio turnover rate may indicate higher transaction costs and may result in higher taxes when Fund shares are held in a taxable account. These costs, which are not reflected in annual fund operating expenses or in the example, affect the Fund’s performance. During the most recent fiscal year, the Fund’s portfolio turnover rate was 22% of the average value of its portfolio.
INVESTMENTS, RISKS, AND PERFORMANCE
Principal Investment Strategies
This Fund seeks to achieve its objective by investing primarily in equity securities of U.S. companies that the Fund’s subadvisers believe offer the potential for long-term growth. Under normal market conditions, the Fund invests at least 80% of its net assets (plus the amount of any borrowings for investment purposes) in equity securities. Equity securities may include common stocks, preferred stocks, securities convertible into common or preferred stock, rights, and warrants. The Fund typically invests most of its assets in mid- and large-capitalization equity securities of U.S. companies, but may invest up to 20% of its total assets in foreign securities and American Depositary Receipts (“ADRs”), including emerging market securities. The Fund may hold a portion of its assets in cash or cash equivalents. The Fund is non-diversified, which means that it may hold larger positions in a smaller number of stocks than a diversified Fund.
– 72 –
The Fund is managed by two subadvisers, Sands Capital Management, LLC (“Sands Capital”) and Jackson Square Partners, LLC (“Jackson Square”), each being responsible for a portion of the portfolio, but not necessarily equally weighted. Sands Capital seeks long-term capital appreciation by investing in stocks believed to have potential for dramatic wealth creation using bottom-up, fundamental research and focusing on six key investment criteria: sustainable, above average earnings growth, a leadership position in a promising business space, significant competitive advantages/unique business franchise, a clear mission and value-added focus, financial strength, and rational valuation relative to the market and business prospects. Sands Capital does not typically invest in companies with market capitalizations less than $1 billion. Jackson Square seeks to select securities that it believes are undervalued in relation to their intrinsic value, as indicated by multiple factors, including the return on capital above its cost of capital. Jackson Square will normally invest in common stocks of companies with market capitalizations of at least $3 billion at the time of purchase. Each subadviser may sell securities for a variety of reasons, such as, if, in its judgment, the prospects for future growth diminish, a more attractive opportunity is identified, if fundamentals unexpectedly change, or if valuations are stretched past fair value.
Principal Risks
The following are the Principal Risks of the Fund. The value of your investment in the Fund could go down as well as up. You can lose money by investing in the Fund.
Cash Position Risk If the Fund holds a significant portion of its assets in cash or cash equivalents, its investment returns may be adversely affected and the Fund may not achieve its investment objective.
Convertible Securities Risk Convertible securities are subject to the risks of both debt instruments and equity securities. The price of a convertible security may change in response to changes in price of the underlying equity security, the credit quality of the issuer, and interest rates. In general, the values of convertible securities tend to decline as interest rates rise and to rise when interest rates fall. A convertible security generally has less potential for gain or loss than the underlying equity security.
Equity Securities Risk Although stocks may have the potential to outperform other asset classes over the
long term, their prices tend to fluctuate more dramatically over the shorter term. These movements may result from factors affecting individual companies, or from broader influences like changes in interest rates, market conditions, investor confidence, or announcements of economic, political, or financial information. While potentially offering greater opportunities for capital growth than larger, more established companies, the stocks of smaller companies may be particularly volatile, especially during periods of economic uncertainty. These companies may face less certain growth prospects, or depend heavily on a limited line of products and services or the efforts of a small number of key management personnel.
Foreign Investment Risk; Emerging Markets Risk; Currency Risk Investments in securities of non-U.S. issuers (including depositary receipts) entail risks not typically associated with investing in securities of U.S. issuers. Similar risks may apply to securities traded on a U.S. securities exchange that are issued by companies with significant exposure to non-U.S. countries. In certain countries, legal remedies available to investors may be more limited than those available with regard to U.S. investments. Because non-U.S. securities are normally denominated and traded in currencies other than the U.S. dollar, the value of the Fund’s assets may be affected favorably or unfavorably by currency exchange rates, exchange control regulations, and restrictions or prohibitions on the repatriation of non-U.S. currencies. Income and gains with respect to investments in certain countries may be subject to withholding and other taxes. There may be less information publicly available about a non-U.S. company than about a U.S. company, and many non-U.S. companies are not subject to accounting, auditing, and financial reporting standards, regulatory framework and practices comparable to those in the U.S. Foreign investments may be subject to the risks of seizure by a foreign government, imposition of restrictions on the exchange or export of foreign currency, other economic sanctions, and tax increases. The securities of some non-U.S. companies, especially those in emerging markets, are less liquid and at times more volatile than securities of comparable U.S. companies. Emerging markets securities are subject to greater risks than securities issued in developed foreign markets, including less liquidity, greater price volatility, higher relative rates of inflation, greater political, economic, and social instability, greater custody and operational risks, and greater volatility in
– 73 –
currency exchange rates. Non-U.S. transaction costs, such as brokerage commissions and custody costs may be higher than in the United States. In addition, there may be a possibility of nationalization or expropriation of assets, imposition of currency exchange controls, confiscatory taxation, political or financial instability, and diplomatic developments that could adversely affect the values of the Fund’s investments in certain non-U.S. countries.
Growth Company Risk The prices of growth securities are often highly sensitive to market fluctuations because of their heavy dependence on future earnings expectations, and can be more volatile than the market in general.
Large Company Risk Large-capitalization stocks as a group could fall out of favor with the market, causing the Fund to underperform investments that focus on small- or medium-capitalization stocks. Larger, more established companies may be slow to respond to challenges and may grow more slowly than smaller companies.
Liquidity Risk Certain securities may be difficult (or impossible) to sell or positions difficult to close out at a desirable time and price, and the Fund may be required to hold an illiquid investment that is declining in value, or it may be required to sell certain illiquid investments at a price or time that is not advantageous in order to meet redemptions or other cash needs. Some securities may be subject to restrictions on resale. There can be no assurance that there will be a liquid market for instruments held by the Fund at any time.
Management Risk The Fund relies on the manager’s investment analysis and its selection of investments to achieve its investment objective. There can be no assurance that the Fund will achieve the intended results and the Fund may incur significant losses.
Market Risk The value of the Fund’s portfolio securities may decline, at times sharply and unpredictably, as a result of unfavorable market-induced changes affecting particular industries, sectors, or issuers. Stock markets can decline significantly in response to issuer, market, economic, industry, political, regulatory, geopolitical and other conditions, as well as investor perceptions of these conditions. The Fund is subject to risks affecting issuers, such as management performance, financial leverage, industry problems, and reduced demand for goods or services.
Non-Diversification Risk Because the Fund may invest a relatively large percentage of its assets in a single issuer or small number of issuers than a diversified fund, the Fund’s performance could be closely tied to the value of one issuer or a small number of issuers and could be more volatile than the performance of a diversified fund.
Preferred Stock Risk Like other equity securities, preferred stock is subject to the risk that its value may decrease based on actual or perceived changes in the business or financial condition of the issuer. In addition, changes in interest rates may adversely affect the value of a preferred stock that pays a fixed dividend.
Smaller and Mid-Cap Company Risk Market risk and liquidity risk are particularly pronounced for securities of smaller companies, which may trade less frequently and in smaller volumes than more widely-held securities, and may fluctuate in price more than other securities. Their shares can be less liquid than those of larger companies, especially during market declines. Smaller companies may have limited product lines, markets, or financial resources and may be dependent on a limited management group; they may have been recently organized and have little or no track record of success.
Valuation Risk The Fund is subject to the risk of mispricing or improper valuation of its investments, in particular to the extent that its securities are fair valued.
Performance Information
The following bar chart and table provide some indication of the risks of investing in the Fund. The bar chart shows changes in the Fund’s performance from year to year for Class R5 shares. The table shows how the Fund’s average annual returns for 1, 5, and 10 years compare with those of a broad measure of market performance. Performance for Class I shares of the Fund for periods prior to its inception date (12/07/11) is based on the performance of Class R5 shares. Performance for Class R4 shares of the Fund for periods prior to its inception date (04/01/14) is based on the performance of Class R5 shares, adjusted for Class R4 expenses. Performance for Class A shares of the Fund reflects any applicable sales charge. Past performance (before and after taxes) is not necessarily an indication of how the Fund will perform in the future. More up-to-date performance information is available at http://www.massmutual.com/funds or by calling 1-888-309-3539.
– 74 –
Annual Performance
Class R5 Shares
| Highest Quarter: | 1Q ’12, | 20.14% | Lowest Quarter: | 4Q ’08, | - | 27.26% |
After-tax returns are calculated using the historical highest individual federal marginal income tax rates and do not reflect the impact of state and local taxes. Actual after-tax returns depend on an investor’s tax situation and may differ from those shown. After-tax returns are not relevant to investors who hold Fund shares through tax-advantaged arrangements, such as
401(k) plans or individual retirement accounts. After-tax returns are shown for Class R5 only. After-tax returns for other classes will vary.
Average Annual Total Returns
(for the periods ended December 31, 2016)
| One Year | Five Years | Ten Years | ||||||||||||
| Class R5 | Return Before Taxes | -6.42% | 12.28% | 8.36% | ||||||||||
| Return After Taxes on Distributions | -8.11% | 10.50% | 7.41% | |||||||||||
| Return After Taxes on Distributions and Sales of Fund Shares | -2.20% | 9.83% | 6.81% | |||||||||||
| Class I | Return Before Taxes | -6.39% | 12.42% | 8.70% | ||||||||||
| Service Class | Return Before Taxes | -6.47% | 12.17% | 8.25% | ||||||||||
| Administrative Class | Return Before Taxes | -6.66% | 12.02% | 8.09% | ||||||||||
| Class A | Return Before Taxes | -12.17% | 10.44% | 7.20% | ||||||||||
| Class R4 | Return Before Taxes | -6.71% | 11.92% | 8.00% | ||||||||||
| Class R3 | Return Before Taxes | -7.03% | 11.48% | 7.52% | ||||||||||
| Russell 1000 Growth Index (reflects no deduction for fees, expenses, or taxes) | 7.08% | 14.50% | 8.33% | |||||||||||
MANAGEMENT
Investment Adviser: MML Investment Advisers, LLC (“MML Advisers”)
Subadvisers: Sands Capital Management, LLC (“Sands Capital”)
Jackson Square Partners, LLC (“Jackson Square”)
Portfolio Managers:
Frank M. Sands, CFA is the Chief Investment Officer and Chief Executive Officer at Sands Capital. He has managed the Fund since January 2004.
Wesley A. Johnston, CFA is a Portfolio Manager and Senior Research Analyst at Sands Capital. He has managed the Fund since January 2016.
A. Michael Sramek, CFA is a Research Analyst, Senior Portfolio Manager, and Managing Director at Sands Capital. He has managed the Fund since June 2013.
Jeffrey S. Van Harte, CFA is the Chairman and Chief Investment Officer at Jackson Square. He has managed the Fund since June 2006.
Christopher J. Bonavico, CFA is a Portfolio Manager and Equity Analyst at Jackson Square. He has managed the Fund since June 2006.
Christopher M. Ericksen, CFA is a Portfolio Manager and Equity Analyst at Jackson Square. He has managed the Fund since June 2006.
Daniel J. Prislin, CFA is a Portfolio Manager and Equity Analyst at Jackson Square. He has managed the Fund since June 2006.
PURCHASE AND SALE OF FUND SHARES
Shares of the Fund are generally available to retirement plans, other institutional investors, and individual retirement accounts. Fund shares are redeemable on any business day by written request, telephone or internet (available to certain customers).
TAX INFORMATION
The Fund intends to make distributions that may be taxed as ordinary income, qualified dividend income, or capital gains, unless you are an investor eligible for preferential tax treatment.
PAYMENTS TO BROKER-DEALERS AND OTHER FINANCIAL INTERMEDIARIES
If you purchase the Fund through a broker-dealer or other financial intermediary, the intermediary may receive a one-time or continuing payments from the Fund, MML Advisers or its affiliates, or others for the sale of Fund shares or continuing shareholder services provided by the intermediary. These payments may create a conflict of interest by influencing the broker-dealer or other intermediary to recommend the Fund over another investment. You should contact your intermediary to obtain more information about the compensation it may receive in connection with your investment.
– 75 –
MassMutual Select Mid-Cap Value Fund
INVESTMENT OBJECTIVE
This Fund seeks growth of capital over the long-term.
FEES AND EXPENSES OF THE FUND
This table describes the fees and expenses that you may pay if you buy and hold shares of the Fund. For Class A shares, you may qualify for sales charge discounts if you invest, or agree to invest in the future, at least $25,000 in MassMutual funds. More information about these and other discounts is available in the section titled Sales Charges by Class beginning on page 145 of the Fund’s Prospectus or from your financial professional.
Shareholder Fees (fees paid directly from your investment)
| Class I | Class R5 | Service Class | Administrative Class | Class A | Class R4 | Class R3 | ||||||||
Maximum Sales Charge (Load) Imposed on Purchases (as a % of offering price) | None | None | None | None | 5.75% | None | None | |||||||
Maximum Deferred Sales Charge (Load) (as a % of the lower of the original offering price or redemption proceeds) | None | None | None | None | None | None | None |
Annual Fund Operating Expenses (expenses that you pay each year as a percentage of the value of your investment)
| Class I | Class R5 | Service Class | Administrative Class | Class A | Class R4 | Class R3 | ||||||||||
Management Fees | .70% | .70% | .70% | .70% | .70% | .70% | .70% | |||||||||
Distribution and Service | None | None | None | None | .25% | .25% | .50% | |||||||||
Other Expenses | .24% | .34% | .44% | .54% | .54% | .44% | .44% | |||||||||
Total Annual Fund Operating Expenses | .94% | 1.04% | 1.14% | 1.24% | 1.49% | 1.39% | 1.64% | |||||||||
Expense Reimbursement | (.14%) | (.14%) | (.14%) | (.14%) | (.14%) | (.14%) | (.14%) | |||||||||
Total Annual Fund Operating Expenses after Expense Reimbursement(1) | .80% | .90% | 1.00% | 1.10% | 1.35% | 1.25% | 1.50% | |||||||||
| (1) | The expenses in the above table reflect a written agreement by MML Advisers to cap the fees and expenses of the Fund (other than extraordinary litigation and legal expenses, interest expense, short sale dividend and loan expense, Acquired Fund fees and expenses, or other non-recurring or unusual expenses such as organizational expenses and shareholder meeting expenses) through January 31, 2018, to the extent that Total Annual Fund Operating Expenses after Expense Reimbursement would otherwise exceed .80%, .90%, 1.00%, 1.10%, 1.35%, 1.25%, and 1.50% for Classes I, R5, Service, Administrative, A, R4, and R3, respectively. The Total Annual Fund Operating Expenses after Expense Reimbursement shown in the above table may exceed these amounts, because, as noted in the previous sentence, certain fees and expenses are excluded from the cap. The agreement can only be terminated by mutual consent of the Board of Trustees on behalf of the Fund and MML Advisers. |
Example
This example is intended to help you compare the cost of investing in the Fund with the cost of investing in other mutual funds. It assumes that you invest $10,000 in each share class of the Fund for the time periods indicated and then redeem all of your shares at the end of those periods. For Class A shares, the example includes the initial sales charge. The example also assumes that your investment earns a 5% return each year and that the Fund’s operating expenses are exactly as described in the preceding table. Although your actual costs may be higher or lower, based on these assumptions your costs would be:
| 1 Year | 3 Years | 5 Years | 10 Years | |||||||||||||
Class I | $ | 82 | $ | 286 | $ | 506 | $ | 1,142 | ||||||||
Class R5 | $ | 92 | $ | 317 | $ | 560 | $ | 1,258 | ||||||||
Service Class | $ | 102 | $ | 348 | $ | 614 | $ | 1,374 | ||||||||
Administrative Class | $ | 112 | $ | 380 | $ | 668 | $ | 1,488 | ||||||||
Class A | $ | 705 | $ | 1,006 | $ | 1,329 | $ | 2,241 | ||||||||
Class R4 | $ | 127 | $ | 426 | $ | 747 | $ | 1,656 | ||||||||
Class R3 | $ | 153 | $ | 504 | $ | 879 | $ | 1,932 | ||||||||
Portfolio Turnover
The Fund pays transaction costs, such as commissions, when it buys and sells securities (or “turns over” its portfolio). A higher portfolio turnover rate may indicate higher transaction costs and may result in higher taxes when Fund shares are held in a taxable account. These costs, which are not reflected in annual fund operating expenses or in the example, affect the Fund’s performance. During the most recent fiscal year, the Fund’s portfolio turnover rate was 96% of the average value of its portfolio.
INVESTMENTS, RISKS, AND PERFORMANCE
Principal Investment Strategies
The Fund invests primarily in equity securities of mid-capitalization companies that the subadvisers
– 76 –
believe are undervalued. Equity securities may include common stocks, preferred stocks, securities convertible into common or preferred stock, stock futures contracts, stock index futures contracts, rights, and warrants. Under normal circumstances, the Fund invests at least 80% of its net assets (plus the amount of any borrowings for investment purposes) in the stocks of mid-cap companies. The Fund’s subadvisers currently define “mid-cap” companies as those whose market capitalizations at the time of purchase are between $500 million and $40 billion. The Fund typically invests most of its assets in equity securities of U.S. companies, but may gain exposure to non-U.S. issuers, including emerging markets issuers, through the purchase of foreign securities and American Depositary Receipts (“ADRs”). The Fund may also invest a portion of its assets in real estate investment trusts (“REITs”). The Fund may use futures contracts as a substitute for direct investments in equity securities. The Fund may but will not necessarily engage in foreign currency forward contracts to seek to hedge or to attempt to protect against adverse changes in currency exchange rates. Use of derivatives by the Fund may create investment leverage. The Fund may invest a portion of its assets in debt securities of companies and debt obligations of governments and their agencies, and other similar securities. The Fund may hold a portion of its assets in cash or cash equivalents.
The Fund is managed by two subadvisers, American Century Investment Management, Inc. (“American Century”) and Systematic Financial Management, L.P. (“Systematic”), each being responsible for a portion of the portfolio, but not necessarily equally weighted. In selecting investments for the Fund, American Century seeks to identify stocks of companies that it believes are undervalued at the time of purchase. American Century uses a value investment strategy that looks for companies that are temporarily out of favor in the market. American Century attempts to purchase the stocks of these undervalued companies and hold each stock until it has returned to favor in the market and the stock’s price has increased to, or is higher than, a level the managers believe more accurately reflects the fair value of the company. Companies may be undervalued due to market declines, poor economic conditions, actual or anticipated bad news regarding the issuer or its industry, or because they have been overlooked by the market. To identify these companies, American Century looks for companies with earnings, cash flows and/or assets that may not
be accurately reflected in the companies’ values, as
determined by the managers. The managers also may consider whether the companies’ securities have a favorable income-paying history and whether income payments are expected to continue or increase. In selecting securities for the Fund, Systematic utilizes a two-prong, bottom-up investment strategy that unifies quantitative screening and fundamental research. Systematic’s security selection process generally favors companies with attractive valuation and positive earnings dynamics, and may consider, among other things, a company’s financial characteristics, market position, industry position, and management.
American Century may sell a stock from the Fund if, for example, in its judgment, a stock no longer meets its valuation criteria, a stock’s risk parameters outweigh its return opportunity, more attractive alternatives are identified, or specific events alter a stock’s prospects. Systematic generally may consider selling a stock for the Fund if, for example, in its judgment, the stock’s price has appreciated to a level that Systematic considers to be the stock’s fair value, its analysis leads Systematic to anticipate downward earnings revisions for a company, a company experiences an unexpected earnings announcement, or Systematic identifies other investment opportunities that it believes to be more attractive.
The Fund expects that it will engage in active and frequent trading and so will typically have a relatively high portfolio turnover rate.
Principal Risks
The following are the Principal Risks of the Fund. The value of your investment in the Fund could go down as well as up. You can lose money by investing in the Fund.
Cash Position Risk If the Fund holds a significant portion of its assets in cash or cash equivalents, its investment returns may be adversely affected and the Fund may not achieve its investment objective.
Convertible Securities Risk Convertible securities are subject to the risks of both debt instruments and equity securities. The price of a convertible security may change in response to changes in price of the underlying equity security, the credit quality of the issuer, and interest rates. In general, the values of convertible securities tend to decline as interest rates rise and to rise when interest rates fall. A convertible security generally has less potential for gain or loss than the underlying equity security.
– 77 –
Credit Risk Credit risk is the risk that an issuer, guarantor, or liquidity provider of a fixed-income security held by the Fund may be unable or unwilling, or may be perceived (whether by market participants, ratings agencies, pricing services or otherwise) as unable or unwilling, to make timely principal and/or interest payments, or to otherwise honor its obligations. The Fund may also be exposed to the credit risk of its counterparty to repurchase agreements, reverse repurchase agreements, swap transactions, and other derivatives transactions, and to the counterparty’s ability or willingness to perform in accordance with the terms of the transaction. The value of such transactions to the Fund will depend on the willingness and ability of the counterparty to perform its obligations, including among other things the obligation to return collateral or margin to the Fund.
Derivatives Risk Derivatives can be highly volatile and involve risks different from, and potentially greater than, direct investments, including risks of imperfect correlation between the value of derivatives and underlying assets, counterparty default, potential losses that partially or completely offset gains, and illiquidity. Derivatives can create investment leverage. Losses from derivatives can be substantially greater than the derivatives’ original cost and can sometimes be unlimited. If the value of a derivative does not correlate well with the particular market or asset class the derivative is designed to provide exposure to, the derivative may not have the effect anticipated. Derivatives can also reduce the opportunity for gains or result in losses by offsetting positive returns in other investments. Many derivatives are traded in the over-the-counter market and not on exchanges.
Equity Securities Risk Although stocks may have the potential to outperform other asset classes over the long term, their prices tend to fluctuate more dramatically over the shorter term. These movements may result from factors affecting individual companies, or from broader influences like changes in interest rates, market conditions, investor confidence, or announcements of economic, political, or financial information. While potentially offering greater opportunities for capital growth than larger, more established companies, the stocks of smaller companies may be particularly volatile, especially during periods of economic uncertainty. These companies may face less certain growth prospects, or depend heavily on a limited line of products and services or the efforts of a small number of key management personnel.
Fixed Income Securities Risk The values of fixed income securities typically will decline during periods of rising interest rates, and can also decline in response to changes in the financial condition of the issuer, borrower, counterparty, or underlying collateral assets, or changes in market, economic, industry, political, and regulatory conditions affecting a particular type of security or issuer or fixed income securities generally. Certain events, such as market or economic developments, regulatory or government actions, natural disasters, terrorist attacks, war, and other geopolitical events can have a dramatic adverse effect on the debt market and the overall liquidity of the market for fixed income securities. During those periods, the Fund may experience high levels of shareholder redemptions, and may have to sell securities at times when the Fund would otherwise not do so, and potentially at unfavorable prices. Certain securities may be difficult to value during such periods. Fixed income securities are subject to interest rate risk (the risk that the value of a fixed income security will fall when interest rates rise), extension risk (the risk that the average life of a security will be extended through a slowing of principal payments), prepayment risk (the risk that a security will be prepaid and the Fund will be required to reinvest at a less favorable rate), and credit risk. These risks may be heightened due to the current historically low interest rate environment.
Foreign Investment Risk; Emerging Markets Risk; Currency Risk Investments in securities of non-U.S. issuers (including depositary receipts) entail risks not typically associated with investing in securities of U.S. issuers. Similar risks may apply to securities traded on a U.S. securities exchange that are issued by companies with significant exposure to non-U.S. countries. In certain countries, legal remedies available to investors may be more limited than those available with regard to U.S. investments. Because non-U.S. securities are normally denominated and traded in currencies other than the U.S. dollar, the value of the Fund’s assets may be affected favorably or unfavorably by currency exchange rates, exchange control regulations, and restrictions or prohibitions on the repatriation of non-U.S. currencies. Income and gains with respect to investments in certain countries may be subject to withholding and other taxes. There may be less information publicly available about a non-U.S. company than about a U.S. company, and many non-U.S. companies are not subject to accounting, auditing, and financial reporting standards, regulatory framework and practices comparable to those in the U.S. Foreign investments may be subject to the risks of seizure by a foreign
– 78 –
government, imposition of restrictions on the exchange or export of foreign currency, other economic sanctions, and tax increases. The securities of some non-U.S. companies, especially those in emerging markets, are less liquid and at times more volatile than securities of comparable U.S. companies. Emerging markets securities are subject to greater risks than securities issued in developed foreign markets, including less liquidity, greater price volatility, higher relative rates of inflation, greater political, economic, and social instability, greater custody and operational risks, and greater volatility in currency exchange rates. Non-U.S. transaction costs, such as brokerage commissions and custody costs may be higher than in the United States. In addition, there may be a possibility of nationalization or expropriation of assets, imposition of currency exchange controls, confiscatory taxation, political or financial instability, and diplomatic developments that could adversely affect the values of the Fund’s investments in certain non-U.S. countries.
Frequent Trading/Portfolio Turnover Risk Portfolio turnover generally involves some expense to the Fund and may result in the realization of taxable capital gains (including short-term gains). The trading costs and tax effects associated with portfolio turnover may adversely affect the Fund’s performance.
Liquidity Risk Certain securities may be difficult (or impossible) to sell or positions difficult to close out at a desirable time and price, and the Fund may be required to hold an illiquid investment that is declining in value, or it may be required to sell certain illiquid investments at a price or time that is not advantageous in order to meet redemptions or other cash needs. Some securities may be subject to restrictions on resale. There can be no assurance that there will be a liquid market for instruments held by the Fund at any time.
Management Risk The Fund relies on the manager’s investment analysis and its selection of investments to achieve its investment objective. There can be no assurance that the Fund will achieve the intended results and the Fund may incur significant losses.
Market Risk The value of the Fund’s portfolio securities may decline, at times sharply and unpredictably, as a result of unfavorable market-induced changes affecting particular industries, sectors, or issuers. Stock markets can decline significantly in response to issuer, market, economic, industry, political, regulatory, geopolitical and other conditions, as well as investor perceptions of these conditions. The Fund is subject to risks affecting
issuers, such as management performance, financial leverage, industry problems, and reduced demand for goods or services.
Preferred Stock Risk Like other equity securities, preferred stock is subject to the risk that its value may decrease based on actual or perceived changes in the business or financial condition of the issuer. In addition, changes in interest rates may adversely affect the value of a preferred stock that pays a fixed dividend.
REIT Risk Investments in REITs may be subject to risks similar to those associated with direct investment in real estate, as well as additional risks associated with equity investments.
Sovereign Debt Obligations Risk Investments in debt securities issued by governments or by government agencies and instrumentalities involve the risk that the governmental entities responsible for repayment may be unable or unwilling to pay interest and repay principal when due. Many sovereign debt obligations may be rated below investment grade (“junk” or “high yield” bonds). Any restructuring of a sovereign debt obligation held by the Fund will likely have a significant adverse effect on the value of the obligation. In the event of default of sovereign debt, the Fund may be unable to pursue legal action against the sovereign issuer or to realize on collateral securing the debt.
Smaller and Mid-Cap Company Risk Market risk and liquidity risk are particularly pronounced for securities of smaller companies, which may trade less frequently and in smaller volumes than more widely-held securities, and may fluctuate in price more than other securities. Their shares can be less liquid than those of larger companies, especially during market declines. Smaller companies may have limited product lines, markets, or financial resources and may be dependent on a limited management group; they may have been recently organized and have little or no track record of success.
Valuation Risk The Fund is subject to the risk of mispricing or improper valuation of its investments, in particular to the extent that its securities are fair valued.
Value Company Risk The value investment approach entails the risk that the market will not recognize a security’s intrinsic value for a long time, or that a stock the investment adviser or subadviser judges to be undervalued may actually be appropriately priced.
– 79 –
Performance Information
The following bar chart and table provide some indication of the risks of investing in the Fund. The bar chart shows changes in the Fund’s performance from year to year for Class R5 shares. The table shows how the Fund’s average annual returns for 1, 5, and 10 years compare with those of a broad measure of market performance. Performance for Class I shares of the Fund for periods prior to its inception (12/07/11) is based on the performance of Class R5 shares. Performance for Class R4 shares of the Fund for periods prior to its inception date (04/01/14) is based on the performance of Class R5 shares, adjusted for Class R4 expenses. Performance for Class A shares of the Fund reflects any applicable sales charge. Past performance (before and after taxes) is not necessarily an indication of how the Fund will perform in the future. More up-to-date performance information is available at http://www.massmutual.com/funds or by calling 1-888-309-3539.
Annual Performance
Class R5 Shares
Highest Quarter: | 3Q ’09, | 18.59% | Lowest Quarter: | 4Q ’08, | - | 22.99% |
After-tax returns are calculated using the historical highest individual federal marginal income tax rates and do not reflect the impact of state and local taxes. Actual after-tax returns depend on an investor’s tax situation and may differ from those shown. After-tax returns are not relevant to investors who hold Fund shares through tax-advantaged arrangements, such as
401(k) plans or individual retirement accounts. After-tax returns are shown for Class R5 only. After-tax returns for other classes will vary.
Average Annual Total Returns
(for the periods ended December 31, 2016)
| One Year | Five Years | Ten | ||||||||||||
| Class R5 | Return Before Taxes | 21.07% | 13.91% | 6.31% | ||||||||||
| Return After Taxes on Distributions | 19.89% | 12.57% | 5.36% | |||||||||||
| Return After Taxes on Distributions and Sales of Fund Shares | 12.37% | 10.97% | 4.84% | |||||||||||
| Class I | Return Before Taxes | 21.22% | 14.06% | 6.38% | ||||||||||
Service Class | Return Before Taxes | 20.96% | 13.80% | 6.20% | ||||||||||
| Administrative Class | Return Before Taxes | 20.90% | 13.68% | 6.04% | ||||||||||
| Class A | Return Before Taxes | 13.67% | 12.07% | 5.17% | ||||||||||
| Class R4 | Return Before Taxes | 20.70% | 13.53% | 5.95% | ||||||||||
| Class R3 | Return Before Taxes | 20.40% | 13.14% | 5.53% | ||||||||||
| Russell Midcap® Value Index (reflects no deduction for fees, expenses, or taxes) | 20.00% | 15.70% | 7.59% | |||||||||||
MANAGEMENT
Investment Adviser: MML Investment Advisers, LLC (“MML Advisers”)
Subadvisers: American Century Investment Management, Inc. (“American Century”)
Systematic Financial Management, L.P. (“Systematic”)
Portfolio Managers:
Phillip N. Davidson, CFA is Chief Investment Officer – U.S. Value Equity, Senior Vice President, and Senior Portfolio Manager at American Century. He has managed the Fund since September 2015.
Michael Liss, CFA is a Vice President and Senior Portfolio Manager at American Century. He has managed the Fund since September 2015.
Kevin Toney, CFA is a Senior Vice President and Senior Portfolio Manager at American Century. He has managed the Fund since September 2015.
Brian Woglom, CFA is a Vice President and Portfolio Manager at American Century. He has managed the Fund since September 2015.
Ronald M. Mushock, CFA is a Managing Partner at Systematic and is the Lead Portfolio Manager of Systematic’s Mid Cap Portfolios. He has managed the Fund since June 2009.
D. Kevin McCreesh, CFA is a Managing Partner at Systematic and is Systematic’s Chief Investment Officer. He has managed the Fund since June 2009.
– 80 –
PURCHASE AND SALE OF FUND SHARES
Shares of the Fund are generally available to retirement plans, other institutional investors, and individual retirement accounts. Fund shares are redeemable on any business day by written request, telephone or internet (available to certain customers).
TAX INFORMATION
The Fund intends to make distributions that may be taxed as ordinary income, qualified dividend income, or capital gains, unless you are an investor eligible for preferential tax treatment.
PAYMENTS TO BROKER-DEALERS AND OTHER FINANCIAL INTERMEDIARIES
If you purchase the Fund through a broker-dealer or other financial intermediary, the intermediary may receive a one-time or continuing payments from the Fund, MML Advisers or its affiliates, or others for the sale of Fund shares or continuing shareholder services provided by the intermediary. These payments may create a conflict of interest by influencing the broker-dealer or other intermediary to recommend the Fund over another investment. You should contact your intermediary to obtain more information about the compensation it may receive in connection with your investment.
– 81 –
MassMutual Select Small Cap Value Equity Fund
INVESTMENT OBJECTIVE
This Fund seeks to maximize total return through investment primarily in small capitalization equity securities.
FEES AND EXPENSES OF THE FUND
This table describes the fees and expenses that you may pay if you buy and hold shares of the Fund. For Class A shares, you may qualify for sales charge discounts if you invest, or agree to invest in the future, at least $25,000 in MassMutual funds. More information about these and other discounts is available in the section titled Sales Charges by Class beginning on page 145 of the Fund’s Prospectus or from your financial professional.
Shareholder Fees (fees paid directly from your investment)
| Class I | Class R5 | Service Class | Administrative Class | Class A | Class R4 | Class R3 | ||||||||
Maximum Sales | None | None | None | None | 5.75% | None | None | |||||||
Maximum Deferred Sales Charge (Load) (as a % of the lower of the original offering price or redemption proceeds) | None | None | None | None | None | None | None |
Annual Fund Operating Expenses (expenses that you pay each year as a percentage of the value of your investment)
Class I | Class R5 | Service Class | Administrative Class | Class A | Class R4 | Class R3 | ||||||||||
Management Fees | .75% | .75% | .75% | .75% | .75% | .75% | .75% | |||||||||
Distribution and Service | None | None | None | None | .25% | .25% | .50% | |||||||||
Other Expenses | .12% | .22% | .32% | .42% | .42% | .32% | .32% | |||||||||
Acquired Fund Fees and Expenses | .02% | .02% | .02% | .02% | .02% | .02% | .02% | |||||||||
Total Annual Fund Operating Expenses(1) | .89% | .99% | 1.09% | 1.19% | 1.44% | 1.34% | 1.59% | |||||||||
Expense Reimbursement | (.07%) | (.07%) | (.07%) | (.07%) | (.07%) | (.07%) | (.07%) | |||||||||
Total Annual Fund Operating Expenses after Expense Reimbursement(2) | .82% | .92% | 1.02% | 1.12% | 1.37% | 1.27% | 1.52% | |||||||||
| (1) | Because Total Annual Fund Operating Expenses include Acquired Fund fees and expenses, they may not correspond to the ratios of expenses to average daily net assets shown in the “Financial Highlights” tables in the Prospectus, which reflect the operating expenses of the Fund and do not include Acquired Fund fees and expenses. |
| (2) | The expenses in the above table reflect a written agreement by MML Advisers to cap the fees and expenses of the Fund (other than extraordinary litigation and legal expenses, Acquired Fund fees and expenses, interest expense, short sale dividend and loan expense, or other non-recurring or unusual expenses such as organizational expenses and shareholder meeting expenses) through January 31, 2018, to the extent that Total Annual Fund Operating Expenses after Expense Reimbursement would otherwise exceed .80%, .90%, 1.00%, 1.10%, 1.35%, 1.25%, and 1.50% for Classes I, R5, Service, Administrative, A, R4, and R3, respectively. The Total Annual Fund Operating Expenses after Expense Reimbursement shown in the above table may exceed these amounts, because, as noted in the previous sentence, certain fees and expenses are excluded from the cap. The agreement can only be terminated by mutual consent of the Board of Trustees on behalf of the Fund and MML Advisers. |
Example
This example is intended to help you compare the cost of investing in the Fund with the cost of investing in other mutual funds. It assumes that you invest $10,000 in each share class of the Fund for the time periods indicated and then redeem all of your shares at the end of those periods. For Class A shares, the example includes the initial sales charge. The example also assumes that your investment earns a 5% return each year and that the Fund’s operating expenses are exactly as described in the preceding table. Although your actual costs may be higher or lower, based on these assumptions your costs would be:
| 1 Year | 3 Years | 5 Years | 10 Years | |||||||||||||
Class I | $ | 84 | $ | 277 | $ | 486 | $ | 1,090 | ||||||||
Class R5 | $ | 94 | $ | 308 | $ | 540 | $ | 1,207 | ||||||||
Service Class | $ | 104 | $ | 340 | $ | 594 | $ | 1,322 | ||||||||
Administrative Class | $ | 114 | $ | 371 | $ | 648 | $ | 1,437 | ||||||||
Class A | $ | 706 | $ | 998 | $ | 1,310 | $ | 2,194 | ||||||||
Class R4 | $ | 129 | $ | 418 | $ | 727 | $ | 1,607 | ||||||||
Class R3 | $ | 155 | $ | 495 | $ | 859 | $ | 1,883 | ||||||||
Portfolio Turnover
The Fund pays transaction costs, such as commissions, when it buys and sells securities (or “turns over” its portfolio). A higher portfolio turnover rate may indicate higher transaction costs and may result in higher taxes when Fund shares are held in a taxable account. These costs, which are not reflected in annual fund operating expenses or in the example, affect the Fund’s performance. During the
– 82 –
most recent fiscal year, the Fund’s portfolio turnover rate was 26% of the average value of its portfolio.
INVESTMENTS, RISKS, AND PERFORMANCE
Principal Investment Strategies
The Fund invests primarily in common stocks of small-capitalization companies that the Fund’s subadvisers believe are undervalued. Under normal circumstances, the Fund invests at least 80% of its net assets (plus the amount of any borrowings for investment purposes) in equity securities of companies whose market capitalizations at the time of purchase are within the market capitalization range of companies included in the Russell 2000® Index or the S&P SmallCap 600 Index (as of December 31, 2016, between $9 million and $10.50 billion). Equity securities may include common stocks, preferred stock, rights, and warrants. The Fund typically invests most of its assets in U.S. companies, but may invest up to 20% of its total assets in foreign securities, including emerging market securities. The Fund may hold a portion of its assets in cash or cash equivalents.
The Fund is managed by two subadvisers, Wellington Management Company LLP (“Wellington Management”) and Barrow, Hanley, Mewhinney & Strauss, LLC. (“Barrow Hanley”), each being responsible for a portion of the portfolio, but not necessarily equally weighted. Each subadviser employs a value-based investment approach and may perform a number of analyses in considering whether to buy or sell a security for the Fund. In selecting investments for the Fund, Wellington Management generally employs a bottom-up stock selection process that utilizes proprietary, fundamental research to identify companies it considers to be undervalued and to have the potential for significant longer-term returns. In selecting securities for the Fund, Barrow Hanley typically seeks to exploit market inefficiencies by using proprietary research to identify small capitalization companies that it considers to be undervalued and to have the potential to generate superior returns while subjecting the Fund to below average levels of risk. Each subadviser may consider selling a stock for the Fund if, in its judgment, the security has reached its target price, has failed to perform as expected, or other opportunities appear more attractive.
Principal Risks
The following are the Principal Risks of the Fund. The value of your investment in the Fund could go down as well as up. You can lose money by investing in the Fund.
Cash Position Risk If the Fund holds a significant portion of its assets in cash or cash equivalents, its investment returns may be adversely affected and the Fund may not achieve its investment objective.
Equity Securities Risk Although stocks may have the potential to outperform other asset classes over the long term, their prices tend to fluctuate more dramatically over the shorter term. These movements may result from factors affecting individual companies, or from broader influences like changes in interest rates, market conditions, investor confidence, or announcements of economic, political, or financial information. While potentially offering greater opportunities for capital growth than larger, more established companies, the stocks of smaller companies may be particularly volatile, especially during periods of economic uncertainty. These companies may face less certain growth prospects, or depend heavily on a limited line of products and services or the efforts of a small number of key management personnel.
Foreign Investment Risk; Emerging Markets Risk; Currency Risk Investments in securities of non-U.S. issuers (including depositary receipts) entail risks not typically associated with investing in securities of U.S. issuers. Similar risks may apply to securities traded on a U.S. securities exchange that are issued by companies with significant exposure to non-U.S. countries. In certain countries, legal remedies available to investors may be more limited than those available with regard to U.S. investments. Because non-U.S. securities are normally denominated and traded in currencies other than the U.S. dollar, the value of the Fund’s assets may be affected favorably or unfavorably by currency exchange rates, exchange control regulations, and restrictions or prohibitions on the repatriation of non-U.S. currencies. Income and gains with respect to investments in certain countries may be subject to withholding and other taxes. There may be less information publicly available about a non-U.S. company than about a U.S. company, and many non-U.S. companies are not subject to accounting, auditing, and financial reporting standards, regulatory framework and practices comparable to those in the U.S. Foreign investments may be subject to the risks of seizure by a foreign government, imposition of restrictions on the exchange or export of foreign currency, other economic sanctions, and tax increases. The securities of some non-U.S. companies, especially those in emerging markets, are less liquid and at times more volatile than securities of comparable U.S.
– 83 –
companies. Emerging markets securities are subject to greater risks than securities issued in developed foreign markets, including less liquidity, greater price volatility, higher relative rates of inflation, greater political, economic, and social instability, greater custody and operational risks, and greater volatility in currency exchange rates. Non-U.S. transaction costs, such as brokerage commissions and custody costs may be higher than in the United States. In addition, there may be a possibility of nationalization or expropriation of assets, imposition of currency exchange controls, confiscatory taxation, political or financial instability, and diplomatic developments that could adversely affect the values of the Fund’s investments in certain non-U.S. countries.
Liquidity Risk Certain securities may be difficult (or impossible) to sell or positions difficult to close out at a desirable time and price, and the Fund may be required to hold an illiquid investment that is declining in value, or it may be required to sell certain illiquid investments at a price or time that is not advantageous in order to meet redemptions or other cash needs. Some securities may be subject to restrictions on resale. There can be no assurance that there will be a liquid market for instruments held by the Fund at any time.
Management Risk The Fund relies on the manager’s investment analysis and its selection of investments to achieve its investment objective. There can be no assurance that the Fund will achieve the intended results and the Fund may incur significant losses.
Market Risk The value of the Fund’s portfolio securities may decline, at times sharply and unpredictably, as a result of unfavorable market-induced changes affecting particular industries, sectors, or issuers. Stock markets can decline significantly in response to issuer, market, economic, industry, political, regulatory, geopolitical and other conditions, as well as investor perceptions of these conditions. The Fund is subject to risks affecting issuers, such as management performance, financial leverage, industry problems, and reduced demand for goods or services.
Preferred Stock Risk Like other equity securities, preferred stock is subject to the risk that its value may decrease based on actual or perceived changes in the business or financial condition of the issuer. In addition, changes in interest rates may adversely affect the value of a preferred stock that pays a fixed dividend.
Smaller and Mid-Cap Company Risk Market risk and liquidity risk are particularly pronounced for securities of smaller companies, which may trade less frequently and in smaller volumes than more widely-held securities, and may fluctuate in price more than other securities. Their shares can be less liquid than those of larger companies, especially during market declines. Smaller companies may have limited product lines, markets, or financial resources and may be dependent on a limited management group; they may have been recently organized and have little or no track record of success.
Valuation Risk The Fund is subject to the risk of mispricing or improper valuation of its investments, in particular to the extent that its securities are fair valued.
Value Company Risk The value investment approach entails the risk that the market will not recognize a security’s intrinsic value for a long time, or that a stock the investment adviser or subadviser judges to be undervalued may actually be appropriately priced.
Performance Information
The following bar chart and table provide some indication of the risks of investing in the Fund. The bar chart shows changes in the Fund’s performance from year to year for Class R5 shares. The table shows how the Fund’s average annual returns for 1, 5, and 10 years, compare with those of a broad measure of market performance. Performance for Class I, Class R4, and Class R3 shares of the Fund for periods prior to their inception date (04/01/14) is based on the performance of Class R5 shares, adjusted for Class R4 and Class R3 shares to reflect Class R4 and Class R3 expenses, respectively. Performance for Class A shares of the Fund reflects any applicable sales charge. Past performance (before and after taxes) is not necessarily an indication of how the Fund will perform in the future. More up-to-date performance information is available at http://www.massmutual.com/funds or by calling 1-888-309-3539.
– 84 –
Annual Performance
Class R5 Shares
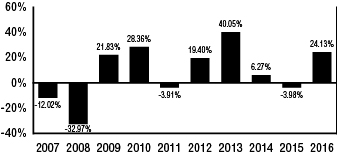
Highest Quarter: | 3Q ’09, | 23.43% | Lowest Quarter: | 4Q ’08, | - | 24.64% |
After-tax returns are calculated using the historical highest individual federal marginal income tax rates and do not reflect the impact of state and local taxes. Actual after-tax returns depend on an investor’s tax situation and may differ from those shown. After-tax returns are not relevant to investors who hold Fund shares through tax-advantaged arrangements, such as
401(k) plans or individual retirement accounts. After-tax returns are shown for Class R5 only. After-tax returns for other classes will vary.
Average Annual Total Returns
(for the periods ended December 31, 2016)
| One Year | Five Years | Ten Years | ||||||||||||
| Class R5 | Return Before Taxes | 24.13% | 16.19% | 6.50% | ||||||||||
| Return After Taxes on Distributions | 22.58% | 15.60% | 6.09% | |||||||||||
| Return After Taxes on Distributions and Sales of Fund Shares | 14.94% | 13.07% | 5.17% | |||||||||||
| Class I | Return Before Taxes | 24.20% | 16.24% | 6.52% | ||||||||||
| Service Class | Return Before Taxes | 23.98% | 16.07% | 6.40% | ||||||||||
| Administrative Class | Return Before Taxes | 23.90% | 15.93% | 6.23% | ||||||||||
| Class A | Return Before Taxes | 16.44% | 14.28% | 5.37% | ||||||||||
| Class R4 | Return Before Taxes | 23.69% | 15.78% | 6.12% | ||||||||||
| Class R3 | Return Before Taxes | 23.34% | 15.51% | 5.87% | ||||||||||
| Russell 2000 Value Index (no deduction for fees, expenses, or taxes) | 31.74% | 15.07% | 6.26% | |||||||||||
MANAGEMENT
Investment Adviser: MML Investment Advisers, LLC (“MML Advisers”)
Subadvisers: Wellington Management Company LLP (“Wellington Management”)
Barrow, Hanley, Mewhinney & Strauss, LLC (“Barrow Hanley”)
Portfolio Managers:
Shaun F. Pedersen is a Senior Managing Director and Equity Portfolio Manager at Wellington Management. He has managed the Fund since October 2009.
Timothy J. McCormack, CFA is a Senior Managing Director and Equity Portfolio Manager at Wellington Management. He has managed the Fund since October 2009.
James S. McClure, CFA is a Managing Director and Portfolio Manager at Barrow Hanley. He has managed the Fund since October 2009.
John P. Harloe, CFA is a Managing Director and Portfolio Manager at Barrow Hanley. He has managed the Fund since October 2009.
PURCHASE AND SALE OF FUND SHARES
Shares of the Fund are generally available to retirement plans, other institutional investors, and individual retirement accounts. Fund shares are redeemable on any business day by written request, telephone or internet (available to certain customers).
TAX INFORMATION
The Fund intends to make distributions that may be taxed as ordinary income, qualified dividend income, or capital gains, unless you are an investor eligible for preferential tax treatment.
PAYMENTS TO BROKER-DEALERS AND OTHER FINANCIAL INTERMEDIARIES
If you purchase the Fund through a broker-dealer or other financial intermediary, the intermediary may receive a one-time or continuing payments from the Fund, MML Advisers or its affiliates, or others for the sale of Fund shares or continuing shareholder services provided by the intermediary. These payments may create a conflict of interest by influencing the broker-dealer or other intermediary to recommend the Fund over another investment. You should contact your intermediary to obtain more information about the compensation it may receive in connection with your investment.
– 85 –
MassMutual Select Small Company Value Fund
INVESTMENT OBJECTIVE
The Fund seeks to achieve long-term growth of capital by investing primarily in a diversified portfolio of equity securities of smaller companies.
FEES AND EXPENSES OF THE FUND
This table describes the fees and expenses that you may pay if you buy and hold shares of the Fund. For Class A shares, you may qualify for sales charge discounts if you invest, or agree to invest in the future, at least $25,000 in MassMutual funds. More information about these and other discounts is available in the section titled Sales Charges by Class beginning on page 145 of the Fund’s Prospectus or from your financial professional.
Shareholder Fees (fees paid directly from your investment)
| Class I | Class R5 | Service Class | Administrative Class | Class A | Class R4 | Class R3 | ||||||||
Maximum Sales Charge (Load) Imposed on Purchases (as a % of offering price) | None | None | None | None | 5.75% | None | None | |||||||
Maximum Deferred Sales Charge (Load) (as a % of the lower of the original offering price or redemption proceeds) | None | None | None | None | None | None | None |
Annual Fund Operating Expenses (expenses that you pay each year as a percentage of the value of your investment)
| Class I | Class R5 | Service Class | Administrative Class | Class A | Class R4 | Class R3 | ||||||||||
Management Fees | .85% | .85% | .85% | .85% | .85% | .85% | .85% | |||||||||
Distribution and Service | None | None | None | None | .25% | .25% | .50% | |||||||||
Other Expenses | .09% | .19% | .29% | .39% | .39% | .29% | .29% | |||||||||
Total Annual Fund Operating Expenses | .94% | 1.04% | 1.14% | 1.24% | 1.49% | 1.39% | 1.64% | |||||||||
Example
This example is intended to help you compare the cost of investing in the Fund with the cost of investing in other mutual funds. It assumes that you invest $10,000 in each share class of the Fund for the time periods indicated and then redeem all of your shares at the end of those periods. For Class A shares, the example includes the initial sales charge. The example also assumes that your investment earns a 5% return each year and that the Fund’s operating expenses are exactly as described in the preceding table. Although your actual costs may be higher or lower, based on these assumptions your costs would be:
| 1 Year | 3 Years | 5 Years | 10 Years | |||||||||||||
Class I | $ | 96 | $ | 300 | $ | 520 | $ | 1,155 | ||||||||
Class R5 | $ | 106 | $ | 331 | $ | 574 | $ | 1,271 | ||||||||
Service Class | $ | 116 | $ | 362 | $ | 628 | $ | 1,386 | ||||||||
Administrative Class | $ | 126 | $ | 393 | $ | 681 | $ | 1,500 | ||||||||
Class A | $ | 718 | $ | 1,019 | $ | 1,341 | $ | 2,252 | ||||||||
Class R4 | $ | 142 | $ | 440 | $ | 761 | $ | 1,669 | ||||||||
Class R3 | $ | 167 | $ | 517 | $ | 892 | $ | 1,944 | ||||||||
Portfolio Turnover
The Fund pays transaction costs, such as commissions, when it buys and sells securities (or “turns over” its portfolio). A higher portfolio turnover rate may indicate higher transaction costs and may result in higher taxes when Fund shares are held in a taxable account. These costs, which are not reflected in annual fund operating expenses or in the example, affect the Fund’s performance. During the most recent fiscal year, the Fund’s portfolio turnover rate was 60% of the average value of its portfolio.
INVESTMENTS, RISKS, AND PERFORMANCE
Principal Investment Strategies
The Fund invests primarily in equity securities that the Fund’s subadvisers consider to be undervalued. Under normal circumstances, the Fund invests at least 80% of its net assets (plus the amount of any borrowings for investment purposes) in the securities of companies whose market capitalizations at the time of purchase are within the market capitalization range of companies included in the Russell 2000® Index or the S&P SmallCap 600 Index (as of December 31, 2016, between $9 million and $10.50 billion). Equity securities may include common stocks, preferred stocks, securities convertible into common or preferred stock, rights, and warrants. The Fund typically invests most of its assets in equity
– 86 –
securities of U.S. companies, but may invest in foreign securities and American Depositary Receipts (“ADRs”), including emerging market securities. The Fund generally will not invest more than 20% of its total assets in foreign securities. The Fund may invest in real estate investment trusts (“REITs”) and exchange-traded funds. The Fund may at times invest a substantial portion of its assets in obligations of issuers in one or more market, economic, or industry sectors. The Fund may use futures contracts for hedging or investment purposes as a substitute for investing directly in securities. Use of derivatives by the Fund may create investment leverage. The Fund may hold a portion of its assets in cash or cash equivalents.
The Fund is managed by three subadvisers, Federated Clover Investment Advisors (“Federated Clover”), T. Rowe Price Associates, Inc. (“T. Rowe Price”), and Invesco Advisers, Inc. (“Invesco”), each being responsible for a portion of the portfolio, but not necessarily equally weighted. Each subadviser employs a value-based investment approach and may perform a number of analyses in considering whether to buy or sell a security for the Fund. Each subadviser uses a combination of fundamental and quantitative analyses to identify undervalued companies. Each subadviser has the discretion to purchase some securities for the Fund that do not meet its normal investment criteria when it believes there is an opportunity for substantial appreciation. Each subadviser may consider selling a security for the Fund if, for example, in its judgment, the security has reached its target price, has failed to perform as expected and the security’s investment thesis is no longer intact, or other opportunities appear more attractive.
Principal Risks
The following are the Principal Risks of the Fund. The value of your investment in the Fund could go down as well as up. You can lose money by investing in the Fund.
Cash Position Risk If the Fund holds a significant portion of its assets in cash or cash equivalents, its investment returns may be adversely affected and the Fund may not achieve its investment objective.
Convertible Securities Risk Convertible securities are subject to the risks of both debt instruments and equity securities. The price of a convertible security may change in response to changes in price of the underlying equity security, the credit quality of the
issuer, and interest rates. In general, the values of convertible securities tend to decline as interest rates rise and to rise when interest rates fall. A convertible security generally has less potential for gain or loss than the underlying equity security.
Derivatives Risk Derivatives can be highly volatile and involve risks different from, and potentially greater than, direct investments, including risks of imperfect correlation between the value of derivatives and underlying assets, counterparty default, potential losses that partially or completely offset gains, and illiquidity. Derivatives can create investment leverage. Losses from derivatives can be substantially greater than the derivatives’ original cost and can sometimes be unlimited. If the value of a derivative does not correlate well with the particular market or asset class the derivative is designed to provide exposure to, the derivative may not have the effect anticipated. Derivatives can also reduce the opportunity for gains or result in losses by offsetting positive returns in other investments. Many derivatives are traded in the over-the-counter market and not on exchanges.
Equity Securities Risk Although stocks may have the potential to outperform other asset classes over the long term, their prices tend to fluctuate more dramatically over the shorter term. These movements may result from factors affecting individual companies, or from broader influences like changes in interest rates, market conditions, investor confidence, or announcements of economic, political, or financial information. While potentially offering greater opportunities for capital growth than larger, more established companies, the stocks of smaller companies may be particularly volatile, especially during periods of economic uncertainty. These companies may face less certain growth prospects, or depend heavily on a limited line of products and services or the efforts of a small number of key management personnel.
Foreign Investment Risk; Emerging Markets Risk; Currency Risk Investments in securities of non-U.S. issuers (including depositary receipts) entail risks not typically associated with investing in securities of U.S. issuers. Similar risks may apply to securities traded on a U.S. securities exchange that are issued by companies with significant exposure to non-U.S. countries. In certain countries, legal remedies available to investors may be more limited than those available with regard to U.S. investments. Because non-U.S. securities are normally denominated and
– 87 –
traded in currencies other than the U.S. dollar, the value of the Fund’s assets may be affected favorably or unfavorably by currency exchange rates, exchange control regulations, and restrictions or prohibitions on the repatriation of non-U.S. currencies. Income and gains with respect to investments in certain countries may be subject to withholding and other taxes. There may be less information publicly available about a non-U.S. company than about a U.S. company, and many non-U.S. companies are not subject to accounting, auditing, and financial reporting standards, regulatory framework and practices comparable to those in the U.S. Foreign investments may be subject to the risks of seizure by a foreign government, imposition of restrictions on the exchange or export of foreign currency, other economic sanctions, and tax increases. The securities of some non-U.S. companies, especially those in emerging markets, are less liquid and at times more volatile than securities of comparable U.S. companies. Emerging markets securities are subject to greater risks than securities issued in developed foreign markets, including less liquidity, greater price volatility, higher relative rates of inflation, greater political, economic, and social instability, greater custody and operational risks, and greater volatility in currency exchange rates. Non-U.S. transaction costs, such as brokerage commissions and custody costs may be higher than in the United States. In addition, there may be a possibility of nationalization or expropriation of assets, imposition of currency exchange controls, confiscatory taxation, political or financial instability, and diplomatic developments that could adversely affect the values of the Fund’s investments in certain non-U.S. countries.
Liquidity Risk Certain securities may be difficult (or impossible) to sell or positions difficult to close out at a desirable time and price, and the Fund may be required to hold an illiquid investment that is declining in value, or it may be required to sell certain illiquid investments at a price or time that is not advantageous in order to meet redemptions or other cash needs. Some securities may be subject to restrictions on resale. There can be no assurance that there will be a liquid market for instruments held by the Fund at any time.
Management Risk The Fund relies on the manager’s investment analysis and its selection of investments to achieve its investment objective. There can be no assurance that the Fund will achieve the intended results and the Fund may incur significant losses.
Market Risk The value of the Fund’s portfolio securities may decline, at times sharply and unpredictably, as a result of unfavorable market-induced changes affecting particular industries, sectors, or issuers. Stock markets can decline significantly in response to issuer, market, economic, industry, political, regulatory, geopolitical and other conditions, as well as investor perceptions of these conditions. The Fund is subject to risks affecting issuers, such as management performance, financial leverage, industry problems, and reduced demand for goods or services.
Preferred Stock Risk Like other equity securities, preferred stock is subject to the risk that its value may decrease based on actual or perceived changes in the business or financial condition of the issuer. In addition, changes in interest rates may adversely affect the value of a preferred stock that pays a fixed dividend.
REIT Risk Investments in REITs may be subject to risks similar to those associated with direct investment in real estate, as well as additional risks associated with equity investments.
Risk of Investment in Other Funds or Pools The Fund is indirectly exposed to all of the risks of the underlying funds, including exchange-traded funds, in which it invests, including the risk that the underlying funds will not perform as expected. The Fund indirectly pays a portion of the expenses incurred by the underlying funds.
Sector Risk The Fund may allocate more of its assets to certain economic, market, or industry sectors than to others. This could increase the volatility of the Fund’s portfolio, and the Fund’s performance may be more susceptible to developments affecting issuers in those sectors than if the Fund invested more broadly.
Smaller and Mid-Cap Company Risk Market risk and liquidity risk are particularly pronounced for securities of smaller companies, which may trade less frequently and in smaller volumes than more widely-held securities, and may fluctuate in price more than other securities. Their shares can be less liquid than those of larger companies, especially during market declines. Smaller companies may have limited product lines, markets, or financial resources and may be dependent on a limited management group; they may have been recently organized and have little or no track record of success.
Valuation Risk The Fund is subject to the risk of mispricing or improper valuation of its investments, in particular to the extent that its securities are fair valued.
– 88 –
Value Company Risk The value investment approach entails the risk that the market will not recognize a security’s intrinsic value for a long time, or that a stock the investment adviser or subadviser judges to be undervalued may actually be appropriately priced.
Performance Information
The following bar chart and table provide some indication of the risks of investing in the Fund. The bar chart shows changes in the Fund’s performance from year to year for Class R5 shares. The table shows how the Fund’s average annual returns for 1, 5, and 10 years compare with those of a broad measure of market performance and an additional index that provides a comparison for the Fund’s returns without regard to investment style (Russell 2000 Index). Performance for Class I shares of the Fund for periods prior to its inception date (11/15/10) is based on the performance of Class R5 shares. Performance for Class R4 shares of the Fund for periods prior to its inception date (04/01/14) is based on the performance of Class R5 shares, adjusted for Class R4 expenses. Performance for Class A shares of the Fund reflects any applicable sales charge. Past performance (before and after taxes) is not necessarily an indication of how the Fund will perform in the future. More up-to-date performance information is available at http://www.massmutual.com/funds or by calling 1-888-309-3539.
Annual Performance
Class R5 Shares
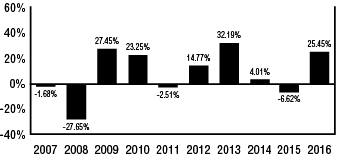
| Highest Quarter: | 3Q ’09, | 21.04% | Lowest Quarter: | 4Q ’08, | - | 24.31% |
After-tax returns are calculated using the historical highest individual federal marginal income tax rates and do not reflect the impact of state and local taxes. Actual after-tax returns depend on an investor’s tax situation and may differ from those shown. After-tax returns are not relevant to investors who hold Fund shares through tax-advantaged arrangements, such as
401(k) plans or individual retirement accounts. After-tax returns are shown for Class R5 only. After-tax returns for other classes will vary.
Average Annual Total Returns
(for the periods ended December 31, 2016)
| One Year | Five Years | Ten Years | ||||||||||||
| Class R5 | Return Before Taxes | 25.45% | 13.07% | 7.25% | ||||||||||
| Return After Taxes on Distributions | 24.95% | 9.88% | 5.26% | |||||||||||
| Return After Taxes on Distributions and Sales of Fund Shares | 14.73% | 9.90% | 5.52% | |||||||||||
| Class I | Return Before Taxes | 25.58% | 13.24% | 7.35% | ||||||||||
Service Class | Return Before Taxes | 25.33% | 12.99% | 7.18% | ||||||||||
Administrative Class | Return Before Taxes | 25.11% | 12.85% | 7.04% | ||||||||||
| Class A | Return Before Taxes | 17.73% | 11.25% | 6.15% | ||||||||||
| Class R4 | Return Before Taxes | 25.06% | 12.68% | 6.88% | ||||||||||
| Class R3 | Return Before Taxes | 24.73% | 12.34% | 6.50% | ||||||||||
| Russell 2000 Value Index (reflects no deduction for fees, expenses, or taxes) | 31.74% | 15.07% | 6.26% | |||||||||||
| Russell 2000 Index (reflects no deduction for fees, expenses, or taxes) | 21.31% | 14.46% | 7.07% | |||||||||||
MANAGEMENT
Investment Adviser: MML Investment Advisers, LLC (“MML Advisers”)
Subadvisers: Federated Clover Investment Advisors (“Federated Clover”)
T. Rowe Price Associates, Inc. (“T. Rowe Price”)
Invesco Advisers, Inc. (“Invesco”)
Portfolio Managers:
Stephen K. Gutch, CFA is a Senior Vice President and Senior Portfolio Manager at Federated Clover. He has managed the Fund since March 2006.
Martin A. Jarzebowski, CFA is a Vice President and Portfolio Manager at Federated Clover. He has managed the Fund since April 2015.
J. David Wagner, CFA is a Vice President and Equity Portfolio Manager at T. Rowe Price. He has managed the Fund since June 2014.
Andrew Waisburd, PhD is a Director of Research and Portfolio Manager at Invesco. He has managed the Fund since January 2015.
– 89 –
Glen Murphy, CFA is a Director of Portfolio Management and Portfolio Manager at Invesco. He has managed the Fund since January 2015.
Charles Ko, CFA is a Research Analyst and Portfolio Manager at Invesco. He has managed the Fund since January 2015.
PURCHASE AND SALE OF FUND SHARES
Shares of the Fund are generally available to retirement plan, other institutional investors, and individual retirement accounts. Fund shares are redeemable on any business day by written request, telephone or internet (available to certain customers).
TAX INFORMATION
The Fund intends to make distributions that may be taxed as ordinary income, qualified dividend income,
or capital gains, unless you are an investor eligible for preferential tax treatment.
PAYMENTS TO BROKER-DEALERS AND OTHER FINANCIAL INTERMEDIARIES
If you purchase the Fund through a broker-dealer or other financial intermediary, the intermediary may receive a one-time or continuing payments from the Fund, MML Advisers or its affiliates, or others for the sale of Fund shares or continuing shareholder services provided by the intermediary. These payments may create a conflict of interest by influencing the broker-dealer or other intermediary to recommend the Fund over another investment. You should contact your intermediary to obtain more information about the compensation it may receive in connection with your investment.
– 90 –
[THIS PAGE INTENTIONALLY LEFT BLANK]
INVESTMENT OBJECTIVE
The Fund seeks to provide investment results approximating (before fees and expenses) the aggregate price and dividend performance of the securities included in the Standard & Poor’s MidCap 400® Index (“S&P MidCap 400 Index”)*.
FEES AND EXPENSES OF THE FUND
This table describes the fees and expenses that you may pay if you buy and hold shares of the Fund. For Class A shares, you may qualify for sales charge discounts if you invest, or agree to invest in the future, at least $25,000 in MassMutual funds. More information about these and other discounts is available in the section titled Sales Charges by Class beginning on page 145 of the Fund’s Prospectus or from your financial professional.
Shareholder Fees (fees paid directly from your investment)
| Class I | Class R5 | Service Class | Administrative Class | Class A | Class R4 | Class R3 | ||||||||
Maximum Sales Charge (Load) Imposed on Purchases (as a % of offering price) | None | None | None | None | 5.75% | None | None | |||||||
Maximum Deferred Sales Charge (Load) (as a % of the lower of the original offering price or redemption proceeds) | None | None | None | None | None | None | None |
* The S&P MidCap 400 Index is a product of S&P Dow Jones Indices LLC (“SPDJI”), and has been licensed for use by MML Advisers. Standard & Poor’s®, S&P® and S&P MidCap 400® are registered trademarks of Standard & Poor’s Financial Services LLC (“S&P”); Dow Jones® is a registered trademark of Dow Jones Trademark Holdings LLC (“Dow Jones”); and these trademarks have been licensed for use by SPDJI and sublicensed for certain purposes by MML Advisers. The Fund is not sponsored, endorsed, sold or promoted by SPDJI, Dow Jones, S&P, their respective affiliates, and none of such parties make any representation regarding the advisability of investing in such product(s) nor do they have any liability for any errors, omissions, or interruptions of the S&P MidCap 400 Index.
Annual Fund Operating Expenses (expenses that you pay each year as a percentage of the value of your investment)
| Class I | Class R5 | Service Class | Administrative Class | Class A | Class R4 | Class R3 | ||||||||||
Management Fees | .10% | .10% | .10% | .10% | .10% | .10% | .10% | |||||||||
Distribution and Service (Rule 12b-1) Fees | None | None | None | None | .25% | .25% | .50% | |||||||||
Other Expenses | .10% | .20% | .35% | .45% | .45% | .35% | .35% | |||||||||
Total Annual Fund Operating Expenses | .20% | .30% | .45% | .55% | .80% | .70% | .95% | |||||||||
Example
This example is intended to help you compare the cost of investing in the Fund with the cost of investing in other mutual funds. It assumes that you invest $10,000 in each share class of the Fund for the time periods indicated and then redeem all of your shares at the end of those periods. For Class A shares, the example includes the initial sales charge. The example also assumes that your investment earns a 5% return each year and that the Fund’s operating expenses are exactly as described in the preceding table. Although your actual costs may be higher or lower, based on these assumptions your costs would be:
| 1 Year | 3 Years | 5 Years | 10 Years | |||||||||||||
Class I | $ | 20 | $ | 64 | $ | 113 | $ | 255 | ||||||||
Class R5 | $ | 31 | $ | 97 | $ | 169 | $ | 381 | ||||||||
Service Class | $ | 46 | $ | 144 | $ | 252 | $ | 567 | ||||||||
Administrative Class | $ | 56 | $ | 176 | $ | 307 | $ | 689 | ||||||||
Class A | $ | 652 | $ | 816 | $ | 994 | $ | 1,508 | ||||||||
Class R4 | $ | 72 | $ | 224 | $ | 390 | $ | 871 | ||||||||
Class R3 | $ | 97 | $ | 303 | $ | 525 | $ | 1,166 | ||||||||
Portfolio Turnover
The Fund pays transaction costs, such as commissions, when it buys and sells securities (or “turns over” its portfolio). A higher portfolio turnover rate may indicate higher transaction costs and may result in higher taxes when Fund shares are held in a taxable account. These costs, which are not reflected in annual fund operating expenses or in the example, affect the Fund’s performance. During the most recent fiscal year, the Fund’s portfolio turnover rate was 48% of the average value of its portfolio.
– 92 –
INVESTMENTS, RISKS, AND PERFORMANCE
Principal Investment Strategies
Under normal circumstances, the Fund invests at least 80% (and, typically, substantially all) of its net assets (plus the amount of any borrowings for investment purposes) in the equity securities of companies included in the S&P MidCap 400 Index (“Index”), in weightings that approximate the relative composition of the securities contained in the Index, and in S&P MidCap 400 Index futures contracts. The Index is a widely recognized, unmanaged index representative of common stocks of mid-capitalized U.S. companies. The companies chosen for inclusion in the Index tend to be industry leaders within the U.S. economy as determined by Standard & Poor’s®. However, companies are not selected by Standard & Poor’s for inclusion in the Index because they are expected to have superior stock price performance relative to the market in general or other stocks in particular. As of December 31, 2016, the market capitalization range of companies included in the Index was $1.23 billion to $10.52 billion. If the securities represented in the Index were to become concentrated in any particular industry, the Fund’s investments would likewise be concentrated in securities of issuers in that industry; the Index is not currently concentrated in any single industry.
The Fund is passively managed, which means it tries to duplicate the investment composition and performance of the Index by using computer programs and statistical procedures. The Fund’s subadviser, Northern Trust Investments, Inc. (“NTI”), will buy and sell securities in response to changes in the Index. The Fund may use Index futures contracts, a type of derivative, to gain exposure to the Index in lieu of investing in cash, or to reduce its exposure to the Index while it sells the securities in its portfolio. Use of Index futures contracts by the Fund may create investment leverage. Because the Fund, unlike the Index, is subject to fees and transaction expenses, the Fund’s returns are likely to be less than those of the Index. NTI expects that, under normal circumstances, the annual performance of the Fund, before fees and expenses, will track the performance of the Index within a 0.95 correlation coefficient.
Principal Risks
The following are the Principal Risks of the Fund. The value of your investment in the Fund could go down as well as up. You can lose money by investing in the Fund.
Cash Position Risk If the Fund holds a significant portion of its assets in cash or cash equivalents, its investment returns may be adversely affected and the Fund may not achieve its investment objective.
Derivatives Risk Derivatives can be highly volatile and involve risks different from, and potentially greater than, direct investments, including risks of imperfect correlation between the value of derivatives and underlying assets, counterparty default, potential losses that partially or completely offset gains, and illiquidity. Derivatives can create investment leverage. Losses from derivatives can be substantially greater than the derivatives’ original cost and can sometimes be unlimited. If the value of a derivative does not correlate well with the particular market or asset class the derivative is designed to provide exposure to, the derivative may not have the effect anticipated. Derivatives can also reduce the opportunity for gains or result in losses by offsetting positive returns in other investments. Many derivatives are traded in the over-the-counter market and not on exchanges.
Equity Securities Risk Although stocks may have the potential to outperform other asset classes over the long term, their prices tend to fluctuate more dramatically over the shorter term. These movements may result from factors affecting individual companies, or from broader influences like changes in interest rates, market conditions, investor confidence, or announcements of economic, political, or financial information. While potentially offering greater opportunities for capital growth than larger, more established companies, the stocks of smaller companies may be particularly volatile, especially during periods of economic uncertainty. These companies may face less certain growth prospects, or depend heavily on a limited line of products and services or the efforts of a small number of key management personnel.
Indexing Risk The Fund’s performance may not track the performance of the index exactly due to a number of factors, including fees and expenses of the Fund, the Fund’s cash positions, and differences between securities held by the Fund and the securities comprising the index.
Industry Concentration Risk The Fund may concentrate its assets in a particular industry or group of industries. This could increase the volatility of the Fund’s portfolio, and the Fund’s performance may be more susceptible to developments affecting issuers in
– 93 –
that industry or group of industries than if the Fund invested more broadly.
Management Risk The Fund relies on the manager’s investment analysis and its selection of investments to achieve its investment objective. There can be no assurance that the Fund will achieve the intended results and the Fund may incur significant losses.
Market Risk The value of the Fund’s portfolio securities may decline, at times sharply and unpredictably, as a result of unfavorable market-induced changes affecting particular industries, sectors, or issuers. Stock markets can decline significantly in response to issuer, market, economic, industry, political, regulatory, geopolitical and other conditions, as well as investor perceptions of these conditions. The Fund is subject to risks affecting issuers, such as management performance, financial leverage, industry problems, and reduced demand for goods or services.
Smaller and Mid-Cap Company Risk Market risk and liquidity risk are particularly pronounced for securities of smaller companies, which may trade less frequently and in smaller volumes than more widely-held securities, and may fluctuate in price more than other securities. Their shares can be less liquid than those of larger companies, especially during market declines. Smaller companies may have limited product lines, markets, or financial resources and may be dependent on a limited management group; they may have been recently organized and have little or no track record of success.
Valuation Risk The Fund is subject to the risk of mispricing or improper valuation of its investments, in particular to the extent that its securities are fair valued.
Performance Information
The following bar chart and table provide some indication of the risks of investing in the Fund. The bar chart shows changes in the Fund’s performance from year to year for Class I shares. The table shows how the Fund’s average annual returns for 1 year, and since inception, compare with those of a broad measure of market performance. Performance for Class R4 and Class R3 shares of the Fund for periods prior to their inception date (04/01/14) is based on the performance of Class R5 shares, adjusted to reflect Class R4 and Class R3 expenses, respectively. Performance for Class A shares of the Fund reflects any applicable sales
charge. Past performance (before and after taxes) is not necessarily an indication of how the Fund will perform in the future. More up-to-date performance information is available at http://www.massmutual.com/funds or by calling 1-888-309-3539.
Annual Performance
Class I Shares
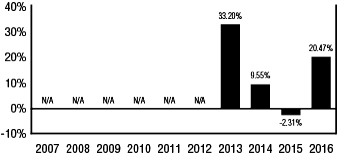
Highest Quarter: | 1Q ’13, | 13.41% | Lowest Quarter: | 3Q ’15, | - | 8.54% |
After-tax returns are calculated using the historical highest individual federal marginal income tax rates and do not reflect the impact of state and local taxes. Actual after-tax returns depend on an investor’s tax situation and may differ from those shown. After-tax returns are not relevant to investors who hold Fund shares through tax-advantaged arrangements, such as 401(k) plans or individual retirement accounts. After-tax returns are shown for Class I only. After-tax returns for other classes will vary.
Average Annual Total Returns
(for the periods ended December 31, 2016)
| One Year | Since Inception (07/26/12) | |||||||||
| Class I | Return Before Taxes | 20.47% | 15.90% | |||||||
| Return After Taxes on Distributions | 17.51% | 13.39% | ||||||||
| Return After Taxes on Distributions and Sales of Fund Shares | 13.80% | 12.21% | ||||||||
| Class R5 | Return Before Taxes | 20.25% | 15.76% | |||||||
| Service Class | Return Before Taxes | 20.18% | 15.62% | |||||||
Administrative Class | Return Before Taxes | 20.03% | 15.49% | |||||||
| Class A | Return Before Taxes | 12.82% | 13.66% | |||||||
| Class R4 | Return Before Taxes | 19.80% | 15.30% | |||||||
| Class R3 | Return Before Taxes | 19.56% | 15.05% | |||||||
| S&P MidCap 400 Index (reflects no deduction for fees, expenses, or taxes) | 20.74% | 16.15% | ||||||||
– 94 –
MANAGEMENT
Investment Adviser: MML Investment Advisers, LLC (“MML Advisers”)
Subadviser: Northern Trust Investments, Inc. (“NTI”)
Portfolio Manager: Brent Reeder is a Senior Vice President at NTI. He has managed the Fund since its inception (July 2012).
PURCHASE AND SALE OF FUND SHARES
Shares of the Fund are generally available to retirement plans, other institutional investors, and individual retirement accounts. Fund shares are redeemable on any business day by written request, telephone or internet (available to certain customers).
TAX INFORMATION
The Fund intends to make distributions that may be taxed as ordinary income, qualified dividend income, or capital gains, unless you are an investor eligible for preferential tax treatment.
PAYMENTS TO BROKER-DEALERS AND OTHER FINANCIAL INTERMEDIARIES
If you purchase the Fund through a broker-dealer or other financial intermediary, the intermediary may receive a one-time or continuing payments from the Fund, MML Advisers or its affiliates, or others for the sale of Fund shares or continuing shareholder services provided by the intermediary. These payments may create a conflict of interest by influencing the broker-dealer or other intermediary to recommend the Fund over another investment. You should contact your intermediary to obtain more information about the compensation it may receive in connection with your investment.
– 95 –
MM Russell 2000® Small Cap Index Fund
INVESTMENT OBJECTIVE
The Fund seeks to provide investment results approximating (before fees and expenses) the aggregate price and dividend performance of the securities included in the Russell 2000® Index*.
FEES AND EXPENSES OF THE FUND
This table describes the fees and expenses that you may pay if you buy and hold shares of the Fund. For Class A shares, you may qualify for sales charge discounts if you invest, or agree to invest in the future, at least $25,000 in MassMutual funds. More information about these and other discounts is available in the section titled Sales Charges by Class beginning on page 145 of the Fund’s Prospectus or from your financial professional.
Shareholder Fees (fees paid directly from your investment)
| Class I | Class R5 | Service Class | Administrative Class | Class A | Class R4 | Class R3 | ||||||||
Maximum Sales Charge (Load) Imposed on Purchases (as a % of offering price) | None | None | None | None | 5.75% | None | None | |||||||
Maximum Deferred Sales Charge (Load) (as a % of the lower of the original offering price or redemption proceeds) | None | None | None | None | None | None | None |
* The Fund is not promoted, sponsored, or endorsed by, nor in any way affiliated with Russell Investment Group (“Russell”). Russell is not responsible for and has not reviewed the Fund nor any associated literature or publications and Russell makes no representation or warranty, express or implied, as to their accuracy, or completeness, or otherwise. The Russell 2000® Index and Russell® are trademarks of the Frank Russell Company.
Annual Fund Operating Expenses (expenses that you pay each year as a percentage of the value of your investment)
| Class I | Class R5 | Service Class | Administrative Class | Class A | Class R4 | Class R3 | ||||||||||
Management Fees | .10% | .10% | .10% | .10% | .10% | .10% | .10% | |||||||||
Distribution and Service | None | None | None | None | .25% | .25% | .50% | |||||||||
Other Expenses | .11% | .21% | .36% | .46% | .46% | .36% | .36% | |||||||||
Total Annual Fund Operating Expenses | .21% | .31% | .46% | .56% | .81% | .71% | .96% | |||||||||
Expense Reimbursement | (.01%) | (.01%) | (.01%) | (.01%) | (.01%) | (.01%) | (.01%) | |||||||||
Total Annual Fund Operating Expenses after Expense Reimbursement(1) | .20% | .30% | .45% | .55% | .80% | .70% | .95% | |||||||||
| (1) | The expenses in the above table reflect a written agreement by MML Advisers to cap the fees and expenses of the Fund (other than extraordinary litigation and legal expenses, interest expense, short sale dividend and loan expense, Acquired Fund fees and expenses, or other non-recurring or unusual expenses such as organizational expenses and shareholder meeting expenses) through January 31, 2018, to the extent that Total Annual Fund Operating Expenses after Expense Reimbursement would otherwise exceed .20%, .30%, .45%, .55%, .80%, .70%, and .95% for Classes I, R5, Service, Administrative, A, R4, and R3, respectively. The Total Annual Fund Operating Expenses after Expense Reimbursement shown in the above table may exceed these amounts, because, as noted in the previous sentence, certain fees and expenses are excluded from the cap. The agreement can only be terminated by mutual consent of the Board of Trustees on behalf of the Fund and MML Advisers. |
Example
This example is intended to help you compare the cost of investing in the Fund with the cost of investing in other mutual funds. It assumes that you invest $10,000 in each share class of the Fund for the time periods indicated and then redeem all of your shares at the end of those periods. For Class A shares, the example includes the initial sales charge. The example also assumes that your investment earns a 5% return each year and that the Fund’s operating expenses are exactly as described in the preceding table. Although your actual costs may be higher or
– 96 –
lower, based on these assumptions your costs would be:
| 1 Year | 3 Years | 5 Years | 10 Years | |||||||||||||
Class I | $ | 20 | $ | 67 | $ | 117 | $ | 267 | ||||||||
Class R5 | $ | 31 | $ | 99 | $ | 173 | $ | 392 | ||||||||
Service Class | $ | 46 | $ | 147 | $ | 257 | $ | 578 | ||||||||
Administrative Class | $ | 56 | $ | 178 | $ | 312 | $ | 700 | ||||||||
Class A | $ | 652 | $ | 818 | $ | 998 | $ | 1,518 | ||||||||
Class R4 | $ | 72 | $ | 226 | $ | 394 | $ | 882 | ||||||||
Class R3 | $ | 97 | $ | 305 | $ | 530 | $ | 1,177 | ||||||||
Portfolio Turnover
The Fund pays transaction costs, such as commissions, when it buys and sells securities (or “turns over” its portfolio). A higher portfolio turnover rate may indicate higher transaction costs and may result in higher taxes when Fund shares are held in a taxable account. These costs, which are not reflected in annual fund operating expenses or in the example, affect the Fund’s performance. During the most recent fiscal year, the Fund’s portfolio turnover rate was 37% of the average value of its portfolio.
INVESTMENTS, RISKS, AND PERFORMANCE
Principal Investment Strategies
Under normal circumstances, the Fund invests at least 80% (and, typically, substantially all) of its net assets (plus the amount of any borrowings for investment purposes) in the equity securities of companies included in the Russell 2000 Index (“Index”), in weightings that approximate the relative composition of the securities contained in the Index, and in Russell 2000 Index futures contracts. The Index is a widely recognized, unmanaged index representative of common stocks of smaller capitalized U.S. companies. The companies in the Index are selected according to their total market capitalization. However, companies are not selected by Frank Russell Company for inclusion in the Index because they are expected to have superior stock price performance relative to the stock market in general or other stocks in particular. As of December 31, 2016, the market capitalization range of companies included in the Index was $9 million to $10.50 billion. If the securities represented in the Index were to become concentrated in any particular industry, the Fund’s investments would likewise be concentrated in securities of issuers in that industry; the Index is not currently concentrated in any single industry.
The Fund is passively managed, which means it tries to duplicate the investment composition and performance of the Index by using computer programs
and statistical procedures. The Fund’s subadviser, Northern Trust Investments, Inc. (“NTI”), will buy and sell securities in response to changes in the Index. The Fund may use Index futures contracts, a type of derivative, to gain exposure to the Index in lieu of investing in cash, or to reduce its exposure to the Index while it sells the securities in its portfolio. Use of Index futures contracts by the Fund may create investment leverage. Because the Fund, unlike the Index, is subject to fees and transaction expenses, the Fund’s returns are likely to be less than those of the Index. NTI expects that, under normal circumstances, the annual performance of the Fund, before fees and expenses, will track the performance of the Index within a 0.95 correlation coefficient.
Principal Risks
The following are the Principal Risks of the Fund. The value of your investment in the Fund could go down as well as up. You can lose money by investing in the Fund.
Cash Position Risk If the Fund holds a significant portion of its assets in cash or cash equivalents, its investment returns may be adversely affected and the Fund may not achieve its investment objective.
Derivatives Risk Derivatives can be highly volatile and involve risks different from, and potentially greater than, direct investments, including risks of imperfect correlation between the value of derivatives and underlying assets, counterparty default, potential losses that partially or completely offset gains, and illiquidity. Derivatives can create investment leverage. Losses from derivatives can be substantially greater than the derivatives’ original cost and can sometimes be unlimited. If the value of a derivative does not correlate well with the particular market or asset class the derivative is designed to provide exposure to, the derivative may not have the effect anticipated. Derivatives can also reduce the opportunity for gains or result in losses by offsetting positive returns in other investments. Many derivatives are traded in the over-the-counter market and not on exchanges.
Equity Securities Risk Although stocks may have the potential to outperform other asset classes over the long term, their prices tend to fluctuate more dramatically over the shorter term. These movements may result from factors affecting individual companies, or from broader influences like changes in interest rates, market conditions, investor confidence, or announcements of economic, political,
– 97 –
or financial information. While potentially offering greater opportunities for capital growth than larger, more established companies, the stocks of smaller companies may be particularly volatile, especially during periods of economic uncertainty. These companies may face less certain growth prospects, or depend heavily on a limited line of products and services or the efforts of a small number of key management personnel.
Indexing Risk The Fund’s performance may not track the performance of the index exactly due to a number of factors, including fees and expenses of the Fund, the Fund’s cash positions, and differences between securities held by the Fund and the securities comprising the index.
Industry Concentration Risk The Fund may concentrate its assets in a particular industry or group of industries. This could increase the volatility of the Fund’s portfolio, and the Fund’s performance may be more susceptible to developments affecting issuers in that industry or group of industries than if the Fund invested more broadly.
Management Risk The Fund relies on the manager’s investment analysis and its selection of investments to achieve its investment objective. There can be no assurance that the Fund will achieve the intended results and the Fund may incur significant losses.
Market Risk The value of the Fund’s portfolio securities may decline, at times sharply and unpredictably, as a result of unfavorable market-induced changes affecting particular industries, sectors, or issuers. Stock markets can decline significantly in response to issuer, market, economic, industry, political, regulatory, geopolitical and other conditions, as well as investor perceptions of these conditions. The Fund is subject to risks affecting issuers, such as management performance, financial leverage, industry problems, and reduced demand for goods or services.
Smaller and Mid-Cap Company Risk Market risk and liquidity risk are particularly pronounced for securities of smaller companies, which may trade less frequently and in smaller volumes than more widely-held securities, and may fluctuate in price more than other securities. Their shares can be less liquid than those of larger companies, especially during market declines. Smaller companies may have limited product lines, markets, or financial resources and may be dependent on a limited management group;
they may have been recently organized and have little or no track record of success.
Valuation Risk The Fund is subject to the risk of mispricing or improper valuation of its investments, in particular to the extent that its securities are fair valued.
Performance Information
The following bar chart and table provide some indication of the risks of investing in the Fund. The bar chart shows changes in the Fund’s performance from year to year for Class I shares. The table shows how the Fund’s average annual returns for 1 year, and since inception, compare with those of a broad measure of market performance. Performance for Class R4 and Class R3 shares of the Fund for periods prior to their inception date (04/01/14) is based on the performance of Class R5 shares, adjusted to reflect Class R4 and Class R3 expenses, respectively. Performance for Class A shares of the Fund reflects any applicable sales charge. Past performance (before and after taxes) is not necessarily an indication of how the Fund will perform in the future. More up-to-date performance information is available at http://www.massmutual.com/funds or by calling 1-888-309-3539.
Annual Performance
Class I Shares
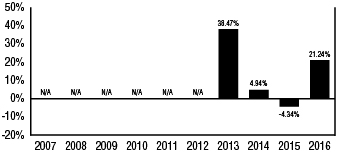
Highest Quarter: | 1Q ’13, | 12.33% | Lowest Quarter: | 3Q ’15, | - | 11.97% |
After-tax returns are calculated using the historical highest individual federal marginal income tax rates and do not reflect the impact of state and local taxes. Actual after-tax returns depend on an investor’s tax situation and may differ from those shown. After-tax returns are not relevant to investors who hold Fund shares through tax-advantaged arrangements, such as 401(k) plans or individual retirement accounts. After-tax returns are shown for Class I only. After-tax returns for other classes will vary.
– 98 –
Average Annual Total Returns
(for the periods ended December 31, 2016)
| One Year | Since Inception (07/26/12) | |||||||||
| Class I | Return Before Taxes | 21.24% | 15.22% | |||||||
| Return After Taxes on Distributions | 19.14% | 12.52% | ||||||||
| Return After Taxes on Distributions and Sale of Fund Shares | 13.42% | 11.45% | ||||||||
| Class R5 | Return Before Taxes | 21.15% | 15.12% | |||||||
| Service Class | Return Before Taxes | 20.97% | 14.92% | |||||||
Administrative Class | Return Before Taxes | 20.89% | 14.83% | |||||||
| Class A | Return Before Taxes | 13.61% | 12.97% | |||||||
| Class R4 | Return Before Taxes | 20.68% | 14.65% | |||||||
| Class R3 | Return Before Taxes | 20.37% | 14.38% | |||||||
| Russell 2000 Index (reflects no deduction for fees, expenses, or taxes) | 21.31% | 15.27% | ||||||||
MANAGEMENT
Investment Adviser: MML Investment Advisers, LLC (“MML Advisers”)
Subadviser: Northern Trust Investments, Inc. (“NTI”)
Portfolio Manager: Brent Reeder is a Senior Vice President at NTI. He has managed the Fund since its inception (July 2012).
PURCHASE AND SALE OF FUND SHARES
Shares of the Fund are generally available to retirement plans, other institutional investors, and individual retirement accounts. Fund shares are redeemable on any business day by written request, telephone or internet (available to certain customers).
TAX INFORMATION
The Fund intends to make distributions that may be taxed as ordinary income, qualified dividend income, or capital gains, unless you are an investor eligible for preferential tax treatment.
PAYMENTS TO BROKER-DEALERS AND OTHER FINANCIAL INTERMEDIARIES
If you purchase the Fund through a broker-dealer or other financial intermediary, the intermediary may receive a one-time or continuing payments from the Fund, MML Advisers or its affiliates, or others for the sale of Fund shares or continuing shareholder services provided by the intermediary. These payments may create a conflict of interest by influencing the broker-dealer or other intermediary to recommend the Fund over another investment. You should contact your intermediary to obtain more information about the compensation it may receive in connection with your investment.
– 99 –
MassMutual Select Mid Cap Growth Equity II Fund
INVESTMENT OBJECTIVE
This Fund seeks growth of capital over the long-term.
FEES AND EXPENSES OF THE FUND
This table describes the fees and expenses that you may pay if you buy and hold shares of the Fund. For Class A shares, you may qualify for sales charge discounts if you invest, or agree to invest in the future, at least $25,000 in MassMutual funds. More information about these and other discounts is available in the section titled Sales Charges by Class beginning on page 145 of the Fund’s Prospectus or from your financial professional.
Shareholder Fees (fees paid directly from your investment)
| Class I | Class R5 | Service Class | Administrative Class | Class A | Class R4 | Class R3 | ||||||||
Maximum Sales Charge (Load) Imposed on Purchases (as a % of offering price) | None | None | None | None | 5.75% | None | None | |||||||
Maximum Deferred Sales Charge (Load) (as a % of the lower of the original offering price or redemption proceeds) | None | None | None | None | None | None | None |
Annual Fund Operating Expenses (expenses that you pay each year as a percentage of the value of your investment)
| Class I | Class R5 | Service Class | Administrative Class | Class A | Class R4 | Class R3 | ||||||||||
Management Fees | .70% | .70% | .70% | .70% | .70% | .70% | .70% | |||||||||
Distribution and Service | None | None | None | None | .25% | .25% | .50% | |||||||||
Other Expenses | .03% | .13% | .23% | .33% | .33% | .23% | .23% | |||||||||
Total Annual Fund Operating Expenses | .73% | .83% | .93% | 1.03% | 1.28% | 1.18% | 1.43% | |||||||||
Example
This example is intended to help you compare the cost of investing in the Fund with the cost of investing in other mutual funds. It assumes that you invest $10,000 in each share class of the Fund for the time periods indicated and then redeem all of your
shares at the end of those periods. For Class A shares, the example includes the initial sales charge. The example also assumes that your investment earns a 5% return each year and that the Fund’s operating expenses are exactly as described in the preceding table. Although your actual costs may be higher or lower, based on these assumptions your costs would be:
| 1 Year | 3 Years | 5 Years | 10 Years | |||||||||||||
Class I | $ | 75 | $ | 233 | $ | 406 | $ | 906 | ||||||||
Class R5 | $ | 85 | $ | 265 | $ | 460 | $ | 1,025 | ||||||||
Service Class | $ | 95 | $ | 296 | $ | 515 | $ | 1,143 | ||||||||
Administrative Class | $ | 105 | $ | 328 | $ | 569 | $ | 1,259 | ||||||||
Class A | $ | 698 | $ | 958 | $ | 1,237 | $ | 2,031 | ||||||||
Class R4 | $ | 120 | $ | 375 | $ | 649 | $ | 1,432 | ||||||||
Class R3 | $ | 146 | $ | 452 | $ | 782 | $ | 1,713 | ||||||||
Portfolio Turnover
The Fund pays transaction costs, such as commissions, when it buys and sells securities (or “turns over” its portfolio). A higher portfolio turnover rate may indicate higher transaction costs and may result in higher taxes when Fund shares are held in a taxable account. These costs, which are not reflected in annual fund operating expenses or in the example, affect the Fund’s performance. During the most recent fiscal year, the Fund’s portfolio turnover rate was 36% of the average value of its portfolio.
INVESTMENTS, RISKS, AND PERFORMANCE
Principal Investment Strategies
The Fund invests primarily in equity securities of mid-capitalization companies that the Fund’s subadvisers believe offer the potential for long-term growth. The Fund is managed by two subadvisers, T. Rowe Price Associates, Inc. (“T. Rowe Price”) and Frontier Capital Management Company, LLC (“Frontier”), each being responsible for a portion of the portfolio, but not necessarily equally weighted. Equity securities may include common stocks, preferred stocks, securities convertible into common or preferred stock, rights, and warrants. Under normal circumstances, the Fund invests at least 80% of its net assets (plus the amount of any borrowings for investment purposes) in a broadly diversified portfolio of common stocks of mid-cap companies whose earnings the Fund’s subadvisers expect to grow at a faster rate than the average company. The Fund’s subadvisers currently define “mid-cap” companies as those whose market capitalizations at
– 100 –
the time of purchase fall within the market capitalization range of companies included in either the S&P MidCap 400® Index or the Russell Midcap® Growth Index (as of December 31, 2016, between $643 million and $57.59 billion). The Fund may invest up to 20% of its net assets in stocks whose market capitalizations are outside of that capitalization range. The Fund typically invests most of its assets in equity securities of U.S. companies, but may invest in foreign securities and American Depositary Receipts (“ADRs”), including emerging market securities. The Fund generally will not invest more than 25% of its total assets in foreign securities. The Fund may hold a portion of its assets in cash or cash equivalents.
In selecting securities for the Fund, T. Rowe Price generally uses a “growth” approach, seeking to identify companies that it believes have proven products or services, a record of above-average earnings growth, demonstrated potential to sustain earnings growth, stock prices that appear to undervalue their growth prospects, or a connection to industries experiencing increasing demand. T. Rowe Price has the discretion to purchase some securities for the Fund that do not meet those investment criteria when it believes there is an opportunity for substantial appreciation.
In selecting securities for the Fund, Frontier employs a “growth at a reasonable price” approach to identify the best risk/reward investment ideas in the U.S. equity mid-capitalization universe. Frontier believes that there are three key drivers of long-term, consistent performance. Frontier looks for companies that have: i) sound business models with strong management teams and long-term growth prospects; ii) unrecognized earnings power; and iii) attractive valuations.
Each subadviser may sell securities for the Fund for a variety of reasons, such as, for example, to seek to secure gains, limit losses, or redeploy assets into more promising opportunities.
Principal Risks
The following are the Principal Risks of the Fund. The value of your investment in the Fund could go down as well as up. You can lose money by investing in the Fund.
Cash Position Risk If the Fund holds a significant portion of its assets in cash or cash equivalents, its investment returns may be adversely affected and the Fund may not achieve its investment objective.
Convertible Securities Risk Convertible securities are subject to the risks of both debt instruments and equity securities. The price of a convertible security may change in response to changes in price of the underlying equity security, the credit quality of the issuer, and interest rates. In general, the values of convertible securities tend to decline as interest rates rise and to rise when interest rates fall. A convertible security generally has less potential for gain or loss than the underlying equity security.
Equity Securities Risk Although stocks may have the potential to outperform other asset classes over the long term, their prices tend to fluctuate more dramatically over the shorter term. These movements may result from factors affecting individual companies, or from broader influences like changes in interest rates, market conditions, investor confidence, or announcements of economic, political, or financial information. While potentially offering greater opportunities for capital growth than larger, more established companies, the stocks of smaller companies may be particularly volatile, especially during periods of economic uncertainty. These companies may face less certain growth prospects, or depend heavily on a limited line of products and services or the efforts of a small number of key management personnel.
Foreign Investment Risk; Emerging Markets Risk; Currency Risk Investments in securities of non-U.S. issuers (including depositary receipts) entail risks not typically associated with investing in securities of U.S. issuers. Similar risks may apply to securities traded on a U.S. securities exchange that are issued by companies with significant exposure to non-U.S. countries. In certain countries, legal remedies available to investors may be more limited than those available with regard to U.S. investments. Because non-U.S. securities are normally denominated and traded in currencies other than the U.S. dollar, the value of the Fund’s assets may be affected favorably or unfavorably by currency exchange rates, exchange control regulations, and restrictions or prohibitions on the repatriation of non-U.S. currencies. Income and gains with respect to investments in certain countries may be subject to withholding and other taxes. There may be less information publicly available about a non-U.S. company than about a U.S. company, and many non-U.S. companies are not subject to accounting, auditing, and financial reporting standards, regulatory framework and practices comparable to those in the U.S. Foreign investments may be subject to the risks of seizure by
– 101 –
a foreign government, imposition of restrictions on the exchange or export of foreign currency, other economic sanctions, and tax increases. The securities of some non-U.S. companies, especially those in emerging markets, are less liquid and at times more volatile than securities of comparable U.S. companies. Emerging markets securities are subject to greater risks than securities issued in developed foreign markets, including less liquidity, greater price volatility, higher relative rates of inflation, greater political, economic, and social instability, greater custody and operational risks, and greater volatility in currency exchange rates. Non-U.S. transaction costs, such as brokerage commissions and custody costs may be higher than in the United States. In addition, there may be a possibility of nationalization or expropriation of assets, imposition of currency exchange controls, confiscatory taxation, political or financial instability, and diplomatic developments that could adversely affect the values of the Fund’s investments in certain non-U.S. countries.
Growth Company Risk The prices of growth securities are often highly sensitive to market fluctuations because of their heavy dependence on future earnings expectations, and can be more volatile than the market in general.
Liquidity Risk Certain securities may be difficult (or impossible) to sell or positions difficult to close out at a desirable time and price, and the Fund may be required to hold an illiquid investment that is declining in value, or it may be required to sell certain illiquid investments at a price or time that is not advantageous in order to meet redemptions or other cash needs. Some securities may be subject to restrictions on resale. There can be no assurance that there will be a liquid market for instruments held by the Fund at any time.
Management Risk The Fund relies on the manager’s investment analysis and its selection of investments to achieve its investment objective. There can be no assurance that the Fund will achieve the intended results and the Fund may incur significant losses.
Market Risk The value of the Fund’s portfolio securities may decline, at times sharply and unpredictably, as a result of unfavorable market-induced changes affecting particular industries, sectors, or issuers. Stock markets can decline significantly in response to issuer, market, economic, industry, political, regulatory, geopolitical and other conditions, as well as investor perceptions of these
conditions. The Fund is subject to risks affecting issuers, such as management performance, financial leverage, industry problems, and reduced demand for goods or services.
Preferred Stock Risk Like other equity securities, preferred stock is subject to the risk that its value may decrease based on actual or perceived changes in the business or financial condition of the issuer. In addition, changes in interest rates may adversely affect the value of a preferred stock that pays a fixed dividend.
Smaller and Mid-Cap Company Risk Market risk and liquidity risk are particularly pronounced for securities of smaller companies, which may trade less frequently and in smaller volumes than more widely-held securities, and may fluctuate in price more than other securities. Their shares can be less liquid than those of larger companies, especially during market declines. Smaller companies may have limited product lines, markets, or financial resources and may be dependent on a limited management group; they may have been recently organized and have little or no track record of success.
Valuation Risk The Fund is subject to the risk of mispricing or improper valuation of its investments, in particular to the extent that its securities are fair valued.
Performance Information
The following bar chart and table provide some indication of the risks of investing in the Fund. The bar chart shows changes in the Fund’s performance from year to year for Class R5 shares. The table shows how the Fund’s average annual returns for 1, 5, and 10 years compare with those of a broad measure of market performance. Performance for Class I shares of the Fund for periods prior to its inception date (11/15/10) is based on the performance of Class R5 shares. Performance for Class R4 shares of the Fund for periods prior to its inception date (04/01/14) is based on the performance of Class R5 shares, adjusted for Class R4 expenses. Performance for Class A shares of the Fund reflects any applicable sales charge. Past performance (before and after taxes) is not necessarily an indication of how the Fund will perform in the future. More up-to-date performance information is available at http://www.massmutual.com/funds or by calling 1-888-309-3539.
– 102 –
Annual Performance
Class R5 Shares
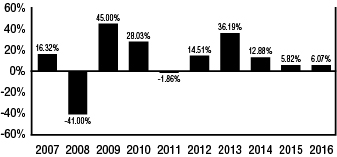
Highest Quarter: | 3Q ’09, | 19.07% | Lowest Quarter: | 4Q ’08, | - | 26.27% |
After-tax returns are calculated using the historical highest individual federal marginal income tax rates and do not reflect the impact of state and local taxes. Actual after-tax returns depend on an investor’s tax situation and may differ from those shown. After-tax returns are not relevant to investors who hold Fund shares through tax-advantaged arrangements, such as
401(k) plans or individual retirement accounts. After-tax returns are shown for Class R5 only. After-tax returns for other classes will vary.
Average Annual Total Returns
(for the periods ended December 31, 2016)
One Year | Five Years | Ten Years | ||||||||||||
| Class R5 | Return Before Taxes | 6.07% | 14.59% | 9.47% | ||||||||||
| Return After Taxes on Distributions | 4.94% | 12.46% | 8.03% | |||||||||||
| Return After Taxes on Distributions and Sales of Fund Shares | 4.39% | 11.55% | 7.60% | |||||||||||
| Class I | Return Before Taxes | 6.19% | 14.73% | 9.53% | ||||||||||
| Service Class | Return Before Taxes | 5.95% | 14.49% | 9.36% | ||||||||||
Administrative Class | Return Before Taxes | 5.88% | 14.36% | 9.22% | ||||||||||
| Class A | Return Before Taxes | -0.51% | 12.72% | 8.30% | ||||||||||
| Class R4 | Return Before Taxes | 5.67% | 14.21% | 9.09% | ||||||||||
| Class R3 | Return Before Taxes | 5.39% | 13.82% | 8.66% | ||||||||||
| Russell Midcap Growth Index (reflects no deduction for fees, expenses, or taxes) | 7.33% | 13.51% | 7.83% | |||||||||||
MANAGEMENT
Investment Advisers: MML Investment Advisers, LLC (“MML Advisers”)
Subadvisers: T. Rowe Price Associates, Inc. (“T. Rowe Price”)
Frontier Capital Management Company, LLC (“Frontier”)
Portfolio Managers:
Brian W.H. Berghuis, CFA is a Vice President and Equity Portfolio Manager at T. Rowe Price. He has managed the Fund since its inception (June 2000).
Stephen M. Knightly, CFA is the President and Mid Cap Growth Portfolio Manager at Frontier. He has managed the Fund since August 2010.
Christopher J. Scarpa is a Vice President and Mid Cap Growth Portfolio Manager at Frontier. He has managed the Fund since August 2010.
PURCHASE AND SALE OF FUND SHARES
Shares of the Fund are generally available to retirement plans, other institutional investors, and individual retirement accounts. Fund shares are redeemable on any business day by written request, telephone or internet (available to certain customers).
TAX INFORMATION
The Fund intends to make distributions that may be taxed as ordinary income, qualified dividend income, or capital gains, unless you are an investor eligible for preferential tax treatment.
PAYMENTS TO BROKER-DEALERS AND OTHER FINANCIAL INTERMEDIARIES
If you purchase the Fund through a broker-dealer or other financial intermediary, the intermediary may receive a one-time or continuing payments from the Fund, MML Advisers or its affiliates, or others for the sale of Fund shares or continuing shareholder services provided by the intermediary. These payments may create a conflict of interest by influencing the broker-dealer or other intermediary to recommend the Fund over another investment. You should contact your intermediary to obtain more information about the compensation it may receive in connection with your investment.
– 103 –
MassMutual Select Small Cap Growth Equity Fund
INVESTMENT OBJECTIVE
This Fund seeks long-term capital appreciation.
FEES AND EXPENSES OF THE FUND
This table describes the fees and expenses that you may pay if you buy and hold shares of the Fund. For Class A shares, you may qualify for sales charge discounts if you invest, or agree to invest in the future, at least $25,000 in MassMutual funds. More information about these and other discounts is available in the section titled Sales Charges by Class beginning on page 145 of the Fund’s Prospectus or from your financial professional.
Shareholder Fees (fees paid directly from your investment)
| Class I | Class R5 | Service Class | Administrative Class | Class A | Class R4 | Class R3 | ||||||||
Maximum Sales Charge (Load) Imposed on Purchases (as a % of offering price) | None | None | None | None | 5.75% | None | None | |||||||
Maximum Deferred Sales Charge (Load) (as a % of the lower of the original offering price or redemption proceeds) | None | None | None | None | None | None | None |
Annual Fund Operating Expenses (expenses that you pay each year as a percentage of the value of your investment)
| Class I | Class R5 | Service Class | Administrative Class | Class A | Class R4 | Class R3 | ||||||||||
Management Fees | .80% | .80% | .80% | .80% | .80% | .80% | .80% | |||||||||
Distribution and Service | None | None | None | None | .25% | .25% | .50% | |||||||||
Other Expenses | .07% | .17% | .27% | .37% | .37% | .27% | .27% | |||||||||
Acquired Fund Fees and Expenses | .01% | .01% | .01% | .01% | .01% | .01% | .01% | |||||||||
Total Annual Fund Operating Expenses(1) | .88% | .98% | 1.08% | 1.18% | 1.43% | 1.33% | 1.58% | |||||||||
| (1) | Because Total Annual Fund Operating Expenses include Acquired Fund fees and expenses, they may not correspond to |
| the ratios of expenses to average daily net assets shown in the “Financial Highlights” tables in the Prospectus, which reflect the operating expenses of the Fund and do not include Acquired Fund fees and expenses. |
Example
This example is intended to help you compare the cost of investing in the Fund with the cost of investing in other mutual funds. It assumes that you invest $10,000 in each share class of the Fund for the time periods indicated and then redeem all of your shares at the end of those periods. For Class A shares, the example includes the initial sales charge. The example also assumes that your investment earns a 5% return each year and that the Fund’s operating expenses are exactly as described in the preceding table. Although your actual costs may be higher or lower, based on these assumptions your costs would be:
| 1 Year | 3 Years | 5 Years | 10 Years | |||||||||||||
Class I | $ | 90 | $ | 281 | $ | 488 | $ | 1,084 | ||||||||
Class R5 | $ | 100 | $ | 312 | $ | 542 | $ | 1,201 | ||||||||
Service Class | $ | 110 | $ | 343 | $ | 595 | $ | 1,317 | ||||||||
Administrative Class | $ | 120 | $ | 375 | $ | 649 | $ | 1,432 | ||||||||
Class A | $ | 712 | $ | 1,001 | $ | 1,312 | $ | 2,190 | ||||||||
Class R4 | $ | 135 | $ | 421 | $ | 729 | $ | 1,601 | ||||||||
Class R3 | $ | 161 | $ | 499 | $ | 860 | $ | 1,878 | ||||||||
Portfolio Turnover
The Fund pays transaction costs, such as commissions, when it buys and sells securities (or “turns over” its portfolio). A higher portfolio turnover rate may indicate higher transaction costs and may result in higher taxes when Fund shares are held in a taxable account. These costs, which are not reflected in annual fund operating expenses or in the example, affect the Fund’s performance. During the most recent fiscal year, the Fund’s portfolio turnover rate was 85% of the average value of its portfolio.
INVESTMENTS, RISKS, AND PERFORMANCE
Principal Investment Strategies
The Fund invests primarily in equity securities of smaller companies that the Fund’s subadvisers believe offer potential for long-term growth. Under normal circumstances, the Fund invests at least 80% of its net assets (plus the amount of any borrowings for investment purposes) in the equity securities of companies whose market capitalizations at the time of purchase are within the market capitalization range of companies included in the Russell 2000® Index or the S&P SmallCap 600 Index (as of December 31,
– 104 –
2016, between $9 million and $10.50 billion). Equity securities may include common stocks, preferred stocks, securities convertible into common or preferred stock, rights, and warrants. While most assets typically will be invested in common stocks of U.S. companies, the Fund also may invest up to 20% of its total assets in foreign securities, including emerging market securities. The Fund may at times increase the relative emphasis of its investments in a particular industry or sector. The Fund may hold a portion of its assets in cash or cash equivalents.
The Fund is managed by two subadvisers, Wellington Management Company LLP (“Wellington Management”) and OFI Global Institutional, Inc. (“OFI Global”), each being responsible for a portion of the portfolio, but not necessarily equally weighted. Each subadviser employs a growth-based investment approach and may perform a number of analyses in considering whether to buy or sell a security for the Fund. Wellington Management uses a combination of fundamental and quantitative analyses to identify small-cap companies that it believes are experiencing or will experience rapid earnings or revenue growth. OFI Global uses fundamental research to select securities for the Fund’s portfolio. Each subadviser may consider selling a security for the Fund if, for example, in its judgment, target prices are reached, future upside potential is limited, company fundamentals are no longer attractive, superior purchase candidates are identified, or market capitalization ceilings are exceeded.
Principal Risks
The following are the Principal Risks of the Fund. The value of your investment in the Fund could go down as well as up. You can lose money by investing in the Fund.
Cash Position Risk If the Fund holds a significant portion of its assets in cash or cash equivalents, its investment returns may be adversely affected and the Fund may not achieve its investment objective.
Convertible Securities Risk Convertible securities are subject to the risks of both debt instruments and equity securities. The price of a convertible security may change in response to changes in price of the underlying equity security, the credit quality of the issuer, and interest rates. In general, the values of convertible securities tend to decline as interest rates rise and to rise when interest rates fall. A convertible security generally has less potential for gain or loss than the underlying equity security.
Equity Securities Risk Although stocks may have the potential to outperform other asset classes over the long term, their prices tend to fluctuate more dramatically over the shorter term. These movements may result from factors affecting individual companies, or from broader influences like changes in interest rates, market conditions, investor confidence, or announcements of economic, political, or financial information. While potentially offering greater opportunities for capital growth than larger, more established companies, the stocks of smaller companies may be particularly volatile, especially during periods of economic uncertainty. These companies may face less certain growth prospects, or depend heavily on a limited line of products and services or the efforts of a small number of key management personnel.
Foreign Investment Risk; Emerging Markets Risk; Currency Risk Investments in securities of non-U.S. issuers (including depositary receipts) entail risks not typically associated with investing in securities of U.S. issuers. Similar risks may apply to securities traded on a U.S. securities exchange that are issued by companies with significant exposure to non-U.S. countries. In certain countries, legal remedies available to investors may be more limited than those available with regard to U.S. investments. Because non-U.S. securities are normally denominated and traded in currencies other than the U.S. dollar, the value of the Fund’s assets may be affected favorably or unfavorably by currency exchange rates, exchange control regulations, and restrictions or prohibitions on the repatriation of non-U.S. currencies. Income and gains with respect to investments in certain countries may be subject to withholding and other taxes. There may be less information publicly available about a non-U.S. company than about a U.S. company, and many non-U.S. companies are not subject to accounting, auditing, and financial reporting standards, regulatory framework and practices comparable to those in the U.S. Foreign investments may be subject to the risks of seizure by a foreign government, imposition of restrictions on the exchange or export of foreign currency, other economic sanctions, and tax increases. The securities of some non-U.S. companies, especially those in emerging markets, are less liquid and at times more volatile than securities of comparable U.S. companies. Emerging markets securities are subject to greater risks than securities issued in developed foreign markets, including less liquidity, greater price volatility, higher relative rates of inflation, greater political, economic, and social instability, greater
– 105 –
custody and operational risks, and greater volatility in currency exchange rates. Non-U.S. transaction costs, such as brokerage commissions and custody costs may be higher than in the United States. In addition, there may be a possibility of nationalization or expropriation of assets, imposition of currency exchange controls, confiscatory taxation, political or financial instability, and diplomatic developments that could adversely affect the values of the Fund’s investments in certain non-U.S. countries.
Growth Company Risk The prices of growth securities are often highly sensitive to market fluctuations because of their heavy dependence on future earnings expectations, and can be more volatile than the market in general.
Liquidity Risk Certain securities may be difficult (or impossible) to sell or positions difficult to close out at a desirable time and price, and the Fund may be required to hold an illiquid investment that is declining in value, or it may be required to sell certain illiquid investments at a price or time that is not advantageous in order to meet redemptions or other cash needs. Some securities may be subject to restrictions on resale. There can be no assurance that there will be a liquid market for instruments held by the Fund at any time.
Management Risk The Fund relies on the manager’s investment analysis and its selection of investments to achieve its investment objective. There can be no assurance that the Fund will achieve the intended results and the Fund may incur significant losses.
Market Risk The value of the Fund’s portfolio securities may decline, at times sharply and unpredictably, as a result of unfavorable market-induced changes affecting particular industries, sectors, or issuers. Stock markets can decline significantly in response to issuer, market, economic, industry, political, regulatory, geopolitical and other conditions, as well as investor perceptions of these conditions. The Fund is subject to risks affecting issuers, such as management performance, financial leverage, industry problems, and reduced demand for goods or services.
Preferred Stock Risk Like other equity securities, preferred stock is subject to the risk that its value may decrease based on actual or perceived changes in the business or financial condition of the issuer. In addition, changes in interest rates may adversely affect the value of a preferred stock that pays a fixed dividend.
Sector Risk The Fund may allocate more of its assets to certain economic, market, or industry sectors than to others. This could increase the volatility of the Fund’s portfolio, and the Fund’s performance may be more susceptible to developments affecting issuers in those sectors than if the Fund invested more broadly.
Smaller and Mid-Cap Company Risk Market risk and liquidity risk are particularly pronounced for securities of smaller companies, which may trade less frequently and in smaller volumes than more widely-held securities, and may fluctuate in price more than other securities. Their shares can be less liquid than those of larger companies, especially during market declines. Smaller companies may have limited product lines, markets, or financial resources and may be dependent on a limited management group; they may have been recently organized and have little or no track record of success.
Valuation Risk The Fund is subject to the risk of mispricing or improper valuation of its investments, in particular to the extent that its securities are fair valued.
Performance Information
The following bar chart and table provide some indication of the risks of investing in the Fund. The bar chart shows changes in the Fund’s performance from year to year for Class R5 shares. The table shows how the Fund’s average annual returns for 1, 5, and 10 years compare with those of a broad measure of market performance and an additional index that provides a comparison for the Fund’s returns without regard to investment style (Russell 2000 Index). Performance for Class I shares of the Fund for periods prior to its inception date (11/15/10) is based on the performance of Class R5 shares. Performance for Class R4 shares of the Fund for periods prior to its inception date (04/01/14) is based on the performance of Class R5 shares, adjusted for Class R4 expenses. Performance for Class A shares of the Fund reflects any applicable sales charge. Past performance (before and after taxes) is not necessarily an indication of how the Fund will perform in the future. More up-to-date performance information is available at http://www.massmutual.com/funds or by calling 1-888-309-3539.
– 106 –
Annual Performance
Class R5 Shares
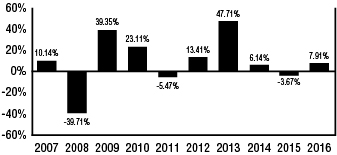
Highest Quarter: | 2Q ’09, | 25.47% | Lowest Quarter: | 4Q ’08, | - | 24.72% |
After-tax returns are calculated using the historical highest individual federal marginal income tax rates and do not reflect the impact of state and local taxes. Actual after-tax returns depend on an investor’s tax situation and may differ from those shown. After-tax returns are not relevant to investors who hold Fund shares through tax-advantaged arrangements, such as
401(k) plans or individual retirement accounts. After-tax returns are shown for Class R5 only. After-tax returns for other classes will vary.
Average Annual Total Returns
(for the periods ended December 31, 2016)
One Year | Five Years | Ten Years | ||||||||||||
| Class R5 | Return Before Taxes | 7.91% | 13.07% | 7.13% | ||||||||||
| Return After Taxes on Distributions | 7.91% | 9.38% | 4.92% | |||||||||||
| Return After Taxes on Distributions and Sales of Fund Shares | 4.48% | 9.83% | 5.38% | |||||||||||
| Class I | Return Before Taxes | 8.01% | 13.16% | 7.17% | ||||||||||
| Service Class | Return Before Taxes | 7.78% | 12.93% | 6.98% | ||||||||||
| Administrative Class | Return Before Taxes | 7.66% | 12.79% | 6.84% | ||||||||||
| Class A | Return Before Taxes | 1.26% | 11.19% | 5.94% | ||||||||||
| Class R4 | Return Before Taxes | 7.51% | 12.68% | 6.75% | ||||||||||
| Class R3 | Return Before Taxes | 7.35% | 12.28% | 6.30% | ||||||||||
| Russell 2000 Growth Index (reflects no deduction for fees, expenses, or taxes) | 11.32% | 13.74% | 7.76% | |||||||||||
| Russell 2000 Index (reflects no deduction for fees, expenses, or taxes) | 21.31% | 14.46% | 7.07% | |||||||||||
MANAGEMENT
Investment Adviser: MML Investment Advisers, LLC (“MML Advisers”)
Subadvisers: Wellington Management Company LLP (“Wellington Management”)
OFI Global Institutional, Inc. (“OFI Global”)
Portfolio Managers:
Kenneth L. Abrams is a Senior Managing Director and Equity Portfolio Manager at Wellington Management. He has managed the Fund since November 2001.
Daniel J. Fitzpatrick, CFA is a Senior Managing Director and Equity Research Analyst at Wellington Management. He has managed the Fund since November 2001.
Steven C. Angeli, CFA is a Senior Managing Director and Equity Portfolio Manager at Wellington Management. He has managed the Fund since April 2004.
Mario E. Abularach, CFA is a Senior Managing Director and Equity Research Analyst at Wellington Management. He has managed the Fund since April 2006.
Stephen Mortimer is a Senior Managing Director and Equity Portfolio Manager at Wellington Management. He has managed the Fund since April 2006.
Ronald Zibelli, Jr., CFA is a Senior Portfolio Manager at OFI Global. He has managed the Fund since July 2015.
Ash Shah, CFA is a Senior Portfolio Manager at OFI Global. He has managed the Fund since July 2015.
PURCHASE AND SALE OF FUND SHARES
Shares of the Fund are generally available to retirement plans, other institutional investors, and individual retirement accounts. Fund shares are redeemable on any business day by written request, telephone or internet (available to certain customers).
TAX INFORMATION
The Fund intends to make distributions that may be taxed as ordinary income, qualified dividend income, or capital gains, unless you are an investor eligible for preferential tax treatment.
– 107 –
PAYMENTS TO BROKER-DEALERS AND OTHER FINANCIAL INTERMEDIARIES
If you purchase the Fund through a broker-dealer or other financial intermediary, the intermediary may receive a one-time or continuing payments from the Fund, MML Advisers or its affiliates, or others for the sale of Fund shares or continuing shareholder
services provided by the intermediary. These payments may create a conflict of interest by influencing the broker-dealer or other intermediary to recommend the Fund over another investment. You should contact your intermediary to obtain more information about the compensation it may receive in connection with your investment.
– 108 –
[THIS PAGE INTENTIONALLY LEFT BLANK]
MassMutual Select Diversified International Fund
INVESTMENT OBJECTIVE
This Fund seeks growth of capital over the long-term.
FEES AND EXPENSES OF THE FUND
This table describes the fees and expenses that you may pay if you buy and hold shares of the Fund. For Class A shares, you may qualify for sales charge discounts if you invest, or agree to invest in the future, at least $25,000 in MassMutual funds. More information about these and other discounts is available in the section titled Sales Charges by Class beginning on page 145 of the Fund’s Prospectus or from your financial professional.
Shareholder Fees (fees paid directly from your investment)
| Class I | Class R5 | Service Class | Administrative Class | Class A | Class R4 | Class R3 | ||||||||
Maximum Sales Charge (Load) Imposed on Purchases (as a % of offering price) | None | None | None | None | 5.75% | None | None | |||||||
Maximum Deferred Sales Charge (Load) (as a % of the lower of the original offering price or redemption proceeds) | None | None | None | None | None | None | None |
Annual Fund Operating Expenses (expenses that you pay each year as a percentage of the value of your investment)
| Class I | Class R5 | Service Class | Adminis- trative | Class A | Class R4 | Class R3 | ||||||||||||||||||||||
Management Fees | .80% | .80% | .80% | .80% | .80% | .80% | .80% | |||||||||||||||||||||
Distribution and Service (Rule 12b-1) Fees | None | None | None | None | .25% | .25% | .50% | |||||||||||||||||||||
Other Expenses | .40% | .50% | .60% | .70% | .70% | .60% | .60% | |||||||||||||||||||||
Total Annual Fund Operating Expenses | 1.20% | 1.30% | 1.40% | 1.50% | 1.75% | 1.65% | 1.90% | |||||||||||||||||||||
Expense Reimbursement | (.30% | ) | (.30% | ) | (.30% | ) | (.30% | ) | (.30% | ) | (.30% | ) | (.30% | ) | ||||||||||||||
Total Annual Fund | .90% | 1.00% | 1.10% | 1.20% | 1.45% | 1.35% | 1.60% | |||||||||||||||||||||
| (1) | The expenses in the above table reflect a written agreement by MML Advisers to cap the fees and expenses of the Fund (other than extraordinary litigation and legal expenses, Acquired Fund fees and expenses, interest expense, short sale dividend and loan expense, or other non-recurring or unusual expenses such as organizational expenses and shareholder meeting expenses) through January 31, 2018, to the extent that Total Annual Fund Operating Expenses after Expense Reimbursement would otherwise exceed .90%, 1.00%, 1.10%, 1.20%, 1.45%, 1.35%, and 1.60% for Classes I, R5, Service, Administrative, A, R4, and R3, respectively. The Total Annual Fund Operating Expenses after Expense Reimbursement shown in the above table may exceed these amounts, because, as noted in the previous sentence, certain fees and expenses are excluded from the cap. The agreement can only be terminated by mutual consent of the Board of Trustees on behalf of the Fund and MML Advisers. |
Example
This example is intended to help you compare the cost of investing in the Fund with the cost of investing in other mutual funds. It assumes that you invest $10,000 in each share class of the Fund for the time periods indicated and then redeem all of your shares at the end of those periods. For Class A shares, the example includes the initial sales charge. The example also assumes that your investment earns a 5% return each year and that the Fund’s operating expenses are exactly as described in the preceding table. Although your actual costs may be higher or lower, based on these assumptions your costs would be:
| 1 Year | 3 Years | 5 Years | 10 Years | |||||||||||||
Class I | $ | 92 | $ | 351 | $ | 631 | $ | 1,428 | ||||||||
Class R5 | $ | 102 | $ | 382 | $ | 684 | $ | 1,541 | ||||||||
Service Class | $ | 112 | $ | 414 | $ | 737 | $ | 1,654 | ||||||||
Administrative Class | $ | 122 | $ | 445 | $ | 790 | $ | 1,765 | ||||||||
Class A | $ | 714 | $ | 1,067 | $ | 1,443 | $ | 2,495 | ||||||||
Class R4 | $ | 137 | $ | 491 | $ | 869 | $ | 1,929 | ||||||||
Class R3 | $ | 163 | $ | 568 | $ | 999 | $ | 2,198 | ||||||||
Portfolio Turnover
The Fund pays transaction costs, such as commissions, when it buys and sells securities (or “turns over” its portfolio). A higher portfolio turnover rate may indicate higher transaction costs and may result in higher taxes when Fund shares are held in a taxable account. These costs, which are not reflected in annual fund operating expenses or in the example, affect the Fund’s performance. During the most recent fiscal year, the Fund’s portfolio turnover rate was 84% of the average value of its portfolio.
– 110 –
INVESTMENTS, RISKS, AND PERFORMANCE
Principal Investment Strategies
The Fund invests primarily in equity securities from developed countries included in the MSCI EAFE Value Index (the “Index”), which is the Fund’s benchmark. As of December 31, 2016, the Index consisted of the following 21 developed market country indices: Australia, Austria, Belgium, Denmark, Finland, France, Germany, Hong Kong, Ireland, Israel, Italy, Japan, the Netherlands, New Zealand, Norway, Portugal, Singapore, Spain, Sweden, Switzerland, and the United Kingdom. The Fund may invest up to 15% of its total assets in equity securities of issuers in emerging markets countries. The Fund typically does not invest in U.S. companies. The Fund may invest a substantial part of its assets in just one region or country.
Equity securities in which the Fund invests may include common stocks, preferred stocks, securities convertible into common or preferred stock, depositary receipts, rights and warrants to buy common stocks, and privately placed securities.
The Fund pursues a value style when selecting investments for purchase. While focusing primarily on larger cap securities, on occasion, the Fund may purchase small/mid cap investments. The Fund may invest in securities denominated in U.S. dollars, major reserve currencies, and currencies of other countries in which it can invest.
The Fund may but will not necessarily engage in foreign currency forward contracts to seek to hedge or to attempt to protect against adverse changes in currency exchange rates. The Fund may use futures contracts as a substitute for direct investments. Use of derivatives by the Fund may create investment leverage. The Fund may hold a portion of its assets in cash or cash equivalents.
In choosing stocks for the Fund, the Fund’s subadviser, J.P. Morgan Investment Management Inc. (“J.P. Morgan”), uses fundamental research to estimate the future earnings of companies, including cash flows and dividends. J.P. Morgan relates those earnings to the current share price to rank companies within industries from most to least attractive. J.P. Morgan then buys and sells stocks, using the research and valuation rankings, as well as its assessment of other factors, including:
| · | value characteristics such as low price to book and price to earnings ratios; |
| · | catalysts that could trigger a change in a stock’s price; |
| · | potential reward compared to potential risk; and |
| · | temporary mispricings caused by market overreactions. |
Principal Risks
The following are the Principal Risks of the Fund. The value of your investment in the Fund could go down as well as up. You can lose money by investing in the Fund.
Cash Position Risk If the Fund holds a significant portion of its assets in cash or cash equivalents, its investment returns may be adversely affected and the Fund may not achieve its investment objective.
Convertible Securities Risk Convertible securities are subject to the risks of both debt instruments and equity securities. The price of a convertible security may change in response to changes in price of the underlying equity security, the credit quality of the issuer, and interest rates. In general, the values of convertible securities tend to decline as interest rates rise and to rise when interest rates fall. A convertible security generally has less potential for gain or loss than the underlying equity security.
Derivatives Risk Derivatives can be highly volatile and involve risks different from, and potentially greater than, direct investments, including risks of imperfect correlation between the value of derivatives and underlying assets, counterparty default, potential losses that partially or completely offset gains, and illiquidity. Derivatives can create investment leverage. Losses from derivatives can be substantially greater than the derivatives’ original cost and can sometimes be unlimited. If the value of a derivative does not correlate well with the particular market or asset class the derivative is designed to provide exposure to, the derivative may not have the effect anticipated. Derivatives can also reduce the opportunity for gains or result in losses by offsetting positive returns in other investments. Many derivatives are traded in the over-the-counter market and not on exchanges.
Equity Securities Risk Although stocks may have the potential to outperform other asset classes over the long term, their prices tend to fluctuate more dramatically over the shorter term. These movements may result from factors affecting individual companies, or from broader influences like changes
– 111 –
in interest rates, market conditions, investor confidence, or announcements of economic, political, or financial information. While potentially offering greater opportunities for capital growth than larger, more established companies, the stocks of smaller companies may be particularly volatile, especially during periods of economic uncertainty. These companies may face less certain growth prospects, or depend heavily on a limited line of products and services or the efforts of a small number of key management personnel.
Foreign Investment Risk; Emerging Markets Risk; Currency Risk Investments in securities of non-U.S. issuers (including depositary receipts) entail risks not typically associated with investing in securities of U.S. issuers. Similar risks may apply to securities traded on a U.S. securities exchange that are issued by companies with significant exposure to non-U.S. countries. In certain countries, legal remedies available to investors may be more limited than those available with regard to U.S. investments. Because non-U.S. securities are normally denominated and traded in currencies other than the U.S. dollar, the value of the Fund’s assets may be affected favorably or unfavorably by currency exchange rates, exchange control regulations, and restrictions or prohibitions on the repatriation of non-U.S. currencies. Income and gains with respect to investments in certain countries may be subject to withholding and other taxes. There may be less information publicly
available about a non-U.S. company than about a U.S. company, and many non-U.S. companies are not subject to accounting, auditing, and financial reporting standards, regulatory framework and practices comparable to those in the U.S. Foreign investments may be subject to the risks of seizure by a foreign government, imposition of restrictions on the exchange or export of foreign currency, other economic sanctions, and tax increases. The securities of some non-U.S. companies, especially those in emerging markets, are less liquid and at times more volatile than securities of comparable U.S. companies. Emerging markets securities are subject to greater risks than securities issued in developed foreign markets, including less liquidity, greater price volatility, higher relative rates of inflation, greater political, economic, and social instability, greater custody and operational risks, and greater volatility in currency exchange rates. Non-U.S. transaction costs, such as brokerage commissions and custody costs may be higher than in the United States. In addition, there may be a possibility of nationalization or expropriation of assets, imposition of currency
exchange controls, confiscatory taxation, political or financial instability, and diplomatic developments that could adversely affect the values of the Fund’s investments in certain non-U.S. countries.
Geographic Focus Risk When the Fund focuses investments on a particular country, group of countries, or geographic region, its performance will be closely tied to the market, currency, economic, political, or regulatory conditions and developments in those countries or that region, and could be more volatile than the performance of more geographically diversified funds.
Large Company Risk Large-capitalization stocks as a group could fall out of favor with the market, causing the Fund to underperform investments that focus on small- or medium-capitalization stocks. Larger, more established companies may be slow to respond to challenges and may grow more slowly than smaller companies.
Liquidity Risk Certain securities may be difficult (or impossible) to sell or positions difficult to close out at a desirable time and price, and the Fund may be required to hold an illiquid investment that is declining in value, or it may be required to sell certain illiquid investments at a price or time that is not advantageous in order to meet redemptions or other cash needs. Some securities may be subject to restrictions on resale. There can be no assurance that there will be a liquid market for instruments held by the Fund at any time.
Management Risk The Fund relies on the manager’s investment analysis and its selection of investments to achieve its investment objective. There can be no assurance that the Fund will achieve the intended results and the Fund may incur significant losses.
Market Risk The value of the Fund’s portfolio securities may decline, at times sharply and unpredictably, as a result of unfavorable market-induced changes affecting particular industries, sectors, or issuers. Stock markets can decline significantly in response to issuer, market, economic, industry, political, regulatory, geopolitical and other conditions, as well as investor perceptions of these conditions. The Fund is subject to risks affecting issuers, such as management performance, financial leverage, industry problems, and reduced demand for goods or services.
Preferred Stock Risk Like other equity securities, preferred stock is subject to the risk that its value
– 112 –
may decrease based on actual or perceived changes in the business or financial condition of the issuer. In addition, changes in interest rates may adversely affect the value of a preferred stock that pays a fixed dividend.
Smaller and Mid-Cap Company Risk Market risk and liquidity risk are particularly pronounced for securities of smaller companies, which may trade less frequently and in smaller volumes than more widely-held securities, and may fluctuate in price more than other securities. Their shares can be less liquid than those of larger companies, especially during market declines. Smaller companies may have limited product lines, markets, or financial resources and may be dependent on a limited management group; they may have been recently organized and have little or no track record of success.
Valuation Risk The Fund is subject to the risk of mispricing or improper valuation of its investments, in particular to the extent that its securities are fair valued.
Value Company Risk The value investment approach entails the risk that the market will not recognize a security’s intrinsic value for a long time, or that a stock the investment adviser or subadviser judges to be undervalued may actually be appropriately priced.
Performance Information
The following bar chart and table provide some indication of the risks of investing in the Fund. As a result of significant redemptions from Class R5 shares of the Fund, going forward the performance of the Fund’s Service Class shares will be shown in the bar chart rather than the performance of its Class R5 shares. The bar chart shows changes in the Fund’s performance from year to year for Service Class shares. The table shows how the Fund’s average annual returns for 1, 5, and 10 years compare with those of a broad measure of market performance. Performance for Class I, Class R4, and Class R3 shares of the Fund for periods prior to their inception date (04/01/14) is based on the performance of Class R5 shares, adjusted for Class R4 and Class R3 shares to reflect Class R4 and Class R3 expenses, respectively. Performance for Class A shares of the Fund reflects any applicable sales charge. Past performance (before and after taxes) is not necessarily an indication of how the Fund will perform in the future. More up-to-date performance information is available at http://www.massmutual.com/funds or by calling 1-888-309-3539.
Annual Performance
Service Class Shares
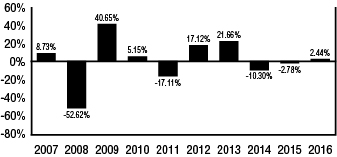
Highest Quarter: | 2Q ’09, | 27.71% | Lowest Quarter: | 4Q ’08, | - | 28.90% |
After-tax returns are calculated using the historical highest individual federal marginal income tax rates and do not reflect the impact of state and local taxes. Actual after-tax returns depend on an investor’s tax situation and may differ from those shown. After-tax returns are not relevant to investors who hold Fund shares through tax-advantaged arrangements, such as 401(k) plans or individual retirement accounts. After-tax returns are shown for Service Class only. As a result of significant redemptions from Class R5 shares of the Fund, going forward the after-tax returns of the Fund’s Service Class shares will be shown rather than the after-tax returns of its Class R5 shares. After-tax returns for other classes will vary.
Average Annual Total Returns
(for the periods ended December 31, 2016)
| One Year | Five Years | Ten | ||||||||||||
Service Class | Return Before Taxes | 2.44% | 4.94% | -2.16% | ||||||||||
| Return After Taxes on Distributions | 1.11% | 4.28% | -2.58% | |||||||||||
| Return After Taxes on Distributions and Sales of Fund Shares | 2.42% | 3.88% | -1.51% | |||||||||||
Class R5 | Return Before Taxes | -22.96% | -0.78% | -4.79% | ||||||||||
Class I | Return Before Taxes | 2.54% | 5.11% | -2.01% | ||||||||||
Administrative Class | Return Before Taxes | 2.41% | 4.77% | -2.27% | ||||||||||
Class A | Return Before Taxes | -3.70% | 3.36% | -3.06% | ||||||||||
Class R4 | Return Before Taxes | 2.18% | 4.70% | -2.37% | ||||||||||
– 113 –
| One Year | Five Years | Ten | ||||||||||||
Class R3 | Return Before Taxes | 1.94% | 4.45% | -2.61% | ||||||||||
MSCI EAFE Value Index (Reflects no deduction for fees, expense, or taxes) | 5.02% | 6.28% | -0.22% | |||||||||||
MANAGEMENT
Investment Adviser: MML Investment Advisers, LLC (“MML Advisers”)
Subadviser: J.P. Morgan Investment Management Inc. (“J.P. Morgan”)
Portfolio Managers:
Gerd Woort-Menker, CFA is a Managing Director and Portfolio Manager at J.P. Morgan. He has managed the Fund since June 2011. Upon his retirement in the 2nd quarter of 2017, Mr. Woort-Menker will no longer be a portfolio manager of the Fund.
Jeroen Huysinga is a Managing Director and Portfolio Manager at J.P. Morgan. He has managed the Fund since June 2011.
Georgina Perceval Maxwell is a Managing Director and Portfolio Manager at J.P. Morgan. She has managed the Fund since June 2011.
Demetris Georghiou is an Executive Director and Portfolio Manager at J.P. Morgan. He has managed the Fund since May 2016.
PURCHASE AND SALE OF FUND SHARES
Shares of the Fund are generally available to retirement plans, other institutional investors, and individual retirement accounts. Fund shares are redeemable on any business day by written request, telephone or internet (available to certain customers).
TAX INFORMATION
The Fund intends to make distributions that may be taxed as ordinary income, qualified dividend income, or capital gains, unless you are an investor eligible for preferential tax treatment.
PAYMENTS TO BROKER-DEALERS AND OTHER FINANCIAL INTERMEDIARIES
If you purchase the Fund through a broker-dealer or other financial intermediary, the intermediary may receive a one-time or continuing payments from the Fund, MML Advisers or its affiliates, or others for the sale of Fund shares or continuing shareholder services provided by the intermediary. These payments may create a conflict of interest by influencing the broker-dealer or other intermediary to recommend the Fund over another investment. You should contact your intermediary to obtain more information about the compensation it may receive in connection with your investment.
– 114 –
[THIS PAGE INTENTIONALLY LEFT BLANK]
MM MSCI EAFE® International Index Fund
INVESTMENT OBJECTIVE
The Fund seeks to provide investment results approximating (before fees and expenses) the aggregate price and dividend performance of the securities included in the MSCI EAFE Index*.
FEES AND EXPENSES OF THE FUND
This table describes the fees and expenses that you may pay if you buy and hold shares of the Fund. For Class A shares, you may qualify for sales charge discounts if you invest, or agree to invest in the future, at least $25,000 in MassMutual funds. More information about these and other discounts is available in the section titled Sales Charges by Class beginning on page 145 of the Fund’s Prospectus or from your financial professional.
Shareholder Fees (fees paid directly from your investment)
| Class I | Class R5 | Service Class | Administrative Class | Class A | Class R4 | Class R3 | ||||||||
Maximum Sales Charge (Load) Imposed on Purchases (as a % of offering price) | None | None | None | None | 5.75% | None | None | |||||||
Maximum Deferred Sales Charge (Load) (as a % of the lower of the original offering price or redemption proceeds) | None | None | None | None | None | None | None |
* The Fund is not sponsored, endorsed, sold, or promoted by MSCI Inc. (“MSCI”), any of its affiliates, any of its information providers, or any other third party involved in, or related to, compiling, computing, or creating any MSCI index (collectively, the “MSCI Parties”). The MSCI indexes are the exclusive property of MSCI. MSCI and the MSCI index names are service mark(s) of MSCI or its affiliates and have been licensed for use for certain purposes by MML Advisers. None of the MSCI Parties makes any representation or warranty, express or implied, to the issuer or owners of the Fund or any other person or entity regarding the advisability of investing in funds generally or in the Fund particularly or the ability of any MSCI index to track corresponding stock market performance.
Annual Fund Operating Expenses (expenses that you pay each year as a percentage of the value of your investment)
| Class I | Class R5 | Service Class | Administrative Class | Class A | Class R4 | Class R3 | |||||||||||||||||||||||||||||
Management Fees | .10% | .10% | .10% | .10% | .10% | .10% | .10% | ||||||||||||||||||||||||||||
Distribution and Service | None | None | None | None | .25% | .25% | .50% | ||||||||||||||||||||||||||||
Other Expenses | .15% | .25% | .40% | .50% | .50% | .40% | .40% | ||||||||||||||||||||||||||||
Total Annual Fund Operating Expenses | .25% | .35% | .50% | .60% | .85% | .75% | 1.00% | ||||||||||||||||||||||||||||
Example
This example is intended to help you compare the cost of investing in the Fund with the cost of investing in other mutual funds. It assumes that you invest $10,000 in each share class of the Fund for the time periods indicated and then redeem all of your shares at the end of those periods. For Class A shares, the example includes the initial sales charge. The example also assumes that your investment earns a 5% return each year and that the Fund’s operating expenses are exactly as described in the preceding table. Although your actual costs may be higher or lower, based on these assumptions your costs would be:
| 1 Year | 3 Years | 5 Years | 10 Years | |||||||||||||
Class I | $ | 26 | $ | 80 | $ | 141 | $ | 318 | ||||||||
Class R5 | $ | 36 | $ | 113 | $ | 197 | $ | 443 | ||||||||
Service Class | $ | 51 | $ | 160 | $ | 280 | $ | 628 | ||||||||
Administrative Class | $ | 61 | $ | 192 | $ | 335 | $ | 750 | ||||||||
Class A | $ | 657 | $ | 831 | $ | 1,019 | $ | 1,564 | ||||||||
Class R4 | $ | 77 | $ | 240 | $ | 417 | $ | 930 | ||||||||
Class R3 | $ | 102 | $ | 318 | $ | 552 | $ | 1,225 | ||||||||
Portfolio Turnover
The Fund pays transaction costs, such as commissions, when it buys and sells securities (or “turns over” its portfolio). A higher portfolio turnover rate may indicate higher transaction costs and may result in higher taxes when Fund shares are held in a taxable account. These costs, which are not reflected in annual fund operating expenses or in the example, affect the Fund’s performance. During the most recent fiscal year, the Fund’s portfolio turnover rate was 26% of the average value of its portfolio.
– 116 –
INVESTMENTS, RISKS, AND PERFORMANCE
Principal Investment Strategies
Under normal circumstances, the Fund invests at least 80% (and, typically, substantially all) of its net assets (plus the amount of any borrowings for investment purposes) in the equity securities of companies included in the MSCI EAFE Index (“Index”), in weightings that approximate the relative composition of the securities contained in the Index, and in MSCI EAFE Index futures contracts. The Index is a widely recognized, unmanaged index representative of equity securities in developed markets, excluding the U.S. and Canada. As of December 31, 2016, the market capitalization range of companies included in the Index was $1.21 billion to $236.06 billion, and the Index consisted of the following 21 developed market country indices: Australia, Austria, Belgium, Denmark, Finland, France, Germany, Hong Kong, Ireland, Israel, Italy, Japan, the Netherlands, New Zealand, Norway, Portugal, Singapore, Spain, Sweden, Switzerland, and the United Kingdom. If the securities represented in the Index were to become concentrated in any particular industry, the Fund’s investments would likewise be concentrated in securities of issuers in that industry; the Index is not currently concentrated in any single industry.
The Fund is passively managed, which means it tries to duplicate the investment composition and performance of the Index by using computer programs and statistical procedures. The Fund’s subadviser, Northern Trust Investments, Inc. (“NTI”), will buy and sell securities in response to changes in the Index. The Fund may use Index futures contracts, a type of derivative, to gain exposure to the Index in lieu of investing in cash, or to reduce its exposure to the Index while it sells the securities in its portfolio. Use of Index futures contracts by the Fund may create investment leverage. Because the Fund, unlike the Index, is subject to fees and transaction expenses, the Fund’s returns are likely to be less than those of the Index.
Because the proportion of assets allocated to each country will approximate the relative country weights in the Index, more than 25% of the Fund’s assets may be invested in a single country (such as the United Kingdom and Japan). This may make the Fund’s performance more dependent upon the performance of a single country than if the Fund allocated its assets among issuers in a larger number of countries.
NTI expects that, under normal circumstances, the annual performance of the Fund, before fees and expenses, will track the performance of the Index within a 0.95 correlation coefficient.
Principal Risks
The following are the Principal Risks of the Fund. The value of your investment in the Fund could go down as well as up. You can lose money by investing in the Fund.
Cash Position Risk If the Fund holds a significant portion of its assets in cash or cash equivalents, its investment returns may be adversely affected and the Fund may not achieve its investment objective.
Derivatives Risk Derivatives can be highly volatile and involve risks different from, and potentially greater than, direct investments, including risks of imperfect correlation between the value of derivatives and underlying assets, counterparty default, potential losses that partially or completely offset gains, and illiquidity. Derivatives can create investment leverage. Losses from derivatives can be substantially greater than the derivatives’ original cost and can sometimes be unlimited. If the value of a derivative does not correlate well with the particular market or asset class the derivative is designed to provide exposure to, the derivative may not have the effect anticipated. Derivatives can also reduce the opportunity for gains or result in losses by offsetting positive returns in other investments. Many derivatives are traded in the over-the-counter market and not on exchanges.
Equity Securities Risk Although stocks may have the potential to outperform other asset classes over the long term, their prices tend to fluctuate more dramatically over the shorter term. These movements may result from factors affecting individual companies, or from broader influences like changes in interest rates, market conditions, investor confidence, or announcements of economic, political, or financial information. While potentially offering greater opportunities for capital growth than larger, more established companies, the stocks of smaller companies may be particularly volatile, especially during periods of economic uncertainty. These companies may face less certain growth prospects, or depend heavily on a limited line of products and services or the efforts of a small number of key management personnel.
– 117 –
Foreign Investment Risk; Emerging Markets Risk; Currency Risk Investments in securities of non-U.S. issuers (including depositary receipts) entail risks not typically associated with investing in securities of U.S. issuers. Similar risks may apply to securities traded on a U.S. securities exchange that are issued by companies with significant exposure to non-U.S. countries. In certain countries, legal remedies available to investors may be more limited than those available with regard to U.S. investments. Because non-U.S. securities are normally denominated and traded in currencies other than the U.S. dollar, the value of the Fund’s assets may be affected favorably or unfavorably by currency exchange rates, exchange control regulations, and restrictions or prohibitions on the repatriation of non-U.S. currencies. Income and gains with respect to investments in certain countries may be subject to withholding and other taxes. There may be less information publicly available about a non-U.S. company than about a U.S. company, and many non-U.S. companies are not subject to accounting, auditing, and financial reporting standards, regulatory framework and practices comparable to those in the U.S. Foreign investments may be subject to the risks of seizure by a foreign government, imposition of restrictions on the exchange or export of foreign currency, other economic sanctions, and tax increases. The securities of some non-U.S. companies, especially those in emerging markets, are less liquid and at times more volatile than securities of comparable U.S. companies. Emerging markets securities are subject to greater risks than securities issued in developed foreign markets, including less liquidity, greater price volatility, higher relative rates of inflation, greater political, economic, and social instability, greater custody and operational risks, and greater volatility in currency exchange rates. Non-U.S. transaction costs, such as brokerage commissions and custody costs may be higher than in the United States. In addition, there may be a possibility of nationalization or expropriation of assets, imposition of currency exchange controls, confiscatory taxation, political or financial instability, and diplomatic developments that could adversely affect the values of the Fund’s investments in certain non-U.S. countries.
Geographic Focus Risk When the Fund focuses investments on a particular country, group of countries, or geographic region, its performance will be closely tied to the market, currency, economic, political, or regulatory conditions and developments in those countries or that region, and could be more
volatile than the performance of more geographically diversified funds.
Indexing Risk The Fund’s performance may not track the performance of the index exactly due to a number of factors, including fees and expenses of the Fund, the Fund’s cash positions, and differences between securities held by the Fund and the securities comprising the index.
Industry Concentration Risk The Fund may concentrate its assets in a particular industry or group of industries. This could increase the volatility of the Fund’s portfolio, and the Fund’s performance may be more susceptible to developments affecting issuers in that industry or group of industries than if the Fund invested more broadly.
Large Company Risk Large-capitalization stocks as a group could fall out of favor with the market, causing the Fund to underperform investments that focus on small- or medium-capitalization stocks. Larger, more established companies may be slow to respond to challenges and may grow more slowly than smaller companies.
Management Risk The Fund relies on the manager’s investment analysis and its selection of investments to achieve its investment objective. There can be no assurance that the Fund will achieve the intended results and the Fund may incur significant losses.
Market Risk The value of the Fund’s portfolio securities may decline, at times sharply and unpredictably, as a result of unfavorable market-induced changes affecting particular industries, sectors, or issuers. Stock markets can decline significantly in response to issuer, market, economic, industry, political, regulatory, geopolitical and other conditions, as well as investor perceptions of these conditions. The Fund is subject to risks affecting issuers, such as management performance, financial leverage, industry problems, and reduced demand for goods or services.
Valuation Risk The Fund is subject to the risk of mispricing or improper valuation of its investments, in particular to the extent that its securities are fair valued.
Performance Information
The following bar chart and table provide some indication of the risks of investing in the Fund. The bar chart shows changes in the Fund’s performance from year to year for Class I shares. The table shows
– 118 –
how the Fund’s average annual returns for 1 year, and since inception, compare with those of a broad measure of market performance. Performance for Class R4 and Class R3 shares of the Fund for periods prior to their inception date (04/01/14) is based on the performance of Class R5 shares, adjusted to reflect Class R4 and Class R3 expenses, respectively. Performance for Class A shares of the Fund reflects any applicable sales charge. Past performance (before and after taxes) is not necessarily an indication of how the Fund will perform in the future. More up-to-date performance information is available at http://www.massmutual.com/funds or by calling 1-888-309-3539.
Annual Performance
Class I Shares
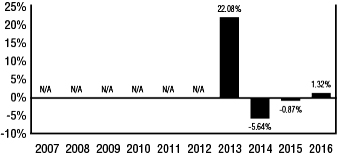
Highest Quarter: | 3Q ’13, | 11.64% | Lowest Quarter: | 3Q ’15, | - | 9.95% |
After-tax returns are calculated using the historical highest individual federal marginal income tax rates and do not reflect the impact of state and local taxes. Actual after-tax returns depend on an investor’s tax situation and may differ from those shown. After-tax returns are not relevant to investors who hold Fund shares through tax-advantaged arrangements, such as
401(k) plans or individual retirement accounts. After-tax returns are shown for Class I only. After-tax returns for other classes will vary.
Average Annual Total Returns
(for the periods ended December 31, 2016)
| One Year | Since Inception (07/25/12) | |||||||||
| Class I | Return Before Taxes | 1.32% | 7.58% | |||||||
| Return After Taxes on Distributions | -0.33% | 6.27% | ||||||||
| Return After Taxes on Distributions and Sales of Fund Shares | 2.12% | 5.83% | ||||||||
| Class R5 | Return Before Taxes | 1.05% | 7.45% | |||||||
| Service Class | Return Before Taxes | 1.00% | 7.29% | |||||||
Administrative Class | Return Before Taxes | 0.89% | 7.18% | |||||||
| Class A | Return Before Taxes | -5.20% | 5.49% | |||||||
| Class R4 | Return Before Taxes | 0.71% | 6.99% | |||||||
| Class R3 | Return Before Taxes | 0.44% | 6.74% | |||||||
| MSCI EAFE Index (reflects no deduction for fees or expenses) | 1.00% | 7.66% | ||||||||
MANAGEMENT
Investment Adviser: MML Investment Advisers, LLC (“MML Advisers”)
Subadviser: Northern Trust Investments, Inc. (“NTI”)
Portfolio Manager: Steven Santiccioli is a Vice President at NTI. He has managed the Fund since October 2013.
PURCHASE AND SALE OF FUND SHARES
Shares of the Fund are generally available to retirement plans, other institutional investors, and individual retirement accounts. Fund shares are redeemable on any business day by written request, telephone or internet (available to certain customers).
TAX INFORMATION
The Fund intends to make distributions that may be taxed as ordinary income, qualified dividend income, or capital gains, unless you are an investor eligible for preferential tax treatment.
PAYMENTS TO BROKER-DEALERS AND OTHER FINANCIAL INTERMEDIARIES
If you purchase the Fund through a broker-dealer or other financial intermediary, the intermediary may receive a one-time or continuing payments from the Fund, MML Advisers or its affiliates, or others for
– 119 –
the sale of Fund shares or continuing shareholder services provided by the intermediary. These payments may create a conflict of interest by influencing the broker-dealer or other intermediary to
recommend the Fund over another investment. You should contact your intermediary to obtain more information about the compensation it may receive in connection with your investment.
– 120 –
[THIS PAGE INTENTIONALLY LEFT BLANK]
MassMutual Select Overseas Fund
INVESTMENT OBJECTIVE
The Fund seeks growth of capital over the long-term by investing in foreign equity securities.
FEES AND EXPENSES OF THE FUND
This table describes the fees and expenses that you may pay if you buy and hold shares of the Fund. For Class A shares, you may qualify for sales charge discounts if you invest, or agree to invest in the future, at least $25,000 in MassMutual funds. More information about these and other discounts is available in the section titled Sales Charges by Class beginning on page 145 of the Fund’s Prospectus or from your financial professional.
Shareholder Fees (fees paid directly from your investment)
| Class I | Class R5 | Service Class | Administrative Class | Class A | Class R4 | Class R3 | ||||||||
Maximum Sales Charge (Load) Imposed on Purchases (as a % of offering price) | None | None | None | None | 5.75% | None | None | |||||||
Maximum Deferred Sales Charge (Load) (as a % of the lower of the original offering price or redemption proceeds) | None | None | None | None | None | None | None |
Annual Fund Operating Expenses (expenses that you pay each year as a percentage of the value of your investment)
| Class I | Class R5 | Service Class | Administrative Class | Class A | Class R4 | Class R3 | ||||||||||
Management Fees | .80% | .80% | .80% | .80% | .80% | .80% | .80% | |||||||||
Distribution and Service | None | None | None | None | .25% | .25% | .50% | |||||||||
Other Expenses | .12% | .22% | .32% | .42% | .42% | .32% | .32% | |||||||||
Total Annual Fund Operating Expenses | .92% | 1.02% | 1.12% | 1.22% | 1.47% | 1.37% | 1.62% | |||||||||
Example
This example is intended to help you compare the cost of investing in the Fund with the cost of investing in other mutual funds. It assumes that you invest $10,000 in each share class of the Fund for the time periods indicated and then redeem all of your shares at the end of those periods. For Class A shares, the example includes the initial sales charge. The example also assumes that your investment earns a 5% return each year and that the Fund’s operating expenses are exactly as described in the preceding table. Although your actual costs may be higher or lower, based on these assumptions your costs would be:
| 1 Year | 3 Years | 5 Years | 10 Years | |||||||||||||
Class I | $ | 94 | $ | 293 | $ | 509 | $ | 1,131 | ||||||||
Class R5 | $ | 104 | $ | 325 | $ | 563 | $ | 1,248 | ||||||||
Service Class | $ | 114 | $ | 356 | $ | 617 | $ | 1,363 | ||||||||
Administrative Class | $ | 124 | $ | 387 | $ | 670 | $ | 1,477 | ||||||||
Class A | $ | 716 | $ | 1,013 | $ | 1,332 | $ | 2,231 | ||||||||
Class R4 | $ | 139 | $ | 434 | $ | 750 | $ | 1,646 | ||||||||
Class R3 | $ | 165 | $ | 511 | $ | 881 | $ | 1,922 | ||||||||
Portfolio Turnover
The Fund pays transaction costs, such as commissions, when it buys and sells securities (or “turns over” its portfolio). A higher portfolio turnover rate may indicate higher transaction costs and may result in higher taxes when Fund shares are held in a taxable account. These costs, which are not reflected in annual fund operating expenses or in the example, affect the Fund’s performance. During the most recent fiscal year, the Fund’s portfolio turnover rate was 38% of the average value of its portfolio.
INVESTMENTS, RISKS, AND PERFORMANCE
Principal Investment Strategies
Under normal circumstances, the Fund invests at least 80% of its net assets (plus the amount of any borrowings for investment purposes) in stocks of foreign companies, including companies located in Europe, Latin America, and Asia. The Fund may invest up to 25% of its total assets in equity securities of issuers in emerging markets. Equity securities may include common stocks, preferred stocks, securities convertible into common or preferred stocks, depositary receipts, rights and warrants, of issuers of any size. The Fund may but will not necessarily engage in foreign currency forward contracts to seek to hedge or to attempt to protect against adverse
– 122 –
changes in currency exchange rates. The Fund may use futures contracts as a substitute for direct investments. Use of derivatives by the Fund may create investment leverage. The Fund may hold a portion of its assets in cash or cash equivalents.
The Fund is managed by three subadvisers, J.P. Morgan Investment Management Inc. (“J.P. Morgan”), Massachusetts Financial Services Company (“MFS”), and Harris Associates L.P. (“Harris”), each being responsible for a portion of the portfolio, but not necessarily equally weighted. Each subadviser may invest a relatively high percentage of the Fund’s assets in a single country or sector, a small number of countries or sectors, or a particular geographic region.
In choosing stocks for the Fund, J.P. Morgan uses fundamental research to estimate the future earnings of companies, including cash flows and dividends. J.P. Morgan relates those earnings to the current share price to rank companies within industries from most to least attractive. J.P. Morgan then buys and sells stocks, using the research and valuation rankings, as well as its assessment of other factors, including:
| · | value characteristics such as low price to book and price to earnings ratios; |
| · | catalysts that could trigger a change in a stock’s price; |
| · | potential reward compared to potential risk; and |
| · | temporary mispricings caused by market overreactions. |
In selecting investments for the Fund, MFS is not constrained to any particular investment style. MFS may invest the Fund’s assets in the stocks of companies it believes to have above average earnings growth potential compared to other companies (growth companies), in the stocks of companies it believes are undervalued compared to their perceived worth (value companies), or in a combination of growth and value companies. MFS may invest the Fund’s assets in companies of any size. MFS uses a bottom-up investment approach to buying and selling investments for the Fund. Investments are selected primarily based on fundamental analysis of individual issuers and their potential in light of their financial condition, and market, economic, political, and regulatory conditions. Factors considered may include analysis of an issuer’s earnings, cash flows, competitive position, and management ability. Quantitative models that systematically evaluate an issuer’s valuation, price and
earnings momentum, earnings quality, and other factors may also be considered.
In selecting investments for the Fund, Harris uses a value investment philosophy. This investment philosophy is based upon the belief that, over time, a company’s stock price converges with Harris’ estimate of its intrinsic or true business value. Harris seeks to identify companies that it believes have discounted stock prices compared to the companies’ true business values. By “true business value,” Harris means an estimate of the price a knowledgeable buyer would pay to acquire the entire business. Harris usually sells a stock when the price approaches its estimated worth. This means that Harris sets specific “buy” and “sell” targets for each stock held by the Fund. Harris also monitors each holding and adjusts those price targets as warranted to reflect changes in a company’s fundamentals. Harris may from time to time have significant investments in one or more countries or in particular sectors.
Principal Risks
The following are the Principal Risks of the Fund. The value of your investment in the Fund could go down as well as up. You can lose money by investing in the Fund.
Cash Position Risk If the Fund holds a significant portion of its assets in cash or cash equivalents, its investment returns may be adversely affected and the Fund may not achieve its investment objective.
Convertible Securities Risk Convertible securities are subject to the risks of both debt instruments and equity securities. The price of a convertible security may change in response to changes in price of the underlying equity security, the credit quality of the issuer, and interest rates. In general, the values of convertible securities tend to decline as interest rates rise and to rise when interest rates fall. A convertible security generally has less potential for gain or loss than the underlying equity security.
Derivatives Risk Derivatives can be highly volatile and involve risks different from, and potentially greater than, direct investments, including risks of imperfect correlation between the value of derivatives and underlying assets, counterparty default, potential losses that partially or completely offset gains, and illiquidity. Derivatives can create investment leverage. Losses from derivatives can be substantially greater than the derivatives’ original cost and can sometimes be unlimited. If the value of
– 123 –
a derivative does not correlate well with the particular market or asset class the derivative is designed to provide exposure to, the derivative may not have the effect anticipated. Derivatives can also reduce the opportunity for gains or result in losses by offsetting positive returns in other investments. Many derivatives are traded in the over-the-counter market and not on exchanges.
Equity Securities Risk Although stocks may have the potential to outperform other asset classes over the long term, their prices tend to fluctuate more dramatically over the shorter term. These movements may result from factors affecting individual companies, or from broader influences like changes in interest rates, market conditions, investor confidence, or announcements of economic, political, or financial information. While potentially offering greater opportunities for capital growth than larger, more established companies, the stocks of smaller companies may be particularly volatile, especially during periods of economic uncertainty. These companies may face less certain growth prospects, or depend heavily on a limited line of products and services or the efforts of a small number of key management personnel.
Foreign Investment Risk; Emerging Markets Risk; Currency Risk Investments in securities of non-U.S. issuers (including depositary receipts) entail risks not typically associated with investing in securities of U.S. issuers. Similar risks may apply to securities traded on a U.S. securities exchange that are issued by companies with significant exposure to non-U.S. countries. In certain countries, legal remedies available to investors may be more limited than those available with regard to U.S. investments. Because non-U.S. securities are normally denominated and traded in currencies other than the U.S. dollar, the value of the Fund’s assets may be affected favorably or unfavorably by currency exchange rates, exchange control regulations, and restrictions or prohibitions on the repatriation of non-U.S. currencies. Income and gains with respect to investments in certain countries may be subject to withholding and other taxes. There may be less information publicly available about a non-U.S. company than about a U.S. company, and many non-U.S. companies are not subject to accounting, auditing, and financial reporting standards, regulatory framework and practices comparable to those in the U.S. Foreign investments may be subject to the risks of seizure by a foreign government, imposition of restrictions on the exchange or export of foreign currency, other
economic sanctions, and tax increases. The securities of some non-U.S. companies, especially those in emerging markets, are less liquid and at times more volatile than securities of comparable U.S. companies. Emerging markets securities are subject to greater risks than securities issued in developed foreign markets, including less liquidity, greater price volatility, higher relative rates of inflation, greater political, economic, and social instability, greater custody and operational risks, and greater volatility in currency exchange rates. Non-U.S. transaction costs, such as brokerage commissions and custody costs may be higher than in the United States. In addition, there may be a possibility of nationalization or expropriation of assets, imposition of currency exchange controls, confiscatory taxation, political or financial instability, and diplomatic developments that could adversely affect the values of the Fund’s investments in certain non-U.S. countries.
Geographic Focus Risk When the Fund focuses investments on a particular country, group of countries, or geographic region, its performance will be closely tied to the market, currency, economic, political, or regulatory conditions and developments in those countries or that region, and could be more volatile than the performance of more geographically diversified funds.
Growth Company Risk The prices of growth securities are often highly sensitive to market fluctuations because of their heavy dependence on future earnings expectations, and can be more volatile than the market in general.
Large Company Risk Large-capitalization stocks as a group could fall out of favor with the market, causing the Fund to underperform investments that focus on small- or medium-capitalization stocks. Larger, more established companies may be slow to respond to challenges and may grow more slowly than smaller companies.
Liquidity Risk Certain securities may be difficult (or impossible) to sell or positions difficult to close out at a desirable time and price, and the Fund may be required to hold an illiquid investment that is declining in value, or it may be required to sell certain illiquid investments at a price or time that is not advantageous in order to meet redemptions or other cash needs. Some securities may be subject to restrictions on resale. There can be no assurance that there will be a liquid market for instruments held by the Fund at any time.
– 124 –
Management Risk The Fund relies on the manager’s investment analysis and its selection of investments to achieve its investment objective. There can be no assurance that the Fund will achieve the intended results and the Fund may incur significant losses.
Market Risk The value of the Fund’s portfolio securities may decline, at times sharply and unpredictably, as a result of unfavorable market-induced changes affecting particular industries, sectors, or issuers. Stock markets can decline significantly in response to issuer, market, economic, industry, political, regulatory, geopolitical and other conditions, as well as investor perceptions of these conditions. The Fund is subject to risks affecting issuers, such as management performance, financial leverage, industry problems, and reduced demand for goods or services.
Preferred Stock Risk Like other equity securities, preferred stock is subject to the risk that its value may decrease based on actual or perceived changes in the business or financial condition of the issuer. In addition, changes in interest rates may adversely affect the value of a preferred stock that pays a fixed dividend.
Sector Risk The Fund may allocate more of its assets to certain economic, market, or industry sectors than to others. This could increase the volatility of the Fund’s portfolio, and the Fund’s performance may be more susceptible to developments affecting issuers in those sectors than if the Fund invested more broadly.
Smaller and Mid-Cap Company Risk Market risk and liquidity risk are particularly pronounced for securities of smaller companies, which may trade less frequently and in smaller volumes than more widely-held securities, and may fluctuate in price more than other securities. Their shares can be less liquid than those of larger companies, especially during market declines. Smaller companies may have limited product lines, markets, or financial resources and may be dependent on a limited management group; they may have been recently organized and have little or no track record of success.
Valuation Risk The Fund is subject to the risk of mispricing or improper valuation of its investments, in particular to the extent that its securities are fair valued.
Value Company Risk The value investment approach entails the risk that the market will not recognize a security’s intrinsic value for a long time, or that a stock the investment adviser or subadviser judges to be undervalued may actually be appropriately priced.
Performance Information
The following bar chart and table provide some indication of the risks of investing in the Fund. The bar chart shows changes in the Fund’s performance from year to year for Class R5 shares. The table shows how the Fund’s average annual returns for 1, 5, and 10 years compare with those of a broad measure of market performance. Performance for Class I shares of the Fund for periods prior to its inception date (11/15/10) is based on the performance of Class R5 shares. Performance for Class R4 shares of the Fund for periods prior to its inception date (04/01/14) is based on the performance of Class R5 shares, adjusted for Class R4 expenses. Performance for Class A shares of the Fund reflects any applicable sales charge. Past performance (before and after taxes) is not necessarily an indication of how the Fund will perform in the future. More up-to-date performance information is available at http://www.massmutual.com/funds or by calling 1-888-309-3539.
Annual Performance
Class R5 Shares
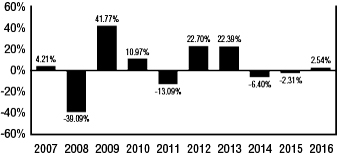
Highest Quarter: | 2Q ’09, | 25.60% | Lowest Quarter: | 4Q ’08, | - | 21.18% |
After-tax returns are calculated using the historical highest individual federal marginal income tax rates and do not reflect the impact of state and local taxes. Actual after-tax returns depend on an investor’s tax situation and may differ from those shown. After-tax returns are not relevant to investors who hold Fund shares through tax-advantaged arrangements, such as 401(k) plans or individual retirement accounts. After-tax returns are shown for Class R5 only. After-tax returns for other classes will vary.
– 125 –
Average Annual Total Returns
(for the periods ended December 31, 2016)
One Year | Five Years | Ten Years | ||||||||||||
| Class R5 | Return Before Taxes | 2.54% | 7.08% | 2.02% | ||||||||||
| Return After Taxes on Distributions | 2.16% | 6.49% | 1.35% | |||||||||||
| Return After Taxes on Distributions and Sales of Fund Shares | 2.00% | 5.55% | 1.74% | |||||||||||
| Class I | Return Before Taxes | 2.66% | 7.29% | 2.14% | ||||||||||
| Service Class | Return Before Taxes | 2.45% | 6.99% | 1.95% | ||||||||||
| Administrative Class | Return Before Taxes | 2.34% | 6.89% | 1.88% | ||||||||||
| Class A | Return Before Taxes | -3.76% | 5.42% | 1.03% | ||||||||||
| Class R4 | Return Before Taxes | 2.18% | 6.68% | 1.65% | ||||||||||
| Class R3 | Return Before Taxes | 1.94% | 6.41% | 1.37% | ||||||||||
| MSCI EAFE Index (reflects no deduction for fees or expenses) | 1.00% | 6.53% | 0.75% | |||||||||||
MANAGEMENT
Investment Adviser: MML Investment Advisers, LLC (“MML Advisers”)
Subadvisers: J.P. Morgan Investment Management Inc. (“J.P. Morgan”)
Massachusetts Financial Services Company (“MFS”)
Harris Associates L.P. (“Harris”)
Portfolio Managers:
Gerd Woort-Menker, CFA is a Managing Director and Portfolio Manager at J.P. Morgan. He has managed the Fund since June 2011. Upon his retirement in the 2nd quarter of 2017, Mr. Woort-Menker will no longer be a portfolio manager of the Fund.
Jeroen Huysinga is a Managing Director and Portfolio Manager at J.P. Morgan. He has managed the Fund since June 2011.
Georgina Perceval Maxwell is a Managing Director and Portfolio Manager at J.P. Morgan. She has managed the Fund since June 2011.
Demetris Georghiou is an Executive Director and Portfolio Manager at J.P. Morgan. He has managed the Fund since May 2016.
Daniel Ling is an Investment Officer at MFS. He has managed the Fund since October 2009.
Marcus Smith is an Investment Officer at MFS. He has managed the Fund since September 2005. Effective April 1, 2017, Mr. Smith will no longer be a portfolio manager of the Fund.
Filipe Benzinho is an Investment Officer at MFS. He has managed the Fund since May 2016.
David G. Herro, CFA is the Deputy Chairman, the Chief Investment Officer of International Equities, and a Portfolio Manager at Harris. He has managed the Fund since July 2001.
Michael L. Manelli, CFA is a Vice President, a Portfolio Manager, and an International Investment Analyst at Harris. He has managed the Fund since January 2017.
PURCHASE AND SALE OF FUND SHARES
Shares of the Fund are generally available to retirement plans, other institutional investors, and individual retirement accounts. Fund shares are redeemable on any business day by written request, telephone or internet (available to certain customers).
TAX INFORMATION
The Fund intends to make distributions that may be taxed as ordinary income, qualified dividend income, or capital gains, unless you are an investor eligible for preferential tax treatment.
PAYMENTS TO BROKER-DEALERS AND OTHER FINANCIAL INTERMEDIARIES
If you purchase the Fund through a broker-dealer or other financial intermediary, the intermediary may receive a one-time or continuing payments from the Fund, MML Advisers or its affiliates, or others for the sale of Fund shares or continuing shareholder services provided by the intermediary. These payments may create a conflict of interest by influencing the broker-dealer or other intermediary to recommend the Fund over another investment. You should contact your intermediary to obtain more information about the compensation it may receive in connection with your investment.
– 126 –
Additional Information Regarding Investment Objectives and Principal Investment Strategies
Changes to Investment Objectives and Strategies. Each Fund’s investment objective and strategies are non-fundamental and may be changed by the Board of Trustees (the “Trustees”) without shareholder approval.
Note Regarding Percentage Limitations. All percentage limitations on investments in this Prospectus will apply at the time of investment, and will not be considered violated unless an excess or deficiency occurs or exists immediately after and as a result of the investment. (As a result, the actual investments making up a Fund’s portfolio may not at a particular time comport with any such limitation due to increases or decreases in the values of securities held by the Fund.) However, if, through a change in values, net assets, or other circumstances, a Fund were in a position where more than 15% of its net assets was invested in illiquid securities, the Fund would take appropriate orderly steps, as deemed necessary, to protect liquidity. With respect to a Fund whose name suggests that the Fund focuses its investments in a particular type of investment or investments, or in investments in a particular industry or group of industries, and that has adopted a policy under Rule 35d-1 under the 1940 Act, such Fund’s policy to invest at least 80% of its net assets in certain investments may be changed by the Trustees upon at least 60 days’ prior written notice to shareholders.
Credit Ratings. Security ratings are determined at the time of investment based on ratings published by nationally recognized statistical rating organizations; if a security is not rated, it will be deemed to have the same rating as a security determined by the investment adviser or subadviser to be of comparable quality. Unless otherwise stated, if a security is rated by more than one nationally recognized statistical rating organization, the highest rating is used. The Fund may retain any security whose rating has been downgraded after purchase.
Duration. Duration is a measure of the expected life of a debt security that is used to determine the sensitivity of the security’s value to changes in interest rates. The longer a security’s duration, the more sensitive it will be to changes in interest rates. Unlike the maturity of a debt security, which measures only
the time until final payment is due, duration takes into account the time until all payments of interest and principal on a security are expected to be made, including how these payments are affected by prepayments and by changes in interest rates.
Leverage. Leverage generally has the effect of increasing the amount of loss or gain a Fund might realize, and may increase volatility in the value of a Fund’s investments. Adverse changes in the value or level of the underlying asset, rate, or index may result in a loss substantially greater than the amount invested in the derivative itself.
Temporary Defensive Positions. At times, a Fund’s investment adviser or subadviser may determine that market conditions make pursuing a Fund’s basic investment strategy inconsistent with the best interests of its shareholders. At such times, the investment adviser or subadviser may (but will not necessarily), without notice, temporarily use alternative strategies primarily designed to reduce fluctuations in the values of a Fund’s assets. In implementing these defensive strategies, a Fund may hold assets without limit in cash and cash equivalents and in other investments that the investment adviser or subadviser believes to be consistent with the Fund’s best interests. If such a temporary defensive strategy is implemented, a Fund may not achieve its investment objective.
Portfolio Turnover. Changes are made in a Fund’s portfolio whenever the investment adviser or subadviser believes such changes are desirable. Portfolio turnover rates are generally not a factor in making buy and sell decisions. A high portfolio turnover rate will result in higher costs from brokerage commissions, dealer-mark-ups, bid-ask spreads, and other transaction costs and may also result in a higher percentage of short-term capital gains and a lower percentage of long-term capital gains as compared to a fund that trades less frequently (short-term capital gains generally receive less favorable tax treatment in the hands of shareholders than do long-term capital gains). Such costs are not reflected in the Funds’ Total Annual Fund Operating Expenses set forth in the fee tables but do have the effect of reducing a Fund’s investment return.
– 127 –
Non-Principal Investments; Use of Derivatives; Securities Loans; Repurchase Agreements. A Fund may hold investments that are not included in its principal investment strategies. These non-principal investments are described in the Statement of Additional Information (“SAI”) or below under “Additional Information Regarding Principal Risks.” A Fund also may choose not to invest in certain securities described in this Prospectus and in the SAI, even though it has the ability to do so. Certain Funds may engage in transactions involving derivatives as part of their principal investment strategies; the disclosures of the principal investment strategies of those Funds include specific references to those derivatives transactions. Any of the other Funds may engage in derivatives transactions not as part of their principal investment strategies, and Funds that may use certain derivatives as part of their principal investment strategies may use other derivatives (not as part of their principal investment strategies), as well. A Fund may use derivatives for hedging purposes, as a substitute for direct investment, to earn additional income, to adjust portfolio characteristics, including duration (interest rate volatility), to gain exposure to securities or markets in which it might not be able to invest directly, to provide asset/liability management, or to take long or short positions on one or more indices, securities, or foreign currencies. Derivatives transactions may include, but are not limited to, foreign currency exchange transactions, options, futures contracts, interest rate swaps, interest rate futures contracts, forward contracts, total return swaps, credit default swaps, and hybrid instruments. A Fund may use derivatives to create investment leverage. See “Additional Information Regarding Principal Risks,” below, and the SAI for more information regarding those transactions.
A Fund may make loans of portfolio securities to broker-dealers and other financial intermediaries of up to 33% of its total assets, and may enter into repurchase agreements. These transactions must be fully collateralized at all times, but involve some risk to a Fund if the other party should default on its obligation and the Fund is delayed or prevented from recovering the collateral, or if the Fund is required to return collateral to a borrower at a time when it may realize a loss on the investment of that collateral. Any losses from the investment of cash collateral received by the Fund will be for the Fund’s account and may exceed any income the Fund receives from its securities lending activities. A Fund may enter into securities loans and repurchase agreements as a non-principal investment strategy.
Foreign Securities. The globalization and integration of the world economic system and related financial markets have made it increasingly difficult to define issuers geographically. Accordingly, the Funds intend to construe geographic terms such as “foreign,” “non-U.S.,” “European,” “Latin American,” “Asian,” and “emerging markets” in the manner that affords to the Funds the greatest flexibility in seeking to achieve the investment objective(s) of the relevant Fund. Specifically, unless otherwise stated, in circumstances where the investment objective and/or strategy is to invest (a) exclusively in “foreign securities,” “non-U.S. securities,” “European securities,” “Latin American securities,” “Asian securities,” or “emerging markets” (or similar directions) or (b) at least some percentage of the Fund’s assets in foreign securities, etc., the Fund will take the view that a security meets this description so long as the issuer of a security is tied economically to the particular country or geographic region indicated by words of the relevant investment objective and/or strategy (the “Relevant Language”). For these purposes the issuer of a security is deemed to have that tie if:
(i) the issuer is organized under the laws of the country or a country within the geographic region suggested by the Relevant Language or maintains its principal place of business in that country or region; or
(ii) the securities are traded principally in the country or region suggested by the Relevant Language; or
(iii) the issuer, during its most recent fiscal year, derived at least 50% of its revenues or profits from goods produced or sold, investments made, or services performed in the country or region suggested by the Relevant Language or has at least 50% of its assets in that country or region.
In addition, the Funds intend to treat derivative securities (e.g., call options) by reference to the underlying security. Conversely, if the investment objective and/or strategy of a Fund limits the percentage of assets that may be invested in “foreign securities,” etc. or prohibits such investments altogether, a Fund intends to categorize securities as “foreign,” etc. only if the security possesses all of the attributes described above in clauses (i), (ii), and (iii).
Small Company Value Fund. MML Advisers has agreed to voluntarily waive .02% of its management fees. MML Advisers may amend or discontinue this waiver at any time without advance notice.
– 128 –
MM S&P Mid Cap Index Fund. MML Advisers has agreed to cap the fees and expenses of the Fund (other than extraordinary litigation and legal expenses, interest expense, short sale dividend and loan expense, Acquired Fund fees and expenses, or other non-recurring or unusual expenses such as organizational expenses and shareholder meeting expenses) through January 31, 2018, to the extent that Total Annual Fund Operating Expenses after Expense Reimbursement would otherwise exceed .20%, .30%, .45%, .55%, .80%, .70%, and .95% for Classes I, R5, Service, Administrative, A, R4, and R3, respectively. The agreement can only be terminated by mutual consent of the Board of Trustees on behalf of the Fund and MML Advisers.
MM MSCI EAFE International Index Fund. MML Advisers has agreed to cap the fees and expenses of the Fund (other than extraordinary litigation and legal expenses, interest expense, short sale dividend and loan expense, Acquired Fund fees and expenses, or other non-recurring or unusual expenses such as organizational expenses and shareholder meeting expenses) through January 31, 2018, to the extent that Total Annual Fund Operating Expenses after Expense Reimbursement would otherwise exceed .25%, .35%, .50%, .60%, .85%, .75%, and 1.00% for Classes I, R5, Service, Administrative, A, R4, and R3, respectively. The agreement can only be terminated by mutual consent of the Board of Trustees on behalf of the Fund and MML Advisers.
– 129 –
Disclosure of Portfolio Holdings
A description of the Funds’ policies and procedures with respect to the disclosure of each Fund’s portfolio securities is available in the Funds’ SAI.
Additional Information Regarding Principal Risks
The Funds, by themselves, generally are not intended to provide a complete investment program. Investment in the Funds is intended to serve as part of a diversified portfolio of investments. An investment in a Fund is not a bank deposit and is not insured or guaranteed by the Federal Deposit Insurance Corporation or any other government agency.
The value of your investment in a Fund changes with the values of the investments in the Fund’s portfolio. Many things can affect those values. Factors that may have an important or significant effect on a particular Fund’s portfolio as a whole are called “Principal Risks.” The Principal Risks of each Fund are identified in the foregoing Fund Summaries and are described in this section. Certain Funds may be more susceptible to some risks than others. Although the Funds strive to reach their stated goals, they cannot offer guaranteed results. The value of your investment in a Fund could go down as well as up. You can lose money by investing in the Funds.
The SAI contains further information about the Funds, their investments, and their related risks.
| · | Bank Loans Risk |
Many of the risks associated with bank loans are similar to the risks of investing in below investment grade debt securities, although bank loans are typically (though not always) senior and secured, while below investment grade debt securities or investments are often subordinated and unsecured. Changes in the financial condition of the borrower or economic conditions or other circumstances may reduce the capacity of the borrower to make principal and interest payments on such instruments and may lead to defaults. The value of any collateral securing a bank loan may decline after the Fund invests, and there is a risk that the value of the collateral may not be sufficient to cover the amount owed to the Fund. In addition, collateral
securing a loan may be found invalid, may be used to pay other outstanding obligations of the borrower under applicable law, or may be difficult to sell. In the event that a borrower defaults, a Fund’s access to the collateral may be limited by bankruptcy and other insolvency laws. There is also the risk that the collateral may be difficult to liquidate, or that a majority of the collateral may be illiquid. In addition, some loans may be unsecured. Unsecured loans generally present a greater risk of loss to the Fund if the issuer defaults. In some cases, the Fund may rely on a third party to administer its interest in a loan, and so is subject to the risk that the third party will be unwilling or unable to perform its obligations. The Fund may invest in a loan by purchasing an indirect interest in the loan held by a third party. In that case, the Fund will be subject to both the credit risk of the borrower and of the third party, and the Fund may be unable to realize some or all of the value of its interest in the loan in the event of the insolvency of the third party. The settlement time for certain loans is longer than the settlement time for many other types of investments, and the Fund may not receive the payment for a loan sold by it until well after the sale; that cash would be unavailable for payment of redemption proceeds or for reinvestment. Interests in other bank loans may not be readily marketable and may be subject to restrictions on resale. In some cases, negotiations involved in disposing of indebtedness may require weeks to complete. Consequently, some indebtedness may be difficult or impossible to dispose of readily at what the Fund believes to be a fair price.
| · | Below Investment Grade Debt Securities Risk |
Below investment grade debt securities, which are also known as “junk” or “high yield” bonds, and comparable unrated securities in which a Fund may invest, have speculative characteristics and changes in economic conditions or other circumstances are more likely to lead to a weakened capacity to make principal and interest payment than in the case of higher grade securities. The lower ratings of these securities reflect a greater possibility that adverse changes in the financial condition of the issuer or in general economic conditions, or
– 130 –
both, or an unanticipated rise in interest rates, may impair the ability of the issuer to make payments of interest and principal. Below investment grade debt securities involve greater volatility of price and yield, and greater risk of loss of principal and interest, and generally reflect a greater possibility of an adverse change in financial condition which would affect the ability of the issuer to make payments of principal and interest. In the past, economic downturns or an increase in interest rates have, under certain circumstances, resulted in a higher incidence of default by the issuers of these instruments and may do so in the future, especially in the case of highly leveraged issuers. The prices for these instruments may be affected by legislative and regulatory developments. Some below investment grade debt securities are issued in connection with management buy-outs and other highly leveraged transactions, and may entail substantial risk of delays in payments of principal or interest or of defaults. The inability (or perceived inability) of issuers to make timely payment of interest and principal would likely make the values of securities held by the Fund more volatile and could limit the Fund’s ability to sell its securities at prices approximating the values the Fund has placed on such securities. In the absence of a liquid trading market for securities held by it, a Fund at times may be unable to establish the fair value of such securities. To the extent a Fund invests in securities in the lower rating categories, the achievement of the Fund’s goals is more dependent on the Fund investment adviser’s or subadviser’s investment analysis than would be the case if the Fund was investing in securities in the higher rating categories. Securities that are rated CCC or below by Standard & Poor’s or Caa or below by Moody’s Investors Service, Inc. are generally regarded by the rating agencies as having extremely poor prospects of ever attaining any real investment standing.
| · | Cash Position Risk |
A Fund may hold a significant portion of its assets in cash or cash equivalents at the sole discretion of the Fund’s investment adviser or subadviser, based on such factors as it may consider appropriate under the circumstances. The portion of a Fund’s assets invested in cash and cash equivalents may at times exceed 25% of the Funds’ net assets. To the extent a Fund
holds a significant portion of its assets in cash or cash equivalents, its investments returns may be adversely affected and the Fund may not achieve its investment objective.
| · | Commodities-Related Investments Risk |
Commodity prices (including precious metals) can be extremely volatile and exposure to commodities can cause the net asset value (“NAV”) of the Fund’s shares to decline or fluctuate in a rapid and unpredictable manner. The values of physical commodities or commodity-linked derivative investments may be affected by changes in overall market movements, real or perceived inflationary trends, commodity index volatility, changes in interest rates or currency exchange rates, population growth and changing demographics, international economic, political and regulatory developments, or factors affecting a particular region, industry, or commodity, such as drought, floods, weather, embargoes, tariffs, and international economic, political, and regulatory developments. The price of a commodity may be affected by demand/supply imbalances in the market for the commodity. Also, a liquid secondary market may not exist for certain commodity investments, which may make it difficult for the Fund to sell them at a desirable price or the price at which it is carrying them. A Fund’s investments in commodities and commodity-related instruments may bear on or be limited by the Fund’s intention to qualify as a “regulated investment company” for U.S. federal income tax purposes. See “Taxation and Distributions” below.
| · | Convertible Securities Risk |
Convertible securities are bonds, debentures, notes or other debt securities that may be converted at either a stated price or stated rate into shares of common or preferred stock (or cash or other securities of equivalent value), and so are subject to the risks of investments in both debt securities and equity securities. The price of a convertible security may change in response to changes in price of the underlying equity security, the credit quality of the issuer, and interest rates. Due to the conversion feature, convertible debt securities generally yield less than non-convertible securities of similar credit quality and maturity. The values of convertible securities may be interest-rate sensitive and tend to decline as interest rates rise and to rise when
– 131 –
interest rates fall. A Fund’s investment in convertible securities may at times include securities that have a mandatory conversion feature, pursuant to which the securities convert automatically into stock at a specified date and conversion ratio, or that are convertible at the option of the issuer. When conversion is not at the option of the holder, a Fund may be required to convert the security into the underlying stock even at times when the value of the underlying common stock has declined substantially or it would otherwise be disadvantageous to do so.
| · | Credit Risk |
Credit risk is the risk that an issuer, guarantor, or liquidity provider of a fixed income security held by the Fund may be unable or unwilling, or may be perceived (whether by market participants, ratings agencies, pricing services or otherwise) as unable or unwilling, to make timely principal and/or interest payments, or to otherwise honor its obligations. It includes the risk that the security will be downgraded by a credit rating agency; generally, lower credit quality issuers present higher credit risks. An actual or perceived decline in creditworthiness of an issuer of a fixed income security held by the Fund may result in a decrease in the value of the security. It is possible that the ability of an issuer to meet its obligations will decline substantially during the period when the Fund owns securities of the issuer or that the issuer will default on its obligations or that the obligations of the issuer will be limited or restructured. The credit rating assigned to any particular investment does not necessarily reflect the issuer’s current financial condition and does not reflect an assessment of an investment’s volatility or liquidity. Securities rated in the lowest category of investment grade are considered to have speculative characteristics. In addition, below investment grade debt securities (i.e., “junk” or “high yield” bonds) involve greater credit risk, are more volatile, involve greater risk of price declines and may be more susceptible to economic downturn than investment grade securities. If a security held by the Fund loses its rating or its rating is downgraded, the Fund may nonetheless continue to hold the security in the discretion of the investment adviser or subadviser. In the case of asset-backed or mortgage-related securities, changes in the actual or perceived ability of the obligors on the underlying assets or mortgages may affect the values of those securities.
The Fund may also be exposed to the credit risk of its counterparty to repurchase agreements, reverse repurchase agreements, swap transactions, and other derivatives transactions, and to the counterparty’s ability or willingness to perform in accordance with the terms of the transaction. The value of such transactions to the Fund will depend on the willingness and ability of the counterparty to perform its obligations, including among other things the obligation to return collateral or margin to the Fund.
| · | Currency Risk |
Because foreign securities normally are denominated and traded in foreign currencies, the value of a Fund’s assets may be affected favorably or unfavorably by currency exchange rates, currency exchange control regulations, intervention (or failure to intervene) by the U.S. or foreign governments in currency markets, foreign withholding taxes, and restrictions or prohibitions on the repatriation of foreign currencies. A Fund may, but will not necessarily, engage in foreign currency transactions in order to protect against fluctuations in the value of holdings denominated in or exposed to other currencies, or, for certain Funds, to generate additional returns. Derivatives transactions providing exposure to foreign currencies create investment leverage. A Fund’s investment in foreign currencies may increase the amount of ordinary income recognized by the Fund.
Officials in foreign countries may from time to time take actions in respect of their currencies which could significantly affect the value of a Fund’s assets denominated in those currencies or the liquidity of such investments. For example, a foreign government may unilaterally devalue its currency against other currencies, which would typically have the effect of reducing the U.S. dollar value of investments denominated in that currency. A foreign government may also limit the convertibility or repatriation of its currency or assets denominated in its currency, which would adversely affect the U.S. dollar value and liquidity of investments denominated in that currency. In addition, although at times most of a Fund’s income may be received or realized in foreign currencies, the Fund will be required to compute and distribute its income in U.S. dollars. As a result, if the exchange rate for any such currency declines after the Fund’s income has been earned and translated into U.S. dollars
– 132 –
but before payment to shareholders, the Fund could be required to liquidate portfolio securities to make such distributions. Similarly, if a Fund incurs an expense in U.S. dollars and the exchange rate declines before the expense is paid, the Fund would have to convert a greater amount of U.S. dollars to pay for the expense at that time than it would have had to convert at the time the Fund incurred the expense. Investments in foreign currencies themselves (directly or through derivatives transactions) may be highly volatile and may create investment leverage.
| · | Defaulted and Distressed Securities Risk |
Defaulted securities risk refers to the uncertainty of repayment of defaulted securities and obligations of distressed issuers. Because the issuer of such securities is in default and is likely to be in distressed financial condition, repayment of defaulted securities and obligations of distressed issuers (including insolvent issuers or issuers in payment or covenant default, in workout or restructuring or in bankruptcy or insolvency proceedings) is subject to significant uncertainties. Insolvency laws and practices in emerging market countries are different than those in the U.S. and the effect of these laws and practices cannot be predicted with certainty. Investments in defaulted securities and obligations of distressed issuers are considered speculative.
| · | Derivatives Risk |
Derivatives are financial contracts whose values depend upon, or are derived from, the value of an underlying asset, reference rate, or index. Derivatives may relate to stocks, bonds, interest rates, currencies, credit exposures, currency exchange rates, commodities, related indexes, or other assets. The use of derivative instruments may involve risks different from, or greater than, the risks associated with investing directly in securities and other more traditional investments. Derivatives can be highly volatile and are subject to a number of potential risks described in this Prospectus, including market risk, credit risk, management risk, liquidity risk, and leveraging risk. Derivative products are highly specialized instruments that may require investment techniques and risk analyses different from those associated with stocks and bonds. The use of a derivative requires an understanding not only of the underlying instrument or index but also of the derivative itself, often without the benefit of
observing the performance of the derivative under all possible market conditions. (For example, successful use of a credit default swap may require, among other things, an understanding of both the credit of the company to which it relates and of the way the swap is likely to respond to changes in various market conditions and to factors specifically affecting the company.) The use of derivatives involves the risk that a loss may be sustained as a result of the failure of another party to the contract (typically referred to as a “counterparty”) to make required payments or otherwise to comply with the contract’s terms. Derivative transactions can create investment leverage. Losses from derivatives can be substantially greater than the derivatives’ original cost and can sometimes be unlimited. Since the values of derivatives are calculated and derived from the values of other assets, reference rates, or indexes, there is greater risk that derivatives will be improperly valued. Derivatives also involve the risk that changes in the value of a derivative may not correlate perfectly with changes in the value of the relevant asset, rate, or index it is designed to hedge or to track closely, and the risk that a derivative transaction may not have the effect the Fund’s investment adviser or subadviser anticipated. Also, suitable derivative transactions may not be available in all circumstances, and there can be no assurance that a Fund will engage in these transactions when that would be beneficial. A liquid secondary market may not always exist for the Fund’s derivative positions at any time. If a derivative transaction is particularly large or if the relevant market is illiquid (as is the case with many privately negotiated derivatives), it may not be possible to initiate a transaction or liquidate a position at an advantageous price or at all. Although the use of derivatives is intended to enhance a Fund’s performance, it may instead reduce returns and increase volatility.
Recent U.S. and non-U.S. legislative and regulatory reforms, including those related to the Dodd-Frank Wall Street Reform and Consumer Protection Act, have resulted in, and may in the future result in, new regulation of derivative instruments and the Funds’ use of such instruments. New regulations could, among other things, restrict a Fund’s ability to engage in derivative transactions (for example, by making certain types of derivative instruments or
– 133 –
transactions no longer available to a Fund), establish new margin requirements and/or increase the costs of derivatives transactions, and a Fund may as a result be unable to execute its investment strategies in a manner its subadviser might otherwise choose. Counterparty risk with respect to derivatives has been and may continue to be affected by new rules and regulations concerning the derivatives market. Some derivatives transactions are required to be centrally cleared, and a party to a cleared derivatives transaction is subject to the credit risk of the clearing house and the clearing member through which it holds the position, rather than the credit risk of its original counterparty to the derivatives transaction. Credit risk of market participants with respect to derivatives that are centrally cleared is concentrated in a few clearing houses and clearing members, and it is not clear how an insolvency proceeding of a clearing house or clearing member would be conducted, what effect the insolvency proceeding would have on any recovery by a Fund, and what impact an insolvency of a clearing house or clearing member would have on the financial system more generally.
| · | Futures Contract Risk. A Fund may enter into futures contracts, in which the Fund agrees to buy or sell certain financial instruments or index units or other assets on a specified future date at a specified price or level of interest rate. A Fund may also enter into contracts to deliver in the future an amount of one currency in return for an amount of another currency. If a Fund’s investment adviser or subadviser misjudges the direction of interest rates, markets, or foreign exchange rates, a Fund’s overall performance could suffer. The risk of loss could be far greater than the investment made because a futures contract requires only a small deposit to take a large position. A small change in a financial futures contract could have a substantial impact on a Fund, favorable or unfavorable. An investor could also suffer losses if it is unable to close out a futures contract because of an illiquid secondary market. Futures are subject to the creditworthiness of the futures commission merchant or broker and clearing organizations involved in the transaction. In the event of the insolvency of its futures commission merchant or broker, a Fund may be delayed or prevented from recovering some or all of the margin it has |
deposited with the merchant or broker, or any increase in the value of its futures positions held through that merchant or broker. |
| · | Dollar Roll and Reverse Repurchase Agreement Transaction Risk |
In a dollar roll transaction, a Fund sells mortgage-backed securities for delivery to the buyer in the current month and simultaneously contracts to purchase similar securities on a specified future date from the same party. In a reverse repurchase agreement transaction, a Fund sells securities to a bank or securities dealer and agrees to repurchase them at an agreed time and price; a reverse repurchase agreement is similar to a secured borrowing by a Fund. Both types of transactions generally create leverage (see “Leveraging Risk” below). It may be difficult or impossible for a Fund to exercise its rights under a dollar roll transaction or reverse repurchase agreement in the event of the insolvency or bankruptcy of the counterparty, and the Fund may not be able to purchase the securities or other assets subject to the transaction and may be required to return the collateral.
| · | Emerging Markets Risk |
Investing in emerging market securities poses risks different from, and/or greater than, risks of investing in domestic securities or in the securities of foreign, developed countries. These risks may include, for example, smaller market-capitalization of securities markets, significant price volatility; restrictions on foreign investment; and possible repatriation of investment income and capital. Future economic or political crises could lead to price controls, forced mergers, expropriation or confiscatory taxation, seizure, nationalization, or the creation of government monopolies. The currencies of emerging market countries may experience significant declines against the U.S. dollar, and devaluation may occur subsequent to investments in those currencies by a Fund. Inflation and rapid fluctuations in inflation rates have had, and may continue to have, negative effects on the economies and securities markets of certain emerging market countries. Although many of the emerging market securities in which a Fund may invest are traded on securities exchanges, they may trade in limited volume,
– 134 –
and the exchanges may not provide all of the conveniences or protections provided by securities exchanges in more developed markets.
Additional risks of emerging market securities may include greater social, economic, and political uncertainty and instability; more substantial governmental involvement in the economy; less governmental supervision and regulation; greater custody and operational risks; unavailability of currency hedging techniques; companies that are newly organized and small; differences in auditing and financial reporting standards, which may result in unavailability of material information about issuers; and less developed legal, regulatory, and accounting systems. In addition, emerging securities markets may have different clearance and settlement procedures, which may be unable to keep pace with the volume of securities transactions or otherwise make it difficult to engage in such transactions. Settlement problems may cause a Fund to miss attractive investment opportunities, hold a portion of its assets in cash pending settlement, or be delayed in disposing of a portfolio security. It may be more difficult to obtain and/or enforce a judgment in a court outside the U.S. and a judgment against a foreign government may be unenforceable.
| · | Equity Securities Risk |
Although stocks may have the potential to outperform other asset classes over the long term, their prices tend to fluctuate more dramatically over the shorter term. These movements may result from factors affecting individual companies, or from broader influences like changes in interest rates, market conditions, investor confidence, or announcements of economic, political, or financial information. While potentially offering greater opportunities for capital growth than larger, more established companies, the stocks of smaller companies may be particularly volatile, especially during periods of economic uncertainty. These companies may face less certain growth prospects, or depend heavily on a limited line of products and services or the efforts of a small number of key management personnel.
| · | Fixed Income Securities Risk |
The values of debt securities change in response to interest rate changes. In general, as interest rates rise, the value of a debt security is likely to fall. This risk is generally greater for obligations with longer maturities or for debt securities that do not pay current interest (such as zero-coupon securities). Debt securities with floating interest rates can be less sensitive to interest rate changes, although, to the extent a Fund’s income is based on short-term interest rates that fluctuate over short periods of time, income received by the Fund may decrease as a result of a decline in interest rates. In response to an interest rate decline, debt securities that provide the issuer with the right to call or redeem the security prior to maturity may be called or redeemed, which may result in the Fund having to reinvest proceeds in other investments at a lower interest rate. The value of a debt security also depends on the issuer’s actual or perceived credit quality or ability to pay principal and interest when due. The value of a debt security is likely to fall if an issuer or the guarantor of a security is unable or unwilling (or is perceived to be unable or unwilling) to make timely principal and/or interest payments or otherwise to honor its obligations or if the debt security’s rating is downgraded by a credit rating agency. The value of a debt security can also decline in response to changes in market, economic, industry, political, and regulatory conditions that affect a particular type of debt security or issuer or debt securities generally. Certain events, such as market or economic developments, regulatory or government actions, natural disasters, terrorist attacks, war, and other geopolitical events can have a dramatic adverse effect on the debt market and the overall liquidity of the market for fixed income securities.
| · | Extension Risk. During periods of rising interest rates, the average life of certain types of securities may be extended because of slower than expected principal payments. This may lock in a below-market interest rate, increase the security’s duration, and reduce the value of the security. |
| · | Prepayment Risk. Prepayment risk is the risk that principal of a debt obligation will be repaid at a faster rate than anticipated. In such a case, a Fund may lose the benefit of a favorable interest rate |
– 135 –
for the remainder of the term of the security in question, and may only be able to reinvest the amount of the prepayment at a less favorable rate. |
| · | Interest Rate Risk. The values of bonds and other debt instruments usually rise and fall in response to changes in interest rates. The values of debt instruments generally increase in response to declines in interest rates and rise in response to increases in interest rates. Interest rate risk is generally greater for investments with longer durations or maturities. Some investments give the issuer the option to call or redeem an investment before its maturity date. If an issuer calls or redeems an investment during a time of declining interest rates, a Fund might have to reinvest the proceeds in an investment offering a lower yield, and therefore might not benefit from any increase in value as a result of declining interest rates. |
| · | Foreign Investment Risk |
Investments in securities of non-U.S. issuers (including depositary receipts) entail risks not typically associated with investing in securities of U.S. issuers. Similar risks may apply to securities traded on a U.S. securities exchange that are issued by companies with significant exposure to non-U.S. countries. In certain countries, legal remedies available to investors may be more limited than those available with regard to U.S. investments. Because non-U.S. securities are normally denominated and traded in currencies other than the U.S. dollar, the value of the Fund’s assets may be affected favorably or unfavorably by currency exchange rates, exchange control regulations, and restrictions or prohibitions on the repatriation of non-U.S. currencies. Income and gains with respect to investments in certain countries may be subject to withholding and other taxes. There may be less information publicly available about a non-U.S. company than about a U.S. company, and many non-U.S. companies are not subject to accounting, auditing, and financial reporting standards, regulatory framework and practices comparable to those in the United States. The securities of some non-U.S. companies are less liquid and at times more volatile than securities of comparable U.S. companies. Non-U.S. transaction costs, such as brokerage commissions and custody costs may be higher than in the United States. In addition, there may
be a possibility of nationalization or expropriation of assets, imposition of currency exchange controls, confiscatory taxation, political or financial instability, and diplomatic developments that could adversely affect the values of the Fund’s investments in certain non-U.S. countries. Foreign investments may be subject to the risks of seizure by a foreign government, imposition of restrictions on the exchange or export of foreign currency, other economic sanctions, and tax increases.
The willingness and ability of foreign governmental entities to pay principal and interest on government securities depends on various economic factors, including the issuer’s balance of payments, overall debt level, and cash-flow considerations related to the availability of tax or other revenues to satisfy the issuer’s obligations. If a foreign governmental entity defaults on its obligations on the securities, a Fund may have limited recourse available to it. The laws of some foreign countries may limit a Fund’s ability to invest in securities of certain issuers located in those countries. Special tax considerations apply to a Fund’s investments in foreign securities. A Fund’s investments in foreign securities or foreign currencies may increase or accelerate the Fund’s recognition of ordinary income and may affect the amount, timing, or character of the Fund’s distributions.
A Fund may invest in foreign securities known as depositary receipts, in the form of American Depositary Receipts (“ADRs”), European Depositary Receipts (“EDRs”), Global Depositary Receipts (“GDRs”), or other similar securities. An ADR is a U.S. dollar-denominated security issued by a U.S. bank or trust company that represents, and may be converted into, a foreign security. An EDR or a GDR is similar but is issued by a non-U.S. bank. Depositary receipts are subject to the same risks as direct investment in foreign securities. Depositary receipts may not necessarily be denominated in the same currency as the underlying securities into which they may be converted, and changes in currency exchange rates may affect the value of an ADR investment in ways different from direct investments in foreign securities. Funds may invest in both sponsored and unsponsored depositary receipts. Unsponsored depositary receipts are organized independently and without
– 136 –
the cooperation of the issuer of the underlying securities. As a result, available information concerning the issuers may not be as current for unsponsored depositary receipts and the prices of unsponsored depositary receipts may be more volatile than if such instruments were sponsored by the issuer. An investment in an ADR is subject to the credit risk of the issuer of the ADR.
| · | Frequent Trading/Portfolio Turnover Risk |
The length of time a Fund has held a particular security is not generally a consideration in investment decisions. The investment policies of a Fund may lead to frequent changes in the Fund’s investments, particularly in periods of volatile market movements, in order to take advantage of what the Fund’s investment adviser or subadviser believes to be temporary disparities in normal yield relationships between securities. A change in the securities held by a Fund is known as “portfolio turnover.” Portfolio turnover generally involves some expense to a Fund, including bid-asked spreads, dealer mark-ups, and other transaction costs on the sale of securities and reinvestments in other securities, and may result in the realization of taxable capital gains (including short-term gains, which are generally treated as ordinary income when distributed to shareholders). The trading costs and tax effects associated with portfolio turnover may adversely affect a Fund’s performance. Consult your tax adviser regarding the effect of a Fund’s portfolio turnover rate on your investments.
| · | Geographic Focus Risk |
When a Fund invests a relatively large percentage of its assets in issuers located in a single country, a small number of countries, or a particular geographic region, the Fund’s performance could be closely tied to the market, currency, economic, political, or regulatory conditions and developments in those countries or that region, and could be more volatile than the performance of more geographically diversified funds.
| · | Growth Company Risk |
Growth company securities tend to be more volatile in terms of price swings and trading
volume than many other types of equity securities. Growth companies, especially technology related companies, have seen dramatic rises and falls in stock valuations. Funds that invest in growth companies are subject to the risk that the market may deem these companies’ stock prices over-valued, which could cause steep and/or volatile price swings. Also, since investors buy these stocks because of their expected superior earnings growth, earnings disappointments often result in sharp price declines.
| · | Indexing Risk |
There are several reasons why an index Fund’s performance may not track the performance of the relevant index exactly. For example, the return on the securities and other investments selected by the investment adviser or subadviser may not correlate precisely with the return on the index. The Fund incurs a number of operating expenses not applicable to the index, and incurs costs in buying and selling securities. A Fund may not be fully invested at times, either as a result of cash flows into the Fund or reserves of cash held by the Fund to meet redemptions. The return on the sample of securities purchased by the investment adviser or subadviser, or futures or other derivative positions taken by the investment adviser or subadviser, to replicate the performance of the index may not correlate precisely with the return on the index.
| · | Industry Concentration Risk |
If a Fund concentrates its assets in a particular industry or group of industries, economic, business, regulatory, or other developments affecting issuers in that industry or group of industries may affect the Fund adversely to a greater extent than if the Fund had invested more broadly. A concentrated investment in any industry or group of industries may increase the volatility of a Fund’s portfolio, and may cause the Fund to underperform other mutual funds.
| · | Inflation Risk |
The value of assets or income from a Fund’s investments will be less in the future as inflation decreases the value of money. As inflation increases, the value of a Fund’s assets can decline as can the value of the Fund’s
– 137 –
distributions. The market price of debt securities generally falls as inflation increases because the purchasing power of the future income and repaid principal is expected to be worth less when received by the Fund. Debt securities that pay a fixed rather than variable interest rate are especially vulnerable to inflation risk because variable-rate debt securities may be able to participate, over the long term, in rising interest rates which have historically accompanied long-term inflationary trends.
| · | Large Company Risk |
Large-capitalization stocks as a group could fall out of favor with the market, causing a Fund to underperform investments that focus on small- or medium-capitalization stocks. Larger, more established companies may be slow to respond to challenges, including changes to technology or consumer tastes, and may grow more slowly than smaller companies, especially during market cycles corresponding to periods of economic expansion. Market capitalizations of companies change over time.
| · | Leveraging Risk |
The use of leverage has the potential to increase returns to shareholders, but also involves additional risks. A Fund may create leverage by borrowing money (through traditional borrowings or by means of so-called reverse repurchase agreements); certain transactions, including, for example, when-issued, delayed-delivery, to-be-announced, and forward commitment purchases, loans of portfolio securities, dollar roll transactions, and the use of some derivatives, can also result in leverage. Leverage will increase the volatility of the Fund’s investment portfolio and could result in larger losses than if it were not used. If there is a net decrease (or increase) in the value of a Fund’s investment portfolio, any leverage will decrease (or increase) the Fund’s NAV per share to a greater extent than if the Fund were not leveraged. The use of leverage is considered to be a speculative investment practice and may result in losses to a Fund. Certain derivatives have the potential for unlimited loss, regardless of the size of the initial investment. A Fund will typically pay interest or incur other borrowing costs in connection with leverage transactions.
| · | Liquidity Risk |
Liquidity risk is the risk that particular investments may be difficult to sell or terminate at approximately the price at which the Fund is carrying the investments. The ability of a Fund to dispose of illiquid positions at advantageous prices may be greatly limited, and a Fund may have to continue to hold such positions during periods when the investment adviser or subadviser otherwise would have sold them. Some securities held by a Fund may be restricted as to resale, may trade in the over-the-counter (“OTC”) market, or may not have an active trading market due to adverse market, economic, industry, political, regulatory, geopolitical or other conditions. In addition, a Fund, by itself or together with other accounts managed by the investment adviser or subadviser, may hold a position in a security that is large relative to the typical trading volume for that security, which can make it difficult for the Fund to dispose of the position at an advantageous time or price.
Market values for illiquid securities may not be readily available, and there can be no assurance that any fair value assigned to an illiquid security at any time will accurately reflect the price a Fund might receive upon the sale of that security. It is possible that, during periods of extreme market volatility or unusually high and unanticipated levels of redemptions, a Fund may be forced to sell large amounts of securities or terminate outstanding transactions at a price or time that is not advantageous in order to meet redemptions or other cash needs. In such a case, the sale proceeds received by a Fund may be substantially less than if the Fund had been able to sell the securities or terminate the transactions in more orderly transactions, and the sale price may be substantially lower than the price previously used by the Fund to value the securities for purposes of determining the Fund’s NAV.
| · | Management Risk |
Each Fund is subject to management risk because it relies on the investment adviser’s and/or subadviser’s investment analysis and its selection of investments to achieve its investment objective. A Fund’s investment adviser or subadviser manages the Fund based on its assessment of economic, financial, and market factors and its investment judgment. The
– 138 –
investment adviser or subadviser may fail to ascertain properly the appropriate mix of securities for any particular economic cycle. A Fund’s investment adviser or subadviser applies its investment techniques and risk analyses in making investment decisions for the Fund, but there can be no guarantee that they will produce the intended result. Management risk includes the risk that poor security selection will cause a Fund to underperform relative to other funds with similar investment objectives, or that the timing of movements from one type of security to another could have a negative effect on the overall investment performance of the Fund. There can be no assurance that there will be a liquid market for instruments held by the Fund at any time.
| · | Market Risk |
The values of a Fund’s portfolio securities may decline, at times sharply and unpredictably, as a result of unfavorable broad market developments, which may affect securities markets generally or particular industries, sectors, or issuers. The values of a Fund’s investments may decline as a result of a number of such factors, including actual or perceived changes in general economic and market conditions, industry, political, regulatory, geopolitical and other developments, changes in interest rates, currency rates, or other rates of exchange, and changes in economic and competitive industry conditions. Different parts of the market and different types of securities can react differently to these conditions. The possibility that security prices in general will decline over short or even extended periods subjects a Fund to unpredictable declines in the value of its shares, as well as potentially extended periods of poor performance.
The United States and other governments and the Federal Reserve and certain foreign central banks have taken steps to support financial markets. For example, in recent periods, governmental financial regulators, including the U.S. Federal Reserve, have taken steps to maintain historically low interest rates, such as by purchasing bonds. Steps by those regulators, including, for example, steps to curtail or taper such activities, could have a material adverse effect on prices for a Fund’s portfolio of investments and on the management of the Fund.
The withdrawal of support, failure of efforts in response to a financial crisis, or investor perception that those efforts are not succeeding could negatively affect financial markets generally as well as the values and liquidity of certain securities. Federal, state, and other governments, their regulatory agencies, or self-regulatory organizations may take actions that affect the regulation of the securities in which a Fund invests or the issuers of such securities in ways that are unforeseeable. The uncertainty surrounding the sovereign debt of a significant number of European Union countries, as well as the status of the Euro, the European Monetary Union, and the European Union itself, has disrupted and may continue to disrupt markets in the U.S. and around the world. The risks associated with investments in Europe may be heightened due to the approval by citizens of the United Kingdom, in June 2016, of a referendum to leave the European Union. Significant uncertainty remains in the market regarding the ramifications of that development, and the range and potential implications of possible political, regulatory, economic, and market outcomes are difficult to predict. If the United Kingdom’s exit from the European Union is consummated, or if one or more additional countries leave the European Union, or the European Union partially or completely dissolves, the world’s securities markets may be significantly disrupted and adversely affected. Legislation or regulation also may change the way in which a Fund, the investment adviser, or subadviser is regulated. Such legislation, regulation, or other government action could limit or preclude a Fund’s ability to achieve its investment objective and affect the Fund’s performance.
| · | Mortgage- and Asset-Backed Securities Risk |
Investments in mortgage-related and other asset-backed securities are subject to the risk of severe credit downgrades, illiquidity and defaults to a greater extent than many other types of fixed income investments. Mortgage-backed securities, including collateralized mortgage obligations and certain stripped mortgage-backed securities, represent a participation in, or are secured by, mortgage loans. Asset-backed securities are generally structured like mortgage-backed securities, but instead of mortgage loans or interests in mortgage loans, the underlying assets may include such items as motor vehicle
– 139 –
installment sale or installment loan contracts, leases of various types of real and personal property, receivables from credit card agreements, and student loan payments. Asset-backed securities also may be backed by pools of corporate or sovereign bonds, loans made to corporations, or a combination of these bonds and loans, commonly referred to as “collateralized debt obligations,” including collateralized bond obligations (“CBOs”) and collateralized loan obligations (“CLOs”). The assets backing collateralized debt obligations may consist in part or entirely of high risk, below investment grade debt obligations (or comparable unrated obligations). In the case of CBOs and certain other collateralized debt obligations, those may include, by way of example, high yield debt, residential privately issued mortgage-related securities, commercial privately issued mortgage-related securities, trust preferred securities, and emerging market debt. In the case of CLOs, they may include, among other things, domestic and foreign senior secured loans, senior unsecured loans, and subordinate corporate loans, any or all of which may be rated below investment grade or comparable unrated obligations.
Traditional debt investments typically pay a fixed rate of interest until maturity, when the entire principal amount is due. By contrast, payments on mortgage-backed and many asset-backed investments typically include both interest and partial payment of principal. Principal may also be prepaid voluntarily, or as a result of refinancing or foreclosure. The Fund may have to invest the proceeds from prepaid investments in other investments with less attractive terms and yields. As a result, these securities may have less potential for capital appreciation during periods of declining interest rates than other securities of comparable maturities, although they may have a similar risk of decline in market value during periods of rising interest rates. Because the prepayment rate generally declines as interest rates rise, an increase in interest rates will likely increase the duration, and thus the volatility, of mortgage-backed and asset-backed securities. (Duration is a measure of the expected life of a fixed income security that is used to determine the sensitivity of the security’s price to changes in interest rates. Unlike the maturity of a fixed income security, which measures only the time until
final payment is due, duration takes into account the time until all payments of interest and principal on a security are expected to be made, including how these payments are affected by prepayments and by changes in interest rates.) Prepayments rates are difficult to predict and the potential impact of prepayments on the value of a mortgage-related or other asset-backed security depends on the terms of the instrument and can result in significant volatility. In addition to interest rate risk (as described under “Interest Rate Risk”), investments in mortgage-backed securities composed of subprime mortgages and investments in CDOs and CLOs backed by pools of high-risk, below investment grade debt securities may be subject to a higher degree of credit risk, valuation risk, and liquidity risk (as described under “Credit Risk,” “Valuation Risk,” and “Liquidity Risk”).
The types of mortgages underlying securities held by the Fund may differ and may be affected differently by market factors. For example, the Fund’s investments in residential mortgage- backed securities will likely be affected significantly by factors affecting residential real estate markets and mortgages generally; similarly, investments in commercial mortgage-backed securities will likely be affected significantly by factors affecting commercial real estate markets and mortgages generally.
Some mortgage-backed and asset-backed investments receive only the interest portion (“IOs”) or the principal portion (“POs”) of payments on the underlying assets. The yields and values of these investments are extremely sensitive to changes in interest rates and in the rate of principal payments on the underlying assets. IOs tend to decrease in value if interest rates decline and rates of repayment (including prepayment) on the underlying mortgages or assets increase; it is possible that the Fund may lose the entire amount of its investment in an IO due to a decrease in interest rates. Conversely, POs tend to decrease in value if interest rates rise and rates of repayment decrease. Moreover, the market for IOs and POs may be volatile and limited, which may make them difficult for the Fund to buy or sell. The values of mortgage-related and other asset-backed securities may be substantially dependent on the servicing of the underlying asset pools, and are therefore subject
– 140 –
to risks associated with the negligence or malfeasance by their services and to the credit risk of their servicers. In certain situations, the mishandling of related documentation may also affect the rights of securities holders in and to the benefits of the underlying collateral. There may be legal and practical limitations on the enforceability of any security interest granted with respect to underlying assets, or the value of the underlying assets, if any, may be insufficient if the issuer defaults.
The Fund may gain investment exposure to mortgage-backed and asset-backed investments by entering into agreements with financial institutions to buy the investments at a fixed price at a future date. The Fund may or may not take delivery of the investments at the termination date of such an agreement, but will nonetheless be exposed to changes in value of the underlying investments during the term of the agreement. These transactions may create investment leverage.
| · | Non-Diversification Risk |
A “non-diversified” mutual fund may purchase larger positions in a smaller number of issuers than may a diversified mutual fund. Therefore, an increase or decrease in the value of the securities of a single issuer or a small number of issuers may have a greater impact on the Fund’s NAV and the Fund’s performance could be more volatile than the performance of diversified funds.
| · | Preferred Stock Risk |
Like other equity securities, preferred stock is subject to the risk that its value may decrease based on actual or perceived changes in the business or financial condition of the issuer. In addition, if interest rates rise, the dividends on preferred stocks may be less attractive, causing the prices of preferred stocks to decline. Preferred stock may have mandatory sinking fund provisions or call/redemption provisions that can negatively affect its value when interest rates decline. In addition, in the event of liquidation of a corporation’s assets, the rights of preferred stock generally are subordinate to the rights associated with a corporation’s debt securities.
| · | Real Estate Risk; REIT Risk |
Investments in real estate are subject to a number of risks, including losses from casualty, condemnation or natural disasters, and changes in local and general economic conditions, supply and demand, interest rates, zoning laws, environmental regulations and other governmental action, regulatory limitations on rents, property taxes, and operating expenses. An investment in a real estate investment trust (“REIT”) may be subject to risks similar to those associated with direct ownership of real estate, and may be subject to additional risks, such as poor performance by the manager of the REIT, adverse changes to the tax laws or failure by the REIT to qualify for favorable tax treatment under the Internal Revenue Code of 1986, as amended (the “Code”), and to the risk of general declines in stock prices. In addition, some REITs have limited diversification because they invest in a limited number of properties, a narrow geographic area, or a single type of property. A “mortgage” REIT that invests most or all of its assets in mortgages will be subject to many of the risks described above in respect of mortgage-backed securities. Also, the organizational documents of a REIT may contain provisions that make changes in control of the REIT difficult and time-consuming. The securities of small real-estate issuers can be more volatile and less liquid than securities of larger issuers and their issuers can have more limited financial resources. As a shareholder in a REIT a Fund, and indirectly the Fund’s shareholders, would bear its ratable share of the REIT’s expenses and would at the same time continue to pay its own fees and expenses.
| · | Repurchase Agreement Risk |
A Fund may enter into repurchase agreements. These transactions must be fully collateralized at all times, but involve some risk to a Fund if the other party should default on its obligation and the Fund is delayed or prevented from recovering the collateral, or if the Fund is required to return collateral to a borrower at a time when it may realize a loss on the investment of that collateral.
| · | Risk of Investment in other Funds or Pools |
A Fund may invest in other investment companies or pooled vehicles, including closed-
– 141 –
end funds, trusts, and exchange-traded funds (“ETFs”), that are advised by the Fund’s investment adviser or subadviser or its affiliates or by unaffiliated parties, to the extent permitted by applicable law. As a shareholder in an investment company, the Fund, and indirectly that Fund’s shareholders, would bear its ratable share of the investment company’s expenses, including advisory and administrative fees, and would at the same time continue to pay its own fees and expenses. The underlying funds may change their investment objectives or policies without the approval of a Fund. If an underlying fund were to change its investment objective or policies, a Fund may be forced to withdraw its investment from the underlying fund at a disadvantageous time. To the extent that a Fund invests a significant portion of its assets in an underlying fund, it will be particularly sensitive to the risks associated with that underlying fund. Underlying funds that are “non-diversified” because they may invest a significant portion of their assets in a relatively small number of issuers may have more risk because changes in the value of a single security or the impact of a single economic, political, or regulatory occurrence may have a greater adverse impact on the underlying fund’s NAV. Private investment pools in which the Funds may invest are not registered under the 1940 Act, and so will not offer all of the protections provided by the 1940 Act (including, among other things, protections against certain conflicts of interest and custodial risks); such investments may be illiquid, may be leveraged, and may be highly volatile.
Investing in other investment companies or private investment vehicles sponsored or managed by the investment adviser or subadviser or affiliates of the investment adviser or subadviser involves potential conflicts of interest. For example, the investment adviser or subadviser or its affiliates may receive fees based on the amount of assets invested in such other investment vehicles, which fees may be higher than the fees the investment adviser or subadviser receives for managing a Fund. Investment by a Fund in those other vehicles may be beneficial in the management of those other vehicles, by helping to achieve economies of scale or enhancing cash flows. Due to this and other factors, the investment adviser or subadviser may have an incentive to invest a portion of a Fund’s assets in investment
companies sponsored or managed by the investment adviser or subadviser or its affiliates in lieu of investments by the Fund directly in portfolio securities, or may have an incentive to invest in such investment companies over investment companies sponsored or managed by others. Similarly, the investment adviser or subadviser may have an incentive to delay or decide against the sale of interests held by the Fund in investment companies sponsored or managed by the investment adviser or subadviser or its affiliates.
ETFs are subject to many of the same risks applicable to investments in mutual funds generally, including that they will not perform as anticipated, that a Fund will bear its proportionate share of the ETF’s fees and expenses, and that the ETF will lose money. Many ETFs engage in derivatives strategies and use leverage, and as a result their values can be highly volatile. It is possible that an ETF’s performance will diverge significantly from the performance of any index or indices it seeks to replicate. Because shares of ETFs are actively traded, their values may be affected in unanticipated ways by the effects of supply and demand in the market, activities of short sellers, or unusual speculative activity in their shares. Some ETFs may experience periods of reduced liquidity due to restrictions on trading activity or due to a general lack of investor interest in the asset class represented by the ETF.
| · | Sector Risk |
If a Fund allocates a substantial amount of its assets to an economic, market, or industry sector, economic, business, regulatory, or other developments affecting issuers in that sector may affect the Fund adversely to a greater extent than if the Fund had invested more broadly. Examples of such sectors might include one or more financial sectors, health care sectors, or technology sectors. A substantial investment in one or more such sectors may increase the volatility of a Fund’s portfolio, and may cause the Fund to underperform other mutual funds.
| · | Select Cayman Fund Risk |
To the extent it invests in the Select Cayman Fund, the BlackRock Global Allocation Fund is indirectly exposed to the risks associated with the Select Cayman Fund’s investments. The
– 142 –
commodities-related investments held by the Select Cayman Fund generally are subject to the risks of commodities-related investments described above. The Select Cayman Fund is not registered under the 1940 Act, and is not subject to all the investor protections of the 1940 Act. Changes in the laws of the United States and/or the Cayman Islands could result in an increase in expenses and in the inability of the BlackRock Global Allocation Fund and/or the Select Cayman Fund to operate as described in this Prospectus and the SAI and could adversely affect the BlackRock Global Allocation Fund. For example, the Cayman Islands does not currently impose any income, corporate, or capital gains tax, estate duty, inheritance tax, gift tax, or withholding tax on the Select Cayman Fund. If Cayman Islands law changes such that the Select Cayman Fund must pay Cayman Islands taxes, BlackRock Global Allocation Fund shareholders would likely experience decreased investment returns. In addition, changes in law, or interpretations of existing law, including tax law and the regulation of entities that invest in commodity interests, may limit the ability of the BlackRock Global Allocation Fund to invest in the Select Cayman Fund and may limit the ability of the Select Cayman Fund to invest as actively or as broadly as it might otherwise, and/or increase expenses.
| · | Short Sales Risk |
If a Fund sells a security short, it will make money if the security’s price goes down (in an amount greater than any transaction costs) and will lose money if the security’s price goes up. There is no limit on the amount of money a Fund may lose on a short sale. A Fund may not be able to close out a short sale when it might wish to do so, or may only do so at an unfavorable price. Short sales can involve leverage. When the Fund engages in a short sale, it typically borrows the security sold short. The Fund will ordinarily have to pay a fee or premium to borrow the security and will be obligated to repay to the lender of the security any dividends or interest that accrue on the security during the period of the loan. If the Fund invests the proceeds from short positions in other securities the Fund could lose money both on the short positions and on the securities in which it has invested the short proceeds.
| · | Smaller and Mid-Cap Company Risk |
Smaller companies may have limited product lines, markets, or financial resources or they may depend on a few key employees. Such companies may have been recently organized and have little or no track record of success. Also, a Fund’s investment adviser or subadviser may not have had an opportunity to evaluate such newer companies’ performance in adverse or fluctuating market conditions. Market risk and liquidity risk are particularly pronounced for stocks of smaller companies. The securities of smaller companies may trade less frequently and in smaller volume than more widely held securities. The prices of these securities may fluctuate more sharply than those of other securities, and a Fund may experience some difficulty in establishing or closing out positions in these securities at prevailing market prices. There may be less publicly available information about the issuers of these securities or less market interest in such securities than in the case of larger companies, both of which can cause significant price volatility. Some securities of smaller issuers may be illiquid or may be restricted as to resale. Although mid-cap companies are larger than smaller companies, they may be subject to many of the same risks.
| · | Sovereign Debt Obligations Risk |
Investments in debt securities issued by governments or by government agencies and instrumentalities involve the risk that the governmental entities responsible for repayment may be unable or unwilling to pay interest and repay principal when due. A governmental entity’s willingness or ability to pay interest and repay principal in a timely manner may be affected by a variety of factors, including its cash flow, the size of its reserves, its access to foreign exchange, the relative size of its debt service burden to its economy as a whole, and political constraints. A governmental entity may default on its obligations or may require renegotiation or reschedule of debt payments. Any restructuring of a sovereign debt obligation held by the Fund will likely have a significant adverse effect on the value of the obligation. In the event of default of sovereign debt, the Fund may be unable to pursue legal action against the sovereign issuer or to realize on collateral securing the debt. The sovereign debt of many non-U.S. governments,
– 143 –
including their sub-divisions and instrumentalities, is rated below investment grade (“junk” or “high yield” bonds). Sovereign debt risk may be greater for debt securities issued or guaranteed by emerging and/or frontier countries.
| · | Structured Notes Risk |
Structured notes and other related instruments purchased by a Fund are generally privately negotiated debt obligations where the principal and/or interest is determined by reference to the performance of a specific asset, benchmark asset, market, or interest rate (“reference measure”). The interest rate or the principal amount payable upon maturity or redemption may increase or decrease, depending upon changes in the value of the reference measure. The terms of a structured note may provide that, in certain circumstances, no principal is due at maturity and, therefore, may result in a loss of invested capital by the Fund.
Structured notes may be positively or negatively indexed, so the appreciation of the reference measure may produce an increase or a decrease in the interest rate or the value of the principal at maturity. The rate of return on structured notes may be determined by applying a multiplier to the performance or differential performance of reference measures. Application of a multiplier involves leverage that will serve to magnify the potential for gain and the risk of loss.
The purchase of structured notes exposes a Fund to the credit risk of the issuer of the structured product. Structured notes may also be more volatile, less liquid, and more difficult to price accurately than less complex securities and instruments or more traditional debt securities.
| · | U.S. Government Securities Risk |
U.S. Government securities include a variety of securities that differ in their interest rates, maturities, and dates of issue. While securities issued or guaranteed by some agencies or instrumentalities of the U.S. Government (such as the Government National Mortgage Association) are supported by the full faith and credit of the United States, securities issued or guaranteed by certain other agencies or instrumentalities of the U.S. Government (such
as Federal Home Loan Banks) are supported only by the right of the issuer to borrow from the U.S. Government. Securities issued or guaranteed by certain other agencies and instrumentalities of the U.S. Government (such as Fannie Mae and Freddie Mac) are not supported by the full faith and credit of the U.S. Government and are supported only by the credit of the issuer itself. There is no assurance that the U.S. Government would provide financial support to its agencies and instrumentalities if not required to do so. In addition, certain governmental entities have been subject to regulatory scrutiny regarding their accounting policies and practices and other concerns that may result in legislation, changes in regulatory oversight and/or other consequences that could adversely affect the credit quality, availability, or investment character of securities issued by these entities. Investments in these securities are also subject to interest rate risk, prepayment risk, extension risk, and the risk that the value of the securities will fluctuate in response to political, market, or economic developments.
| · | Valuation Risk |
A portion of a Fund’s assets may be valued at fair value pursuant to guidelines that have been approved by the Trustees. A Fund’s assets may be valued using prices provided by a pricing service or, alternatively, a broker-dealer or other market intermediary (sometimes just one broker-dealer or other market intermediary) when other reliable pricing sources may not be available. The Fund, or persons acting on its behalf, may determine a fair value of a security based on such other information as may be available to them. There can be no assurance that any fair valuation of an investment held by a Fund will in fact approximate the price at which the Fund might sell the investment at the time. To the extent a Fund sells a security at a price lower than the price it has been using to value the security, its NAV will be adversely affected. If a Fund has overvalued securities it holds, you may pay too much for the Fund’s shares when you buy into the Fund. If a Fund underestimates the price of its portfolio securities, you may not receive the full market value for your Fund shares when you sell.
– 144 –
| · | Value Company Risk |
A Fund may purchase some equity securities at prices below what the investment adviser or subadviser believes to be their fundamental value. The Fund bears the risk that the prices of these securities may not increase to reflect what the investment adviser or subadviser believes to be their fundamental value or that the investment adviser or subadviser may have overestimated the securities’ fundamental value or that it may take a substantial period of time to realize that value.
| · | When-Issued, Delayed Delivery, TBA, and Forward Commitment Transaction Risk |
A Fund may purchase securities on a when-issued, delayed delivery, to-be-announced, or forward commitment basis. These transactions involve a commitment by a Fund to purchase securities for a predetermined price or yield, with payments and delivery taking place more than seven days in the future, or after a period longer than the customary settlement period for that type of security. These transactions involve a risk of loss if the value of the securities declines prior to the settlement date. These transactions may create investment leverage.
– 145 –
Management of the Funds
MML Investment Advisers, LLC (“MML Advisers”), a Delaware limited liability company, located at 100 Bright Meadow Blvd., Enfield, Connecticut 06082-1981, is the Funds’ investment adviser and is responsible for providing all necessary investment management and administrative services. MML Advisers, formed in 2013, is a wholly-owned subsidiary of Massachusetts Mutual Life Insurance Company (“MassMutual”). Founded in 1851, MassMutual is a mutual life insurance company that provides a broad range of insurance, money management, retirement, and asset accumulation products and services for individuals and businesses. As of September 30, 2016, MML Advisers had assets under management of approximately $42 billion.
In 2016, each Fund paid MML Advisers an investment management fee based on a percentage of each Fund’s average daily net assets as follows: .34% for the Total Return Bond Fund; .42% for the Strategic Bond Fund; .78% for the BlackRock Global Allocation Fund; .50% for the Diversified Value Fund; .60% for the Fundamental Value Fund; .60% for the Large Cap Value Fund; .09% for the S&P 500 Index Fund; .69% for the Focused Value Fund; .65% for the Fundamental Growth Fund; .62% for the Blue Chip Growth Fund; .70% for the Growth Opportunities Fund; .70% for the Mid-Cap Value Fund; .75% for the Small Cap Value Equity Fund; ..85% for the Small Company Value Fund; .10% for the S&P Mid Cap Index Fund; .10% for the Russell 2000 Small Cap Index Fund; .70% for the Mid Cap Growth Equity II Fund; .80% for the Small Cap Growth Equity Fund; .80% for the Diversified International Fund; .10% for the MSCI EAFE International Index Fund; and .80% for the Overseas Fund.
A discussion regarding the basis for the Trustees approving any investment advisory contract of the Funds is available in the Funds’ annual reports to shareholders dated September 30, 2016 and the Funds’ semiannual reports to shareholders dated March 31, 2016.
Each Fund also pays MML Advisers an administrative and shareholder services fee to compensate it for providing general administrative services to the Funds and for providing or causing to be provided ongoing shareholder servicing to direct and indirect investors in the Funds. MML Advisers pays substantially all of the fee to MassMutual in respect of shareholder servicing and investor recordkeeping services provided by it, or another entity with whom MassMutual has contracted. The fee is calculated and paid based on the average daily net assets attributable to each share class of the Fund separately, and is paid at the following annual rates for each Fund other than the S&P 500 Index Fund, S&P Mid Cap Index Fund, Russell 2000 Index Fund, and MSCI International Index Fund (each, an “Index Fund”): .10% for Class R5 shares; .15% for Service Class shares, Administrative Class shares, and Class A shares; and .20% for Class R4 shares and Class R3 shares. The fee for each Index Fund is paid at the following annual rates: .10% for Class R5 shares; .20% for Service Class shares, Administrative Class shares, and Class A shares; and .25% for Class R4 shares and Class R3 shares. Class I shares do not pay any administrative and shareholder services fee.
Subadvisers and Portfolio Managers
MML Advisers contracts with the following subadvisers to help manage the Funds. Subject to the oversight of the Trustees, MML Advisers has the ultimate responsibility to oversee subadvisers and recommend their hiring, termination, and replacement. This responsibility includes, but is not limited to, analysis and review of subadviser performance, as well as assistance in the identification and vetting of new or replacement subadvisers. In addition, MML Advisers maintains responsibility for a number of other important obligations, including, among other things, board reporting, assistance in the annual advisory contract renewal process, and, in general, the performance of all obligations not delegated to a subadviser. MML Advisers also provides advice and recommendations to the Trustees, and performs such review and oversight functions as the Trustees may reasonably request, as to the continuing appropriateness of the investment objective, strategies, and policies of each Fund, valuations of portfolio securities, and other matters relating generally to the investment program of each Fund.
MML Advisers is responsible for determining the allocation of portfolio assets and/or cash flows among subadvisers for those Funds with multiple subadvisers.
– 146 –
American Century Investment Management, Inc. (“American Century”), located at 4500 Main Street, Kansas City, Missouri 64111, manages a portion of the portfolio of the Mid-Cap Value Fund. American Century is a privately held subsidiary of American Century Companies, Inc. As of September 30, 2016, American Century had approximately $155.9 billion in total assets under management.
Phillip N. Davidson, CFA
is a portfolio manager of a portion of the Mid-Cap Value Fund, which is managed on a team basis. He is jointly and primarily responsible for the day-to-day management of American Century’s portion of the portfolio. Mr. Davidson is the Chief Investment Officer – U.S. Value Equity, Senior Vice President, and Senior Portfolio Manager for American Century. He joined American Century in 1993 as a portfolio manager.
Michael Liss, CFA
is a portfolio manager of a portion of the Mid-Cap Value Fund, which is managed on a team basis. He is jointly and primarily responsible for the day-to-day management of American Century’s portion of the portfolio. Mr. Liss is a Vice President and Senior Portfolio Manager for American Century. Mr. Liss joined American Century in 1998 and became a portfolio manager in 2004.
Kevin Toney, CFA
is a portfolio manager of a portion of the Mid-Cap Value Fund, which is managed on a team basis. He is jointly and primarily responsible for the day-to-day management of American Century’s portion of the portfolio. Mr. Toney is a Senior Vice President and Senior Portfolio Manager for American Century. Mr. Toney joined American Century in 1999 as an investment analyst and became a portfolio manager in 2006.
Brian Woglom, CFA
is a portfolio manager of a portion of the Mid-Cap Value Fund, which is managed on a team basis. He is jointly and primarily responsible for the day-to-day management of American Century’s portion of the portfolio. Mr. Woglom is a Vice President and Portfolio Manager for American Century. Mr. Woglom joined American Century in 2005 as an investment analyst and became a portfolio manager in 2012.
Barrow, Hanley, Mewhinney & Strauss, LLC (“Barrow Hanley”), located at 2200 Ross Avenue, 31st Floor, Dallas, Texas 75201, manages a portion of the portfolio of the Large Cap Value Fund and Small Cap Value Equity Fund. Barrow Hanley is a subsidiary of OM Management plc (“OMAM”), a publicly-held company traded on the New York Stock Exchange (“NYSE”). OMAM is comprised of approximately eight independent asset management firms. As of September 30, 2016, Barrow Hanley had approximately $91 billion in assets under management.
Ray Nixon, Jr,
is a portfolio manager for a portion of the Large Cap Value Fund. Mr. Nixon joined Barrow Hanley in 1994 and serves as an Executive Director. Prior to joining Barrow Hanley, Mr. Nixon was employed by Smith Barney, Inc., where he was a member of the firm’s Investment Policy Committee and served as their lead institutional stockbroker for the Southwest. During his 40-year investment career, he also served as a research analyst for the Teacher Retirement System of Texas.
Brian F. Quinn, CFA
is a portfolio manager for a portion of the Large Cap Value Fund. Mr. Quinn joined Barrow Hanley in 2005 and serves as a Director. During his 16-year investment career, he has served as an equity analyst for Clover Partners, LP and as a credit analyst for Frost Bank.
Lewis Ropp
is a portfolio manager for a portion of the Large Cap Value Fund. Mr. Ropp joined Barrow Hanley in 2001 and serves as a Managing Director. Prior to joining Barrow Hanley, Mr. Ropp was employed by Frost Securities where he was a senior equity analyst and a managing director of the Energy Group. Mr. Ropp also served in management positions at Shell Oil Company and as a securities analyst in the energy sector at Howard, Weil, Labouisse, Friedrichs, Inc. prior to joining Frost Securities.
– 147 –
James S. McClure, CFA
is a portfolio manager for a portion of the Small Cap Value Equity Fund. Mr. McClure has been a Managing Director at Barrow Hanley since 1995. Prior to joining Barrow Hanley, Mr. McClure was employed by Goldman Sachs Asset Management as a vice president and senior portfolio manager, managing the Capital Growth Fund, as well as separate accounts. During his 45-year investment career, he has served as the Chief Investment Officer, and then President and Chief Operating Officer at National Securities and Research Corporation. He also served as the Chief Investment Officer and executive vice president at Oppenheimer & Co., Inc. He managed mutual funds at American Capital Management and Research and was initially a securities analyst at American National Insurance Company.
John P. Harloe, CFA
is a portfolio manager for a portion of the Small Cap Value Equity Fund. Mr. Harloe has been a Managing Director at Barrow Hanley since 1995. Prior to joining Barrow Hanley, Mr. Harloe was employed by Sterling Capital Management, where he served as a vice president and equity portfolio manager/analyst for nine years. During the remainder of his 41-year investment career, Mr. Harloe worked with James S. McClure at American National Insurance Company, American Capital Management and Research, and Oppenheimer & Co., Inc.
BlackRock Investment Management, LLC (“BlackRock”), located at 1 University Square, Princeton, New Jersey 08540, manages the investments of the BlackRock Global Allocation Fund. BlackRock is an affiliate of BlackRock Advisors, LLC, which is an indirect, wholly-owned subsidiary of BlackRock, Inc. BlackRock and its affiliates had approximately $5.12 trillion in investment company and other portfolio assets under management as of September 30, 2016. The BlackRock Global Allocation Fund is managed by a team of financial professionals. The following individuals are primarily responsible for the day to day management of the Fund.
Dennis W. Stattman, CFA
is jointly responsible for the day-to-day management of the BlackRock Global Allocation Fund’s portfolio including setting the Fund’s overall investment strategy and overseeing the management of the Fund. Mr. Stattman has been a Managing Director of BlackRock, Inc. since 2006 and is head of BlackRock’s Global Allocation team.
Dan Chamby, CFA
is jointly responsible for the day-to-day management of the BlackRock Global Allocation Fund’s portfolio, including setting the Fund’s overall investment strategy and overseeing the management of the Fund. Mr. Chamby has been a Managing Director of BlackRock, Inc. since 2007. He was a Director of BlackRock, Inc. in 2006 and previously was an Associate Portfolio Manager of MLIM from 2003 to 2006.
Russ Koesterich, CFA
is jointly responsible for the day-to-day management of the BlackRock Global Allocation Fund’s portfolio including setting the Fund’s overall investment strategy and overseeing the management of the Fund. Mr. Koesterich has been a Managing Director of BlackRock, Inc. since 2009.
David Clayton, CFA
is jointly responsible for the day-to-day management of the BlackRock Global Allocation Fund’s portfolio including setting the Fund’s overall investment strategy and overseeing the management of the Fund. Mr. Clayton has been a Managing Director of BlackRock, Inc. since 2012. He was a Director of BlackRock from 2010 to 2011.
Kent Hogshire, CFA
is jointly responsible for the day-to-day management of the BlackRock Global Allocation Fund’s portfolio including setting the Fund’s overall investment strategy and overseeing the management of the Fund. Mr. Hogshire has been a Managing Director of BlackRock, Inc. since 2017. He was a Director of BlackRock from 2008 to 2016.
– 148 –
Brandywine Global Investment Management, LLC (“Brandywine Global”), located at 2929 Arch Street, 8th Floor, Philadelphia, Pennsylvania 19104, manages a portion of the portfolio of the Diversified Value Fund. Founded in 1986, Brandywine Global offers an array of equity, fixed income, and balanced portfolios that invest in U.S., international, and global markets. The firm is a wholly-owned, independently operated subsidiary of Legg Mason, Inc., and is headquartered in Philadelphia with an office in San Francisco. Brandywine Global also operates two affiliated companies with offices in Singapore and London. As of September 30, 2016, Brandywine Global managed approximately $69.5 billion in assets.
Joseph J. Kirby
is a portfolio manager of a portion of the Diversified Value Fund. Mr. Kirby is lead portfolio manager for Brandywine Global’s Diversified Large Cap Value Equity strategy. He serves as a portfolio manager and securities analyst on the Diversified Value Equity team. Mr. Kirby contributes to the quantitative and fundamental analysis of securities for the Diversified Value Equity portfolios by consistently applying Brandywine Global’s disciplined management exclusionary process. Since joining the firm and Diversified Team in 1995, he has been involved in each aspect of the portfolio process, including leading the trading efforts for all Diversified portfolios from 1997 through 2000. Prior to joining Brandywine Global, Mr. Kirby was with CoreStates Financial Corporation as an auditor (1992-1994).
Henry F. Otto
is a portfolio manager of a portion of the Diversified Value Fund. Mr. Otto, Managing Director and Portfolio Manager of Brandywine Global, is the founder and co-lead portfolio manager of Brandywine Global’s Diversified Value Equity strategies. Prior to joining Brandywine Global in 1988, he was with Dimensional Fund Advisors, Inc., where he managed and traded small cap portfolios and developed computer systems to structure portfolios and analyze performance (1984-1987), and the Chicago Board of Trade as a financial economist developing financial-based futures and options (1982-1984). Mr. Otto is a member of the firm’s Executive Board.
Steven M. Tonkovich
is a portfolio manager of a portion of the Diversified Value Fund. Mr. Tonkovich, Managing Director and Portfolio Manager of Brandywine Global, is co-lead portfolio manager of the Diversified Value Equity strategies. He plays an integral role in the team’s continual refinement of the Diversified Value Equity investment process and the firm’s ongoing research into value investing. Prior to joining the firm in 1989, he was with the Wharton School of the University of Pennsylvania as a research analyst in the Finance Department (1987-1989); and the Moore School of Electrical Engineering of the University of Pennsylvania as a research assistant (1986-1987). Mr. Tonkovich is a member of the firm’s Executive Board.
Federated Clover Investment Advisors (“Federated Clover”), a division of Federated Global Investment Management Corp., located at 400 Meridian Centre, Suite 200, Rochester, New York 14618, manages a portion of the portfolio of the Small Company Value Fund. Federated Global Investment Management Corp. is a wholly- owned subsidiary of Federated Investors, Inc. Federated Clover was known as Clover Capital Management, Inc. prior to its acquisition by Federated Investors, Inc. in December 2008. Federated Advisory Services Company, an affiliate of Federated Clover, provides research, quantitative analysis, equity trading, and transaction settlement and certain support services to Federated Clover as contemplated in Federated Clover’s Investment Subadvisory Agreement with MML Advisers on behalf of the Fund. As of September 30, 2016, Federated Investors, Inc. had discretionary management authority with respect to approximately $364.3 billion of assets.
Stephen K. Gutch, CFA
is a portfolio manager of a portion of the Small Company Value Fund. Mr. Gutch is a Senior Vice President and Senior Portfolio Manager at Federated Clover, overseeing the firm’s portfolio management effort. Mr. Gutch also leads the fundamental research team and provides research coverage in the Financial Services sector. Prior to joining Federated Clover in 2003, Mr. Gutch worked for Continental Advisors, LLC where he was managing director for the firm’s financial services hedge fund. Previous to this, he spent five years managing the financial services portfolio at Fulcrum Investment Group.
– 149 –
Martin A. Jarzebowski, CFA
is a portfolio manager of a portion of the Small Company Value Fund. Mr. Jarzebowski is a Vice President and Portfolio Manager at Federated Clover, responsible for portfolio management and conducting equity research in the Healthcare and Consumer Staples sectors. Prior to joining Federated Clover in 2007, Mr. Jarzebowski worked as a Senior Operations Manager at McMaster-Carr, and as a Legislative Assistant with the U.S. Senate Banking Committee.
Frontier Capital Management Company, LLC (“Frontier”), located at 99 Summer Street, Boston, Massachusetts 02110, manages a portion of the portfolio of the Mid Cap Growth Equity II Fund. Frontier was founded in 1980 and since 2000 has been a Delaware limited liability company with senior professionals of the firm sharing ownership with Affiliated Managers Group, Inc. As of September 30, 2016, Frontier had approximately $13.1 billion in assets under management.
Stephen M. Knightly, CFA
is the lead portfolio manager of a portion of the Mid Cap Growth Equity II Fund. Mr. Knightly joined Frontier in 1992. He has been the lead portfolio manager for Frontier’s mid-cap growth portfolios since 2005. He has been the President of Frontier since 2010.
Christopher J. Scarpa
is portfolio manager of a portion of the Mid Cap Growth Equity II Fund. Mr. Scarpa joined Frontier in 2001 as an equity research analyst. He assumed portfolio management responsibilities for Frontier’s mid-cap growth portfolios in 2010.
Harris Associates L.P. (“Harris”), located at 111 S. Wacker Drive, Suite 4600, Chicago, Illinois 60606, manages the investments of the Focused Value Fund and a portion of the portfolio of the Overseas Fund. Harris is a limited partnership managed by its general partner, Harris Associates, Inc. (“HAI”). Harris and HAI are wholly-owned subsidiaries of Natixis Global Asset Management, L.P. (“Natixis US”), which is an indirect subsidiary of Natixis Global Asset Management (“NGAM”), an international asset management group based in Paris, France, that is in turn principally owned by Natixis, a French investment banking and financial services firm. Natixis is principally owned by BPCE, France’s second largest banking group. BPCE is owned by banks comprising two autonomous and complementary retail banking networks consisting of the Caisse d’Epargne regional savings banks and the Banque Populaire regional cooperative banks. Together with its predecessor firms, Harris has advised and managed mutual funds since 1970. Harris managed approximately $105.5 billion in assets as of September 30, 2016.
Anthony P. Coniaris, CFA
is primarily responsible for the day-to-day management of the Focused Value Fund. Mr. Coniaris is the Co-Chairman, a Portfolio Manager, and a U.S. Investment Analyst at Harris. He joined Harris in 1999.
M. Colin Hudson, CFA
is a portfolio manager of the Focused Value Fund. Mr. Hudson is a Vice President, Portfolio Manager and U.S. Investment Analyst at Harris. Prior to joining Harris in 2005, Mr. Hudson was the Vice President and Director of Research at Hilliard Lyons Asset Management and an Investment Analyst at Wallington Asset Management.
Robert F. Bierig
is a portfolio manager of the Focused Value Fund. Mr. Bierig is a Portfolio Manager and U.S. Investment Analyst at Harris. Prior to joining Harris in 2012, Mr. Bierig was a Managing Principal at Amethyst Capital Management, Managing Director at GEICO Investments, Investor at Frist Capital, Investment Analyst at ESL Investments, and Investment Banking Analyst at Morgan Stanley.
David G. Herro, CFA
is a portfolio manager of a portion of the Overseas Fund. Mr. Herro is the Deputy Chairman, the Chief Investment Officer of International Equities, and a Portfolio Manager at Harris. Prior to joining Harris in 1992, Mr. Herro worked as a portfolio manager for The Principal Financial Group from 1986 to 1989 and as a portfolio manager for The State of Wisconsin Investment Board from 1989 to 1992.
– 150 –
Michael L. Manelli, CFA
is a portfolio manager of a portion of the Overseas Fund. Mr. Manelli is a Vice President, a Portfolio Manager, and an International Investment Analyst at Harris. Prior to joining Harris in 2005, Mr. Manelli was a Research Associate/Analyst at Morgan Stanley from 2001 to 2005.
Huber Capital Management, LLC (“Huber Capital Management”), located at 2321 Rosecrans Avenue, Suite 3245, El Segundo, California 90245, manages a portion of the portfolio of the Large Cap Value Fund. Huber Capital Management is a 100% employee owned investment advisory firm providing discretionary investment advisory services to institutional accounts and mutual funds. Founded in 2007, Huber Capital Management brings together an experienced group of investment professionals committed to a disciplined, value-based investment process which utilizes best practices of sboth fundamental research and behavioral psychology to create a distinctive investment approach. As of September 30, 2016, Huber Capital Management had approximately $2.7 billion in assets under management.
Joseph Huber
is portfolio manager of a portion of the Large Cap Value Fund. Mr. Huber is the Chief Executive Officer and Chief Investment Officer of Huber Capital Management, and leads the firm’s team of portfolio managers and analysts. Prior to founding Huber Capital Management in 2007, Mr. Huber was a Principal and Director of Research for Hotchkis and Wiley Capital Management, overseeing over $40 billion in U.S. value asset portfolios. He built a research platform which utilized best practices of fundamental research combined with behavioral psychology to capitalize on the art piece of investing, creating a unique and value-added investment approach. Prior to joining Hotchkis and Wiley, Mr. Huber served as Portfolio Manager and Director for Merrill Lynch Asset Management and as Portfolio Manager for Goldman Sachs Asset Management in New York.
Invesco Advisers, Inc. (“Invesco”), located at 1555 Peachtree Street, N.E., Atlanta, Georgia 30309, manages a portion of the portfolio of the Small Company Value Fund. Invesco is an indirect wholly-owned subsidiary of Invesco Ltd., a publicly traded company that, through its subsidiaries, engages in the business of investment management on an international basis. As of September 30, 2016, Invesco had approximately $820.2 billion in assets under management.
Andrew Waisburd, PhD
is a portfolio manager of a portion of the Small Company Value Fund. Mr. Waisburd is a Global Head of Portfolio Management on the Invesco Quantitative Strategies team and a Portfolio Manager of Invesco. He has been associated with Invesco and/or its affiliates since 2008. Prior to 2008, he was a Senior Quantitative Analyst at Harris Investment Management and Director of Research for Archipelago (now known as NYSE-ARCA).
Glen Murphy, CFA
is a portfolio manager of a portion of the Small Company Value Fund. Mr. Murphy is a Global Head of Portfolio Management on the Invesco Quantitative Strategies team and a Portfolio Manager of Invesco. He has been associated with Invesco and/or its affiliates since 1995.
Charles Ko, CFA
is a portfolio manager of a portion of the Small Company Value Fund. Mr. Ko is a Research Analyst and Portfolio Manager of Invesco. He has been associated with Invesco and/or its affiliates since 2012. From 2000 to 2012, he was employed by Batterymarch Financial Management and most recently served as Director and Senior Portfolio Manager.
J.P. Morgan Investment Management Inc. (“J.P. Morgan”), located at 270 Park Avenue, New York, New York 10017, manages the investments of the Diversified International Fund and a portion of the portfolio of the Overseas Fund. J.P. Morgan manages portfolios for corporations, governments, and endowments, as well as for many of the largest corporate retirement plans in the nation. As of September 30, 2016, J.P. Morgan and its affiliates had approximately $1.77 trillion in assets under management.
– 151 –
Gerd Woort-Menker, CFA
is a portfolio manager of the Diversified International Fund and a portion of the Overseas Fund. Mr. Woort-Menker, Managing Director, joined J.P. Morgan in 1987 as a research analyst and later became the head of European research and global research, before becoming a portfolio manager in 1999. Upon his retirement in the 2nd quarter of 2017, Mr. Woort-Menker will no longer be a portfolio manager of the Fund.
Jeroen Huysinga
is a portfolio manager of the Diversified International Fund and a portion of the Overseas Fund. Mr. Huysinga, Managing Director, joined J.P. Morgan as a portfolio manager in 1997.
Georgina Perceval Maxwell
is a portfolio manager of the Diversified International Fund and a portion of the Overseas Fund. Ms. Maxwell, Managing Director, joined J.P. Morgan as a portfolio manager in 1997.
Demetris Georghiou
is a portfolio manager of the Diversified International Fund and a portion of the Overseas Fund. Mr. Georghiou, Executive Director, joined J.P. Morgan in 2007 as an analyst, before becoming a portfolio manager in 2009.
Jackson Square Partners, LLC (“Jackson Square”), is located at 101 California Street, Suite 3750, San Francisco, California 94111 and manages a portion of the portfolio of the Growth Opportunities Fund. Jackson Square is a limited liability company organized under the laws of Delaware. Jackson Square is jointly owned by California Street Partners, LLC, which is beneficially owned by its portfolio management team and other employees of Jackson Square, and Delaware Investments Advisers Partner, Inc. (an affiliate of Delaware Investments Fund Advisers (“Delaware Investments”), which had been the Fund’s investment subadviser as described below). As of September 30, 2016, Jackson Square had approximately $25.6 billion in assets under management.
Jeffrey S. Van Harte, CFA
is a portfolio manager of a portion of the Growth Opportunities Fund. Mr. Van Harte is Chairman and Chief Investment Officer of Jackson Square, which manages large-cap growth, smid-cap growth, all-cap growth, and global growth portfolios. Prior to joining Jackson Square, he was the chief investment officer for Delaware Investments’ Focus Growth Equity team from April 2005 to April 2014. The Focus Growth Equity team managed large-cap growth, smid-cap growth, all-cap growth, and global growth portfolios. Prior to Delaware Investments, Mr. Van Harte was a principal and executive vice president at Transamerica Investment Management. He has been managing portfolios and separate accounts for 33 years. Before becoming a portfolio manager, Mr. Van Harte was a securities analyst and trader for Transamerica Investment Services, which he joined in 1980.
Christopher J. Bonavico, CFA
is a portfolio manager of a portion of the Growth Opportunities Fund. Mr. Bonavico is a Portfolio Manager and Equity Analyst at Jackson Square. Jackson Square manages large-cap growth, smid-cap growth, all-cap growth, and global growth portfolios. Prior to joining Jackson Square, he was a portfolio manager and equity analyst on Delaware Investments’ Focus Growth Equity team from April 2005 to April 2014. The Focus Growth Equity team managed large-cap growth, smid-cap growth, all-cap growth, and global growth portfolios. Prior to Delaware Investments, Mr. Bonavico was a principal and portfolio manager at Transamerica Investment Management, where he managed subadvised funds and institutional separate accounts. Before joining Transamerica in 1993, he was a research analyst for Salomon Brothers.
Christopher M. Ericksen, CFA
is a portfolio manager of a portion of the Growth Opportunities Fund. Mr. Ericksen is a Portfolio Manager and Equity Analyst at Jackson Square. Jackson Square manages large-cap growth, smid-cap growth, all-cap growth, and global growth portfolios. Prior to joining Jackson Square, he was a portfolio manager and equity analyst on Delaware Investments’ Focus Growth Equity team from April 2005 to April 2014. The Focus Growth Equity team managed large-cap growth, smid-cap growth, all-cap growth, and global growth portfolios. Prior to joining Delaware Investments, Mr. Ericksen was a portfolio manager at Transamerica
– 152 –
Investment Management, where he also managed institutional separate accounts. Before joining Transamerica in 2004, he was a vice president at Goldman Sachs. During his 10 years there, he worked in investment banking as well as investment management.
Daniel J. Prislin, CFA
is a portfolio manager of a portion of the Growth Opportunities Fund. Mr. Prislin is a Portfolio Manager and Equity Analyst at Jackson Square. Jackson Square manages large-cap growth, smid-cap growth, all-cap growth, and global growth portfolios. Prior to joining Jackson Square, he was a portfolio manager and equity analyst on Delaware Investments’ Focus Growth Equity team from April 2005 to April 2014. The Focus Growth Equity team managed large-cap growth, smid-cap growth, all-cap growth, and global growth portfolios. Prior to joining Delaware Investments, Mr. Prislin was a principal and portfolio manager at Transamerica Investment Management, where he also managed subadvised funds and institutional separate accounts. Prior to joining Transamerica in 1998, he was a portfolio manager with The Franklin Templeton Group.
Loomis, Sayles & Company, L.P. (“Loomis Sayles”), located at One Financial Center, Boston, Massachusetts 02111, manages a portion of the portfolio of the Diversified Value Fund and Blue Chip Growth Fund. Loomis Sayles is an indirect subsidiary of Natixis Global Asset Management, L.P. which owns, in addition to Loomis Sayles, a number of other asset management and distribution and service entities. Natixis Global Asset Management, L.P. is part of Natixis Global Asset Management, an international asset management group based in Paris, France, that is in turn owned by Natixis, a French investment banking and financial services firm. As of September 30, 2016, Loomis Sayles managed approximately $245.2 billion in assets.
Arthur Barry, CFA
is a portfolio manager of a portion of the Diversified Value Fund. Mr. Barry is a Vice President of Loomis Sayles and a portfolio manager for its large cap value group. Mr. Barry joined Loomis Sayles in 2005. Prior to joining Loomis Sayles, Mr. Barry was a Senior Vice President of State Street Research & Management and portfolio manager for its Large Cap Value Fund. Previously, Mr. Barry was a senior portfolio manager at Invesco Capital Management where he was a member of its large cap value investment team responsible for $1 billion in institutional client accounts. Prior to that, Mr. Barry was a portfolio manager at Federated Research Corp., first as lead portfolio manager for its Capital Appreciation Fund before assuming leadership of its American Leaders Fund. In 2000, he was recognized as one of the Top 100 portfolio managers by Barron’s in its annual ranking of mutual fund stockpickers.
Adam C. Liebhoff
is a portfolio manager of a portion of the Diversified Value Fund. Mr. Liebhoff is a Vice President of Loomis Sayles and portfolio manager for its large cap value group. Mr. Liebhoff began his investment career in 1998 and joined Loomis Sayles in 2007. He rejoined Loomis Sayles after serving as a First Vice President, financial analyst, and portfolio manager – mid cap value at Anchor Capital, LLC from August 2014 to September 2014. From 2007 until July 2014, he served as an equity analyst and senior equity analyst for the large cap value team at Loomis Sayles. Mr. Liebhoff has 17 years of investment experience.
Aziz V. Hamzaogullari, CFA
is the portfolio manager of a portion of the Blue Chip Growth Fund. Mr. Hamzaogullari is a Vice President of Loomis Sayles and portfolio manager of the Loomis Sayles large cap, global, and all cap growth strategies, including the Loomis Sayles Growth mutual funds and products outside the U.S. Mr. Hamzaogullari joined Loomis Sayles in 2010. Prior to joining Loomis Sayles, Mr. Hamzaogullari was a senior portfolio manager of Evergreen Investments, which he joined in 2001. While at Evergreen, Mr. Hamzaogullari was head of Evergreen’s Berkeley Street Growth Equity team and was founder of the research and investment process. Prior to his service with Evergreen, Mr. Hamzaogullari was a senior equity analyst and portfolio manager at Manning & Napier Advisors. Mr. Hamzaogullari has 23 years of investment industry experience.
Massachusetts Financial Services Company (“MFS”), located at 111 Huntington Avenue, Boston, Massachusetts 02199, manages a portion of the portfolio of the Overseas Fund. MFS is a subsidiary of Sun Life of Canada (U.S.) Financial Services Holdings, Inc., which in turn is an indirect majority-owned subsidiary of Sun Life Financial Inc.
– 153 –
(a diversified financial services company). As of September 30, 2016, the MFS organization had approximately $440 billion in net assets under management.
Daniel Ling
is a portfolio manager of a portion of the Overseas Fund. Mr. Ling, an Investment Officer of MFS, has been employed in the investment area of MFS since 2006.
Marcus Smith
is a portfolio manager of a portion of the Overseas Fund. Mr. Smith, an Investment Officer of MFS, has been employed in the investment area of MFS since 1994. Effective April 1, 2017, Mr. Smith will no longer be a portfolio manager of the Fund.
Filipe Benzinho
is a portfolio manager of a portion of the Overseas Fund. Mr. Benzinho, an Investment Officer of MFS, has been employed in the investment area of MFS since 2009.
Metropolitan West Asset Management, LLC (“MetWest”), located at 865 S. Figueroa Street, Suite 1800, Los Angeles, California 90017, manages the investments of the Total Return Bond Fund. A team of investment professionals manages the Fund. The team consists of Tad Rivelle, MetWest’s Chief Investment Officer and Generalist Portfolio Manager, who is responsible for developing the firm’s long-term economic outlook that guides strategies; Laird Landmann, President and Generalist Portfolio Manager, Stephen Kane, CFA, Group Managing Director and Generalist Portfolio Manager, and Bryan Whalen, CFA, Group Managing Director and Generalist Portfolio Manager, who co-manage security selection and the trade execution process. Messrs. Rivelle, Landmann and Kane founded MetWest in August 1996. Mr. Whalen has been with MetWest since May 2004. MetWest is an indirect wholly-owned subsidiary of The TCW Group, Inc. (“TCW”). As of September 30, 2016, MetWest had approximately $197.3 billion in assets under management.
Tad Rivelle
is a portfolio manager of the Total Return Bond Fund. Mr. Rivelle, a Group Managing Director, is Chief Investment Officer, Fixed Income, overseeing over $100 billion in fixed income assets, including nearly $60 billion of mutual fund assets under the TCW and MetWest Funds brand. Prior to joining TCW, he served as Chief Investment Officer for MetWest, an independent institutional investment manager that he cofounded. The MetWest investment team has been recognized for a number of performance related awards, including Morningstar’s Fixed Income Manager of the Year. Mr. Rivelle was also the co-director of fixed income at Hotchkis & Wiley and a portfolio manager at Pacific Investment Management Company LLC (“PIMCO”).
Laird R. Landmann
is a portfolio manager of the Total Return Bond Fund. Mr. Landmann, a Group Managing Director, is the President of MetWest and a Generalist Portfolio Manager in the U.S. Fixed Income Group. He joined TCW in 2009 during the acquisition of MetWest. Mr. Landmann currently serves on the boards of the Trust Company of the West and the Metropolitan West Mutual Funds. Mr. Landmann currently co-manages many of TCW and MetWest’s mutual funds, including the MetWest Total Return Bond Fund, the MetWest High Yield Bond Fund and the TCW Core Fixed Income Fund, and leads the fixed income group’s risk management efforts. He is a leader of the MetWest investment team that was recognized as Morningstar’s Fixed Income Manager of the Year for 2005 and has been nominated for the award eight times. Prior to founding MetWest in 1996, Mr. Landmann was a principal and the co-director of fixed income at Hotchkis and Wiley. He also served as a portfolio manager and vice president at PIMCO.
Stephen M. Kane, CFA
is a portfolio manager of the Total Return Bond Fund. Mr. Kane, a Group Managing Director, is a Generalist Portfolio Manager in the U.S. Fixed Income Group. He joined TCW in 2009 during the acquisition of MetWest. At MetWest, Mr. Kane was responsible for leading MetWest’s AlphaTrak, Ultra Short and Liability Driven Investment (LDI) products, and he co-manages many of the firm’s mutual funds. Under his co-leadership, the MetWest investment team was recognized as Morningstar’s Fixed
– 154 –
Income Manager of the Year for 2005. Prior to establishing MetWest, Mr. Kane was a fixed income portfolio manager at Hotchkis and Wiley. He also served as a Vice President at PIMCO.
Bryan T. Whalen, CFA
is a portfolio manager of the Total Return Bond Fund. Mr. Whalen, a Group Managing Director, is a Generalist Portfolio Manager in the U.S. Fixed Income Group. He joined TCW in 2009 during the acquisition of MetWest as co-head of the Securitized Products division. Prior to joining TCW, Mr. Whalen was a partner and co-head of MetWest’s Securitized Products division. Prior to joining MetWest in 2004, he was a director in the fixed income department at Credit Suisse First Boston in New York. Previously, he was a vice president at Donaldson, Lufkin & Jenrette.
Northern Trust Investments, Inc. (“NTI”), located at 50 South LaSalle Street, Chicago, Illinois 60603, manages the investments of the S&P 500 Index Fund, S&P Mid Cap Index Fund, Russell 2000 Small Cap Index Fund, and MSCI EAFE International Index Fund. NTI, a subsidiary of Northern Trust Corporation, is an Illinois State Banking Corporation and an investment adviser registered under the Investment Advisers Act of 1940, as amended. It primarily manages assets for institutional and individual separately managed accounts, investment companies, and bank common and collective funds. Northern Trust Corporation is regulated by the Board of Governors of the Federal Reserve System as a financial holding company under the U.S. Bank Holding Company Act of 1956, as amended. As of September 30, 2016, Northern Trust Corporation, through its affiliates, had assets under custody of $6.7 trillion and assets under investment management of $945.8 billion.
Brent Reeder
is primarily responsible for the day-to-day management of the S&P 500 Index Fund, S&P Mid Cap Index Fund, and Russell 2000 Small Cap Index Fund. Mr. Reeder is a Senior Vice President at NTI where he is responsible for index equity management in the United States. Mr. Reeder joined NTI in 1998.
Steven Santiccioli
is primarily responsible for the day-to-day management of the MSCI EAFE International Index Fund. Mr. Santiccioli is a Vice President at NTI. Mr. Santiccioli joined NTI in 2003 and manages various quantitative equity portfolios.
OFI Global Institutional, Inc. (“OFI Global”), located at 225 Liberty Street, 11th Floor, New York, NY 10281, manages a portion of the portfolio of the Small Cap Growth Equity Fund. OFI Global is a wholly owned subsidiary of OppenheimerFunds, Inc. (“OFI”), a majority owned, indirect subsidiary of MassMutual. As of September 30, 2016, OFI Global had approximately $8.24 billion in assets under management.
Ronald Zibelli, Jr., CFA
is a co-portfolio manager of a portion of the Small Cap Growth Equity Fund. Mr. Zibelli has been a Senior Portfolio Manager at OFI Global since May 2006. Prior to joining OFI Global, he spent six years at Merrill Lynch Investment Managers, during which time he was a Managing Director and Small Cap Growth Team Leader, responsible for managing 11 portfolios. Prior to joining Merrill Lynch Investment Managers, Mr. Zibelli spent 12 years with Chase Manhattan Bank, including two years as Senior Portfolio Manager (U.S. Small Cap Equity) at Chase Asset Management.
Ash Shah, CFA
is a co-portfolio manager of a portion of the Small Cap Growth Equity Fund. Mr. Shah has been a Senior Portfolio Manager at OFI Global since February 2014. Mr. Shah was a Senior Research Analyst of OFI Global from February 2006 to February 2014. Prior to joining OFI Global, Mr. Shah was a Vice President and Senior Analyst with Merrill Lynch Investment Managers. Prior to that, he was a Vice President and Senior Analyst for BlackRock Financial Management.
Sands Capital Management, LLC (“Sands Capital”), located at 1000 Wilson Boulevard, Suite 3000, Arlington, Virginia 22209, manages a portion of the portfolio of the Growth Opportunities Fund. As of September 30, 2016, Sands Capital had approximately $40.6 billion in assets under management.
– 155 –
Frank M. Sands, CFA
is a portfolio manager of a portion of the Growth Opportunities Fund. Mr. Sands, Chief Investment Officer and Chief Executive Officer, has been with Sands Capital since June 2000. Before joining Sands Capital, he was a Research Analyst, Portfolio Manager, and Principal at Fayez Sarofim & Co. from August 1994 to June 2000.
Wesley A. Johnston, CFA
is a portfolio manager of a portion of the Growth Opportunities Fund. Mr. Johnston, Portfolio Manager and Senior Research Analyst, has been with Sands Capital since 2004.
A. Michael Sramek, CFA
is a portfolio manager of a portion of the Growth Opportunities Fund. Mr. Sramek, Research Analyst, Senior Portfolio Manager, and Managing Director, has been with Sands Capital since 2001. Prior to joining Sands Capital, he was a Research Analyst at Mastrapasqua & Associates during 2000. Prior to obtaining his MBA in 2000, he was an Associate, Plan Sponsor Services at BARRA/Rogers Casey from 1995 to 1998.
Systematic Financial Management, L.P. (“Systematic”), located at 300 Frank W. Burr Boulevard, Glenpointe East, 7th Floor, Teaneck, New Jersey 07666, manages a portion of the portfolio of the Mid-Cap Value Fund. Systematic was founded in 1982 and since 1995 has been a Delaware limited partnership with senior professionals of the firm sharing ownership with Affiliated Managers Group, Inc. As of September 30, 2016, Systematic had approximately $7 billion in assets under management.
Ronald M. Mushock, CFA
is the lead portfolio manager of a portion of the Mid-Cap Value Fund. Mr. Mushock has been the lead portfolio manager for all of Systematic’s mid cap portfolios since their inception in 2000 and all of Systematic’s small/mid cap portfolios since their inception in 2002. Mr. Mushock became a Managing Partner of Systematic in 2005.
D. Kevin McCreesh, CFA
is a portfolio manager of a portion of the Mid-Cap Value Fund. Mr. McCreesh has been the Chief Investment Officer for Systematic since 2004 and has oversight responsibilities for all client portfolios. In addition, Mr. McCreesh serves as the lead portfolio manager for Systematic’s large and small cap portfolios. Mr. McCreesh joined Systematic as a portfolio manager and became a Managing Partner of Systematic in 1996.
T. Rowe Price Associates, Inc. (“T. Rowe Price”), located at 100 East Pratt Street, Baltimore, Maryland 21202, manages a portion of the portfolio of the Blue Chip Growth Fund, Mid Cap Growth Equity II Fund, and Small Company Value Fund. T. Rowe Price, a wholly-owned subsidiary of T. Rowe Price Group, Inc., a publicly-traded financial services holding company, has been managing assets since 1937. As of September 30, 2016, T. Rowe Price and its affiliates had approximately $812.9 billion in assets under management.
Larry J. Puglia, CFA, CPA
is the portfolio manager of a portion of the Blue Chip Growth Fund. Mr. Puglia, investment advisory committee chairman of the T. Rowe Price Blue Chip Growth Fund, has day-to-day responsibility for managing the portfolio and works with the committee in developing and executing the portfolio’s investment program. He is a Vice President of T. Rowe Price. Mr. Puglia joined T. Rowe Price in 1990.
Brian W.H. Berghuis, CFA
is the portfolio manager of a portion of the Mid Cap Growth Equity II Fund. Mr. Berghuis, investment advisory committee chairman, has day-to-day responsibility for managing T. Rowe Price’s portion of the portfolio and works with the committee in developing and executing the portfolio’s investment program. He is a Vice President and Equity Portfolio Manager for T. Rowe Price. He joined T. Rowe Price in 1985.
J. David Wagner, CFA ��
is the portfolio manager of a portion of the Small Company Value Fund. Mr. Wagner, investment advisory committee chairman, has day-to-day responsibility for managing T. Rowe Price’s portion of the portfolio
– 156 –
and works with the committee in developing and executing the portfolio’s investment program. He is a Vice President and Equity Portfolio Manager for T. Rowe Price. Mr. Wagner joined T. Rowe Price in 2000 and his investment experience dates from 1999. Since joining T. Rowe Price, he has served as an equity research analyst and portfolio manager (beginning in 2008).
Wellington Management Company LLP (“Wellington Management”), a Delaware limited liability partnership with principal offices located at 280 Congress Street, Boston, Massachusetts 02210, manages the investments of the Fundamental Value Fund and Fundamental Growth Fund and a portion of the portfolio of the Small Cap Value Equity Fund and Small Cap Growth Equity Fund. Wellington Management is a professional investment counseling firm which provides investment services to investment companies, employee benefit plans, endowments, foundations, and other institutions. Wellington Management and its predecessor organizations have provided investment advisory services for over 80 years. Wellington Management is owned by the partners of Wellington Management Group LLP, a Massachusetts limited liability partnership. As of September 30, 2016, Wellington Management and its investment advisory affiliates had investment management authority with respect to approximately $998 billion in assets.
Karen H. Grimes, CFA
has served as portfolio manager of the Fundamental Value Fund since 2008. Ms. Grimes is a Senior Managing Director and Equity Portfolio Manager of Wellington Management and joined the firm as an investment professional in 1995.
Paul E. Marrkand, CFA
is the portfolio manager of the Fundamental Growth Fund. Mr. Marrkand is a Senior Managing Director and Equity Portfolio Manager of Wellington Management and joined the firm as an investment professional in 2005.
Mario E. Abularach, CFA
has been involved in portfolio management and securities analysis for the portion of the Small Cap Growth Equity Fund managed in the small capitalization growth style since 2006. Mr. Abularach is a Senior Managing Director and Equity Research Analyst of Wellington Management and joined the firm as an investment professional in 2001.
Shaun F. Pedersen
has served as portfolio manager of a portion of the Small Cap Value Equity Fund since 2009. Mr. Pedersen is a Senior Managing Director and Equity Portfolio Manager of Wellington Management and joined the firm as an investment professional in 2004.
Timothy J. McCormack, CFA
has been involved in portfolio management and securities analysis for the Small Cap Value Equity Fund since 2009. Mr. McCormack is a Senior Managing Director and Equity Portfolio Manager of Wellington Management and joined the firm as an investment professional in 2000.
Kenneth L. Abrams
has served as portfolio manager of the portion of the Small Cap Growth Equity Fund managed in the small capitalization opportunities style since 2001. Mr. Abrams is a Senior Managing Director and Equity Portfolio Manager of Wellington Management and joined the firm as an investment professional in 1986.
Daniel J. Fitzpatrick, CFA
has been involved in portfolio investment and securities analysis for the portion of the Small Cap Growth Equity Fund managed in the small capitalization opportunities style since 2001. Mr. Fitzpatrick is a Senior Managing Director and Equity Research Analyst of Wellington Management and joined the firm as an investment professional in 1998.
Steven C. Angeli, CFA
has served as portfolio manager of the portion of the Small Cap Growth Equity Fund managed in the small capitalization growth style since 2004. Mr. Angeli is a Senior Managing Director and Equity Portfolio Manager of Wellington Management and joined the firm as an investment professional in 1994.
– 157 –
Stephen Mortimer
has been involved in portfolio management and securities analysis for the portion of the Small Cap Growth Equity Fund managed in the small capitalization growth style since 2006. Mr. Mortimer is a Senior Managing Director and Equity Portfolio Manager of Wellington Management and joined the firm as an investment professional in 2001.
Western Asset Management Company (“Western Asset”), established in 1971, is located at 385 E. Colorado Boulevard, Pasadena, California 91101. Western Asset Management Company Limited (“Western Asset Limited”) was founded in 1984 and is located at 10 Exchange Square, Primrose Street, London, EC 2A2EN, United Kingdom. As of September 30, 2016, total assets under management by Western Asset and Western Asset Limited were approximately $361.6 billion and $38.5 billion, respectively. Western Asset Limited is affiliated with Western Asset, jointly managing the Strategic Bond Fund. Western Asset Limited provides certain subadvisory services relating to currency transactions and investments in non-U.S. dollar denominated securities and related foreign currency instruments. Expertise from Western Asset Limited’s investment professionals add local sector investment experience as well as the ability to trade in local markets. Western Asset and Western Asset Limited maintain constant interaction and coordination between their investment professionals to maintain a unified and cohesive investment management approach.
S. Kenneth Leech
is Western Asset’s and Western Asset Limited’s Chief Investment Officer and a portfolio manager of the Fund. Mr. Leech has 40 years of industry experience, 27 of them with the Firm. Previously, he worked as a portfolio manager at Greenwich Capital Markets, The First Boston Corporation, and National Bank of Detroit.
Mark S. Lindbloom
is a portfolio manager of the Fund. Mr. Lindbloom has 39 years of industry experience, 12 of them with the Firm. Previously, he worked as a portfolio manager at Citigroup Asset Management and Brown Brothers Harriman & Co.
Carl L. Eichstaedt, CFA
is a portfolio manager of the Fund. Mr. Eichstaedt has 31 years of industry experience, 23 of them with the Firm. Previously, he worked as a portfolio manager at Harris Investment Management and Security Pacific Investment Management Company.
Michael C. Buchanan, CFA
is Western Asset’s and Western Asset Limited’s Deputy Chief Investment Officer and a portfolio manager of the Fund. Mr. Buchanan has 27 years of industry experience, 12 of them with the Firm. Previously, he was the Head of U.S. Credit Products at Credit Suisse Asset Management and worked as a portfolio manager for Janus Capital Management, BlackRock Financial Management, and Conseco Capital Management.
Chia-Liang Lian, CFA
is Western Asset’s and Western Asset Limited’s Head of Emerging Markets Debt and a portfolio manager of the Fund. Mr. Lian has 24 years of industry experience, five of them with the Firm. Previously, he worked as a portfolio manager at PIMCO.
The Funds’ SAI provides additional information about each portfolio manager’s compensation, other accounts managed by the portfolio managers, and each portfolio manager’s ownership of securities in the relevant Fund.
MML Advisers has received exemptive relief from the SEC to permit it to change subadvisers or hire new subadvisers for a number of the series of MassMutual Select Funds (the “Trust”) from time to time without obtaining shareholder approval. (In the absence of that exemptive relief, shareholder approval might otherwise be required.) Several other mutual fund companies have received similar relief. MML Advisers believes having this authority is important, because it allows MML Advisers to remove and replace a subadviser in a quick, efficient, and cost-effective fashion when, for example, the subadviser’s performance is inadequate or the subadviser no
– 158 –
longer is able to meet a Trust series’ investment objective and strategies. Pursuant to the exemptive relief, MML Advisers will provide to a Fund’s shareholders, within 90 days of the hiring of a new subadviser, an information statement describing the new subadviser. MML Advisers will not rely on this authority for any Fund unless the Fund’s shareholders have approved this arrangement. As of the date of this Prospectus, this exemptive relief is available to each Fund.
Other Information
On December 7, 2010, the Trust was named as a defendant and putative member of the proposed defendant class of shareholders named in an adversary proceeding brought by The Official Committee of Unsecured Creditors of Tribune Company (the “Official Committee”) in the U.S. Bankruptcy Court for the District of Delaware, in connection with Tribune Company’s Chapter 11 bankruptcy proceeding (In re Tribune Company). The proceeding relates to a leveraged buyout (“LBO”) transaction by which Tribune Company converted to a privately-held company in 2007, and the putative defendant class is comprised of beneficial owners of shares of Tribune Company who received proceeds (the “Proceeds”) of the LBO. The Official Committee seeks to recover payments of those Proceeds.
The potential amounts sought to be recovered from the Diversified Value Fund and S&P 500 Index Fund, plus interest and the Official Committee’s court costs, are approximately $1,621,800 and $1,186,430, respectively.
In addition, on June 2, 2011, the Diversified Value Fund and S&P 500 Index Fund were named as defendants in a closely related, parallel adversary proceeding brought in connection with the Tribune Company’s LBO by Deutsche Bank Trust Company Americas, in its capacity as successor indenture trustee for a certain series of Senior Notes, Law Debenture Trust Company of New York, in its capacity as successor indenture trustee for a certain series of Senior Notes, and Wilmington Trust Company, in its capacity as successor indenture trustee for the PHONES Notes (together, the “Plaintiffs”), in the United States District Court for the District of Massachusetts. The Plaintiffs also seek to recover payments of the Proceeds.
The Funds cannot predict the outcome of these proceedings. If the proceedings were to be decided in a manner adverse to the Funds, or if the Funds were to enter into a settlement agreement with the Official Committee or the Plaintiffs, as applicable, the payment of such judgment or settlement could potentially have a material adverse effect on the Funds’ NAVs depending on the net assets of each applicable Fund at the time of such judgment or settlement.
– 159 –
About the Classes of Shares – I, R5, Service, Administrative, A, R4,
and R3 Shares
Each Fund offers seven Classes of shares. The only differences among the various Classes are that (a) each Class is subject to different expenses specific to that Class, including any expenses under a Rule 12b-1 Plan and administrative and shareholder service expenses; (b) each Class has a different Class designation; (c) each Class has exclusive voting rights with respect to matters solely affecting such Class; and (d) each Class has different exchange privileges. Not all of the Classes of a Fund are available in every state.
Shares of all Classes, except Class I shares, are subject to an administrative and shareholder services fee described above under “Management of the Funds – Investment Adviser.” In addition, Class A, Class R3, and Class R4 shares are subject to servicing or distribution fees paid under a Rule 12b-1 Plan. Class A, Administrative Class, and Service Class shares are subject to an additional supplemental shareholder services fee, described under “Distribution Plans, Shareholder Servicing, and Payments to Intermediaries,” below. Different fees and expenses of a Class will affect performance of that Class. For actual past expenses of each share Class, see the “Financial Highlights” tables later in this Prospectus. Investors may receive different levels of service in connection with investments in different Classes of shares, and intermediaries may receive different levels of compensation in connection with each share Class. For additional information, call us toll free at 1-888-309-3539 or contact a sales representative or financial intermediary who offers the Classes.
Class I, Class R5, Service Class, and Administrative Class shares are offered primarily to institutional investors through institutional distribution channels, such as employer-sponsored retirement plans or through broker-dealers, financial institutions, or insurance companies. Class A, Class R4, and Class R3 shares are offered primarily through other distribution channels, such as broker-dealers or financial institutions. All Classes of shares are available for purchase by insurance company separate investment accounts, qualified plans under Section 401(a) of the Code, Code Section 403(b) plans, Code Section 457 plans, non-qualified deferred compensation plans, and other institutional investors.
Mutual funds and collective trust funds may purchase Class I, Class R5, and Service Class shares. Class A, Class R3, Class R4, and Class R5 shares may be purchased by voluntary employees’ beneficiary associations described in Code Section 501(c)(9). Class A shares of any Fund, with the exception of the Total Return Bond Fund and S&P 500 Index Fund may be purchased by individual retirement accounts described in Code Section 408. Class R4 shares of the Total Return Bond Fund and S&P 500 Index Fund may also be purchased by individual retirement accounts described in Code Section 408.
Additional Information.
A plan or institutional investor will be permitted to purchase shares of a class based upon the expected size (over time), servicing needs, or distribution or servicing costs for the plan or institutional investor as determined by MML Distributors, LLC (the “Distributor”) or MassMutual, as applicable. A financial intermediary may, by agreement with the Distributor or MassMutual, make available to its clients shares of one class or a limited number of classes of the Funds. An investor should consult its financial intermediary for information (including expense information) regarding the share class(es) the intermediary will make available for purchase by the investor.
Eligible purchasers must generally have an agreement with MassMutual or a MassMutual affiliate to purchase shares. There is no minimum plan or institutional investor size to purchase Class A, Class R4, and Class R3 shares.
Class A shares may be offered to present or former officers, directors, trustees, and employees (and their spouses, parents, children, and siblings) of the Funds, MassMutual, and its affiliates and retirement plans established by them for their employees.
– 160 –
Initial Sales Charges
Class A shares are sold at their offering price, which is normally NAV plus an initial sales charge. However, in some cases, as described below, purchases are not subject to an initial sales charge, and the offering price will be the NAV. In other cases, reduced sales charges may be available, as described below. Out of the amount you invest, the Fund receives the NAV to invest for your account.
The sales charge varies depending on the amount of your purchase. A portion of the sales charge may be retained by the Distributor or allocated to your dealer as a concession. The Distributor reserves the right to reallow the entire sales charge as a concession to dealers. The current sales charge rates and concessions paid to dealers and brokers are as follows:
| Front-End Sales Charge (As a Percentage of Offering Price) /Front-End Sales Charge (As a Percentage of Net Amount Invested)/Concession (As a Percentage of Offering Price) for Different Purchase Amounts: | ||||||||||||
| Price Breakpoints | General Equity | General Taxable Bond | Shorter- Bond | |||||||||
Less than | | 5.75%/ 6.10%/ 4.75% |
| | 4.75%/ 4.99%/ 4.00% |
| | 3.50%/ 3.63%/ 3.00% |
| |||
$25,000- | | 5.50%/ 5.82%/ 4.75% |
| | 4.75%/ 4.99%/ 4.00% |
| | 3.50%/ 3.63%/ 3.00% |
| |||
$50,000- | | 4.75%/ 4.99%/ 4.00% |
| | 4.50%/ 4.71%/ 3.75% |
| | 3.50%/ 3.63%/ 3.00% |
| |||
$100,000- | | 3.75%/ 3.90%/ 3.00% |
| | 3.50%/ 3.63%/ 2.75% |
| | 3.00%/ 3.09%/ 2.50% |
| |||
$250,000- | | 2.50%/ 2.56%/ 2.00% |
| | 2.00%/ 2.04%/ 2.25% |
| | 2.50%/ 2.56%/ 2.00% |
| |||
$500,000- | | 2.00%/ 2.04%/ 1.60% |
| | 2.00%/ 2.04%/ 1.60% |
| | 2.00%/ 2.04%/ 1.50% |
| |||
$1,000,000 | | None/ None/ 1.00% |
| | None/ None/ 1.00% |
| | None/ None/ .50% |
| |||
A reduced sales charge may be obtained for Class A shares under the Funds’ “Rights of Accumulation” because of the economies of sales efforts and reduction in expenses realized by the Distributor, dealers, and brokers making such sales.
To qualify for the lower sales charge rates that apply to larger purchases of Class A shares, you can add together:
| · | Current purchases of Class A shares of more than one Fund subject to an initial sales charge to reduce the sales charge rate that applies to current purchases of Class A shares; and |
| · | Class A shares of Funds you previously purchased subject to an initial or contingent deferred sales charge to reduce the sales charge rate for current purchases of Class A shares, provided that you still hold your investment in the previously purchased Funds. |
The Distributor will add the value, at current offering price, of the Class A shares you previously purchased and currently own to the value of current purchases to determine the sales charge rate that applies. The reduced sales charge will apply only to current purchases. You must request the reduced sales charge
when you buy Class A shares and inform your broker-dealer or other financial intermediary of Class A shares of any other Funds that you own. Information regarding reduced sales charges can be found on the MassMutual website at http://www.massmutual.com/funds.
Contingent Deferred Sales Charges
There is no initial sales charge on purchases of Class A shares of any one or more of the Funds aggregating $1 million or more. The Distributor pays dealers of record concessions in an amount equal to 1.0%, or .50% of purchases of $1 million or more, as shown in the above table. The concession will not be paid on purchases of shares by exchange or that were previously subject to a front-end sales charge and dealer concession.
If you redeem any of those shares within a holding period of 18 months from the date of their purchase, a contingent deferred sales charge of 1.0% will be deducted from the redemption proceeds (unless you are eligible for a waiver of that sales charge based on the categories listed below and you advise the transfer agent, MassMutual, or another intermediary of your eligibility for the waiver when you place your redemption request).
– 161 –
All contingent deferred sales charges will be based on the lesser of the NAV of the redeemed shares at the time of redemption or the original NAV. A contingent deferred sales charge is not imposed on:
| · | the amount of your account value represented by an increase in NAV over the initial purchase price, |
| · | shares purchased by the reinvestment of dividends or capital gains distributions, or |
| · | shares redeemed in the special circumstances described below. |
To determine whether a contingent deferred sales charge applies to a redemption, the Fund redeems shares in the following order:
| 1. | shares acquired by reinvestment of dividends and capital gains distributions, and |
| 2. | shares held the longest. |
Contingent deferred sales charges are not charged when you exchange shares of the Fund for shares of any other Fund. However, if you exchange them within the applicable contingent deferred sales charge holding period, the holding period will carry over to the Fund whose shares you acquire. Similarly, if you acquire shares of a Fund by exchanging shares of another Fund that are still subject to a contingent deferred sales charge holding period, that holding period will carry over to the acquired Fund.
– 162 –
Waivers of Class A Initial Sales Charges
The Class A sales charges will be waived for shares purchased in the following types of transactions:
| · | Purchases into insurance company separate investment accounts. |
| · | Purchases into Retirement Plans or other employee benefit plans. |
| · | Purchases of Class A shares aggregating $1 million or more of any one or more of the Funds. |
| · | Purchases into accounts for which the broker-dealer of record has entered into a special agreement with the Distributor allowing this waiver. |
| · | Purchases into accounts for which no sales concession is paid to any broker-dealer or other financial intermediary at the time of sale. |
| · | Shares sold to MassMutual or its affiliates. |
| · | Shares sold to registered management investment companies or separate accounts of insurance companies having an agreement with MassMutual or the Distributor for that purpose. |
| · | Shares issued in plans of reorganization to which the Fund is a party. |
| · | Shares sold to present or former officers, directors, trustees, or employees (and their “immediate families(1)”) of the Fund, MassMutual, and its affiliates. |
| · | Shares sold to a portfolio manager of the Fund. |
Waivers of Class A Contingent Deferred Sales Charges
The Class A contingent deferred sales charges will not be applied to shares purchased in certain types of transactions or redeemed in certain circumstances described below.
| A. | Waivers for Redemptions in Certain Cases. |
The Class A contingent deferred sales charges will be waived for redemptions of shares in the following cases:
| · | Redemptions from insurance company separate investment accounts. |
(1) The term “immediate family” refers to one’s spouse, children, grandchildren, grandparents, parents, parents-in-law, brothers and sisters, sons- and daughters-in-law, a sibling’s spouse, a spouse’s siblings, aunts, uncles, nieces, and nephews; relatives by virtue of a remarriage (step-children, step-parents, etc.) are included.
| · | Redemptions from Retirement Plans or other employee benefit plans. |
| · | Redemptions from accounts other than Retirement Plans following the death or disability of the last surviving shareholder, including a trustee of a grantor trust or revocable living trust for which the trustee is also the sole beneficiary. The death or disability must have occurred after the account was established, and for disability you must provide evidence of a determination of disability by the Social Security Administration. |
| · | Redemptions from accounts for which the broker-dealer of record has entered into a special agreement with the Distributor allowing this waiver. |
| · | Redemptions from accounts for which no sales concession was paid to any broker-dealer or other financial intermediary at the time of sale. |
| · | Redemptions of Class A shares under an Automatic Withdrawal Plan from an account other than a Retirement Plan if the aggregate value of the redeemed shares does not exceed 10% of the account’s value annually. |
| · | In the case of an IRA, to make distributions required under a divorce or separation agreement described in Section 71(b) of the Code. |
| B. | Waivers for Shares Sold or Issued in Certain Transactions. |
The contingent deferred sales charge is also waived on Class A shares sold or issued in the following cases:
| · | Shares sold to MassMutual or its affiliates. |
| · | Shares sold to registered management investment companies or separate accounts of insurance companies having an agreement with MassMutual or the Distributor for that purpose. |
| · | Shares issued in plans of reorganization to which the Fund is a party. |
| · | Shares sold to present or former officers, directors, trustees, or employees (and their “immediate families(1)”) of the Fund, MassMutual, and its affiliates. |
| · | Shares sold to a present or former portfolio manager of the Fund. |
– 163 –
Distribution Plans, Shareholder Servicing, and Payments to Intermediaries
Shares of all classes of the Funds, other than Class A shares, are sold without a front-end sales charge, and none of the Funds’ shares are subject to a deferred sales charge. Class A shares are sold at NAV per share plus an initial sales charge.
Rule 12b-1 fees. The Funds have adopted a Rule 12b-1 Plan for their Class A, Class R3, and Class R4 shares. Under the Plan, a Fund may make payments at an annual rate of up to .25% of the average daily net assets attributable to its Class A shares and Class R4 shares, and up to .50% of the average daily net assets attributable to its Class R3 shares. The plan is a compensation plan, under which the Funds make payments to the Distributor for the services it provides and for the expenses it bears in connection with the distribution of shares of those classes and for the servicing of shareholders of those classes. Because Rule 12b-1 fees are paid out of the Funds’ Class A, Class R3, and Class R4 assets on an ongoing basis, they will increase the cost of your investment and may cost you more than paying other types of sales loads. All shareholders of Class A, Class R3, and Class R4 shares share in the expense of Rule 12b-1 fees paid by those classes. A Fund may pay distribution fees and other amounts described in this Prospectus at a time when shares of that Fund are unavailable for purchase.
Shareholder servicing payments. MML Advisers pays all or a portion of the administrative and shareholder services fee it receives from each Fund, as described above under “Management of the Funds – Investment Adviser,” to MassMutual as compensation for, or reimbursement of expenses relating to, services provided to shareholders of the Funds. In addition, each Fund makes payments to MassMutual under a Supplemental Shareholder Services Agreement with respect to its Class A shares, Administrative Class shares, and Service Class shares, based on the average daily net assets attributable to the share classes, at an annual rate of .15% for Class A shares and Administrative Class shares and .05% for Service Class shares.
Payments to Intermediaries
Payment for recordkeeping services (MassMutual). MassMutual provides recordkeeping services and other shareholder services to retirement plans and other employee benefit plans. Each plan agrees a level of service to be provided by MassMutual, and specifies the Funds and share classes of the Funds that will be offered to plan participants. Plans typically
select the share classes with the intention of ensuring that MassMutual will receive a level of compensation, from the Rule 12b-1 fees and shareholder servicing payments made with respect to those share classes, sufficient to compensate MassMutual for the recordkeeping services the plans desire. All amounts retained by MassMutual from Rule 12b-1 fees and shareholder service fees paid by a Fund are intended as compensation to MassMutual for recordkeeping services provided by it.
Other payments. The Distributor and MassMutual may make payments to financial intermediaries for distribution and/or shareholder services provided by them. Financial intermediaries are firms that, for compensation, sell shares of mutual funds, including the Funds, and/or provide certain administrative and account maintenance services to mutual fund shareholders. Financial intermediaries may include, among others, brokers, financial planners or advisers, banks, and insurance companies. In some cases, a financial intermediary may hold its clients’ Fund shares in nominee or street name. Shareholder services provided by a financial intermediary may (though they will not necessarily) include, among other things: processing and mailing trade confirmations, periodic statements, prospectuses, annual reports, semiannual reports, shareholder notices, and other SEC-required communications; capturing and processing tax data; issuing and mailing dividend checks to shareholders who have selected cash distributions; preparing record date shareholder lists for proxy solicitations; collecting and posting distributions to shareholder accounts; and establishing and maintaining systematic withdrawals and automated investment plans and shareholder account registrations.
The Distributor and MassMutual may retain a portion of the Rule 12b-1 payments and/or shareholder servicing payments received by them, or they may pay the full amount to intermediaries. Rule 12b-1 fees may be paid to financial intermediaries in advance for the first year after Class A, Class R4, and Class R3 shares are sold. After the first year, those fees will be paid on a quarterly basis.
The compensation paid to a financial intermediary is typically paid continually over time, during the period when the intermediary’s clients hold
investments in the Funds. The amount of continuing compensation paid to different financial intermediaries for distribution and/or shareholder
– 164 –
services varies. The compensation is typically a percentage of the value of the financial intermediary’s clients’ investments in the Funds or a per account fee. The variation in compensation may, but will not necessarily, reflect enhanced or additional services provided by the intermediary.
Additional information. The Distributor may directly, or through an affiliate, pay a sales concession of up to 1.00% of the purchase price of Service Class, Administrative Class, Class A, Class R4, and Class R3 shares to broker-dealers or other financial intermediaries at the time of sale. However, the total amount paid to broker-dealers or other financial intermediaries at the time of sale, including any advance of Rule 12b-1 service fees or shareholder service fees, may not be more than 1.00% of the purchase price.
In addition to the various payments described above, MML Advisers in its discretion may directly, or through an affiliate, pay up to .35% of the amount invested to MassMutual or other intermediaries who provide services on behalf of Class I (except for the Total Return Bond Fund), Class R5 (except for the S&P 500 Index Fund), Service Class, Administrative Class, Class A, Class R4, and Class R3 shares. This compensation is paid by MML Advisers from its own assets. The payments on account of Class I (except for the Total Return Bond Fund), Class R5 (except for the S&P 500 Index Fund), Service Class, Administrative Class, Class A, Class R4, and Class R3 shares will be based on criteria established by MML Advisers. In the event that amounts paid by the Funds to MML Advisers as administrative or management fees are deemed indirect financing of distribution or servicing costs for Class I (except for the Total Return Bond Fund), Class R5 (except for the S&P 500 Index Fund), Service Class, or Administrative Class shares, the Funds have adopted a Rule 12b-1 Plan authorizing such payments. No additional fees are paid by the Funds under this plan. Annual compensation paid on account of Class I (except for the Total Return Bond Fund), Class R5 (except for the S&P 500 Index Fund), Service Class, Administrative Class, Class A, Class R4, and Class R3 shares will be paid quarterly, in arrears.
The Distributor, MML Advisers, or MassMutual may also directly, or through an affiliate, make payments, out of its own assets, to intermediaries, including broker-dealers, insurance agents, and other service providers, that relate to the sale of shares of the Funds or certain of MassMutual’s variable annuity
contracts for which the Funds are underlying investment options. This compensation may take the form of:
| • | Payments to administrative service providers that provide enrollment, recordkeeping, and other services to pension plans; |
| • | Cash and non-cash benefits, such as bonuses and allowances or prizes and awards, for certain broker-dealers, administrative service providers, and MassMutual insurance agents; |
| • | Payments to intermediaries for, among other things, training of sales personnel, conference support, marketing, or other services provided to promote awareness of MassMutual’s products; |
| • | Payments to broker-dealers and other intermediaries that enter into agreements providing the Distributor with access to representatives of those firms or with other marketing or administrative services; and |
| • | Payments under agreements with MassMutual not directly related to the sale of specific variable annuity contracts or the Funds, such as educational seminars and training or pricing services. |
In some instances, compensation may be made available only to certain financial intermediaries whose representatives have sold or are expected to sell significant amounts of shares. Dealers may not use sales of the Funds’ shares to qualify for this compensation to the extent prohibited by the laws or rules of any state or any self-regulatory agency, such as the Financial Industry Regulatory Authority.
These compensation arrangements are not offered to all intermediaries and the terms of the arrangements may differ among intermediaries. These arrangements may provide an intermediary with an incentive to recommend one mutual fund over another, one share class over another, or one insurance or annuity contract over another. You may want to take these compensation arrangements into account when evaluating any recommendations regarding the Funds or any contract using the Funds as investment options. You may contact your intermediary to find out more information about the compensation they may receive in connection with your investment.
– 165 –
Buying, Redeeming, and Exchanging Shares
The Funds sell their shares at a price equal to their NAV plus any initial sales charge that applies (see “Determining Net Asset Value” below). The Funds have authorized one or more broker-dealers or other intermediaries to receive purchase orders on their behalf. Such broker-dealers or other intermediaries may themselves designate other intermediaries to receive purchase orders on the Funds’ behalf. Your purchase order will be priced at the next NAV calculated after the order is received in good form by the transfer agent, MML Advisers, such a broker-dealer, or another intermediary authorized for this purpose. If you purchase shares through a broker-dealer or other intermediary, then, in order for your purchase to be based on a Fund’s next determined NAV, the broker-dealer or other intermediary must receive your request before the close of regular trading on the NYSE (normally, 4:00 p.m. Eastern time), and the broker-dealer or other intermediary must subsequently communicate the request properly to the Funds. Shares purchased through a broker-dealer or other intermediary may be subject to transaction and/or other fees. The Funds will suspend selling their shares during any period when the determination of NAV is suspended. The Funds can reject any purchase order and can suspend purchases if they believe it is in their best interest.
The Funds have authorized one or more broker-dealers or other intermediaries to receive redemption requests on their behalf. Such broker-dealers or other intermediaries may themselves designate other intermediaries to receive redemption requests on the Funds’ behalf. The Funds redeem their shares at their next NAV computed after your redemption request is received by the transfer agent, MML Advisers, such a broker-dealer, or another intermediary. If you redeem shares through a broker-dealer or other intermediary, then, in order for your redemption price to be based on a Fund’s next determined NAV, the broker-dealer or other intermediary must receive your request before the close of regular trading on the NYSE, and the broker-dealer or other intermediary must subsequently communicate the request properly to the Funds. Shares redeemed through a broker-dealer or other intermediary may be subject to transaction and/or other fees. You will usually receive payment for your shares within 7 days after your redemption request is received in good form. If, however, you request redemption of shares recently purchased by check, you may not receive payment until the check has been collected, which may take up to 15 days from time of purchase. The Funds can also suspend or postpone payment, when permitted by applicable law and regulations.
Risk of Substantial Redemptions. If substantial numbers of shares in a Fund were to be redeemed at the same time or at approximately the same time, the Fund might be required to liquidate a significant portion of its investment portfolio quickly to meet the redemptions. A Fund might be forced to sell portfolio securities at prices or at times when it would otherwise not have sold them, resulting in a reduction in the Fund’s NAV; in addition, a substantial reduction in the size of a Fund may make it difficult for the investment adviser or subadviser to execute its investment program successfully for the Fund for a period following the redemptions. Similarly, the prices of the portfolio securities of a Fund might be adversely affected if one or more other investment accounts managed by the investment adviser or subadviser in an investment style similar to that of the Fund were to experience substantial redemptions and those accounts were required to sell portfolio securities quickly or at an inopportune time.
Generally, you can exchange shares of one Fund for the same class of shares of another Fund, except in the case of the Total Return Bond Fund and S&P 500 Index Fund. For individual retirement accounts described in Code Section 408, Class R4 shares of the Total Return Bond Fund and S&P 500 Index Fund may only be exchanged for Class A shares of another Fund and Class A shares of any other Fund may only be exchanged for Class R4 shares of these Funds. An exchange is treated as a sale of shares in one Fund and a purchase of shares in another Fund at the NAV next determined after the exchange request is received and accepted by the transfer agent, MML Advisers, a broker-dealer, or another intermediary authorized for this purpose. Exchange requests involving a purchase into any Fund (except the Strategic Bond Fund), however, will not be accepted if you have already made a purchase followed by a redemption involving the same Fund within the last 60 days. If you place an order to exchange shares of one Fund for another through a broker-dealer or other intermediary then, in order for your exchange to be effected based on the Funds’ next determined NAVs, the broker-dealer or other intermediary must receive your request before the close of regular trading on the NYSE, and the broker-dealer or other intermediary must subsequently communicate the request properly to the Funds.
Exchanges
Your right to exchange shares is subject to applicable regulatory requirements or contractual obligations.
– 166 –
The Funds may limit, restrict, or refuse exchange purchases, if, in the opinion of MML Advisers:
| · | you have engaged in excessive trading; |
| · | a Fund receives or expects simultaneous orders affecting significant portions of the Fund’s assets; |
| · | a pattern of exchanges occurs which coincides with a market timing strategy; or |
| · | the Fund would be unable to invest the funds effectively based on its investment objectives and policies or if the Fund would be adversely affected. |
The Funds reserve the right to modify or terminate the exchange privilege as described above on 60 days written notice.
The Funds do not accept purchase, redemption, or exchange orders or compute their NAVs on days
when the NYSE is closed. This includes: weekends, Good Friday, and all federal holidays other than Columbus Day and Veterans Day. Certain foreign markets may be open on days when the Funds do not accept orders or price their shares. As a result, the NAV of a Fund’s shares may change on days when you will not be able to buy or sell shares.
How to Invest
When you buy shares of a Fund through an agreement with MML Advisers, your agreement will describe how you need to submit buy, sell, and exchange orders. Purchase orders must be accompanied by sufficient funds. You can pay by check or Federal Funds wire transfer. You must submit any buy, sell, or exchange orders in “good form” as described in your agreement.
In the case of individuals holding shares in a Fund directly, upon the redemption or exchange of shares in a Fund, the Fund or, if a shareholder purchased shares through a financial intermediary, the financial intermediary generally will be required to provide the shareholder and the Internal Revenue Service (“IRS”) with cost basis and certain other related tax information about the Fund shares redeemed or
exchanged. Please contact the Funds by calling 1-888-309-3539 or consult your financial intermediary, as appropriate, for more information regarding available methods for cost basis reporting and how to select or change a particular method. Please consult your tax adviser to determine which available cost basis method is best for you.
Purchases and exchanges of shares of the Funds should be made for investment purposes only. The Funds discourage, and do not accommodate, excessive trading and/or market timing activity. Excessive trading and/or market timing activity involving the Funds can disrupt the management of the Funds. These disruptions can result in increased expenses and can have an adverse effect on fund performance.
The Trustees, on behalf of the Funds, have approved the policies and procedures adopted by MML Advisers to help identify those individuals or entities MML Advisers determines may be engaging in excessive trading and/or market timing trading activities. MML Advisers monitors trading activity to enforce these procedures. However, those who engage in such activities may employ a variety of techniques to avoid detection. Therefore, despite MML Advisers’ efforts to prevent excessive trading and/or market timing trading activities, there can be no assurance that MML Advisers will be able to
identify all those who trade excessively or employ a market timing strategy and curtail their trading in every instance.
The monitoring process involves scrutinizing transactions in fund shares that exceed certain monetary thresholds or numerical limits within a specified period of time. Trading activity identified by either, or a combination, of these factors, or as a result of any other information actually available at the time, will be evaluated to determine whether such activity might constitute excessive trading and/or market timing activity. When trading activity is determined by a Fund or MML Advisers, in their sole discretion, to be excessive in nature, certain account-related privileges, such as the ability to place purchase, redemption, and exchange orders over the internet, may be suspended for such account.
Omnibus Account Limitations. Omnibus accounts, in which shares are held in the name of an intermediary
– 167 –
on behalf of multiple investors, are a common form of holding shares among retirement plans and other financial intermediaries such as broker-dealers, advisers, and third-party administrators. Not all omnibus accounts apply the policies and procedures adopted by the Funds and MML Advisers. Some omnibus accounts, including accounts traded on certain of MassMutual’s retirement platforms, may have different or less restrictive policies and procedures regarding frequent trading, or no trading restrictions at all. If you hold your Fund shares through an omnibus account, including accounts traded on certain of MassMutual’s retirement platforms, that financial intermediary may impose its own restrictions or limitations to discourage excessive trading and/or market timing activity. You should consult your financial intermediary to find out what trading restrictions, including limitations on exchanges, may apply. The Funds’ ability to identify and deter excessive trading and/or market timing activities through omnibus accounts is limited, and the Funds’ success in accomplishing the objectives of the policies concerning frequent trading of Fund shares in this context depends significantly upon the cooperation of the financial intermediaries. Because the Funds
receive these orders on an aggregated basis and because the omnibus accounts may trade with numerous fund families with differing frequent trading policies, the Funds are limited in their ability to identify or deter those individuals or entities that may be engaging in excessive trading and/or market timing activities. While the Funds and MML Advisers encourage those financial intermediaries to apply the Funds’ policies to their customers who invest indirectly in the Funds, the Funds and MML Advisers may need to rely on those intermediaries to monitor trading in good faith in accordance with its or the Funds’ policies, since individual trades in omnibus accounts are often not disclosed to the Funds. While the Funds will generally monitor trading activity at the omnibus account level to attempt to identify excessive trading and/or market timing activity, reliance on intermediaries increases the risk that excessive trading and/or market timing activity may go undetected. If evidence of possible excessive trading and/or market timing activity is observed by the Funds, the financial intermediary that is the registered owner will be asked to review the account activity, and to confirm to the Funds that appropriate action has been taken to limit any excessive trading and/or market timing activity.
The NAV of each Fund’s shares is determined once daily as of the close of regular trading on the NYSE, on each Business Day. A “Business Day” is every day the NYSE is open. The NYSE normally closes at 4:00 p.m. Eastern Time, but may close earlier on some days. The NYSE currently is not open for trading on New Year’s Day, Martin Luther King, Jr. Day, President’s Day, Good Friday, Memorial Day, Independence Day, Labor Day, Thanksgiving Day, and Christmas Day. Each Fund calculates the NAV of each of its classes of shares by dividing the total value of the assets attributable to that class, less the liabilities attributable to that class, by the number of shares of that class that are outstanding.
Equity securities and derivative contracts that are actively traded on a national securities exchange or contract market are valued on the basis of information furnished by a pricing service, which provides the last reported sale price, or, in the case of futures contracts, the settlement price, for securities or derivatives listed on the exchange or contract market or the official closing price on the NASDAQ National Market System, or in the case of OTC securities for which an
official closing price is unavailable or not reported on the NASDAQ System, the last reported bid price. Portfolio securities traded on more than one national securities exchange are valued at the last price at the close of the exchange representing the principal market for such securities. Debt securities are valued on the basis of valuations furnished by a pricing service, which generally determines valuations taking into account factors such as institutional-size trading in similar securities, yield, quality, coupon rate, maturity, type of issue, trading characteristics, and other market data. Shares of other open-end mutual funds are valued at their closing NAVs as reported on each Business Day.
Investments for which market quotations are readily available are marked to market daily based on those quotations. Market quotations may be provided by third-party vendors or market makers, and may be determined on the basis of a variety of factors, such as broker quotations, financial modeling, and other market data, such as market indexes and yield curves, counterparty information, and foreign exchange rates. U.S. Government and agency securities may be valued
– 168 –
on the basis of market quotations or using a model that may incorporate market observable data such as reported sales of similar securities, broker quotes, yields, bids, offers, quoted market prices, and reference data. The fair values of OTC derivative contracts, including forward, swap, and option contracts related to interest rates, foreign currencies, credit standing of reference entities, equity prices, or commodity prices, may be based on market quotations or may be modeled using a series of techniques, including simulation models, depending on the contract and the terms of the transaction. The fair values of asset-backed securities and mortgage-backed securities are estimated based on models that consider the estimated cash flows of each debt tranche of the issuer, establish a benchmark yield, and develop an estimated tranche-specific spread to the benchmark yield based on the unique attributes of the tranche including, but not limited to, prepayment speed assumptions and attributes of the collateral. Restricted securities are generally valued at a discount to similar publicly traded securities.
Investments for which market quotations are not available or for which a pricing service or vendor does not provide a value, or for which such market quotations or values are considered by the investment adviser or subadviser to be unreliable (including, for example, certain foreign securities, thinly-traded securities, certain restricted securities, certain initial public offerings, or securities whose values may have been affected by a significant event) are stated at fair valuations determined in good faith by the Funds’ Valuation Committee in accordance with procedures approved annually by the Trustees, and under the general oversight of the Trustees. It is possible that
fair value prices will be used by the Funds to a significant extent. The value determined for an investment using the Funds’ fair value procedures may differ from recent market prices for the investment and may be significantly different from the value realized upon the sale of such investment.
The Funds may invest in securities that are traded principally in foreign markets and that trade on weekends and other days when the Funds do not price their shares. As a result, the values of the Funds’ portfolio securities may change on days when the prices of the Funds’ shares are not calculated. The prices of the Funds’ shares will reflect any such changes when the prices of the Funds’ shares are next calculated, which is the next Business Day. The Funds may use fair value pricing more frequently for securities primarily traded in foreign markets because, among other things, most foreign markets close well before the Funds value their securities. The earlier close of these foreign markets gives rise to the possibility that significant events, including broad market moves, may have occurred in the interim. The Funds’ investments may be priced based on fair values provided by a third-party vendor, based on certain factors and methodologies applied by such vendor, in the event that there is movement in the U.S. market, between the close of the foreign market and the time the Funds calculate their NAVs. All assets and liabilities expressed in foreign currencies are converted into U.S. dollars at the mean between the buying and selling rates of such currencies against the U.S. dollar at the end of each Business Day.
The Funds’ valuation methods are also described in the SAI.
– 169 –
Each Fund intends to qualify each year for treatment as a regulated investment company under Subchapter M of the Code. As a regulated investment company, a Fund will not be subject to Federal income taxes on its ordinary income and net realized capital gains that are distributed in a timely manner to its shareholders. However, a Fund’s failure to qualify as a regulated investment company would result in corporate level taxation, and consequently, a reduction in income available for distribution to shareholders. In addition, a Fund that fails to distribute at least 98% of its ordinary income for a calendar year plus 98.2% of its capital gain net income recognized during the one-year period ending October 31 plus any retained amount from the prior year generally will be subject to a non-deductible 4% excise tax on the undistributed amount.
Certain investors, including most tax advantaged plan investors, may be eligible for preferential Federal income tax treatment on distributions received from a Fund and dispositions of Fund shares. This Prospectus does not attempt to describe such preferential tax treatment. Any prospective investor that is a trust or other entity eligible for special tax treatment under the Code that is considering purchasing shares of a Fund, including either directly or in connection with a life insurance company separate investment account, should consult its tax advisers about the Federal, state, local, and foreign tax consequences particular to it, as should persons considering whether to have amounts held for their benefit by such trusts or other entities in shares of a Fund.
Investors are generally subject to Federal income taxes on distributions received in respect of their shares. Distributions are taxed to investors in the manner described herein whether distributed in cash or additional shares. Taxes on distributions of capital gains are determined by how long a Fund owned (or is deemed to have owned) the investments that generated them, rather than by how long the shareholder held the shares. Distributions of a Fund’s ordinary income and short-term capital gains (i.e., gains from capital assets held for one year or less) are taxable to a shareholder as ordinary income. Certain dividends may be eligible for the dividends-received deduction for corporate shareholders to the extent they are reported as such. Dividends properly reported as capital gain dividends (relating to gains from the sale of capital assets held by a Fund for
more than one year) are taxable in the hands of an
investor as long-term gain includible in net capital gain and taxed to individuals at reduced rates. Distributions of investment income reported by a Fund as derived from “qualified dividend income” will be taxed in the hands of individuals at the rates applicable to long-term capital gain, provided that holding period and other requirements are met at both the shareholder and Fund level. Distributions from REITs generally do not qualify as qualified dividend income. The Strategic Bond Fund and the Total Return Bond Fund generally do not expect a significant portion of their distributions to be derived from qualified dividend income.
Section 1411 of the Code generally imposes a 3.8% Medicare contribution tax on the net investment income of certain individuals, trusts, and estates to the extent their income exceeds certain threshold amounts. Net investment income generally includes for this purpose dividends paid by a Fund, including any capital gain dividends, and net capital gains recognized on the sale, redemption, exchange, or other taxable disposition of shares of a Fund. Shareholders are advised to consult their tax advisers regarding the possible implications of this additional tax on their investment in a Fund.
The nature of each Fund’s distributions will be affected by its investment strategies. A Fund whose investment return consists largely of interest, dividends, and capital gains from short-term holdings will distribute largely ordinary income. A Fund whose return comes largely from the sale of long-term holdings will distribute largely capital gain dividends. Distributions are taxable to a shareholder even though they are paid from income or gains earned by a Fund prior to the shareholder’s investment and thus were included in the price paid by the shareholder for his or her shares.
Each Fund intends to pay out as dividends substantially all of its net investment income (which comes from dividends and any interest it receives from its investments). Each Fund also intends to distribute substantially all of its net realized long- and short-term capital gains, if any, after giving effect to any available capital loss carryforwards. For each Fund, distributions, if any, are declared and paid at least annually. Distributions may be taken either in cash or in additional shares of the respective Fund at the Fund’s NAV on the first Business Day after the record date for the distribution, at the option of the
– 170 –
shareholder. A shareholder that itself qualifies as a regulated investment company is permitted to report a portion of its distributions as “qualified dividend income,” provided certain requirements are met.
Any gain resulting from an exchange or redemption of an investor’s shares in a Fund will generally be subject to tax as long-term or short-term capital gain. A loss incurred with respect to shares of a Fund held for six months or less will be treated as a long-term capital loss to the extent of long-term capital gains dividends received with respect to such shares.
A Fund’s investments in foreign securities may be subject to foreign withholding or other taxes. In that case, the Fund’s yield on those securities would be decreased. Shareholders of the Funds other than the BlackRock Global Allocation Fund, Diversified International Fund, MSCI EAFE International Index Fund, and Overseas Fund generally will not be entitled to claim a credit or deduction with respect to such foreign taxes. Each of the BlackRock Global Allocation Fund, Diversified International Fund, MSCI EAFE International Index Fund, and Overseas Fund may be able to elect to “pass through” to its shareholders foreign income taxes that it pays directly or, under certain circumstances, indirectly through its investments in ETFs or other investment companies that are regulated investment companies for U.S. federal income tax purposes. If any of these Funds makes this election, a shareholder of the Fund must include its share of those taxes in gross income as a distribution from the Fund and the shareholder will be allowed to claim a credit (or a deduction, if the shareholder itemizes deductions) for such amounts on its federal tax return subject to certain limitations. Shareholders that are not subject to U.S. federal income tax, and those who invest in a Fund through tax-advantaged accounts (including those who invest through individual retirement accounts or other tax-advantaged retirement plans), generally will receive no benefit from any tax credit or deduction passed through by a Fund. A shareholder that itself qualifies for treatment as a regulated investment company and that qualifies as a “qualified fund of funds” may elect to pass through to its shareholders a tax credit or deduction passed through by a Fund.
In addition, a Fund’s investments in foreign securities, fixed income securities, derivatives, or foreign currencies may increase or accelerate the Fund’s recognition of ordinary income and may affect the timing, amount, or character of the Fund’s distributions.
Certain of a Fund’s investments, including certain debt instruments, could cause the Fund to recognize taxable income in excess of the cash generated by such investments; a Fund could be required to liquidate other investments, including when not otherwise advantageous to do so, in order to make required distributions.
Distributions by a Fund to shareholders that are not “United States persons” within the meaning of the Code (“foreign persons”) properly reported by the Fund as (i) capital gain dividends, (ii) “interest-related dividends” (i.e., U.S.-source interest income that, in general, would not be subject to U.S. federal income tax if earned directly by an individual foreign person), and (iii) “short-term capital gain dividends” (i.e., net short-term capital gains in excess of net long-term capital losses), in each case to the extent such distributions were properly reported as such by the regulated investment company generally are not subject to withholding of U.S. federal income tax. Distributions by a Fund to foreign persons other than capital gain dividends, interest-related dividends, and short-term capital gain dividends generally are subject to withholding of U.S. federal income tax at a rate of 30% (or lower applicable treaty rate). Foreign persons should refer to the SAI for further information, and should consult their tax advisors as to the tax consequences to them of owning Fund shares.
In order to qualify for the special tax treatment accorded regulated investment companies and their shareholders, a Fund must, among other things, derive at least 90% of its gross income from certain specified sources (such income, “qualifying income”). Direct investment in commodities and certain commodities-related investments generally do not, under published IRS guidance, produce qualifying income. The BlackRock Global Allocation Fund intends to gain exposure to the commodities markets indirectly through its investments in the Select Cayman Fund, which, in turn, may hold various types of commodities-related investments.
It is expected that the Select Cayman Fund generally will not be subject to U.S. federal income tax. It will, however, be considered a controlled foreign corporation for U.S. federal income tax purposes, and the BlackRock Global Allocation Fund will be required to include in its income annually amounts earned by the Select Cayman Fund during that year to the extent such earnings constitute subpart F income of the Select Cayman Fund, regardless of
– 171 –
whether such income is distributed by the Select Cayman Fund to the BlackRock Global Allocation Fund. Gains from the sales of investments by the Select Cayman Fund will not be eligible for capital gain treatment, but instead will be treated as ordinary income when included in income by the BlackRock Global Allocation Fund. Furthermore, whether or not the Select Cayman Fund makes a distribution to the BlackRock Global Allocation Fund during the taxable year, the BlackRock Global Allocation Fund generally will be required to distribute the Select Cayman Fund’s income annually to its shareholders in order to avoid any tax liability at the Fund level and continue to be eligible to be treated as a regulated investment company. As a result, the BlackRock Global Allocation Fund may be required to sell assets (including when it is not advantageous to do so) to generate the cash necessary to meet these distribution requirements.
The IRS has issued a private letter ruling to the BlackRock Global Allocation Fund to the effect that subpart F income inclusions derived from the BlackRock Global Allocation Fund’s investment in the Select Cayman Fund will constitute qualifying
income to the BlackRock Global Allocation Fund. The IRS has recently issued proposed regulations providing that subpart F income included in a regulated investment company’s gross income constitutes “qualifying income” only to the extent such income is timely and currently repatriated to the regulated investment company. If the regulations are finalized in their current form, the BlackRock Global Allocation Fund will no longer be able to rely on its previously issued private letter ruling, and subpart F income, if any, realized by the Select Cayman Fund and included in the income of the BlackRock Global Allocation Fund will constitute “qualifying income” only to the extent it is timely and currently repatriated to the BlackRock Global Allocation Fund.
The discussion above is very general. Shareholders should consult their tax advisers for more information about the effect that an investment in a Fund could have on their own tax situations, including possible federal, state, local, and foreign taxes. Also, as noted above, this discussion does not apply to Fund shares held through tax-advantaged retirement plans.
– 172 –
The financial highlights tables are intended to help you understand the Funds’ financial performance for the past 5 years (or shorter periods for newer Funds). Certain information reflects financial results for a single Fund share. The total returns in the tables represent the rate that an investor would have earned on an investment in the Fund (assuming reinvestment of all dividends and distributions). This information has been audited by Deloitte & Touche LLP, an independent registered public accounting firm, whose reports, along with each Fund’s financial statements, are included in the Trust’s Annual Reports, which are available on request.
MASSMUTUAL SELECT TOTAL RETURN BOND FUND
| Income (loss) from investment operations | Less distributions to shareholders | Ratios / Supplemental Data | ||||||||||||||||||||||||||||||||||||||||||||||||||||||
| Net asset value, beginning of the period | Net investment income (loss)c,j | Net realized and unrealized gain (loss) on investments | Total income (loss) from investment operations | From net investment income | From net realized gains | Total distributions | Net asset value, end of the period | Total returnl,m | Net assets, end of the period (000’s) | Ratio of expenses to average daily net assets before expense waiversn | Interest expense to average daily net assetsp | Ratio of expenses to average daily net assets after expense waiversj,n | Net investment income (loss) to average daily net assetsn | |||||||||||||||||||||||||||||||||||||||||||
Class I |
| |||||||||||||||||||||||||||||||||||||||||||||||||||||||
| 9/30/16 | $ | 10.17 | $ | 0.21 | $ | 0.30 | $ | 0.51 | $ | (0.22 | ) | $ | (0.03 | ) | $ | (0.25 | ) | $ | 10.43 | 5.10% | $ | 303,783 | 0.37% | N/A | 0.34% | 2.02% | ||||||||||||||||||||||||||||||
| 9/30/15i | 10.10 | 0.14 | (0.06 | ) | 0.08 | (0.00 | )d | (0.01 | ) | (0.01 | ) | 10.17 | 0.79% | b | 534,131 | 0.39% | a | N/A | 0.34% | a | 1.81% | a | ||||||||||||||||||||||||||||||||||
| 12/31/14 | 10.12 | 0.21 | 0.23 | 0.44 | (0.31 | ) | (0.15 | ) | (0.46 | ) | 10.10 | 4.39% | 459,950 | 0.41% | 0.00% | e | 0.40% | 2.07% | ||||||||||||||||||||||||||||||||||||||
| 12/31/13 | 10.55 | 0.20 | (0.35 | ) | (0.15 | ) | (0.26 | ) | (0.02 | ) | (0.28 | ) | 10.12 | (1.43% | ) | 420,872 | 0.40% | 0.00% | e | N/A | 1.87% | |||||||||||||||||||||||||||||||||||
| 12/31/12 | 9.98 | 0.26 | 0.71 | 0.97 | (0.38 | ) | (0.02 | ) | (0.40 | ) | 10.55 | 9.74% | 440,229 | 0.41% | 0.00% | e | N/A | 2.43% | ||||||||||||||||||||||||||||||||||||||
| 12/31/11 | 10.09 | 0.33 | (0.09 | ) | 0.24 | (0.35 | ) | - | (0.35 | ) | 9.98 | 2.41% | 402,361 | 0.40% | N/A | N/A | 3.26% | |||||||||||||||||||||||||||||||||||||||
Class R5 |
| |||||||||||||||||||||||||||||||||||||||||||||||||||||||
| 9/30/16 | $ | 10.15 | $ | 0.20 | $ | 0.30 | $ | 0.50 | $ | (0.21 | ) | $ | (0.03 | ) | $ | (0.24 | ) | $ | 10.41 | 5.01% | $ | 115,428 | 0.47% | N/A | 0.44% | 1.94% | ||||||||||||||||||||||||||||||
| 9/30/15i | 10.08 | 0.13 | (0.05 | ) | 0.08 | (0.00 | )d | (0.01 | ) | (0.01 | ) | 10.15 | 0.79% | b | 166,482 | 0.49% | a | N/A | 0.44% | a | 1.70% | a | ||||||||||||||||||||||||||||||||||
| 12/31/14 | 10.10 | 0.21 | 0.22 | 0.43 | (0.30 | ) | (0.15 | ) | (0.45 | ) | 10.08 | 4.26% | 148,821 | 0.52% | 0.00% | e | 0.51% | 1.98% | ||||||||||||||||||||||||||||||||||||||
| 12/31/13 | 10.54 | 0.18 | (0.35 | ) | (0.17 | ) | (0.25 | ) | (0.02 | ) | (0.27 | ) | 10.10 | (1.68% | ) | 175,117 | 0.55% | 0.00% | e | N/A | 1.72% | |||||||||||||||||||||||||||||||||||
| 12/31/12 | 9.97 | 0.24 | 0.72 | 0.96 | (0.37 | ) | (0.02 | ) | (0.39 | ) | 10.54 | 9.62% | 169,086 | 0.56% | 0.00% | e | N/A | 2.26% | ||||||||||||||||||||||||||||||||||||||
| 12/31/11 | 10.07 | 0.31 | (0.07 | ) | 0.24 | (0.34 | ) | - | (0.34 | ) | 9.97 | 2.37% | 79,275 | 0.55% | N/A | N/A | 3.02% | |||||||||||||||||||||||||||||||||||||||
Service Class |
| |||||||||||||||||||||||||||||||||||||||||||||||||||||||
| 9/30/16 | $ | 10.17 | $ | 0.19 | $ | 0.31 | $ | 0.50 | $ | (0.19 | ) | $ | (0.03 | ) | $ | (0.22 | ) | $ | 10.45 | 5.04% | $ | 193,887 | 0.57% | N/A | 0.54% | 1.83% | ||||||||||||||||||||||||||||||
| 9/30/15i | 10.12 | 0.12 | (0.06 | ) | 0.06 | (0.00 | )d | (0.01 | ) | (0.01 | ) | 10.17 | 0.59% | b | 209,728 | 0.59% | a | N/A | 0.54% | a | 1.54% | a | ||||||||||||||||||||||||||||||||||
| 12/31/14 | 10.13 | 0.19 | 0.23 | 0.42 | (0.28 | ) | (0.15 | ) | (0.43 | ) | 10.12 | 4.23% | 316,778 | 0.62% | 0.00% | e | 0.62% | k | 1.86% | |||||||||||||||||||||||||||||||||||||
| 12/31/13 | 10.56 | 0.17 | (0.35 | ) | (0.18 | ) | (0.23 | ) | (0.02 | ) | (0.25 | ) | 10.13 | (1.78% | ) | 355,678 | 0.67% | 0.00% | e | N/A | 1.60% | |||||||||||||||||||||||||||||||||||
| 12/31/12 | 9.99 | 0.23 | 0.71 | 0.94 | (0.35 | ) | (0.02 | ) | (0.37 | ) | 10.56 | 9.43% | 481,613 | 0.68% | 0.00% | e | N/A | 2.15% | ||||||||||||||||||||||||||||||||||||||
| 12/31/11 | 10.09 | 0.30 | (0.08 | ) | 0.22 | (0.32 | ) | - | (0.32 | ) | 9.99 | 2.21% | 454,979 | 0.67% | N/A | N/A | 2.89% | |||||||||||||||||||||||||||||||||||||||
Administrative Class |
| |||||||||||||||||||||||||||||||||||||||||||||||||||||||
| 9/30/16 | $ | 10.11 | $ | 0.17 | $ | 0.31 | $ | 0.48 | $ | (0.19 | ) | $ | (0.03 | ) | $ | (0.22 | ) | $ | 10.37 | 4.80% | $ | 80,444 | 0.67% | N/A | 0.64% | 1.73% | ||||||||||||||||||||||||||||||
| 9/30/15i | 10.06 | 0.11 | (0.05 | ) | 0.06 | (0.00 | )d | (0.01 | ) | (0.01 | ) | 10.11 | 0.59% | b | 89,080 | 0.69% | a | N/A | 0.64% | a | 1.49% | a | ||||||||||||||||||||||||||||||||||
| 12/31/14 | 10.07 | 0.18 | 0.23 | 0.41 | (0.27 | ) | (0.15 | ) | (0.42 | ) | 10.06 | 4.14% | 86,220 | 0.72% | 0.00% | e | 0.71% | 1.74% | ||||||||||||||||||||||||||||||||||||||
| 12/31/13 | 10.51 | 0.16 | (0.35 | ) | (0.19 | ) | (0.23 | ) | (0.02 | ) | (0.25 | ) | 10.07 | (1.86% | ) | 107,501 | 0.75% | 0.00% | e | N/A | 1.52% | |||||||||||||||||||||||||||||||||||
| 12/31/12 | 9.95 | 0.22 | 0.71 | 0.93 | (0.35 | ) | (0.02 | ) | (0.37 | ) | 10.51 | 9.35% | 99,987 | 0.76% | 0.00% | e | N/A | 2.06% | ||||||||||||||||||||||||||||||||||||||
| 12/31/11 | 10.07 | 0.29 | (0.08 | ) | 0.21 | (0.33 | ) | - | (0.33 | ) | 9.95 | 2.13% | 66,880 | 0.75% | N/A | N/A | 2.87% | |||||||||||||||||||||||||||||||||||||||
Class A |
| |||||||||||||||||||||||||||||||||||||||||||||||||||||||
| 9/30/16 | $ | 10.13 | $ | 0.15 | $ | 0.31 | $ | 0.46 | $ | (0.18 | ) | $ | (0.03 | ) | $ | (0.21 | ) | $ | 10.38 | 4.62% | $ | 1,943 | 0.92% | N/A | 0.89% | 1.47% | ||||||||||||||||||||||||||||||
| 9/30/15i | 10.10 | 0.11 | (0.07 | ) | 0.04 | (0.00 | )d | (0.01 | ) | (0.01 | ) | 10.13 | 0.39% | b | 1,998 | 0.94% | a | N/A | 0.89% | a | 1.45% | a | ||||||||||||||||||||||||||||||||||
| 12/31/14h | 10.25 | 0.11 | 0.16 | 0.27 | (0.27 | ) | (0.15 | ) | (0.42 | ) | 10.10 | 2.65% | b | 119 | 0.96% | a | 0.00% | e | 0.95% | a | 1.36% | a | ||||||||||||||||||||||||||||||||||
Class R4 | ||||||||||||||||||||||||||||||||||||||||||||||||||||||||
| 9/30/16 | $ | 10.16 | $ | 0.16 | $ | 0.31 | $ | 0.47 | $ | (0.17 | ) | $ | (0.03 | ) | $ | (0.20 | ) | $ | 10.43 | 4.70% | $ | 295,696 | 0.82% | N/A | 0.79% | 1.58% | ||||||||||||||||||||||||||||||
| 9/30/15i | 10.12 | 0.10 | (0.05 | ) | 0.05 | (0.00 | )d | (0.01 | ) | (0.01 | ) | 10.16 | 0.49% | b | 336,956 | 0.84% | a | N/A | 0.79% | a | 1.33% | a | ||||||||||||||||||||||||||||||||||
| 12/31/14 | 10.14 | 0.17 | 0.22 | 0.39 | (0.26 | ) | (0.15 | ) | (0.41 | ) | 10.12 | 3.88% | 385,955 | 0.86% | 0.00% | e | 0.85% | 1.62% | ||||||||||||||||||||||||||||||||||||||
| 12/31/13 | 10.56 | 0.15 | (0.35 | ) | (0.20 | ) | (0.20 | ) | (0.02 | ) | (0.22 | ) | 10.14 | (1.94% | ) | 463,236 | 0.85% | 0.00% | e | N/A | 1.41% | |||||||||||||||||||||||||||||||||||
| 12/31/12 | 9.99 | 0.21 | 0.71 | 0.92 | (0.33 | ) | (0.02 | ) | (0.35 | ) | 10.56 | 9.25% | 766,346 | 0.86% | 0.00% | e | N/A | 1.98% | ||||||||||||||||||||||||||||||||||||||
| 12/31/11 | 10.09 | 0.28 | (0.08 | ) | 0.20 | (0.30 | ) | - | (0.30 | ) | 9.99 | 2.03% | 703,315 | 0.85% | N/A | N/A | 2.71% | |||||||||||||||||||||||||||||||||||||||
Class R3 |
| |||||||||||||||||||||||||||||||||||||||||||||||||||||||
| 9/30/16 | $ | 10.08 | $ | 0.13 | $ | 0.32 | $ | 0.45 | $ | (0.15 | ) | $ | (0.03 | ) | $ | (0.18 | ) | $ | 10.35 | 4.49% | $ | 46,206 | 1.07% | N/A | 1.04% | 1.33% | ||||||||||||||||||||||||||||||
| 9/30/15i | 10.06 | 0.08 | (0.05 | ) | 0.03 | (0.00 | )d | (0.01 | ) | (0.01 | ) | 10.08 | 0.29% | b | 48,998 | 1.09% | a | N/A | 1.04% | a | 1.09% | a | ||||||||||||||||||||||||||||||||||
| 12/31/14 | 10.08 | 0.14 | 0.22 | 0.36 | (0.23 | ) | (0.15 | ) | (0.38 | ) | 10.06 | 3.66% | 49,462 | 1.11% | 0.00% | e | 1.10% | 1.37% | ||||||||||||||||||||||||||||||||||||||
| 12/31/13 | 10.52 | 0.12 | (0.35 | ) | (0.23 | ) | (0.19 | ) | (0.02 | ) | (0.21 | ) | 10.08 | (2.21% | ) | 48,925 | 1.10% | 0.00% | e | N/A | 1.17% | |||||||||||||||||||||||||||||||||||
| 12/31/12 | 9.97 | 0.18 | 0.71 | 0.89 | (0.32 | ) | (0.02 | ) | (0.34 | ) | 10.52 | 9.02% | 44,647 | 1.11% | 0.00% | e | N/A | 1.71% | ||||||||||||||||||||||||||||||||||||||
| 12/31/11 | 10.08 | 0.26 | (0.07 | ) | 0.19 | (0.30 | ) | - | (0.30 | ) | 9.97 | 1.77% | 24,105 | 1.10% | N/A | N/A | 2.50% | |||||||||||||||||||||||||||||||||||||||
| Year ended September 30, 2016 | Period ended September 30, 2015b | Year ended December 31 | ||||||||||||||||||||||
| 2014 | 2013 | 2012 | 2011 | |||||||||||||||||||||
Portfolio turnover rate | 264 | % | 264 | % | 453 | %u | 460 | %u | 501 | %u | 442 | % | ||||||||||||
– 173 –
| a | Annualized. |
| b | Percentage represents the results for the period and is not annualized. |
| c | Per share amount calculated on the average shares method. |
| d | Amount is less than $0.005 per share. |
| e | Amount is less than 0.005%. |
| h | For the period April 1, 2014 (commencement of operations) through December 31, 2014. |
| i | For the period January 1, 2015 through September 30, 2015. |
| j | Computed after giving effect to an agreement by MML Advisers and/or MassMutual to waive certain fees and expenses of the Fund. |
| k | Amount waived had no impact on the ratio of expenses to average daily net assets. |
| l | Employee retirement benefit plans that invest plan assets in the Separate Investment Accounts (SIAs) may be subject to certain charges as set forth in their respective Plan Documents. Total return figures would be lower for the periods presented if they reflected these charges. |
| m | Total return excludes sales charges, if any, and would be lower for the period presented if it reflected these charges. |
| n | Includes interest expense. |
| p | Interest expense incurred as a result of entering into reverse repurchase agreements and Treasury roll transactions is included in the Fund’s net expenses in the Statements of Operations. Income earned on investing proceeds from reverse repurchase agreements and Treasury roll transactions is included in interest income in the Statements of Operations. |
| u | Excludes dollar roll transactions. Including these transactions, the portfolio turnover would have been 456%, 479% and 509% as of December 31, 2014, December 31, 2013 and December 31, 2012, respectively. |
– 174 –
MASSMUTUAL SELECT STRATEGIC BOND FUND
| Income (loss) from investment operations | Less distributions to shareholders | Ratios / Supplemental Data | ||||||||||||||||||||||||||||||||||||||||||||||
| Net asset value, beginning of the period | Net investment income (loss)c,j | Net realized and unrealized gain (loss) on investments | Total income (loss) from investment operations | From net investment income | Total distributions | Net asset value, end of the period | Total returnl,m | Net assets, end of the period (000’s) | Ratio of expenses to average daily net assets before expense waivers | Ratio of expenses to average daily net assets after expense waiversj | Net investment income (loss) to average daily net assets | |||||||||||||||||||||||||||||||||||||
Class I |
| |||||||||||||||||||||||||||||||||||||||||||||||
| 09/30/16 | $ | 10.22 | $ | 0.29 | $ | 0.46 | $ | 0.75 | $ | (0.30 | ) | $ | (0.30 | ) | $ | 10.67 | 7.62% | $ | 99,498 | 0.54% | 0.48% | 2.80% | ||||||||||||||||||||||||||
| 09/30/15i | 10.15 | 0.20 | (0.13 | ) | 0.07 | (0.00 | )d | (0.00 | )d | 10.22 | 0.72% | b | 68,561 | 0.59% | a | 0.48% | a | 2.61% | a | |||||||||||||||||||||||||||||
| 12/31/14h | 10.09 | 0.25 | 0.18 | 0.43 | (0.37 | ) | (0.37 | ) | 10.15 | 4.32% | b | 54,827 | 0.60% | a | 0.48% | a | 3.20% | a | ||||||||||||||||||||||||||||||
Class R5 |
| |||||||||||||||||||||||||||||||||||||||||||||||
| 09/30/16 | $ | 10.22 | $ | 0.28 | $ | 0.46 | $ | 0.74 | $ | (0.29 | ) | $ | (0.29 | ) | $ | 10.67 | 7.51% | $ | 61,789 | 0.64% | 0.58% | 2.70% | ||||||||||||||||||||||||||
| 09/30/15i | 10.16 | 0.19 | (0.13 | ) | 0.06 | (0.00 | )d | (0.00 | )d | 10.22 | 0.62% | b | 50,846 | 0.69% | a | 0.58% | a | 2.51% | a | |||||||||||||||||||||||||||||
| 12/31/14 | 9.82 | 0.32 | 0.38 | 0.70 | (0.36 | ) | (0.36 | ) | 10.16 | 7.13% | 46,966 | 0.70% | 0.63% | 3.11% | ||||||||||||||||||||||||||||||||||
| 12/31/13 | 10.34 | 0.29 | (0.45 | ) | (0.16 | ) | (0.36 | ) | (0.36 | ) | 9.82 | (1.51% | ) | 82,091 | 0.69% | N/A | 2.87% | |||||||||||||||||||||||||||||||
| 12/31/12 | 9.91 | 0.31 | 0.47 | 0.78 | (0.35 | ) | (0.35 | ) | 10.34 | 7.86% | 82,408 | 0.68% | N/A | 3.02% | ||||||||||||||||||||||||||||||||||
| 12/31/11 | 9.60 | 0.31 | 0.33 | 0.64 | (0.33 | ) | (0.33 | ) | 9.91 | 6.61% | 75,607 | 0.66% | N/A | 3.14% | ||||||||||||||||||||||||||||||||||
Service Class |
| |||||||||||||||||||||||||||||||||||||||||||||||
| 09/30/16 | $ | 10.22 | $ | 0.27 | $ | 0.47 | $ | 0.74 | $ | (0.29 | ) | $ | (0.29 | ) | $ | 10.67 | 7.42% | $ | 47,296 | 0.74% | 0.68% | 2.61% | ||||||||||||||||||||||||||
| 09/30/15i | 10.17 | 0.19 | (0.14 | ) | 0.05 | (0.00 | )d | (0.00 | )d | 10.22 | 0.52% | b | 59,568 | 0.79% | a | 0.68% | a | 2.41% | a | |||||||||||||||||||||||||||||
| 12/31/14 | 9.83 | 0.31 | 0.38 | 0.69 | (0.35 | ) | (0.35 | ) | 10.17 | 7.08% | 51,447 | 0.79% | 0.70% | 3.02% | ||||||||||||||||||||||||||||||||||
| 12/31/13 | 10.35 | 0.29 | (0.45 | ) | (0.16 | ) | (0.36 | ) | (0.36 | ) | 9.83 | (1.55% | ) | 37,806 | 0.74% | N/A | 2.85% | |||||||||||||||||||||||||||||||
| 12/31/12 | 9.92 | 0.31 | 0.46 | 0.77 | (0.34 | ) | (0.34 | ) | 10.35 | 7.79% | 25,412 | 0.73% | N/A | 2.96% | ||||||||||||||||||||||||||||||||||
| 12/31/11 | 9.61 | 0.31 | 0.33 | 0.64 | (0.33 | ) | (0.33 | ) | 9.92 | 6.54% | 27,303 | 0.71% | N/A | 3.08% | ||||||||||||||||||||||||||||||||||
Administrative Class |
| |||||||||||||||||||||||||||||||||||||||||||||||
| 09/30/16 | $ | 10.18 | $ | 0.26 | $ | 0.47 | $ | 0.73 | $ | (0.27 | ) | $ | (0.27 | ) | $ | 10.64 | 7.39% | $ | 42,980 | 0.84% | 0.78% | 2.50% | ||||||||||||||||||||||||||
| 09/30/15i | 10.14 | 0.18 | (0.14 | ) | 0.04 | (0.00 | )d | (0.00 | )d | 10.18 | 0.42% | b | 36,812 | 0.89% | a | 0.78% | a | 2.31% | a | |||||||||||||||||||||||||||||
| 12/31/14 | 9.81 | 0.30 | 0.38 | 0.68 | (0.35 | ) | (0.35 | ) | 10.14 | 6.94% | 28,065 | 0.90% | 0.80% | 2.91% | ||||||||||||||||||||||||||||||||||
| 12/31/13 | 10.32 | 0.27 | (0.45 | ) | (0.18 | ) | (0.33 | ) | (0.33 | ) | 9.81 | (1.73% | ) | 14,613 | 0.89% | N/A | 2.59% | |||||||||||||||||||||||||||||||
| 12/31/12 | 9.90 | 0.29 | 0.46 | 0.75 | (0.33 | ) | (0.33 | ) | 10.32 | 7.57% | 31,753 | 0.88% | N/A | 2.81% | ||||||||||||||||||||||||||||||||||
| 12/31/11 | 9.58 | 0.29 | 0.33 | 0.62 | (0.30 | ) | (0.30 | ) | 9.90 | 6.43% | 26,987 | 0.86% | N/A | 2.90% | ||||||||||||||||||||||||||||||||||
Class A |
| |||||||||||||||||||||||||||||||||||||||||||||||
| 09/30/16 | $ | 10.15 | $ | 0.23 | $ | 0.47 | $ | 0.70 | $ | (0.25 | ) | $ | (0.25 | ) | $ | 10.60 | 7.12% | $ | 45,782 | 1.09% | 1.03% | 2.25% | ||||||||||||||||||||||||||
| 09/30/15i | 10.13 | 0.16 | (0.14 | ) | 0.02 | (0.00 | )d | (0.00 | )d | 10.15 | 0.22% | b | 40,577 | 1.14% | a | 1.03% | a | 2.07% | a | |||||||||||||||||||||||||||||
| 12/31/14 | 9.80 | 0.27 | 0.38 | 0.65 | (0.32 | ) | (0.32 | ) | 10.13 | 6.66% | 32,540 | 1.15% | 1.06% | 2.65% | ||||||||||||||||||||||||||||||||||
| 12/31/13 | 10.31 | 0.24 | (0.43 | ) | (0.19 | ) | (0.32 | ) | (0.32 | ) | 9.80 | (1.89% | ) | 27,677 | 1.14% | N/A | 2.40% | |||||||||||||||||||||||||||||||
| 12/31/12 | 9.89 | 0.26 | 0.46 | 0.72 | (0.30 | ) | (0.30 | ) | 10.31 | 7.27% | 37,774 | 1.13% | N/A | 2.57% | ||||||||||||||||||||||||||||||||||
| 12/31/11 | 9.56 | 0.26 | 0.34 | 0.60 | (0.27 | ) | (0.27 | ) | 9.89 | 6.23% | 40,971 | 1.11% | N/A | 2.68% | ||||||||||||||||||||||||||||||||||
Class R4 |
| |||||||||||||||||||||||||||||||||||||||||||||||
| 09/30/16 | $ | 10.15 | $ | 0.24 | $ | 0.47 | $ | 0.71 | $ | (0.28 | ) | $ | (0.28 | ) | $ | 10.58 | 7.20% | $ | 26,419 | 0.99% | 0.93% | 2.36% | ||||||||||||||||||||||||||
| 09/30/15i | 10.12 | 0.18 | (0.15 | ) | 0.03 | (0.00 | )d | (0.00 | )d | 10.15 | 0.32% | b | 14,724 | 1.04% | a | 0.93% | a | 2.36% | a | |||||||||||||||||||||||||||||
| 12/31/14h | 10.06 | 0.21 | 0.19 | 0.40 | (0.34 | ) | (0.34 | ) | 10.12 | 3.99% | b | 104 | 1.05% | a | 0.93% | a | 2.75% | a | ||||||||||||||||||||||||||||||
Class R3 |
| |||||||||||||||||||||||||||||||||||||||||||||||
| 09/30/16 | $ | 10.06 | $ | 0.22 | $ | 0.46 | $ | 0.68 | $ | (0.24 | ) | $ | (0.24 | ) | $ | 10.50 | 6.95% | $ | 5,810 | 1.24% | 1.18% | 2.12% | ||||||||||||||||||||||||||
| 09/30/15i | 10.05 | 0.15 | (0.14 | ) | 0.01 | (0.00 | )d | (0.00 | )d | 10.06 | 0.13% | b | 2,904 | 1.29% | a | 1.18% | a | 1.94% | a | |||||||||||||||||||||||||||||
| 12/31/14 | 9.75 | 0.25 | 0.38 | 0.63 | (0.33 | ) | (0.33 | ) | 10.05 | 6.44% | 1,978 | 1.33% | 1.24% | 2.49% | ||||||||||||||||||||||||||||||||||
| 12/31/13 | 10.26 | 0.21 | (0.44 | ) | (0.23 | ) | (0.28 | ) | (0.28 | ) | 9.75 | (2.22% | ) | 974 | 1.44% | N/A | 2.11% | |||||||||||||||||||||||||||||||
| 12/31/12 | 9.85 | 0.23 | 0.46 | 0.69 | (0.28 | ) | (0.28 | ) | 10.26 | 7.00% | 1,130 | 1.43% | N/A | 2.26% | ||||||||||||||||||||||||||||||||||
| 12/31/11 | 9.55 | 0.23 | 0.33 | 0.56 | (0.26 | ) | (0.26 | ) | 9.85 | 5.80% | 988 | 1.41% | N/A | 2.37% | ||||||||||||||||||||||||||||||||||
| Year ended September 30, 2016 | Period ended September 30, 2015b | Year ended December 31 | ||||||||||||||||||||||
| 2014 | 2013 | 2012 | 2011 | |||||||||||||||||||||
Portfolio turnover rate | 207 | % | 191 | % | 308 | % | 352 | % | 417 | % | 669 | % | ||||||||||||
| a | Annualized. |
| b | Percentage represents the results for the period and is not annualized. |
| c | Per share amount calculated on the average shares method. |
| d | Amount is less than $0.005 per share. |
| h | For the period April 1, 2014 (commencement of operations) through December 31, 2014. |
| i | For the period January 1, 2015 through September 30, 2015. |
| j | Computed after giving effect to an agreement by MML Advisers and/or MassMutual to waive certain fees and expenses of the Fund. |
| l | Employee retirement benefit plans that invest plan assets in the Separate Investment Accounts (SIAs) may be subject to certain charges as set forth in their respective Plan Documents. Total return figures would be lower for the periods presented if they reflected these charges. |
| m | Total return excludes sales charges, if any, and would be lower for the period presented if it reflected these charges. |
– 175 –
MASSMUTUAL SELECT BLACKROCK GLOBAL ALLOCATION FUND
| Income (loss) from investment operations | Less distributions to shareholders | Ratios / Supplemental Data | ||||||||||||||||||||||||||||||||||||||||||||||||||||||
| Net asset value, beginning of the period | Net investment income (loss)c,j | Net realized and unrealized gain (loss) on investments | Total income (loss) from investment operations | From net investment income | From net realized gains | Total distributions | Net asset value, end of the period | Total returnl,m | Net assets, end of the period (000’s) | Ratio of expenses to average daily net assets before expense waiversz | Ratio of expenses to average daily net assets after expense waiversj,z | Short sale dividend and loan expense to average daily net assetsy | Net investment income (loss) to average daily net assetsz | |||||||||||||||||||||||||||||||||||||||||||
Class I | ||||||||||||||||||||||||||||||||||||||||||||||||||||||||
| 09/30/16 | $ | 10.11 | $ | 0.14 | $ | 0.53 | $ | 0.67 | $ | (0.08 | ) | $ | (0.54 | ) | $ | (0.62 | ) | $ | 10.16 | 6.91% | $ | 519,733 | 0.97% | 0.80% | 0.01% | 1.39% | ||||||||||||||||||||||||||||||
| 09/30/15i | 10.73 | 0.11 | (0.48 | ) | (0.37 | ) | (0.07 | ) | (0.18 | ) | (0.25 | ) | 10.11 | (3.53% | )b | 590,934 | 0.96% | a | 0.79% | a | 0.00% | a,e | 1.39% | a | ||||||||||||||||||||||||||||||||
| 12/31/14h | 11.80 | 0.13 | 0.06 | 0.19 | (0.28 | ) | (0.98 | ) | (1.26 | ) | 10.73 | 1.57% | b | 611,549 | 0.96% | a | 0.79% | a | 0.00% | a,e | 1.40% | a | ||||||||||||||||||||||||||||||||||
Class R5 | ||||||||||||||||||||||||||||||||||||||||||||||||||||||||
| 09/30/16 | $ | 10.23 | $ | 0.13 | $ | 0.54 | $ | 0.67 | $ | (0.07 | ) | $ | (0.54 | ) | $ | (0.61 | ) | $ | 10.29 | 6.81% | $ | 7,390 | 1.07% | 0.90% | 0.01% | 1.33% | ||||||||||||||||||||||||||||||
| 09/30/15i | 10.87 | 0.10 | (0.49 | ) | (0.39 | ) | (0.07 | ) | (0.18 | ) | (0.25 | ) | 10.23 | (3.67% | )b | 7,340 | 1.06% | a | 0.89% | a | 0.00% | a,e | 1.26% | a | ||||||||||||||||||||||||||||||||
| 12/31/14 | 11.74 | 0.25 | (0.02 | ) | 0.23 | (0.12 | ) | (0.98 | ) | (1.10 | ) | 10.87 | 1.89% | 12,994 | 1.01% | 0.88% | 0.00% | e | 2.12% | |||||||||||||||||||||||||||||||||||||
| 12/31/13 | 10.73 | 0.12 | 1.44 | 1.56 | (0.15 | ) | (0.40 | ) | (0.55 | ) | 11.74 | 14.65% | 615,383 | 0.97% | 0.86% | 0.00% | e | 1.04% | ||||||||||||||||||||||||||||||||||||||
| 12/31/12 | 9.93 | 0.17 | 0.84 | 1.01 | (0.18 | ) | (0.03 | ) | (0.21 | ) | 10.73 | 10.13% | 547,436 | 1.00% | 0.86% | N/A | 1.57% | |||||||||||||||||||||||||||||||||||||||
| 12/31/11 | 10.79 | 0.19 | (0.63 | ) | (0.44 | ) | (0.24 | ) | (0.18 | ) | (0.42 | ) | 9.93 | (4.07% | ) | 526,621 | 0.95% | 0.86% | 0.00% | e | 1.77% | |||||||||||||||||||||||||||||||||||
Service Class |
| |||||||||||||||||||||||||||||||||||||||||||||||||||||||
| 09/30/16 | $ | 10.08 | $ | 0.12 | $ | 0.54 | $ | 0.66 | $ | (0.06 | ) | $ | (0.54 | ) | $ | (0.60 | ) | $ | 10.14 | 6.79% | $ | 11,890 | 1.17% | 1.00% | 0.01% | 1.23% | ||||||||||||||||||||||||||||||
| 09/30/15i | 10.72 | 0.10 | (0.49 | ) | (0.39 | ) | (0.07 | ) | (0.18 | ) | (0.25 | ) | 10.08 | (3.72% | )b | 15,267 | 1.16% | a | 0.99% | a | 0.00% | a,e | 1.21% | a | ||||||||||||||||||||||||||||||||
| 12/31/14 | 11.74 | 0.19 | 0.03 | 0.22 | (0.26 | ) | (0.98 | ) | (1.24 | ) | 10.72 | 1.80% | 11,605 | 1.14% | 0.99% | 0.00% | e | 1.61% | ||||||||||||||||||||||||||||||||||||||
| 12/31/13 | 10.72 | 0.11 | 1.44 | 1.55 | (0.13 | ) | (0.40 | ) | (0.53 | ) | 11.74 | 14.48% | 11,658 | 1.07% | 0.96% | 0.00% | e | 0.98% | ||||||||||||||||||||||||||||||||||||||
| 12/31/12 | 9.93 | 0.15 | 0.85 | 1.00 | (0.18 | ) | (0.03 | ) | (0.21 | ) | 10.72 | 10.10% | 16,060 | 1.10% | 0.96% | N/A | 1.45% | |||||||||||||||||||||||||||||||||||||||
| 12/31/11 | 10.78 | 0.18 | (0.63 | ) | (0.45 | ) | (0.22 | ) | (0.18 | ) | (0.40 | ) | 9.93 | (4.15% | ) | 786 | 1.05% | 0.96% | 0.00% | e | 1.63% | |||||||||||||||||||||||||||||||||||
Administrative Class |
| |||||||||||||||||||||||||||||||||||||||||||||||||||||||
| 09/30/16 | $ | 10.36 | $ | 0.11 | $ | 0.55 | $ | 0.66 | $ | (0.04 | ) | $ | (0.54 | ) | $ | (0.58 | ) | $ | 10.44 | 6.61% | $ | 9,991 | 1.27% | 1.10% | 0.01% | 1.11% | ||||||||||||||||||||||||||||||
| 09/30/15i | 11.02 | 0.09 | (0.50 | ) | (0.41 | ) | (0.07 | ) | (0.18 | ) | (0.25 | ) | 10.36 | (3.80% | )b | 14,055 | 1.26% | a | 1.09% | a | 0.00% | a,e | 1.09% | a | ||||||||||||||||||||||||||||||||
| 12/31/14 | 12.03 | 0.18 | 0.03 | 0.21 | (0.24 | ) | (0.98 | ) | (1.22 | ) | 11.02 | 1.70% | 16,936 | 1.25% | 1.10% | 0.00% | e | 1.50% | ||||||||||||||||||||||||||||||||||||||
| 12/31/13 | 10.98 | 0.09 | 1.48 | 1.57 | (0.12 | ) | (0.40 | ) | (0.52 | ) | 12.03 | 14.36% | 19,051 | 1.22% | 1.11% | 0.00% | e | 0.79% | ||||||||||||||||||||||||||||||||||||||
| 12/31/12 | 10.17 | 0.14 | 0.87 | 1.01 | (0.17 | ) | (0.03 | ) | (0.20 | ) | 10.98 | 9.86% | 23,253 | 1.25% | 1.11% | N/A | 1.29% | |||||||||||||||||||||||||||||||||||||||
| 12/31/11 | 10.79 | 0.16 | (0.59 | ) | (0.43 | ) | (0.01 | ) | (0.18 | ) | (0.19 | ) | 10.17 | (3.91% | ) | 0 | f | 1.17% | 1.10% | 0.00% | e | 1.42% | ||||||||||||||||||||||||||||||||||
Class A | ||||||||||||||||||||||||||||||||||||||||||||||||||||||||
| 09/30/16 | $ | 10.01 | $ | 0.09 | $ | 0.52 | $ | 0.61 | $ | (0.01 | ) | $ | (0.54 | ) | $ | (0.55 | ) | $ | 10.07 | 6.26% | $ | 5,748 | 1.52% | 1.35% | 0.01% | 0.87% | ||||||||||||||||||||||||||||||
| 09/30/15i | 10.67 | 0.07 | (0.48 | ) | (0.41 | ) | (0.07 | ) | (0.18 | ) | (0.25 | ) | 10.01 | (3.93% | )b | 6,922 | 1.51% | a | 1.34% | a | 0.00% | a,e | 0.85% | a | ||||||||||||||||||||||||||||||||
| 12/31/14 | 11.69 | 0.15 | 0.03 | 0.18 | (0.22 | ) | (0.98 | ) | (1.20 | ) | 10.67 | 1.42% | 8,694 | 1.50% | 1.35% | 0.00% | e | 1.26% | ||||||||||||||||||||||||||||||||||||||
| 12/31/13 | 10.69 | 0.06 | 1.44 | 1.50 | (0.10 | ) | (0.40 | ) | (0.50 | ) | 11.69 | 14.13% | 8,844 | 1.47% | 1.36% | 0.00% | e | 0.53% | ||||||||||||||||||||||||||||||||||||||
| 12/31/12 | 9.91 | 0.11 | 0.84 | 0.95 | (0.14 | ) | (0.03 | ) | (0.17 | ) | 10.69 | 9.57% | 6,060 | 1.50% | 1.36% | N/A | 1.07% | |||||||||||||||||||||||||||||||||||||||
| 12/31/11 | 10.77 | 0.13 | (0.63 | ) | (0.50 | ) | (0.18 | ) | (0.18 | ) | (0.36 | ) | 9.91 | (4.53% | ) | 2,015 | 1.45% | 1.36% | 0.00% | e | 1.24% | |||||||||||||||||||||||||||||||||||
Class R4 | ||||||||||||||||||||||||||||||||||||||||||||||||||||||||
| 09/30/16 | $ | 9.99 | $ | 0.11 | $ | 0.51 | $ | 0.62 | $ | (0.06 | ) | $ | (0.54 | ) | $ | (0.60 | ) | $ | 10.01 | 6.46% | $ | 16,392 | 1.42% | 1.25% | 0.01% | 1.10% | ||||||||||||||||||||||||||||||
| 09/30/15i | 10.65 | 0.08 | (0.49 | ) | (0.41 | ) | (0.07 | ) | (0.18 | ) | (0.25 | ) | 9.99 | (3.84% | )b | 2,642 | 1.41% | a | 1.24% | a | 0.00% | a,e | 0.93% | a | ||||||||||||||||||||||||||||||||
| 12/31/14h | 11.73 | 0.11 | 0.03 | 0.14 | (0.24 | ) | (0.98 | ) | (1.22 | ) | 10.65 | 1.15% | b | 101 | 1.41% | a | 1.24% | a | 0.00% | a,e | 1.20% | a | ||||||||||||||||||||||||||||||||||
Class R3 | ||||||||||||||||||||||||||||||||||||||||||||||||||||||||
| 09/30/16 | $ | 9.98 | $ | 0.08 | $ | 0.52 | $ | 0.60 | $ | (0.06 | ) | $ | (0.54 | ) | $ | (0.60 | ) | $ | 9.98 | 6.16% | $ | 10,403 | 1.67% | 1.50% | 0.01% | 0.83% | ||||||||||||||||||||||||||||||
| 09/30/15i | 10.65 | 0.06 | (0.48 | ) | (0.42 | ) | (0.07 | ) | (0.18 | ) | (0.25 | ) | 9.98 | (4.03% | )b | 2,587 | 1.66% | a | 1.49% | a | 0.00% | a,e | 0.73% | a | ||||||||||||||||||||||||||||||||
| 12/31/14h | 11.73 | 0.08 | 0.04 | 0.12 | (0.22 | ) | (0.98 | ) | (1.20 | ) | 10.65 | 0.97% | b | 101 | 1.66% | a | 1.49% | a | 0.00% | a,e | 0.95% | a | ||||||||||||||||||||||||||||||||||
| Year ended September 30, 2016 | Period ended September 30, 2015b | Year ended December 31 | ||||||||||||||||||||||
| 2014 | 2013 | 2012 | 2011 | |||||||||||||||||||||
Portfolio turnover rate | 171 | % | 90 | % | 94 | % | 66 | % | 61 | % | 43 | % | ||||||||||||
| a | Annualized. |
| b | Percentage represents the results for the period and is not annualized. |
| c | Per share amount calculated on the average shares method. |
| e | Amount is less than 0.005%. |
| f | Amount is less than $500. |
| h | For the period April 1, 2014 (commencement of operations) through December 31, 2014. |
| i | For the period January 1, 2015 through September 30, 2015. |
| j | Computed after giving effect to an agreement by MML Advisers and/or MassMutual to waive certain fees and expenses of the Fund. |
| l | Employee retirement benefit plans that invest plan assets in the Separate Investment Accounts (SIAs) may be subject to certain charges as set forth in their respective Plan Documents. Total return figures would be lower for the periods presented if they reflected these charges. |
| m | Total return excludes sales charges, if any, and would be lower for the period presented if it reflected these charges. |
| y | Short sale dividend and loan expense incurred as a result of entering into short sales is included in the Fund’s net expenses in the Consolidated Statement of Operations. |
| z | Includes short sale dividend and loan expense. |
– 176 –
MASSMUTUAL SELECT DIVERSIFIED VALUE FUND
| Income (loss) from investment operations | Less distributions to shareholders | Ratios / Supplemental Data | ||||||||||||||||||||||||||||||||||||||||||
| Net asset value, beginning of the period | Net investment income (loss)c | Net realized and unrealized gain (loss) on investments | Total income (loss) from investment operations | From net investment income | Total distributions | Net asset value, end of the period | Total returnl,m | Net assets, end of the period (000’s) | Ratio of expenses to average daily net assets | Net investment income (loss) to average daily net assets | ||||||||||||||||||||||||||||||||||
Class I | ||||||||||||||||||||||||||||||||||||||||||||
| 09/30/16 | $ | 13.64 | $ | 0.27 | $ | 1.20 | $ | 1.47 | $ | (0.21 | ) | $ | (0.21 | ) | $ | 14.90 | 10.89% | $ | 251,684 | 0.57% | 1.90% | |||||||||||||||||||||||
| 09/30/15i | 14.86 | 0.18 | (1.35 | ) | (1.17 | ) | (0.05 | ) | (0.05 | ) | 13.64 | (7.91% | )b | 75,827 | 0.58% | a | 1.66% | a | ||||||||||||||||||||||||||
| 12/31/14h | 13.89 | 0.17 | 1.10 | 1.27 | (0.30 | ) | (0.30 | ) | 14.86 | 9.20% | b | 97,877 | 0.55% | a | 1.56% | a | ||||||||||||||||||||||||||||
Class R5 |
| |||||||||||||||||||||||||||||||||||||||||||
| 09/30/16 | $ | 13.64 | $ | 0.28 | $ | 1.18 | $ | 1.46 | $ | (0.20 | ) | $ | (0.20 | ) | $ | 14.90 | 10.78% | $ | 46,830 | 0.67% | 2.00% | |||||||||||||||||||||||
| 09/30/15i | 14.87 | 0.17 | (1.35 | ) | (1.18 | ) | (0.05 | ) | (0.05 | ) | 13.64 | (7.98% | )b | 207,187 | 0.68% | a | 1.58% | a | ||||||||||||||||||||||||||
| 12/31/14 | 13.56 | 0.29 | 1.30 | 1.59 | (0.28 | ) | (0.28 | ) | 14.87 | 11.82% | 235,941 | 0.63% | 2.07% | |||||||||||||||||||||||||||||||
| 12/31/13 | 10.21 | 0.19 | 3.32 | 3.51 | (0.16 | ) | (0.16 | ) | 13.56 | 34.40% | 329,972 | 0.59% | 1.55% | |||||||||||||||||||||||||||||||
| 12/31/12 | 8.87 | 0.19 | 1.39 | 1.58 | (0.24 | ) | (0.24 | ) | 10.21 | 17.79% | 245,589 | 0.59% | 1.98% | |||||||||||||||||||||||||||||||
| 12/31/11 | 8.92 | 0.16 | (0.05 | ) | 0.11 | (0.16 | ) | (0.16 | ) | 8.87 | 1.37% | 212,076 | 0.59% | 1.79% | ||||||||||||||||||||||||||||||
Service Class |
| |||||||||||||||||||||||||||||||||||||||||||
| 09/30/16 | $ | 13.63 | $ | 0.25 | $ | 1.21 | $ | 1.46 | $ | (0.19 | ) | $ | (0.19 | ) | $ | 14.90 | 10.75% | $ | 8,656 | 0.77% | 1.78% | |||||||||||||||||||||||
| 09/30/15i | 14.88 | 0.16 | (1.36 | ) | (1.20 | ) | (0.05 | ) | (0.05 | ) | 13.63 | (8.11% | )b | 14,983 | 0.78% | a | 1.49% | a | ||||||||||||||||||||||||||
| 12/31/14 | 13.57 | 0.25 | 1.33 | 1.58 | (0.27 | ) | (0.27 | ) | 14.88 | 11.72% | 16,147 | 0.73% | 1.76% | |||||||||||||||||||||||||||||||
| 12/31/13 | 10.22 | 0.17 | 3.32 | 3.49 | (0.14 | ) | (0.14 | ) | 13.57 | 34.24% | 21,780 | 0.69% | 1.44% | |||||||||||||||||||||||||||||||
| 12/31/12 | 8.87 | 0.18 | 1.39 | 1.57 | (0.22 | ) | (0.22 | ) | 10.22 | 17.74% | 18,431 | 0.69% | 1.84% | |||||||||||||||||||||||||||||||
| 12/31/11 | 8.92 | 0.15 | (0.05 | ) | 0.10 | (0.15 | ) | (0.15 | ) | 8.87 | 1.25% | 23,925 | 0.69% | 1.69% | ||||||||||||||||||||||||||||||
Administrative Class |
| |||||||||||||||||||||||||||||||||||||||||||
| 09/30/16 | $ | 13.68 | $ | 0.24 | $ | 1.20 | $ | 1.44 | $ | (0.16 | ) | $ | (0.16 | ) | $ | 14.96 | 10.57% | $ | 6,903 | 0.87% | 1.66% | |||||||||||||||||||||||
| 09/30/15i | 14.93 | 0.15 | (1.35 | ) | (1.20 | ) | (0.05 | ) | (0.05 | ) | 13.68 | (8.08% | )b | 6,206 | 0.88% | a | 1.38% | a | ||||||||||||||||||||||||||
| 12/31/14 | 13.63 | 0.24 | 1.32 | 1.56 | (0.26 | ) | (0.26 | ) | 14.93 | 11.52% | 9,579 | 0.84% | 1.69% | |||||||||||||||||||||||||||||||
| 12/31/13 | 10.25 | 0.16 | 3.33 | 3.49 | (0.11 | ) | (0.11 | ) | 13.63 | 34.13% | 7,905 | 0.80% | 1.33% | |||||||||||||||||||||||||||||||
| 12/31/12 | 8.90 | 0.17 | 1.39 | 1.56 | (0.21 | ) | (0.21 | ) | 10.25 | 17.53% | 7,642 | 0.80% | 1.74% | |||||||||||||||||||||||||||||||
| 12/31/11 | 8.92 | 0.14 | (0.04 | ) | 0.10 | (0.12 | ) | (0.12 | ) | 8.90 | 1.17% | 9,809 | 0.80% | 1.52% | ||||||||||||||||||||||||||||||
Class A |
| |||||||||||||||||||||||||||||||||||||||||||
| 09/30/16 | $ | 13.58 | $ | 0.20 | $ | 1.20 | $ | 1.40 | $ | (0.13 | ) | $ | (0.13 | ) | $ | 14.85 | 10.33% | $ | 19,968 | 1.12% | 1.43% | |||||||||||||||||||||||
| 09/30/15i | 14.86 | 0.13 | (1.36 | ) | (1.23 | ) | (0.05 | ) | (0.05 | ) | 13.58 | (8.32% | )b | 20,926 | 1.13% | a | 1.14% | a | ||||||||||||||||||||||||||
| 12/31/14 | 13.55 | 0.21 | 1.31 | 1.52 | (0.21 | ) | (0.21 | ) | 14.86 | 11.27% | 23,963 | 1.10% | 1.47% | |||||||||||||||||||||||||||||||
| 12/31/13 | 10.20 | 0.13 | 3.31 | 3.44 | (0.09 | ) | (0.09 | ) | 13.55 | 33.78% | 24,625 | 1.09% | 1.05% | |||||||||||||||||||||||||||||||
| 12/31/12 | 8.86 | 0.14 | 1.39 | 1.53 | (0.19 | ) | (0.19 | ) | 10.20 | 17.23% | 24,405 | 1.09% | 1.48% | |||||||||||||||||||||||||||||||
| 12/31/11 | 8.90 | 0.11 | (0.04 | ) | 0.07 | (0.11 | ) | (0.11 | ) | 8.86 | 0.83% | 24,863 | 1.09% | 1.26% | ||||||||||||||||||||||||||||||
Class R4 | ||||||||||||||||||||||||||||||||||||||||||||
| 09/30/16 | $ | 13.57 | $ | 0.22 | $ | 1.18 | $ | 1.40 | $ | (0.16 | ) | $ | (0.16 | ) | $ | 14.81 | 10.38% | $ | 711 | 1.02% | 1.57% | |||||||||||||||||||||||
| 09/30/15i | 14.83 | 0.14 | (1.35 | ) | (1.21 | ) | (0.05 | ) | (0.05 | ) | 13.57 | (8.20% | )b | 279 | 1.03% | a | 1.26% | a | ||||||||||||||||||||||||||
| 12/31/14h | 13.86 | 0.12 | 1.10 | 1.22 | (0.25 | ) | (0.25 | ) | 14.83 | 8.85% | b | 109 | 1.00% | a | 1.13% | a | ||||||||||||||||||||||||||||
Class R3 |
| |||||||||||||||||||||||||||||||||||||||||||
| 09/30/16 | $ | 13.62 | $ | 0.19 | $ | 1.19 | $ | 1.38 | $ | (0.17 | ) | $ | (0.17 | ) | $ | 14.83 | 10.17% | $ | 1,635 | 1.27% | 1.36% | |||||||||||||||||||||||
| 09/30/15i | 14.91 | 0.12 | (1.36 | ) | (1.24 | ) | (0.05 | ) | (0.05 | ) | 13.62 | (8.36% | )b | 247 | 1.28% | a | 1.06% | a | ||||||||||||||||||||||||||
| 12/31/14 | 13.61 | 0.18 | 1.31 | 1.49 | (0.19 | ) | (0.19 | ) | 14.91 | 11.02% | 194 | 1.28% | 1.26% | |||||||||||||||||||||||||||||||
| 12/31/13 | 10.25 | 0.09 | 3.33 | 3.42 | (0.06 | ) | (0.06 | ) | 13.61 | 33.35% | 166 | 1.40% | 0.73% | |||||||||||||||||||||||||||||||
| 12/31/12 | 8.90 | 0.11 | 1.39 | 1.50 | (0.15 | ) | (0.15 | ) | 10.25 | 16.88% | 131 | 1.40% | 1.12% | |||||||||||||||||||||||||||||||
| 12/31/11 | 8.94 | 0.09 | (0.04 | ) | 0.05 | (0.09 | ) | (0.09 | ) | 8.90 | 0.63% | 259 | 1.40% | 0.98% | ||||||||||||||||||||||||||||||
| Year ended September 30, 2016 | Period ended September 30, 2015b | Year ended December 31 | ||||||||||||||||||||||
| 2014 | 2013 | 2012 | 2011 | |||||||||||||||||||||
Portfolio turnover rate | 39 | % | 29 | % | 49 | % | 44 | % | 38 | % | 36 | % | ||||||||||||
| a | Annualized. |
| b | Percentage represents the results for the period and is not annualized. |
| c | Per share amount calculated on the average shares method. |
| h | For the period April 1, 2014 (commencement of operations) through December 31, 2014. |
| i | For the period January 1, 2015 through September 30, 2015. |
| l | Employee retirement benefit plans that invest plan assets in the Separate Investment Accounts (SIAs) may be subject to certain charges as set forth in their respective Plan Documents. Total return figures would be lower for the periods presented if they reflected these charges. |
| m | Total return excludes sales charges, if any, and would be lower for the period presented if it reflected these charges. |
– 177 –
MASSMUTUAL SELECT FUNDAMENTAL VALUE FUND
| Income (loss) from investment operations | Less distributions to shareholders | Ratios / Supplemental Data | ||||||||||||||||||||||||||||||||||||||||||||||||||
| Net asset value, beginning of the period | Net investment income (loss)c,j | Net realized and unrealized gain (loss) on investments | Total income (loss) from investment operations | From net investment income | From net realized gains | Total distributions | Net asset value, end of the period | Total returnl,m | Net assets, end of the period (000’s) | Ratio of expenses to average daily net assets before expense waivers | Ratio of expenses to average daily net assets after expense waiversj | Net investment income (loss) to average daily net assets | ||||||||||||||||||||||||||||||||||||||||
Class I |
| |||||||||||||||||||||||||||||||||||||||||||||||||||
| 09/30/16 | $ | 12.46 | $ | 0.25 | $ | 1.27 | $ | 1.52 | $ | (0.23 | ) | $ | (1.36 | ) | $ | (1.59 | ) | $ | 12.39 | 13.21% | $ | 500,270 | 0.63% | N/A | 2.04% | |||||||||||||||||||||||||||
| 09/30/15i | 13.97 | 0.17 | (1.28 | ) | (1.11 | ) | - | (0.40 | ) | (0.40 | ) | 12.46 | (8.06% | )b | 422,026 | 0.63% | a | N/A | 1.65% | a | ||||||||||||||||||||||||||||||||
| 12/31/14 | 13.60 | 0.23 | 1.28 | 1.51 | (0.24 | ) | (0.90 | ) | (1.14 | ) | 13.97 | 11.45% | 408,068 | 0.65% | 0.62% | 1.65% | ||||||||||||||||||||||||||||||||||||
| 12/31/13 | 11.36 | 0.24 | 3.32 | 3.56 | (0.26 | ) | (1.06 | ) | (1.32 | ) | 13.60 | 31.85% | 267,342 | 0.74% | 0.59% | 1.82% | ||||||||||||||||||||||||||||||||||||
| 12/31/12 | 10.04 | 0.24 | 1.44 | 1.68 | (0.36 | ) | - | (0.36 | ) | 11.36 | 16.75% | 204,268 | 0.74% | 0.59% | 2.21% | |||||||||||||||||||||||||||||||||||||
| 12/31/11 | 10.48 | 0.20 | (0.43 | ) | (0.23 | ) | (0.21 | ) | - | (0.21 | ) | 10.04 | (2.06% | ) | 184,034 | 0.75% | 0.60% | 2.00% | ||||||||||||||||||||||||||||||||||
Class R5 |
| |||||||||||||||||||||||||||||||||||||||||||||||||||
| 09/30/16 | $ | 12.49 | $ | 0.23 | $ | 1.29 | $ | 1.52 | $ | (0.22 | ) | $ | (1.36 | ) | $ | (1.58 | ) | $ | 12.43 | 13.12% | $ | 372,531 | 0.73% | N/A | 1.95% | |||||||||||||||||||||||||||
| 09/30/15i | 14.01 | 0.16 | (1.28 | ) | (1.12 | ) | - | (0.40 | ) | (0.40 | ) | 12.49 | (8.10% | )b | 423,631 | 0.73% | a | N/A | 1.53% | a | ||||||||||||||||||||||||||||||||
| 12/31/14 | 13.64 | 0.22 | 1.27 | 1.49 | (0.22 | ) | (0.90 | ) | (1.12 | ) | 14.01 | 11.27% | 564,826 | 0.78% | 0.74% | 1.53% | ||||||||||||||||||||||||||||||||||||
| 12/31/13 | 11.39 | 0.22 | 3.32 | 3.54 | (0.23 | ) | (1.06 | ) | (1.29 | ) | 13.64 | 31.57% | 541,839 | 0.94% | 0.79% | 1.63% | ||||||||||||||||||||||||||||||||||||
| 12/31/12 | 10.07 | 0.22 | 1.44 | 1.66 | (0.34 | ) | - | (0.34 | ) | 11.39 | 16.49% | 486,471 | 0.94% | 0.79% | 2.00% | |||||||||||||||||||||||||||||||||||||
| 12/31/11 | 10.49 | 0.17 | (0.42 | ) | (0.25 | ) | (0.17 | ) | - | (0.17 | ) | 10.07 | (2.29% | ) | 407,353 | 0.94% | 0.80% | 1.62% | ||||||||||||||||||||||||||||||||||
Service Class |
| |||||||||||||||||||||||||||||||||||||||||||||||||||
| 09/30/16 | $ | 12.44 | $ | 0.22 | $ | 1.29 | $ | 1.51 | $ | (0.21 | ) | $ | (1.36 | ) | $ | (1.57 | ) | $ | 12.38 | 13.06% | $ | 124,126 | 0.83% | N/A | 1.86% | |||||||||||||||||||||||||||
| 09/30/15i | 13.97 | 0.15 | (1.28 | ) | (1.13 | ) | - | (0.40 | ) | (0.40 | ) | 12.44 | (8.20% | )b | 158,634 | 0.83% | a | N/A | 1.44% | a | ||||||||||||||||||||||||||||||||
| 12/31/14 | 13.60 | 0.20 | 1.28 | 1.48 | (0.21 | ) | (0.90 | ) | (1.11 | ) | 13.97 | 11.22% | 208,770 | 0.86% | 0.83% | 1.44% | ||||||||||||||||||||||||||||||||||||
| 12/31/13 | 11.36 | 0.21 | 3.32 | 3.53 | (0.23 | ) | (1.06 | ) | (1.29 | ) | 13.60 | 31.52% | 207,094 | 0.98% | 0.83% | 1.58% | ||||||||||||||||||||||||||||||||||||
| 12/31/12 | 10.05 | 0.22 | 1.42 | 1.64 | (0.33 | ) | - | (0.33 | ) | 11.36 | 16.35% | 158,864 | 0.98% | 0.83% | 1.96% | |||||||||||||||||||||||||||||||||||||
| 12/31/11 | 10.46 | 0.17 | (0.41 | ) | (0.24 | ) | (0.17 | ) | - | (0.17 | ) | 10.05 | (2.20% | ) | 154,312 | 0.98% | 0.84% | 1.60% | ||||||||||||||||||||||||||||||||||
Administrative Class |
| |||||||||||||||||||||||||||||||||||||||||||||||||||
| 09/30/16 | $ | 12.49 | $ | 0.21 | $ | 1.29 | $ | 1.50 | $ | (0.19 | ) | $ | (1.36 | ) | $ | (1.55 | ) | $ | 12.44 | 12.93% | $ | 94,316 | 0.93% | N/A | 1.75% | |||||||||||||||||||||||||||
| 09/30/15i | 14.04 | 0.14 | (1.29 | ) | (1.15 | ) | - | (0.40 | ) | (0.40 | ) | 12.49 | (8.30% | )b | 102,932 | 0.93% | a | N/A | 1.34% | a | ||||||||||||||||||||||||||||||||
| 12/31/14 | 13.65 | 0.19 | 1.29 | 1.48 | (0.19 | ) | (0.90 | ) | (1.09 | ) | 14.04 | 11.14% | 123,885 | 0.97% | 0.94% | 1.33% | ||||||||||||||||||||||||||||||||||||
| 12/31/13 | 11.40 | 0.19 | 3.33 | 3.52 | (0.21 | ) | (1.06 | ) | (1.27 | ) | 13.65 | 31.35% | 141,207 | 1.13% | 0.98% | 1.42% | ||||||||||||||||||||||||||||||||||||
| 12/31/12 | 10.09 | 0.20 | 1.43 | 1.63 | (0.32 | ) | - | (0.32 | ) | 11.40 | 16.16% | 115,576 | 1.13% | 0.98% | 1.81% | |||||||||||||||||||||||||||||||||||||
| 12/31/11 | 10.45 | 0.15 | (0.41 | ) | (0.26 | ) | (0.10 | ) | - | (0.10 | ) | 10.09 | (2.39% | ) | 100,173 | 1.13% | 0.98% | 1.41% | ||||||||||||||||||||||||||||||||||
Class A |
| |||||||||||||||||||||||||||||||||||||||||||||||||||
| 09/30/16 | $ | 12.35 | $ | 0.18 | $ | 1.26 | $ | 1.44 | $ | (0.15 | ) | $ | (1.36 | ) | $ | (1.51 | ) | $ | 12.28 | 12.58% | $ | 161,322 | 1.18% | N/A | 1.50% | |||||||||||||||||||||||||||
| 09/30/15i | 13.90 | 0.11 | (1.26 | ) | (1.15 | ) | - | (0.40 | ) | (0.40 | ) | 12.35 | (8.39% | )b | 170,054 | 1.18% | a | N/A | 1.08% | a | ||||||||||||||||||||||||||||||||
| 12/31/14 | 13.53 | 0.15 | 1.27 | 1.42 | (0.15 | ) | (0.90 | ) | (1.05 | ) | 13.90 | 10.78% | 215,519 | 1.23% | 1.19% | 1.08% | ||||||||||||||||||||||||||||||||||||
| 12/31/13 | 11.28 | 0.15 | 3.31 | 3.46 | (0.15 | ) | (1.06 | ) | (1.21 | ) | 13.53 | 31.10% | 272,524 | 1.38% | 1.23% | 1.18% | ||||||||||||||||||||||||||||||||||||
| 12/31/12 | 9.99 | 0.17 | 1.41 | 1.58 | (0.29 | ) | - | (0.29 | ) | 11.28 | 15.85% | 332,630 | 1.38% | 1.23% | 1.56% | |||||||||||||||||||||||||||||||||||||
| 12/31/11 | 10.36 | 0.12 | (0.40 | ) | (0.28 | ) | (0.09 | ) | - | (0.09 | ) | 9.99 | (2.65% | ) | 284,989 | 1.38% | 1.24% | 1.19% | ||||||||||||||||||||||||||||||||||
Class R4 | ||||||||||||||||||||||||||||||||||||||||||||||||||||
| 09/30/16 | $ | 12.32 | $ | 0.20 | $ | 1.26 | $ | 1.46 | $ | (0.21 | ) | $ | (1.36 | ) | $ | (1.57 | ) | $ | 12.21 | 12.78% | $ | 6,905 | 1.08% | N/A | 1.66% | |||||||||||||||||||||||||||
| 09/30/15i | 13.86 | 0.12 | (1.26 | ) | (1.14 | ) | - | (0.40 | ) | (0.40 | ) | 12.32 | (8.34% | )b | 1,846 | 1.08% | a | N/A | 1.25% | a | ||||||||||||||||||||||||||||||||
| 12/31/14h | 13.74 | 0.12 | 1.10 | 1.22 | (0.20 | ) | (0.90 | ) | (1.10 | ) | 13.86 | 9.16% | b | 109 | 1.07% | a | N/A | 1.11% | a | |||||||||||||||||||||||||||||||||
Class R3 |
| |||||||||||||||||||||||||||||||||||||||||||||||||||
| 09/30/16 | $ | 12.25 | $ | 0.16 | $ | 1.25 | $ | 1.41 | $ | (0.16 | ) | $ | (1.36 | ) | $ | (1.52 | ) | $ | 12.14 | 12.41% | $ | 1,512 | 1.33% | N/A | 1.34% | |||||||||||||||||||||||||||
| 09/30/15i | 13.81 | 0.10 | (1.26 | ) | (1.16 | ) | - | (0.40 | ) | (0.40 | ) | 12.25 | (8.51% | )b | 896 | 1.33% | a | N/A | 0.95% | a | ||||||||||||||||||||||||||||||||
| 12/31/14 | 13.45 | 0.12 | 1.27 | 1.39 | (0.13 | ) | (0.90 | ) | (1.03 | ) | 13.81 | 10.63% | 977 | 1.41% | 1.37% | 0.88% | ||||||||||||||||||||||||||||||||||||
| 12/31/13 | 11.25 | 0.11 | 3.29 | 3.40 | (0.14 | ) | (1.06 | ) | (1.20 | ) | 13.45 | 30.66% | 1,245 | 1.68% | 1.53% | 0.88% | ||||||||||||||||||||||||||||||||||||
| 12/31/12 | 9.90 | 0.14 | 1.40 | 1.54 | (0.19 | ) | - | (0.19 | ) | 11.25 | 15.55% | 878 | 1.68% | 1.53% | 1.29% | |||||||||||||||||||||||||||||||||||||
| 12/31/11 | 10.25 | 0.09 | (0.40 | ) | (0.31 | ) | (0.04 | ) | - | (0.04 | ) | 9.90 | (2.95% | ) | 1,951 | 1.68% | 1.54% | 0.89% | ||||||||||||||||||||||||||||||||||
| Year ended September 30, 2016 | Period ended September 30, 2015b | Year ended December 31 | ||||||||||||||||||||||
| 2014 | 2013 | 2012 | 2011 | |||||||||||||||||||||
Portfolio turnover rate | 16 | % | 15 | % | 19 | % | 18 | % | 22 | % | 14 | % | ||||||||||||
| a | Annualized. |
| b | Percentage represents the results for the period and is not annualized. |
| c | Per share amount calculated on the average shares method. |
| h | For the period April 1, 2014 (commencement of operations) through December 31, 2014. |
| i | For the period January 1, 2015 through September 30, 2015. |
| j | Computed after giving effect to an agreement by MML Advisers and/or MassMutual to waive certain fees and expenses of the Fund. |
| l | Employee retirement benefit plans that invest plan assets in the Separate Investment Accounts (SIAs) may be subject to certain charges as set forth in their respective Plan Documents. Total return figures would be lower for the periods presented if they reflected these charges. |
| m | Total return excludes sales charges, if any, and would be lower for the period presented if it reflected these charges. |
– 178 –
MASSMUTUAL SELECT LARGE CAP VALUE FUND
| Income (loss) from investment operations | Less distributions to shareholders | Ratios / Supplemental Data | ||||||||||||||||||||||||||||||||||||||||||||||||||
| Net asset value, beginning of the period | Net investment income (loss)c,j | Net realized and unrealized gain (loss) on investments | Total income (loss) from investment operations | From net investment income | From net realized gains | Total distributions | Net asset value, end of the period | Total returnl,m | Net assets, end of the period (000’s) | Ratio of expenses to average daily net assets before expense waivers | Ratio of expenses to average daily net assets after expense waiversj | Net investment income (loss) to average daily net assets | ||||||||||||||||||||||||||||||||||||||||
Class I |
| |||||||||||||||||||||||||||||||||||||||||||||||||||
| 09/3016 | $ | 7.57 | $ | 0.16 | $ | 0.61 | $ | 0.77 | $ | (0.22 | ) | $ | (0.90 | ) | $ | (1.12 | ) | $ | 7.22 | 11.10% | $ | 48,768 | 0.70% | 0.63% | 2.31% | |||||||||||||||||||||||||||
| 09/30/15i | 8.29 | 0.12 | (0.78 | ) | (0.66 | ) | - | (0.06 | ) | (0.06 | ) | 7.57 | (7.94% | )b | 59,771 | 0.67% | a | 0.63% | a | 1.96% | a | |||||||||||||||||||||||||||||||
| 12/31/14h | 9.64 | 0.15 | 0.08 | 0.23 | (0.29 | ) | (1.29 | ) | (1.58 | ) | 8.29 | 3.05% | b | 148,996 | 0.64% | a | 0.63% | a | 2.09% | a | ||||||||||||||||||||||||||||||||
Class R5 |
| |||||||||||||||||||||||||||||||||||||||||||||||||||
| 09/3016 | $ | 7.58 | $ | 0.16 | $ | 0.60 | $ | 0.76 | $ | (0.21 | ) | $ | (0.90 | ) | $ | (1.11 | ) | $ | 7.23 | 10.91% | $ | 89,202 | 0.80% | 0.73% | 2.19% | |||||||||||||||||||||||||||
| 09/30/15i | 8.30 | 0.12 | (0.78 | ) | (0.66 | ) | - | (0.06 | ) | (0.06 | ) | 7.58 | (7.92% | )b | 123,464 | 0.77% | a | 0.73% | a | 1.91% | a | |||||||||||||||||||||||||||||||
| 12/31/14 | 9.48 | 0.28 | 0.11 | 0.39 | (0.28 | ) | (1.29 | ) | (1.57 | ) | 8.30 | 4.73% | 172,533 | 0.75% | 0.74% | 2.92% | ||||||||||||||||||||||||||||||||||||
| 12/31/13 | 7.82 | 0.21 | 2.21 | 2.42 | (0.25 | ) | (0.51 | ) | (0.76 | ) | 9.48 | 31.24% | 337,852 | 0.77% | 0.75% | 2.33% | ||||||||||||||||||||||||||||||||||||
| 12/31/12 | 10.08 | 0.18 | 0.96 | 1.14 | (0.17 | ) | (3.23 | ) | (3.40 | ) | 7.82 | 11.22% | 336,198 | 0.77% | 0.77% | k | 1.67% | |||||||||||||||||||||||||||||||||||
| 12/31/11 | 10.60 | 0.10 | (0.54 | ) | (0.44 | ) | (0.08 | ) | - | (0.08 | ) | 10.08 | (4.15% | ) | 309,422 | 0.77% | N/A | 1.00% | ||||||||||||||||||||||||||||||||||
Service Class |
| |||||||||||||||||||||||||||||||||||||||||||||||||||
| 09/3016 | $ | 7.59 | $ | 0.15 | $ | 0.61 | $ | 0.76 | $ | (0.21 | ) | $ | (0.90 | ) | $ | (1.11 | ) | $ | 7.24 | 10.78% | $ | 4,159 | 0.90% | 0.83% | 2.11% | |||||||||||||||||||||||||||
| 09/30/15i | 8.32 | 0.11 | (0.78 | ) | (0.67 | ) | - | (0.06 | ) | (0.06 | ) | 7.59 | (8.03% | )b | 9,543 | 0.87% | a | 0.83% | a | 1.76% | a | |||||||||||||||||||||||||||||||
| 12/31/14 | 9.49 | 0.27 | 0.11 | 0.38 | (0.26 | ) | (1.29 | ) | (1.55 | ) | 8.32 | 4.59% | 13,470 | 0.85% | 0.83% | 2.81% | ||||||||||||||||||||||||||||||||||||
| 12/31/13 | 7.83 | 0.20 | 2.21 | 2.41 | (0.24 | ) | (0.51 | ) | (0.75 | ) | 9.49 | 31.11% | 34,719 | 0.86% | 0.84% | 2.23% | ||||||||||||||||||||||||||||||||||||
| 12/31/12 | 10.07 | 0.15 | 0.99 | 1.14 | (0.15 | ) | (3.23 | ) | (3.38 | ) | 7.83 | 11.22% | 26,190 | 0.86% | 0.86% | k | 1.38% | |||||||||||||||||||||||||||||||||||
| 12/31/11 | 10.60 | 0.10 | (0.56 | ) | (0.46 | ) | (0.07 | ) | - | (0.07 | ) | 10.07 | (4.34% | ) | 65,751 | 0.86% | N/A | 0.91% | ||||||||||||||||||||||||||||||||||
Administrative Class |
| |||||||||||||||||||||||||||||||||||||||||||||||||||
| 09/3016 | $ | 7.55 | $ | 0.14 | $ | 0.60 | $ | 0.74 | $ | (0.19 | ) | $ | (0.90 | ) | $ | (1.09 | ) | $ | 7.20 | 10.61% | $ | 11,292 | 1.00% | 0.93% | 1.99% | |||||||||||||||||||||||||||
| 09/30/15i | 8.27 | 0.10 | (0.76 | ) | (0.66 | ) | - | (0.06 | ) | (0.06 | ) | 7.55 | (7.95% | )b | 15,634 | 0.97% | a | 0.93% | a | 1.70% | a | |||||||||||||||||||||||||||||||
| 12/31/14 | 9.46 | 0.24 | 0.12 | 0.36 | (0.26 | ) | (1.29 | ) | (1.55 | ) | 8.27 | 4.42% | 25,165 | 0.96% | 0.94% | 2.48% | ||||||||||||||||||||||||||||||||||||
| 12/31/13 | 7.80 | 0.19 | 2.20 | 2.39 | (0.22 | ) | (0.51 | ) | (0.73 | ) | 9.46 | 30.99% | 29,046 | 1.01% | 0.99% | 2.08% | ||||||||||||||||||||||||||||||||||||
| 12/31/12 | 10.06 | 0.14 | 0.97 | 1.11 | (0.14 | ) | (3.23 | ) | (3.37 | ) | 7.80 | 10.93% | 41,924 | 1.01% | 1.01% | k | 1.34% | |||||||||||||||||||||||||||||||||||
| 12/31/11 | 10.57 | 0.08 | (0.54 | ) | (0.46 | ) | (0.05 | ) | - | (0.05 | ) | 10.06 | (4.37% | ) | 48,977 | 1.01% | N/A | 0.77% | ||||||||||||||||||||||||||||||||||
Class A |
| |||||||||||||||||||||||||||||||||||||||||||||||||||
| 09/3016 | $ | 7.52 | $ | 0.12 | $ | 0.61 | $ | 0.73 | $ | (0.17 | ) | $ | (0.90 | ) | $ | (1.07 | ) | $ | 7.18 | 10.45% | $ | 26,732 | 1.25% | 1.18% | 1.74% | |||||||||||||||||||||||||||
| 09/30/15i | 8.26 | 0.09 | (0.77 | ) | (0.68 | ) | - | (0.06 | ) | (0.06 | ) | 7.52 | (8.21% | )b | 33,802 | 1.22% | a | 1.18% | a | 1.44% | a | |||||||||||||||||||||||||||||||
| 12/31/14 | 9.44 | 0.21 | 0.13 | 0.34 | (0.23 | ) | (1.29 | ) | (1.52 | ) | 8.26 | 4.22% | 50,363 | 1.21% | 1.19% | 2.24% | ||||||||||||||||||||||||||||||||||||
| 12/31/13 | 7.79 | 0.17 | 2.18 | 2.35 | (0.19 | ) | (0.51 | ) | (0.70 | ) | 9.44 | 30.53% | 65,907 | 1.26% | 1.24% | 1.84% | ||||||||||||||||||||||||||||||||||||
| 12/31/12 | 10.03 | 0.11 | 0.98 | 1.09 | (0.10 | ) | (3.23 | ) | (3.33 | ) | 7.79 | 10.77% | 69,701 | 1.26% | 1.26% | k | 1.05% | |||||||||||||||||||||||||||||||||||
| 12/31/11 | 10.54 | 0.05 | (0.55 | ) | (0.50 | ) | (0.01 | ) | - | (0.01 | ) | 10.03 | (4.70% | ) | 104,872 | 1.26% | N/A | 0.51% | ||||||||||||||||||||||||||||||||||
Class R4 |
| |||||||||||||||||||||||||||||||||||||||||||||||||||
| 09/3016 | $ | 7.50 | $ | 0.13 | $ | 0.61 | $ | 0.74 | $ | (0.19 | ) | $ | (0.90 | ) | $ | (1.09 | ) | $ | 7.15 | 10.64% | $ | 89 | 1.15% | 1.08% | 1.85% | |||||||||||||||||||||||||||
| 09/30/15i | 8.24 | 0.10 | (0.78 | ) | (0.68 | ) | - | (0.06 | ) | (0.06 | ) | 7.50 | (8.23% | )b | 94 | 1.12% | a | 1.08% | a | 1.57% | a | |||||||||||||||||||||||||||||||
| 12/31/14h | 9.59 | 0.12 | 0.08 | 0.20 | (0.26 | ) | (1.29 | ) | (1.55 | ) | 8.24 | 2.71% | b | 103 | 1.09% | a | 1.08% | a | 1.68% | a | ||||||||||||||||||||||||||||||||
Class R3 |
| |||||||||||||||||||||||||||||||||||||||||||||||||||
| 09/3016 | $ | 7.38 | $ | 0.11 | $ | 0.59 | $ | 0.70 | $ | (0.16 | ) | $ | (0.90 | ) | $ | (1.06 | ) | $ | 7.02 | 10.26% | $ | 51 | 1.40% | 1.33% | 1.56% | |||||||||||||||||||||||||||
| 09/30/15i | 8.12 | 0.08 | (0.76 | ) | (0.68 | ) | - | (0.06 | ) | (0.06 | ) | 7.38 | (8.35% | )b | 79 | 1.37% | a | 1.33% | a | 1.31% | a | |||||||||||||||||||||||||||||||
| 12/31/14 | 9.30 | 0.19 | 0.14 | 0.33 | (0.22 | ) | (1.29 | ) | (1.51 | ) | 8.12 | 4.10% | 94 | 1.40% | 1.38% | 2.06% | ||||||||||||||||||||||||||||||||||||
| 12/31/13 | 7.68 | 0.14 | 2.16 | 2.30 | (0.17 | ) | (0.51 | ) | (0.68 | ) | 9.30 | 30.27% | 114 | 1.56% | 1.54% | 1.54% | ||||||||||||||||||||||||||||||||||||
| 12/31/12 | 9.93 | 0.07 | 0.97 | 1.04 | (0.06 | ) | (3.23 | ) | (3.29 | ) | 7.68 | 10.32% | 117 | 1.56% | 1.56% | k | 0.70% | |||||||||||||||||||||||||||||||||||
| 12/31/11 | 10.44 | 0.02 | (0.53 | ) | (0.51 | ) | - | - | - | 9.93 | (4.89% | ) | 434 | 1.55% | N/A | 0.22% | ||||||||||||||||||||||||||||||||||||
| Year ended September 30, 2016 | Period ended September 30, 2015b | Year ended December 31 | ||||||||||||||||||||||
| 2014 | 2013 | 2012 | 2011 | |||||||||||||||||||||
Portfolio turnover rate | 8% | 6% | 50 | % | 34 | % | 107% | 10% | ||||||||||||||||
| a | Annualized. |
| b | Percentage represents the results for the period and is not annualized. |
| c | Per share amount calculated on the average shares method. |
| h | For the period April 1, 2014 (commencement of operations) through December 31, 2014. |
| i | For the period January 1, 2015 through September 30, 2015. |
| j | Computed after giving effect to an agreement by MML Advisers and/or MassMutual to waive certain fees and expenses of the Fund. |
| k | Amount waived had no impact on the ratio of expenses to average daily net assets. |
| l | Employee retirement benefit plans that invest plan assets in the Separate Investment Accounts (SIAs) may be subject to certain charges as set forth in their respective Plan Documents. Total return figures would be lower for the periods presented if they reflected these charges. |
| m | Total return excludes sales charges, if any, and would be lower for the period presented if it reflected these charges. |
– 179 –
MM S&P 500 INDEX FUND
| Income (loss) from investment operations | Less distributions to shareholders | Ratios / Supplemental Data | ||||||||||||||||||||||||||||||||||||||||||||||||||
| Net asset value, beginning of the period | Net investment income (loss)c,j | Net realized and unrealized gain (loss) on investments | Total income (loss) from investment operations | From net investment income | From net realized gains | Total distributions | Net asset value, end of the period | Total returnl,m | Net assets, end of the period (000’s) | Ratio of expenses to average daily net assets before expense waivers | Ratio of expenses to average daily net assets after expense waiversj | Net investment income (loss) to average daily net assets | ||||||||||||||||||||||||||||||||||||||||
Class I | ||||||||||||||||||||||||||||||||||||||||||||||||||||
| 09/30/16 | $ | 17.50 | $ | 0.38 | $ | 2.24 | $ | 2.62 | $ | (0.36 | ) | $ | (0.36 | ) | $ | (0.72 | ) | $ | 19.40 | 15.30% | $ | 1,078,531 | 0.12% | N/A | 2.05% | |||||||||||||||||||||||||||
| 09/30/15i | 18.54 | 0.27 | (1.26 | ) | (0.99 | ) | - | (0.05 | ) | (0.05 | ) | 17.50 | (5.35% | )b | 860,720 | 0.12% | a | N/A | 1.93% | a | ||||||||||||||||||||||||||||||||
| 12/31/14 | 16.99 | 0.34 | 1.94 | 2.28 | (0.34 | ) | (0.39 | ) | (0.73 | ) | 18.54 | 13.55% | 619,847 | 0.13% | 0.11% | 1.90% | ||||||||||||||||||||||||||||||||||||
| 12/31/13 | 13.20 | 0.32 | 3.93 | 4.25 | (0.35 | ) | (0.11 | ) | (0.46 | ) | 16.99 | 32.34% | 436,004 | 0.18% | 0.08% | 2.01% | ||||||||||||||||||||||||||||||||||||
| 12/31/12 | 11.66 | 0.29 | 1.57 | 1.86 | (0.32 | ) | - | (0.32 | ) | 13.20 | 15.96% | 103,732 | 0.18% | 0.08% | 2.23% | |||||||||||||||||||||||||||||||||||||
| 12/31/11g | 11.85 | 0.01 | (0.02 | ) | (0.01 | ) | (0.18 | ) | - | (0.18 | ) | 11.66 | 0.00% | b,e | 57,185 | 0.17% | a | 0.06% | a | 1.80% | a | |||||||||||||||||||||||||||||||
Class R5 |
| |||||||||||||||||||||||||||||||||||||||||||||||||||
| 09/30/16 | $ | 17.52 | $ | 0.37 | $ | 2.24 | $ | 2.61 | $ | (0.34 | ) | $ | (0.36 | ) | $ | (0.70 | ) | $ | 19.43 | 15.20% | $ | 828,915 | 0.22% | N/A | 1.95% | |||||||||||||||||||||||||||
| 09/30/15i | 18.58 | 0.25 | (1.26 | ) | (1.01 | ) | - | (0.05 | ) | (0.05 | ) | 17.52 | (5.44% | )b | 872,011 | 0.22% | a | N/A | 1.82% | a | ||||||||||||||||||||||||||||||||
| 12/31/14 | 17.02 | 0.32 | 1.95 | 2.27 | (0.32 | ) | (0.39 | ) | (0.71 | ) | 18.58 | 13.46% | 1,003,654 | 0.23% | 0.22% | 1.79% | ||||||||||||||||||||||||||||||||||||
| 12/31/13 | 13.23 | 0.29 | 3.94 | 4.23 | (0.33 | ) | (0.11 | ) | (0.44 | ) | 17.02 | 32.11% | 1,003,965 | 0.25% | 0.20% | 1.88% | ||||||||||||||||||||||||||||||||||||
| 12/31/12 | 11.69 | 0.27 | 1.57 | 1.84 | (0.30 | ) | - | (0.30 | ) | 13.23 | 15.77% | 833,287 | 0.26% | 0.21% | 2.07% | |||||||||||||||||||||||||||||||||||||
| 12/31/11p | 11.70 | 0.22 | (0.01 | ) | 0.21 | (0.22 | ) | - | (0.22 | ) | 11.69 | 1.84% | 737,960 | 0.21% | 0.21% | k | 1.85% | |||||||||||||||||||||||||||||||||||
Service Class |
| |||||||||||||||||||||||||||||||||||||||||||||||||||
| 09/30/16 | $ | 17.52 | $ | 0.34 | $ | 2.24 | $ | 2.58 | $ | (0.31 | ) | $ | (0.36 | ) | $ | (0.67 | ) | $ | 19.43 | 15.03% | $ | 499,673 | 0.37% | N/A | 1.80% | |||||||||||||||||||||||||||
| 09/30/15i | 18.60 | 0.23 | (1.26 | ) | (1.03 | ) | - | (0.05 | ) | (0.05 | ) | 17.52 | (5.54% | )b | 636,417 | 0.37% | a | N/A | 1.66% | a | ||||||||||||||||||||||||||||||||
| 12/31/14 | 17.05 | 0.29 | 1.94 | 2.23 | (0.29 | ) | (0.39 | ) | (0.68 | ) | 18.60 | 13.21% | 736,040 | 0.39% | 0.38% | 1.63% | ||||||||||||||||||||||||||||||||||||
| 12/31/13 | 13.25 | 0.25 | 3.95 | 4.20 | (0.29 | ) | (0.11 | ) | (0.40 | ) | 17.05 | 31.86% | 609,354 | 0.47% | 0.42% | 1.66% | ||||||||||||||||||||||||||||||||||||
| 12/31/12 | 11.71 | 0.24 | 1.58 | 1.82 | (0.28 | ) | - | (0.28 | ) | 13.25 | 15.51% | 516,727 | 0.47% | 0.42% | 1.86% | |||||||||||||||||||||||||||||||||||||
| 12/31/11 | 11.71 | 0.19 | (0.00 | )d | 0.19 | (0.19 | ) | - | (0.19 | ) | 11.71 | 1.69% | 437,378 | 0.42% | 0.42% | k | 1.62% | |||||||||||||||||||||||||||||||||||
Administrative Class |
| |||||||||||||||||||||||||||||||||||||||||||||||||||
| 09/30/16 | $ | 17.30 | $ | 0.32 | $ | 2.22 | $ | 2.54 | $ | (0.29 | ) | $ | (0.36 | ) | $ | (0.65 | ) | $ | 19.19 | 14.96% | $ | 506,085 | 0.47% | N/A | 1.70% | |||||||||||||||||||||||||||
| 09/30/15i | 18.39 | 0.22 | (1.26 | ) | (1.04 | ) | - | (0.05 | ) | (0.05 | ) | 17.30 | (5.66% | )b | 493,479 | 0.47% | a | N/A | 1.57% | a | ||||||||||||||||||||||||||||||||
| 12/31/14 | 16.86 | 0.27 | 1.93 | 2.20 | (0.28 | ) | (0.39 | ) | (0.67 | ) | 18.39 | 13.18% | 557,940 | 0.48% | 0.47% | 1.54% | ||||||||||||||||||||||||||||||||||||
| 12/31/13 | 13.11 | 0.25 | 3.90 | 4.15 | (0.29 | ) | (0.11 | ) | (0.40 | ) | 16.86 | 31.81% | 335,898 | 0.50% | 0.45% | 1.63% | ||||||||||||||||||||||||||||||||||||
| 12/31/12 | 11.58 | 0.23 | 1.57 | 1.80 | (0.27 | ) | - | (0.27 | ) | 13.11 | 15.56% | 269,106 | 0.50% | 0.45% | 1.82% | |||||||||||||||||||||||||||||||||||||
| 12/31/11 | 11.59 | 0.19 | (0.02 | ) | 0.17 | (0.18 | ) | - | (0.18 | ) | 11.58 | 1.55% | 251,190 | 0.45% | 0.45% | k | 1.58% | |||||||||||||||||||||||||||||||||||
Class A | ||||||||||||||||||||||||||||||||||||||||||||||||||||
| 09/30/16 | $ | 17.12 | $ | 0.27 | $ | 2.19 | $ | 2.46 | $ | (0.30 | ) | $ | (0.36 | ) | $ | (0.66 | ) | $ | 18.92 | 14.63% | $ | 21,320 | 0.72% | N/A | 1.46% | |||||||||||||||||||||||||||
| 09/30/15i | 18.23 | 0.18 | (1.24 | ) | (1.06 | ) | - | (0.05 | ) | (0.05 | ) | 17.12 | (5.82% | )b | 11,784 | 0.72% | a | N/A | 1.33% | a | ||||||||||||||||||||||||||||||||
| 12/31/14h | 17.01 | 0.19 | 1.68 | 1.87 | (0.26 | ) | (0.39 | ) | (0.65 | ) | 18.23 | 11.10% | b | 3,314 | 0.72% | a | N/A | 1.43% | a | |||||||||||||||||||||||||||||||||
Class R4 | ||||||||||||||||||||||||||||||||||||||||||||||||||||
| 09/30/16 | $ | 17.16 | $ | 0.29 | $ | 2.19 | $ | 2.48 | $ | (0.27 | ) | $ | (0.36 | ) | $ | (0.63 | ) | $ | 19.01 | $ | 14.72% | $ | 632,838 | 0.62% | N/A | 1.55% | ||||||||||||||||||||||||||
| 09/30/15i | 18.25 | 0.19 | (1.23 | ) | (1.04 | ) | - | (0.05 | ) | (0.05 | ) | 17.16 | (5.70% | )b | 534,856 | 0.62% | a | N/A | 1.41% | a | ||||||||||||||||||||||||||||||||
| 12/31/14 | 16.74 | 0.24 | 1.90 | 2.14 | (0.24 | ) | (0.39 | ) | (0.63 | ) | 18.25 | 12.92% | 547,665 | 0.66% | 0.63% | 1.37% | ||||||||||||||||||||||||||||||||||||
| 12/31/13 | 13.02 | 0.22 | 3.87 | 4.09 | (0.26 | ) | (0.11 | ) | (0.37 | ) | 16.74 | 31.57% | 535,280 | 0.84% | 0.65% | 1.43% | ||||||||||||||||||||||||||||||||||||
| 12/31/12 | 11.51 | 0.21 | 1.55 | 1.76 | (0.25 | ) | - | (0.25 | ) | 13.02 | 15.28% | 388,374 | 0.90% | 0.65% | 1.63% | |||||||||||||||||||||||||||||||||||||
| 12/31/11 | 11.52 | 0.16 | (0.00 | )d | 0.16 | (0.17 | ) | - | (0.17 | ) | 11.51 | 1.42% | 336,032 | 0.85% | 0.65% | 1.40% | ||||||||||||||||||||||||||||||||||||
Class R3 | ||||||||||||||||||||||||||||||||||||||||||||||||||||
| 09/30/16 | $ | 16.95 | $ | 0.24 | $ | 2.17 | $ | 2.41 | $ | (0.30 | ) | $ | (0.36 | ) | $ | (0.66 | ) | $ | 18.70 | 14.49% | $ | 95,197 | 0.87% | N/A | 1.29% | |||||||||||||||||||||||||||
| 09/30/15i | 18.06 | 0.16 | (1.22 | ) | (1.06 | ) | - | (0.05 | ) | (0.05 | ) | 16.95 | (5.88% | )b | 24,643 | 0.87% | a | N/A | 1.21% | a | ||||||||||||||||||||||||||||||||
| 12/31/14 | 16.58 | 0.19 | 1.90 | 2.09 | (0.22 | ) | (0.39 | ) | (0.61 | ) | 18.06 | 12.68% | 3,736 | 0.92% | 0.89% | 1.12% | ||||||||||||||||||||||||||||||||||||
| 12/31/13 | 12.90 | 0.17 | 3.83 | 4.00 | (0.21 | ) | (0.11 | ) | (0.32 | ) | 16.58 | 31.14% | 4,940 | 1.14% | 0.95% | 1.13% | ||||||||||||||||||||||||||||||||||||
| 12/31/12 | 11.41 | 0.17 | 1.53 | 1.70 | (0.21 | ) | - | (0.21 | ) | 12.90 | 14.91% | 3,869 | 1.20% | 0.95% | 1.33% | |||||||||||||||||||||||||||||||||||||
| 12/31/11 | 11.42 | 0.13 | (0.01 | ) | 0.12 | (0.13 | ) | - | (0.13 | ) | 11.41 | 1.13% | 3,385 | 1.15% | 0.95% | 1.10% | ||||||||||||||||||||||||||||||||||||
| Year ended September 30, 2016 | Period ended September 30, 2015b | Year ended December 31 | ||||||||||||||||||||||
| 2014 | 2013 | 2012 | 2011 | |||||||||||||||||||||
Portfolio turnover rate | 4 | % | 2 | % | 5 | % | 10 | % | 3 | % | 2 | % | ||||||||||||
| a | Annualized. |
| b | Percentage represents the results for the period and is not annualized. |
| c | Per share amount calculated on the average shares method. |
| d | Amount is less than $0.005 per share. |
| e | Amount is less than 0.005%. |
| g | For the period December 7, 2011 (commencement of operations) through December 31, 2011. |
| h | For the period April 1, 2014 (commencement of operations) through December 31, 2014. |
| i | For the period January 1, 2015 through September 30, 2015. |
| j | Computed after giving effect to an agreement by MML Advisers and/or MassMutual to waive certain fees and expenses of the Fund. |
| k | Amount waived had no impact on the ratio of expenses to average daily net assets. |
| l | Employee retirement benefit plans that invest plan assets in the Separate Investment Accounts (SIAs) may be subject to certain charges as set forth in their respective Plan Documents. Total return figures would be lower for the periods presented if they reflected these charges. |
| m | Total return excludes sales charges, if any, and would be lower for the period presented if it reflected these charges. |
| p | Class Z shares were renamed Class I shares on September 30, 2011. Class I shares were renamed Class R5 shares on April 1, 2014. |
– 180 –
MASSMUTUAL SELECT FOCUSED VALUE FUND
| Income (loss) from investment operations | Less distributions to shareholders | Ratios / Supplemental Data | ||||||||||||||||||||||||||||||||||||||||||||||||||
| Net asset value, beginning of the period | Net investment income (loss)c,j | Net realized and unrealized gain (loss) on investments | Total income (loss) from investment operations | From net investment income | From net realized gains | Total distributions | Net asset value, end of the period | Total returnl,m | Net assets, end of the period (000’s) | Ratio of expenses to average daily net assets before expense waivers | Ratio of expenses to average daily net assets after expense waiversj | Net investment income (loss) to average daily net assets | ||||||||||||||||||||||||||||||||||||||||
Class I |
| |||||||||||||||||||||||||||||||||||||||||||||||||||
| 09/30/16 | $ | 19.31 | $ | 0.25 | $ | 2.13 | $ | 2.38 | $ | (0.36 | ) | $ | (2.93 | ) | $ | (3.29 | ) | $ | 18.40 | 13.56% | $ | 213,648 | 0.73% | N/A | 1.43% | |||||||||||||||||||||||||||
| 09/30/15i | 22.69 | 0.28 | (3.41 | ) | (3.13 | ) | - | (0.25 | ) | (0.25 | ) | 19.31 | (13.85% | )b | 216,254 | 0.73% | a | N/A | 1.70% | a | ||||||||||||||||||||||||||||||||
| 12/31/14 | 23.34 | 0.46 | 2.34 | 2.80 | (0.47 | ) | (2.98 | ) | (3.45 | ) | 22.69 | 12.54% | 222,925 | 0.74% | 0.71% | 1.94% | ||||||||||||||||||||||||||||||||||||
| 12/31/13 | 18.86 | 0.14 | 6.99 | 7.13 | (0.14 | ) | (2.51 | ) | (2.65 | ) | 23.34 | 38.45% | 167,586 | 0.78% | 0.68% | 0.63% | ||||||||||||||||||||||||||||||||||||
| 12/31/12 | 16.98 | 0.20 | 3.38 | 3.58 | (0.19 | ) | (1.51 | ) | (1.70 | ) | 18.86 | 21.28% | 121,833 | 0.78% | 0.68% | 1.04% | ||||||||||||||||||||||||||||||||||||
| 12/31/11 | 17.64 | 0.17 | (0.22 | ) | (0.05 | ) | (0.29 | ) | (0.32 | ) | (0.61 | ) | 16.98 | (0.12% | ) | 86,517 | 0.79% | 0.69% | 1.01% | |||||||||||||||||||||||||||||||||
Class R5 |
| |||||||||||||||||||||||||||||||||||||||||||||||||||
| 09/30/16 | $ | 19.34 | $ | 0.23 | $ | 2.14 | $ | 2.37 | $ | (0.34 | ) | $ | (2.93 | ) | $ | (3.27 | ) | $ | 18.44 | 13.44% | $ | 203,817 | 0.83% | N/A | 1.32% | |||||||||||||||||||||||||||
| 09/30/15i | 22.74 | 0.27 | (3.42 | ) | (3.15 | ) | - | (0.25 | ) | (0.25 | ) | 19.34 | (13.91% | )b | 240,748 | 0.83% | a | N/A | 1.62% | a | ||||||||||||||||||||||||||||||||
| 12/31/14 | 23.38 | 0.45 | 2.33 | 2.78 | (0.44 | ) | (2.98 | ) | (3.42 | ) | 22.74 | 12.44% | 336,501 | 0.84% | 0.82% | 1.89% | ||||||||||||||||||||||||||||||||||||
| 12/31/13 | 18.89 | 0.11 | 7.00 | 7.11 | (0.11 | ) | (2.51 | ) | (2.62 | ) | 23.38 | 38.28% | 316,010 | 0.90% | 0.80% | 0.51% | ||||||||||||||||||||||||||||||||||||
| 12/31/12 | 17.00 | 0.17 | 3.39 | 3.56 | (0.16 | ) | (1.51 | ) | (1.67 | ) | 18.89 | 21.17% | 266,390 | 0.90% | 0.80% | 0.88% | ||||||||||||||||||||||||||||||||||||
| 12/31/11 | 17.63 | 0.13 | (0.20 | ) | (0.07 | ) | (0.24 | ) | (0.32 | ) | (0.56 | ) | 17.00 | (0.23% | ) | 233,071 | 0.90% | 0.80% | 0.73% | |||||||||||||||||||||||||||||||||
Service Class |
| |||||||||||||||||||||||||||||||||||||||||||||||||||
| 09/30/16 | $ | 19.11 | $ | 0.21 | $ | 2.10 | $ | 2.31 | $ | (0.31 | ) | $ | (2.93 | ) | $ | (3.24 | ) | $ | 18.18 | 13.31% | $ | 69,632 | 0.93% | N/A | 1.22% | |||||||||||||||||||||||||||
| 09/30/15i | 22.49 | 0.25 | (3.38 | ) | (3.13 | ) | - | (0.25 | ) | (0.25 | ) | 19.11 | (14.02% | )b | 76,245 | 0.93% | a | N/A | 1.50% | a | ||||||||||||||||||||||||||||||||
| 12/31/14 | 23.16 | 0.44 | 2.29 | 2.73 | (0.42 | ) | (2.98 | ) | (3.40 | ) | 22.49 | 12.33% | 98,642 | 0.94% | 0.92% | 1.87% | ||||||||||||||||||||||||||||||||||||
| 12/31/13 | 18.74 | 0.09 | 6.94 | 7.03 | (0.10 | ) | (2.51 | ) | (2.61 | ) | 23.16 | 38.13% | 98,784 | 1.00% | 0.90% | 0.42% | ||||||||||||||||||||||||||||||||||||
| 12/31/12 | 16.88 | 0.14 | 3.38 | 3.52 | (0.15 | ) | (1.51 | ) | (1.66 | ) | 18.74 | 21.03% | 59,000 | 1.00% | 0.90% | 0.77% | ||||||||||||||||||||||||||||||||||||
| 12/31/11 | 17.49 | 0.11 | (0.20 | ) | (0.09 | ) | (0.20 | ) | (0.32 | ) | (0.52 | ) | 16.88 | (0.35% | ) | 60,921 | 1.00% | 0.90% | 0.63% | |||||||||||||||||||||||||||||||||
Administrative Class |
| |||||||||||||||||||||||||||||||||||||||||||||||||||
| 09/30/16 | $ | 18.94 | $ | 0.20 | $ | 2.07 | $ | 2.27 | $ | (0.29 | ) | $ | (2.93 | ) | $ | (3.22 | ) | $ | 17.99 | 13.19% | $ | 89,646 | 1.03% | N/A | 1.12% | |||||||||||||||||||||||||||
| 09/30/15i | 22.31 | 0.23 | (3.35 | ) | (3.12 | ) | - | (0.25 | ) | (0.25 | ) | 18.94 | (14.04% | )b | 97,736 | 1.03% | a | N/A | 1.42% | a | ||||||||||||||||||||||||||||||||
| 12/31/14 | 23.00 | 0.38 | 2.30 | 2.68 | (0.39 | ) | (2.98 | ) | (3.37 | ) | 22.31 | 12.20% | 111,776 | 1.05% | 1.03% | 1.63% | ||||||||||||||||||||||||||||||||||||
| 12/31/13 | 18.62 | 0.06 | 6.90 | 6.96 | (0.07 | ) | (2.51 | ) | (2.58 | ) | 23.00 | 37.97% | 105,331 | 1.15% | 1.05% | 0.26% | ||||||||||||||||||||||||||||||||||||
| 12/31/12 | 16.79 | 0.12 | 3.34 | 3.46 | (0.12 | ) | (1.51 | ) | (1.63 | ) | 18.62 | 20.82% | 73,933 | 1.15% | 1.05% | 0.64% | ||||||||||||||||||||||||||||||||||||
| 12/31/11 | 17.32 | 0.08 | (0.18 | ) | (0.10 | ) | (0.11 | ) | (0.32 | ) | (0.43 | ) | 16.79 | (0.48% | ) | 60,937 | 1.15% | 1.05% | 0.46% | |||||||||||||||||||||||||||||||||
Class A |
| |||||||||||||||||||||||||||||||||||||||||||||||||||
| 09/30/16 | $ | 18.38 | $ | 0.15 | $ | 2.01 | $ | 2.16 | $ | (0.24 | ) | $ | (2.93 | ) | $ | (3.17 | ) | $ | 17.37 | 12.93% | $ | 146,239 | 1.28% | N/A | 0.87% | |||||||||||||||||||||||||||
| 09/30/15i | 21.69 | 0.18 | (3.24 | ) | (3.06 | ) | - | (0.25 | ) | (0.25 | ) | 18.38 | (14.16% | )b | 181,803 | 1.28% | a | N/A | 1.16% | a | ||||||||||||||||||||||||||||||||
| 12/31/14 | 22.46 | 0.33 | 2.21 | 2.54 | (0.33 | ) | (2.98 | ) | (3.31 | ) | 21.69 | 11.86% | 227,294 | 1.30% | 1.28% | 1.45% | ||||||||||||||||||||||||||||||||||||
| 12/31/13 | 18.23 | 0.00 | d | 6.75 | 6.75 | (0.01 | ) | (2.51 | ) | (2.52 | ) | 22.46 | 37.66% | 218,492 | 1.40% | 1.30% | 0.01% | |||||||||||||||||||||||||||||||||||
| 12/31/12 | 16.46 | 0.07 | 3.28 | 3.35 | (0.07 | ) | (1.51 | ) | (1.58 | ) | 18.23 | 20.55% | 160,758 | 1.40% | 1.30% | 0.37% | ||||||||||||||||||||||||||||||||||||
| 12/31/11 | 16.99 | 0.04 | (0.19 | ) | (0.15 | ) | (0.06 | ) | (0.32 | ) | (0.38 | ) | 16.46 | (0.79% | ) | 142,551 | 1.40% | 1.30% | 0.23% | |||||||||||||||||||||||||||||||||
Class R4 |
| |||||||||||||||||||||||||||||||||||||||||||||||||||
| 09/30/16 | $ | 18.35 | $ | 0.16 | $ | 2.02 | $ | 2.18 | $ | (0.32 | ) | $ | (2.93 | ) | $ | (3.25 | ) | $ | 17.28 | 13.11% | $ | 6,065 | 1.18% | N/A | 0.98% | |||||||||||||||||||||||||||
| 09/30/15i | 21.65 | 0.24 | (3.29 | ) | (3.05 | ) | - | (0.25 | ) | (0.25 | ) | 18.35 | (14.14% | )b | 1,683 | 1.18% | a | N/A | 1.52% | a | ||||||||||||||||||||||||||||||||
| 12/31/14h | 22.25 | 0.10 | 2.67 | 2.77 | (0.39 | ) | (2.98 | ) | (3.37 | ) | 21.65 | 13.01% | b | 113 | 1.17% | a | N/A | 0.55% | a | |||||||||||||||||||||||||||||||||
Class R3 |
| |||||||||||||||||||||||||||||||||||||||||||||||||||
| 09/30/16 | $ | 17.72 | $ | 0.12 | $ | 1.93 | $ | 2.05 | $ | (0.29 | ) | $ | (2.93 | ) | $ | (3.22 | ) | $ | 16.55 | 12.76% | $ | 3,539 | 1.43% | N/A | 0.74% | |||||||||||||||||||||||||||
| 09/30/15i | 20.95 | 0.14 | (3.12 | ) | (2.98 | ) | - | (0.25 | ) | (0.25 | ) | 17.72 | (14.28% | )b | 2,317 | 1.44% | a | N/A | 0.94% | a | ||||||||||||||||||||||||||||||||
| 12/31/14 | 21.80 | 0.29 | 2.13 | 2.42 | (0.29 | ) | (2.98 | ) | (3.27 | ) | 20.95 | 11.67% | 721 | 1.49% | 1.47% | 1.31% | ||||||||||||||||||||||||||||||||||||
| 12/31/13 | 17.80 | (0.06 | ) | 6.57 | 6.51 | - | (2.51 | ) | (2.51 | ) | 21.80 | 37.19% | 731 | 1.70% | 1.60% | (0.28% | ) | |||||||||||||||||||||||||||||||||||
| 12/31/12 | 16.10 | (0.01 | ) | 3.22 | 3.21 | - | (1.51 | ) | (1.51 | ) | 17.80 | 20.13% | 477 | 1.70% | 1.60% | (0.06% | ) | |||||||||||||||||||||||||||||||||||
| 12/31/11 | 16.60 | (0.02 | ) | (0.16 | ) | (0.18 | ) | - | (0.32 | ) | (0.32 | ) | 16.10 | (1.02% | ) | 1,425 | 1.70% | 1.60% | (0.09% | ) | ||||||||||||||||||||||||||||||||
| Year ended September 30, 2016 | Period ended September 30, 2015b | Year ended December 31 | ||||||||||||||||||||||
| 2014 | 2013 | 2012 | 2011 | |||||||||||||||||||||
Portfolio turnover rate | 36 | % | 39 | % | 35 | % | 27 | % | 30 | % | 32 | % | ||||||||||||
| a | Annualized. |
| b | Percentage represents the results for the period and is not annualized. |
| c | Per share amount calculated on the average shares method. |
| d | Amount is less than $0.005 per share. |
| h | For the period April 1, 2014 (commencement of operations) through December 31, 2014. |
| i | For the period January 1, 2015 through September 30, 2015. |
| j | Computed after giving effect to an agreement by MML Advisers and/or MassMutual to waive certain fees and expenses of the Fund. |
| l | Employee retirement benefit plans that invest plan assets in the Separate Investment Accounts (SIAs) may be subject to certain charges as set forth in their respective Plan Documents. Total return figures would be lower for the periods presented if they reflected these charges. |
| m | Total return excludes sales charges, if any, and would be lower for the period presented if it reflected these charges. |
– 181 –
MASSMUTUAL SELECT FUNDAMENTAL GROWTH FUND
| Net asset value, beginning of the period | Income (loss) from investment operations | Less distributions to shareholders | Net asset value, end of the period | Total returnl,m | Ratios / Supplemental Data | |||||||||||||||||||||||||||||||||||||||||||||||
| Net investment income (loss)c,j | Net realized and unrealized gain (loss) on investments | Total income (loss) from investment operations | From net investment income | From net realized gains | Total distributions | Net assets, end of the period (000’s) | Ratio of expenses to average daily net assets before expense waivers | Ratio of expenses to average daily net assets after expense waiversj | Net investment income (loss) to average daily net assets | |||||||||||||||||||||||||||||||||||||||||||
Class I | ||||||||||||||||||||||||||||||||||||||||||||||||||||
| 09/30/16 | $ | 8.02 | $ | 0.07 | $ | 0.86 | $ | 0.93 | $ | (0.08 | ) | $ | (0.86 | ) | $ | (0.94 | ) | $ | 8.01 | 12.02% | $ | 56,680 | 0.82% | 0.70% | 0.86% | |||||||||||||||||||||||||||
| 09/30/15i | 8.18 | 0.05 | (0.18 | ) | (0.13 | ) | - | (0.03 | ) | (0.03 | ) | 8.02 | (1.60% | )b | 75,265 | 0.81% | a | 0.70% | a | 0.80% | a | |||||||||||||||||||||||||||||||
| 12/31/14h | 8.42 | 0.07 | 0.78 | 0.85 | (0.09 | ) | (1.00 | ) | (1.09 | ) | 8.18 | 10.42% | b | 86,370 | 0.75% | a | 0.70% | a | 1.03% | a | ||||||||||||||||||||||||||||||||
Class R5 | ||||||||||||||||||||||||||||||||||||||||||||||||||||
| 09/30/16 | $ | 8.03 | $ | 0.06 | $ | 0.86 | $ | 0.92 | $ | (0.07 | ) | $ | (0.86 | ) | $ | (0.93 | ) | $ | 8.02 | 11.88% | $ | 23,154 | 0.92% | 0.80% | 0.76% | |||||||||||||||||||||||||||
| 09/30/15i | 8.20 | 0.04 | (0.18 | ) | (0.14 | ) | - | (0.03 | ) | (0.03 | ) | 8.03 | (1.71% | )b | 20,054 | 0.91% | a | 0.80% | a | 0.71% | a | |||||||||||||||||||||||||||||||
| 12/31/14 | 8.35 | 0.06 | 0.86 | 0.92 | (0.07 | ) | (1.00 | ) | (1.07 | ) | 8.20 | 11.38% | 21,110 | 0.87% | 0.80% | 0.75% | ||||||||||||||||||||||||||||||||||||
| 12/31/13 | 6.62 | 0.06 | 2.05 | 2.11 | (0.07 | ) | (0.31 | ) | (0.38 | ) | 8.35 | 32.24% | 86,288 | 0.90% | 0.81% | 0.79% | ||||||||||||||||||||||||||||||||||||
| 12/31/12 | 5.89 | 0.07 | 0.71 | 0.78 | (0.05 | ) | (0.00 | )d | (0.05 | ) | 6.62 | 13.26% | 73,897 | 0.91% | 0.83% | 1.02% | ||||||||||||||||||||||||||||||||||||
| 12/31/11 | 5.72 | 0.02 | 0.16 | 0.18 | (0.01 | ) | - | (0.01 | ) | 5.89 | 3.13% | 20,468 | 0.64% | N/A | 0.31% | |||||||||||||||||||||||||||||||||||||
Service Class |
| |||||||||||||||||||||||||||||||||||||||||||||||||||
| 09/30/16 | $ | 7.91 | $ | 0.05 | $ | 0.84 | $ | 0.89 | $ | (0.06 | ) | $ | (0.86 | ) | $ | (0.92 | ) | $ | 7.88 | 11.69% | $ | 6,561 | 1.02% | 0.90% | 0.67% | |||||||||||||||||||||||||||
| 09/30/15i | 8.07 | 0.04 | (0.17 | ) | (0.13 | ) | - | (0.03 | ) | (0.03 | ) | 7.91 | (1.62% | )b | 5,627 | 1.01% | a | 0.90% | a | 0.62% | a | |||||||||||||||||||||||||||||||
| 12/31/14 | 8.25 | 0.06 | 0.83 | 0.89 | (0.07 | ) | (1.00 | ) | (1.07 | ) | 8.07 | 11.13% | 6,829 | 0.94% | 0.90% | 0.76% | ||||||||||||||||||||||||||||||||||||
| 12/31/13 | 6.54 | 0.05 | 2.04 | 2.09 | (0.07 | ) | (0.31 | ) | (0.38 | ) | 8.25 | 32.23% | 6,015 | 0.94% | 0.91% | 0.68% | ||||||||||||||||||||||||||||||||||||
| 12/31/12 | 5.82 | 0.05 | 0.71 | 0.76 | (0.04 | ) | (0.00 | )d | (0.04 | ) | 6.54 | 13.09% | 3,948 | 0.97% | 0.94% | 0.73% | ||||||||||||||||||||||||||||||||||||
| 12/31/11 | 5.66 | 0.01 | 0.15 | 0.16 | (0.00 | )d | - | (0.00 | )d | 5.82 | 2.89% | 1,859 | 0.74% | N/A | 0.21% | |||||||||||||||||||||||||||||||||||||
Administrative Class |
| |||||||||||||||||||||||||||||||||||||||||||||||||||
| 09/30/16 | $ | 7.77 | $ | 0.04 | $ | 0.83 | $ | 0.87 | $ | (0.06 | ) | $ | (0.86 | ) | $ | (0.92 | ) | $ | 7.72 | 11.54% | $ | 10,205 | 1.12% | 1.00% | 0.56% | |||||||||||||||||||||||||||
| 09/30/15i | 7.93 | 0.03 | (0.16 | ) | (0.13 | ) | - | (0.03 | ) | (0.03 | ) | 7.77 | (1.65% | )b | 10,157 | 1.11% | a | 1.00% | a | 0.50% | a | |||||||||||||||||||||||||||||||
| 12/31/14 | 8.13 | 0.05 | 0.81 | 0.86 | (0.06 | ) | (1.00 | ) | (1.06 | ) | 7.93 | 10.93% | 9,696 | 1.06% | 1.01% | 0.64% | ||||||||||||||||||||||||||||||||||||
| 12/31/13 | 6.45 | 0.04 | 2.00 | 2.04 | (0.05 | ) | (0.31 | ) | (0.36 | ) | 8.13 | 32.00% | 10,925 | 1.09% | 1.06% | 0.55% | ||||||||||||||||||||||||||||||||||||
| 12/31/12 | 5.74 | 0.04 | 0.70 | 0.74 | (0.03 | ) | (0.00 | )d | (0.03 | ) | 6.45 | 12.97% | 10,370 | 1.12% | 1.09% | 0.61% | ||||||||||||||||||||||||||||||||||||
| 12/31/11 | 5.58 | 0.00 | d | 0.16 | 0.16 | - | - | - | 5.74 | 2.87% | 6,929 | 0.89% | N/A | 0.06% | ||||||||||||||||||||||||||||||||||||||
Class A |
| |||||||||||||||||||||||||||||||||||||||||||||||||||
| 09/30/16 | $ | 7.50 | $ | 0.02 | $ | 0.80 | $ | 0.82 | $ | (0.03 | ) | $ | (0.86 | ) | $ | (0.89 | ) | $ | 7.43 | 11.30% | $ | 16,594 | 1.37% | 1.25% | 0.31% | |||||||||||||||||||||||||||
| 09/30/15i | 7.68 | 0.02 | (0.17 | ) | (0.15 | ) | - | (0.03 | ) | (0.03 | ) | 7.50 | (1.96% | )b | 17,774 | 1.36% | a | 1.25% | a | 0.26% | a | |||||||||||||||||||||||||||||||
| 12/31/14 | 7.89 | 0.03 | 0.80 | 0.83 | (0.04 | ) | (1.00 | ) | (1.04 | ) | 7.68 | 10.86% | 24,193 | 1.31% | 1.26% | 0.38% | ||||||||||||||||||||||||||||||||||||
| 12/31/13 | 6.28 | 0.02 | 1.94 | 1.96 | (0.04 | ) | (0.31 | ) | (0.35 | ) | 7.89 | 31.53% | 23,867 | 1.34% | 1.31% | 0.29% | ||||||||||||||||||||||||||||||||||||
| 12/31/12 | 5.58 | 0.02 | 0.69 | 0.71 | (0.01 | ) | (0.00 | )d | (0.01 | ) | 6.28 | 12.79% | 16,843 | 1.37% | 1.35% | 0.29% | ||||||||||||||||||||||||||||||||||||
| 12/31/11 | 5.44 | (0.01 | ) | 0.15 | 0.14 | - | - | - | 5.58 | 2.57% | 15,768 | 1.14% | N/A | (0.19% | ) | |||||||||||||||||||||||||||||||||||||
Class R4 | ||||||||||||||||||||||||||||||||||||||||||||||||||||
| 09/30/16 | $ | 7.49 | $ | 0.03 | $ | 0.79 | $ | 0.82 | $ | (0.06 | ) | $ | (0.86 | ) | $ | (0.92 | ) | $ | 7.39 | 11.33% | $ | 720 | 1.27% | 1.15% | 0.42% | |||||||||||||||||||||||||||
| 09/30/15i | 7.66 | 0.02 | (0.16 | ) | (0.14 | ) | - | (0.03 | ) | (0.03 | ) | 7.49 | (1.84% | )b | 193 | 1.26% | a | 1.15% | a | 0.32% | a | |||||||||||||||||||||||||||||||
| 12/31/14h | 7.95 | 0.04 | 0.73 | 0.77 | (0.06 | ) | (1.00 | ) | (1.06 | ) | 7.66 | 10.03% | b | 110 | 1.20% | a | 1.15% | a | 0.59% | a | ||||||||||||||||||||||||||||||||
Class R3 |
| |||||||||||||||||||||||||||||||||||||||||||||||||||
| 09/30/16 | $ | 7.19 | $ | 0.01 | $ | 0.76 | $ | 0.77 | $ | (0.06 | ) | $ | (0.86 | ) | $ | (0.92 | ) | $ | 7.04 | 11.15% | $ | 1,343 | 1.52% | 1.40% | 0.20% | |||||||||||||||||||||||||||
| 09/30/15i | 7.38 | (0.00 | )d | (0.16 | ) | (0.16 | ) | - | (0.03 | ) | (0.03 | ) | 7.19 | (2.18% | )b | 100 | 1.51% | a | 1.40% | a | (0.06% | )a | ||||||||||||||||||||||||||||||
| 12/31/14 | 7.64 | 0.02 | 0.76 | 0.78 | (0.04 | ) | (1.00 | ) | (1.04 | ) | 7.38 | 10.51% | 3 | 1.49% | 1.44% | 0.24% | ||||||||||||||||||||||||||||||||||||
| 12/31/13 | 6.07 | 0.00 | d | 1.88 | 1.88 | (0.00 | )d | (0.31 | ) | (0.31 | ) | 7.64 | 31.26% | 168 | 1.64% | 1.61% | 0.02% | |||||||||||||||||||||||||||||||||||
| 12/31/12 | 5.41 | (0.00 | )d | 0.66 | 0.66 | - | (0.00 | )d | (0.00 | )d | 6.07 | 12.27% | 248 | 1.68% | 1.66% | (0.02% | ) | |||||||||||||||||||||||||||||||||||
| 12/31/11 | 5.28 | (0.03 | ) | 0.16 | 0.13 | - | - | - | 5.41 | 2.46% | 337 | 1.44% | N/A | (0.50% | ) | |||||||||||||||||||||||||||||||||||||
| Year ended September 30, 2016 | Period ended September 30, 2015b | Year ended December 31 | ||||||||||||||||||||||
| 2014 | 2013 | 2012 | 2011 | |||||||||||||||||||||
Portfolio turnover rate | 49 | % | 37 | % | 59 | % | 62 | % | 109 | % | 49 | % | ||||||||||||
| a | Annualized. |
| b | Percentage represents the results for the period and is not annualized. |
| c | Per share amount calculated on the average shares method. |
| d | Amount is less than $0.005 per share. |
| h | For the period April 1, 2014 (commencement of operations) through December 31, 2014. |
| i | For the period January 1, 2015 through September 30, 2015. |
| j | Computed after giving effect to an agreement by MML Advisers and/or MassMutual to waive certain fees and expenses of the Fund. |
| l | Employee retirement benefit plans that invest plan assets in the Separate Investment Accounts (SIAs) may be subject to certain charges as set forth in their respective Plan Documents. Total return figures would be lower for the periods presented if they reflected these charges. |
| m | Total return excludes sales charges, if any, and would be lower for the period presented if it reflected these charges. |
– 182 –
MASSMUTUAL SELECT BLUE CHIP GROWTH FUND
| Income (loss) from investment operations | Less distributions to shareholders | Ratios / Supplemental Data | ||||||||||||||||||||||||||||||||||||||||||||||||||
| Net asset value, beginning of the period | Net investment income (loss)c,j | Net realized and unrealized gain (loss) on investments | Total income (loss) from investment operations | From net investment income | From net realized gains | Total distributions | Net asset value, end of the period | Total returnl,m | Net assets, end of the period (000’s) | Ratio of expenses to average daily net assets before expense waivers | Ratio of expenses to average daily net assets after expense waiversj | Net investment income (loss) to average daily net assets | ||||||||||||||||||||||||||||||||||||||||
Class I |
| |||||||||||||||||||||||||||||||||||||||||||||||||||
| 09/30/16 | $ | 17.24 | $ | 0.05 | $ | 2.33 | $ | 2.38 | $ | (0.10 | ) | $ | (2.86 | ) | $ | (2.96 | ) | $ | 16.66 | 14.57% | $ | 511,543 | 0.66% | N/A | 0.34% | |||||||||||||||||||||||||||
| 09/30/15i | 17.24 | 0.03 | 0.13 | 0.16 | - | (0.16 | ) | (0.16 | ) | 17.24 | 0.87% | b | 317,029 | 0.67% | a | N/A | 0.24% | a | ||||||||||||||||||||||||||||||||||
| 12/31/14h | 16.75 | 0.01 | 1.73 | 1.74 | - | (1.25 | ) | (1.25 | ) | 17.24 | 10.55% | b | 268,755 | 0.66% | a | N/A | 0.05% | a | ||||||||||||||||||||||||||||||||||
Class R5 |
| |||||||||||||||||||||||||||||||||||||||||||||||||||
| 09/30/16 | $ | 17.22 | $ | 0.04 | $ | 2.31 | $ | 2.35 | $ | (0.08 | ) | $ | (2.86 | ) | $ | (2.94 | ) | $ | 16.63 | 14.38% | $ | 367,547 | 0.76% | N/A | 0.23% | |||||||||||||||||||||||||||
| 09/30/15i | 17.23 | 0.02 | 0.13 | 0.15 | - | (0.16 | ) | (0.16 | ) | 17.22 | 0.81% | b | 491,897 | 0.77% | a | N/A | 0.14% | a | ||||||||||||||||||||||||||||||||||
| 12/31/14 | 16.94 | (0.01 | ) | 1.55 | 1.54 | - | (1.25 | ) | (1.25 | ) | 17.23 | 9.25% | 560,395 | 0.76% | 0.76% | n | (0.05% | ) | ||||||||||||||||||||||||||||||||||
| 12/31/13 | 12.77 | 0.00 | d | 5.24 | 5.24 | (0.00 | )d | (1.07 | ) | (1.07 | ) | 16.94 | 41.38% | 526,553 | 0.78% | 0.76% | 0.02% | |||||||||||||||||||||||||||||||||||
| 12/31/12 | 10.81 | 0.04 | 1.95 | 1.99 | (0.03 | ) | - | (0.03 | ) | 12.77 | 18.43% | 406,245 | 0.82% | 0.76% | 0.34% | |||||||||||||||||||||||||||||||||||||
| 12/31/11 | 10.65 | 0.02 | 0.14 | 0.16 | (0.00 | )d | - | (0.00 | )d | 10.81 | 1.50% | 270,651 | 0.84% | 0.76% | 0.17% | |||||||||||||||||||||||||||||||||||||
Service Class |
| |||||||||||||||||||||||||||||||||||||||||||||||||||
| 09/30/16 | $ | 17.09 | $ | 0.02 | $ | 2.31 | $ | 2.33 | $ | (0.07 | ) | $ | (2.86 | ) | $ | (2.93 | ) | $ | 16.49 | 14.37% | $ | 212,993 | 0.86% | N/A | 0.14% | |||||||||||||||||||||||||||
| 09/30/15i | 17.12 | 0.01 | 0.12 | 0.13 | - | (0.16 | ) | (0.16 | ) | 17.09 | 0.70% | b | 197,891 | 0.87% | a | N/A | 0.04% | a | ||||||||||||||||||||||||||||||||||
| 12/31/14 | 16.85 | (0.02 | ) | 1.54 | 1.52 | - | (1.25 | ) | (1.25 | ) | 17.12 | 9.18% | 158,076 | 0.85% | 0.85% | n | (0.14% | ) | ||||||||||||||||||||||||||||||||||
| 12/31/13 | 12.71 | (0.01 | ) | 5.22 | 5.21 | (0.00 | )d | (1.07 | ) | (1.07 | ) | 16.85 | 41.34% | 188,792 | 0.87% | 0.82% | (0.04% | ) | ||||||||||||||||||||||||||||||||||
| 12/31/12 | 10.77 | 0.03 | 1.93 | 1.96 | (0.02 | ) | - | (0.02 | ) | 12.71 | 18.23% | 128,562 | 0.95% | 0.82% | 0.26% | |||||||||||||||||||||||||||||||||||||
| 12/31/11 | 10.61 | 0.01 | 0.15 | 0.16 | - | - | - | 10.77 | 1.51% | 87,359 | 0.97% | 0.82% | 0.13% | |||||||||||||||||||||||||||||||||||||||
Administrative Class |
| |||||||||||||||||||||||||||||||||||||||||||||||||||
| 09/30/16 | $ | 16.90 | $ | 0.01 | $ | 2.27 | $ | 2.28 | $ | (0.04 | ) | $ | (2.86 | ) | $ | (2.90 | ) | $ | 16.28 | 14.23% | $ | 232,088 | 0.96% | N/A | 0.04% | |||||||||||||||||||||||||||
| 09/30/15i | 16.94 | (0.01 | ) | 0.13 | 0.12 | - | (0.16 | ) | (0.16 | ) | 16.90 | 0.64% | b | 226,193 | 0.97% | a | N/A | (0.05% | )a | |||||||||||||||||||||||||||||||||
| 12/31/14 | 16.71 | (0.04 | ) | 1.52 | 1.48 | - | (1.25 | ) | (1.25 | ) | 16.94 | 9.01% | 262,694 | 0.96% | 0.96% | n | (0.26% | ) | ||||||||||||||||||||||||||||||||||
| 12/31/13 | 12.64 | (0.03 | ) | 5.17 | 5.14 | (0.00 | )d | (1.07 | ) | (1.07 | ) | 16.71 | 41.01% | 242,816 | 1.02% | 0.98% | (0.22% | ) | ||||||||||||||||||||||||||||||||||
| 12/31/12 | 10.71 | 0.01 | 1.93 | 1.94 | (0.01 | ) | - | (0.01 | ) | 12.64 | 18.07% | 319,306 | 1.07% | 0.98% | 0.10% | |||||||||||||||||||||||||||||||||||||
| 12/31/11 | 10.57 | (0.01 | ) | 0.15 | 0.14 | - | - | - | 10.71 | 1.42% | 243,741 | 1.09% | 0.98% | (0.09% | ) | |||||||||||||||||||||||||||||||||||||
Class A |
| |||||||||||||||||||||||||||||||||||||||||||||||||||
| 09/30/16 | $ | 16.35 | $ | (0.03 | ) | $ | 2.20 | $ | 2.17 | $ | (0.01 | ) | $ | (2.86 | ) | $ | (2.87 | ) | $ | 15.65 | 13.93% | $ | 161,079 | 1.21% | N/A | (0.22% | ) | |||||||||||||||||||||||||
| 09/30/15i | 16.42 | (0.04 | ) | 0.13 | 0.09 | - | (0.16 | ) | (0.16 | ) | 16.35 | 0.48% | b | 150,749 | 1.22% | a | N/A | (0.30% | )a | |||||||||||||||||||||||||||||||||
| 12/31/14 | 16.27 | (0.08 | ) | 1.48 | 1.40 | - | (1.25 | ) | (1.25 | ) | 16.42 | 8.77% | 157,200 | 1.21% | 1.20% | (0.50% | ) | |||||||||||||||||||||||||||||||||||
| 12/31/13 | 12.35 | (0.06 | ) | 5.05 | 4.99 | (0.00 | )d | (1.07 | ) | (1.07 | ) | 16.27 | 40.76% | 182,452 | 1.26% | 1.19% | (0.41% | ) | ||||||||||||||||||||||||||||||||||
| 12/31/12 | 10.48 | (0.01 | ) | 1.88 | 1.87 | - | - | - | 12.35 | 17.84% | 140,294 | 1.32% | 1.19% | (0.08% | ) | |||||||||||||||||||||||||||||||||||||
| 12/31/11 | 10.36 | (0.03 | ) | 0.15 | 0.12 | - | - | - | 10.48 | 1.16% | 75,919 | 1.34% | 1.19% | (0.29% | ) | |||||||||||||||||||||||||||||||||||||
Class R4 |
| |||||||||||||||||||||||||||||||||||||||||||||||||||
| 09/30/16 | $ | 16.38 | $ | (0.02 | ) | $ | 2.21 | $ | 2.19 | $ | (0.05 | ) | $ | (2.86 | ) | $ | (2.91 | ) | $ | 15.66 | 14.08% | $ | 44,451 | 1.11% | N/A | (0.11% | ) | |||||||||||||||||||||||||
| 09/30/15i | 16.44 | (0.03 | ) | 0.13 | 0.10 | - | (0.16 | ) | (0.16 | ) | 16.38 | 0.54% | b | 19,816 | 1.12% | a | N/A | (0.23% | )a | |||||||||||||||||||||||||||||||||
| 12/31/14h | 16.08 | (0.06 | ) | 1.67 | 1.61 | - | (1.25 | ) | (1.25 | ) | 16.44 | 10.18% | b | 776 | 1.11% | a | N/A | (0.44% | )a | |||||||||||||||||||||||||||||||||
Class R3 |
| |||||||||||||||||||||||||||||||||||||||||||||||||||
| 09/30/16 | $ | 15.65 | $ | (0.05 | ) | $ | 2.09 | $ | 2.04 | $ | (0.05 | ) | $ | (2.86 | ) | $ | (2.91 | ) | $ | 14.78 | 13.77% | $ | 22,853 | 1.36% | N/A | (0.36% | ) | |||||||||||||||||||||||||
| 09/30/15i | 15.75 | (0.06 | ) | 0.12 | 0.06 | - | (0.16 | ) | (0.16 | ) | 15.65 | 0.38% | b | 3,937 | 1.37% | a | N/A | (0.47% | )a | |||||||||||||||||||||||||||||||||
| 12/31/14 | 15.68 | (0.11 | ) | 1.43 | 1.32 | - | (1.25 | ) | (1.25 | ) | 15.75 | 8.52% | 900 | 1.39% | 1.39% | n | (0.70% | ) | ||||||||||||||||||||||||||||||||||
| 12/31/13 | 11.97 | (0.10 | ) | 4.88 | 4.78 | (0.00 | )d | (1.07 | ) | (1.07 | ) | 15.68 | 40.30% | 967 | 1.55% | 1.51% | (0.73% | ) | ||||||||||||||||||||||||||||||||||
| 12/31/12 | 10.18 | (0.04 | ) | 1.83 | 1.79 | - | - | - | 11.97 | 17.58% | 727 | 1.62% | 1.51% | (0.35% | ) | |||||||||||||||||||||||||||||||||||||
| 12/31/11 | 10.11 | (0.08 | ) | 0.15 | 0.07 | - | - | - | 10.18 | 0.69% | 78 | 1.64% | 1.51% | (0.72% | ) | |||||||||||||||||||||||||||||||||||||
| Year ended September 30, 2016 | Period ended September 30, 2015b | Year ended December 31 | ||||||||||||||||||||||
| 2014 | 2013 | 2012 | 2011 | |||||||||||||||||||||
Portfolio turnover rate | 30 | % | 48 | % | 34 | % | 33 | % | 20 | % | 38 | % | ||||||||||||
| a | Annualized. |
| b | Percentage represents the results for the period and is not annualized. |
| c | Per share amount calculated on the average shares method. |
| d | Amount is less than $0.005 per share. |
| h | For the period April 1, 2014 (commencement of operations) through December 31, 2014. |
| i | For the period January 1, 2015 through September 30, 2015. |
| j | Computed after giving effect to an agreement by MML Advisers and/or MassMutual to waive certain fees and expenses of the Fund. |
| l | Employee retirement benefit plans that invest plan assets in the Separate Investment Accounts (SIAs) may be subject to certain charges as set forth in their respective Plan Documents. Total return figures would be lower for the periods presented if they reflected these charges. |
| m | Total return excludes sales charges, if any, and would be lower for the period presented if it reflected these charges. |
| n | Expenses incurred during the period fell under the expense cap. |
– 183 –
MASSMUTUAL SELECT GROWTH OPPORTUNITIES FUND
| Income (loss) from investment operations | Less distributions to shareholders | Ratios / Supplemental Data | ||||||||||||||||||||||||||||||||||||||||||||||||||
| Net asset value, beginning of the period | Net investment income (loss)c,j | Net realized and unrealized gain (loss) on investments | Total income (loss) from investment operations | From net investment income | From net realized gains | Total distributions | Net asset value, end of the period | Total returnl,m | Net assets, end of the period (000’s) | Ratio of expenses to average daily net assets before expense waivers | Ratio of expenses to average daily net assets after expense waiversj | Net investment income (loss) to average daily net assets | ||||||||||||||||||||||||||||||||||||||||
Class I | ||||||||||||||||||||||||||||||||||||||||||||||||||||
| 09/30/16 | $ | 10.98 | $ | (0.01 | ) | $ | 1.07 | $ | 1.06 | $ | - | $ | (1.22 | ) | $ | (1.22 | ) | $ | 10.82 | 9.61% | $ | 352,915 | 0.74% | N/A | (0.10% | ) | ||||||||||||||||||||||||||
| 09/30/15i | 11.90 | 0.00 | d | (0.64 | ) | (0.64 | ) | - | (0.28 | ) | (0.28 | ) | 10.98 | (5.48% | )b | 352,117 | 0.74% | a | N/A | 0.05% | a | |||||||||||||||||||||||||||||||
| 12/31/14 | 11.43 | 0.01 | 1.20 | 1.21 | - | (0.74 | ) | (0.74 | ) | 11.90 | 10.75% | 312,757 | 0.75% | 0.72% | 0.10% | |||||||||||||||||||||||||||||||||||||
| 12/31/13 | 8.89 | 0.00 | d | 3.38 | 3.38 | (0.01 | ) | (0.83 | ) | (0.84 | ) | 11.43 | 38.50% | 141,922 | 0.84% | 0.69% | 0.02% | |||||||||||||||||||||||||||||||||||
| 12/31/12 | 7.40 | 0.07 | 1.42 | 1.49 | - | - | - | 8.89 | 20.14% | 76,857 | 0.85% | 0.70% | 0.86% | |||||||||||||||||||||||||||||||||||||||
| 12/31/11g | 7.45 | (0.00 | )d | (0.05 | ) | (0.05 | ) | - | - | - | 7.40 | (0.67% | )b | 99 | 0.79% | a | 0.64% | a | (0.33% | )a | ||||||||||||||||||||||||||||||||
Class R5 |
| |||||||||||||||||||||||||||||||||||||||||||||||||||
| 09/30/16 | $ | 10.92 | $ | (0.01 | ) | $ | 1.05 | $ | 1.04 | $ | - | $ | (1.22 | ) | $ | (1.22 | ) | $ | 10.74 | 9.47% | $ | 192,509 | 0.84% | N/A | (0.14% | ) | ||||||||||||||||||||||||||
| 09/30/15i | 11.85 | (0.00 | )d | (0.65 | ) | (0.65 | ) | - | (0.28 | ) | (0.28 | ) | 10.92 | (5.58% | )b | 220,721 | 0.84% | a | N/A | (0.03% | )a | |||||||||||||||||||||||||||||||
| 12/31/14 | 11.39 | 0.00 | d | 1.20 | 1.20 | - | (0.74 | ) | (0.74 | ) | 11.85 | 10.70% | 272,981 | 0.87% | 0.83% | 0.04% | ||||||||||||||||||||||||||||||||||||
| 12/31/13 | 8.87 | (0.01 | ) | 3.36 | 3.35 | - | (0.83 | ) | (0.83 | ) | 11.39 | 38.28% | 340,443 | 0.99% | 0.84% | (0.13% | ) | |||||||||||||||||||||||||||||||||||
| 12/31/12 | 7.40 | 0.01 | 1.46 | 1.47 | - | - | - | 8.87 | 19.86% | 268,035 | 1.00% | 0.85% | 0.06% | |||||||||||||||||||||||||||||||||||||||
| 12/31/11 | 7.06 | (0.01 | ) | 0.35 | 0.34 | - | - | - | 7.40 | 4.82% | 233,080 | 0.87% | 0.86% | (0.18% | ) | |||||||||||||||||||||||||||||||||||||
Service Class |
| |||||||||||||||||||||||||||||||||||||||||||||||||||
| 09/30/16 | $ | 10.72 | $ | (0.03 | ) | $ | 1.03 | $ | 1.00 | $ | - | $ | (1.22 | ) | $ | (1.22 | ) | $ | 10.50 | 9.26% | $ | 149,667 | 0.94% | N/A | (0.31% | ) | ||||||||||||||||||||||||||
| 09/30/15i | 11.64 | (0.01 | ) | (0.63 | ) | (0.64 | ) | - | (0.28 | ) | (0.28 | ) | 10.72 | (5.60% | )b | 149,543 | 0.94% | a | N/A | (0.15% | )a | |||||||||||||||||||||||||||||||
| 12/31/14 | 11.22 | (0.01 | ) | 1.17 | 1.16 | - | (0.74 | ) | (0.74 | ) | 11.64 | 10.51% | 158,891 | 0.96% | 0.93% | (0.08% | ) | |||||||||||||||||||||||||||||||||||
| 12/31/13 | 8.76 | (0.02 | ) | 3.31 | 3.29 | - | (0.83 | ) | (0.83 | ) | 11.22 | 38.07% | 85,741 | 1.09% | 0.94% | (0.23% | ) | |||||||||||||||||||||||||||||||||||
| 12/31/12 | 7.31 | 0.00 | d | 1.45 | 1.45 | - | - | - | 8.76 | 19.84% | 45,380 | 1.10% | 0.95% | 0.03% | ||||||||||||||||||||||||||||||||||||||
| 12/31/11 | 6.98 | (0.02 | ) | 0.35 | 0.33 | - | - | - | 7.31 | 4.73% | 29,740 | 0.97% | 0.96% | (0.29% | ) | |||||||||||||||||||||||||||||||||||||
Administrative Class |
| |||||||||||||||||||||||||||||||||||||||||||||||||||
| 09/30/16 | $ | 10.46 | $ | (0.04 | ) | $ | 1.01 | $ | 0.97 | $ | - | $ | (1.22 | ) | $ | (1.22 | ) | $ | 10.21 | 9.21% | $ | 90,616 | 1.04% | N/A | (0.43% | ) | ||||||||||||||||||||||||||
| 09/30/15i | 11.37 | (0.02 | ) | (0.61 | ) | (0.63 | ) | - | (0.28 | ) | (0.28 | ) | 10.46 | (5.64% | )b | 107,017 | 1.04% | a | N/A | (0.26% | )a | |||||||||||||||||||||||||||||||
| 12/31/14 | 10.98 | (0.02 | ) | 1.15 | 1.13 | - | (0.74 | ) | (0.74 | ) | 11.37 | 10.46% | 146,975 | 1.07% | 1.04% | (0.19% | ) | |||||||||||||||||||||||||||||||||||
| 12/31/13 | 8.60 | (0.04 | ) | 3.25 | 3.21 | - | (0.83 | ) | (0.83 | ) | 10.98 | 37.85% | 110,471 | 1.24% | 1.09% | (0.39% | ) | |||||||||||||||||||||||||||||||||||
| 12/31/12 | 7.19 | (0.01 | ) | 1.42 | 1.41 | - | - | - | 8.60 | 19.61% | 85,363 | 1.25% | 1.10% | (0.10% | ) | |||||||||||||||||||||||||||||||||||||
| 12/31/11 | 6.87 | (0.03 | ) | 0.35 | 0.32 | - | - | - | 7.19 | 4.66% | 27,467 | 1.11% | 1.11% | k | (0.36% | ) | ||||||||||||||||||||||||||||||||||||
Class A |
| |||||||||||||||||||||||||||||||||||||||||||||||||||
| 09/30/16 | $ | 9.97 | $ | (0.07 | ) | $ | 0.97 | $ | 0.90 | $ | - | $ | (1.22 | ) | $ | (1.22 | ) | $ | 9.65 | 8.93% | $ | 103,902 | 1.29% | N/A | (0.72% | ) | ||||||||||||||||||||||||||
| 09/30/15i | 10.88 | (0.04 | ) | (0.59 | ) | (0.63 | ) | - | (0.28 | ) | (0.28 | ) | 9.97 | (5.90% | )b | 140,896 | 1.29% | a | N/A | (0.49% | )a | |||||||||||||||||||||||||||||||
| 12/31/14 | 10.56 | (0.05 | ) | 1.11 | 1.06 | - | (0.74 | ) | (0.74 | ) | 10.88 | 10.21% | 178,641 | 1.33% | 1.29% | (0.44% | ) | |||||||||||||||||||||||||||||||||||
| 12/31/13 | 8.32 | (0.06 | ) | 3.13 | 3.07 | - | (0.83 | ) | (0.83 | ) | 10.56 | 37.43% | 168,430 | 1.49% | 1.34% | (0.63% | ) | |||||||||||||||||||||||||||||||||||
| 12/31/12 | 6.97 | (0.03 | ) | 1.38 | 1.35 | - | - | - | 8.32 | 19.37% | 102,385 | 1.50% | 1.35% | (0.35% | ) | |||||||||||||||||||||||||||||||||||||
| 12/31/11 | 6.68 | (0.05 | ) | 0.34 | 0.29 | - | - | - | 6.97 | 4.34% | 51,191 | 1.37% | 1.36% | (0.68% | ) | |||||||||||||||||||||||||||||||||||||
Class R4 | ||||||||||||||||||||||||||||||||||||||||||||||||||||
| 09/30/16 | $ | 9.99 | $ | (0.05 | ) | $ | 0.96 | $ | 0.91 | $ | - | $ | (1.22 | ) | $ | (1.22 | ) | $ | 9.68 | 9.02% | $ | 6,861 | 1.19% | N/A | (0.58% | ) | ||||||||||||||||||||||||||
| 09/30/15i | 10.88 | (0.04 | ) | (0.57 | ) | (0.61 | ) | - | (0.28 | ) | (0.28 | ) | 9.99 | (5.71% | )b | 2,794 | 1.19% | a | N/A | (0.46% | )a | |||||||||||||||||||||||||||||||
| 12/31/14h | 10.57 | (0.03 | ) | 1.08 | 1.05 | - | (0.74 | ) | (0.74 | ) | 10.88 | 10.11% | b | 110 | 1.18% | a | N/A | (0.40% | )a | |||||||||||||||||||||||||||||||||
Class R3 |
| |||||||||||||||||||||||||||||||||||||||||||||||||||
| 09/30/16 | $ | 9.46 | $ | (0.07 | ) | $ | 0.91 | $ | 0.84 | $ | - | $ | (1.22 | ) | $ | (1.22 | ) | $ | 9.08 | 8.77% | $ | 859 | 1.44% | N/A | (0.81% | ) | ||||||||||||||||||||||||||
| 09/30/15i | 10.34 | (0.05 | ) | (0.55 | ) | (0.60 | ) | - | (0.28 | ) | (0.28 | ) | 9.46 | (5.92% | )b | 751 | 1.44% | a | N/A | (0.70% | )a | |||||||||||||||||||||||||||||||
| 12/31/14 | 10.09 | (0.07 | ) | 1.06 | 0.99 | - | (0.74 | ) | (0.74 | ) | 10.34 | 9.99% | 127 | 1.45% | 1.44% | (0.65% | ) | |||||||||||||||||||||||||||||||||||
| 12/31/13 | 8.00 | (0.09 | ) | 3.01 | 2.92 | - | (0.83 | ) | (0.83 | ) | 10.09 | 37.05% | 29 | 1.79% | 1.64% | (0.93% | ) | |||||||||||||||||||||||||||||||||||
| 12/31/12 | 6.73 | (0.05 | ) | 1.32 | 1.27 | - | - | - | 8.00 | 18.87% | 24 | 1.80% | 1.65% | (0.69% | ) | |||||||||||||||||||||||||||||||||||||
| 12/31/11 | 6.47 | (0.07 | ) | 0.33 | 0.26 | - | - | - | 6.73 | 4.02% | 21 | 1.67% | 1.66% | (0.99% | ) | |||||||||||||||||||||||||||||||||||||
| Year ended September 30, 2016 | Period ended September 30, 2015b | Year ended December 31 | ||||||||||||||||||||||
| 2014 | 2013 | 2012 | 2011 | |||||||||||||||||||||
Portfolio turnover rate | 22% | 28% | 25 | % | 29 | % | 19 | % | 21 | % | ||||||||||||||
| a | Annualized. |
| b | Percentage represents the results for the period and is not annualized. |
| c | Per share amount calculated on the average shares method. |
| d | Amount is less than $0.005 per share. |
| g | For the period December 7, 2011 (commencement of operations) through December 31, 2011. |
| h | For the period April 1, 2014 (commencement of operations) through December 31, 2014. |
| i | For the period January 1, 2015 through September 30, 2015. |
| j | Computed after giving effect to an agreement by MML Advisers and/or MassMutual to waive certain fees and expenses of the Fund. |
| k | Amount waived had no impact on the ratio of expenses to average daily net assets. |
| l | Employee retirement benefit plans that invest plan assets in the Separate Investment Accounts (SIAs) may be subject to certain charges as set forth in their respective Plan Documents. Total return figures would be lower for the periods presented if they reflected these charges. |
| m | Total return excludes sales charges, if any, and would be lower for the period presented if it reflected these charges. |
– 184 –
MASSMUTUAL SELECT MID-CAP VALUE FUND
| Income (loss) from investment operations | Less distributions to shareholders | Ratios / Supplemental Data | ||||||||||||||||||||||||||||||||||||||||||||||||||
| Net asset value, beginning of the period | Net investment income (loss)c,j | Net realized and unrealized gain (loss) on investments | Total income (loss) from investment operations | From net investment income | From net realized gains | Total distributions | Net asset value, end of the period | Total returnl,m | Net assets, end of the period (000’s) | Ratio of expenses to average daily net assets before expense waivers | Ratio of expenses to average daily net assets after expense waiversj | Net investment income (loss) to average daily net assets | ||||||||||||||||||||||||||||||||||||||||
Class I |
| |||||||||||||||||||||||||||||||||||||||||||||||||||
| 09/30/16 | $ | 13.71 | $ | 0.15 | $ | 1.93 | $ | 2.08 | $ | (0.20 | ) | $ | (2.00 | ) | $ | (2.20 | ) | $ | 13.59 | 17.08% | $ | 106,786 | 0.94% | 0.80% | 1.19% | |||||||||||||||||||||||||||
| 09/30/15i | 15.25 | 0.11 | (1.49 | ) | (1.38 | ) | - | (0.16 | ) | (0.16 | ) | 13.71 | (9.12% | )b | 128,581 | 0.84% | a | 0.80% | a | 1.00% | a | |||||||||||||||||||||||||||||||
| 12/31/14 | 14.68 | 0.21 | 0.77 | 0.98 | (0.18 | ) | (0.23 | ) | (0.41 | ) | 15.25 | 6.75% | 132,365 | 0.80% | 0.79% | 1.37% | ||||||||||||||||||||||||||||||||||||
| 12/31/13 | 11.09 | 0.18 | 3.59 | 3.77 | (0.18 | ) | - | (0.18 | ) | 14.68 | 34.02% | 67,095 | 0.84% | 0.74% | 1.36% | |||||||||||||||||||||||||||||||||||||
| 12/31/12 | 9.68 | 0.24 | 1.36 | 1.60 | (0.19 | ) | - | (0.19 | ) | 11.09 | 16.54% | 75,912 | 0.83% | 0.73% | 2.18% | |||||||||||||||||||||||||||||||||||||
| 12/31/11g | 9.88 | 0.02 | (0.11 | ) | (0.09 | ) | (0.11 | ) | - | (0.11 | ) | 9.68 | (0.84% | )b | 129 | 0.77% | a | 0.67% | a | 3.28% | a | |||||||||||||||||||||||||||||||
Class R5 |
| |||||||||||||||||||||||||||||||||||||||||||||||||||
| 09/30/16 | $ | 13.75 | $ | 0.15 | $ | 1.93 | $ | 2.08 | $ | (0.16 | ) | $ | (2.00 | ) | $ | (2.16 | ) | $ | 13.67 | 17.03% | $ | 7,072 | 1.04% | 0.90% | 1.12% | |||||||||||||||||||||||||||
| 09/30/15i | 15.32 | 0.09 | (1.50 | ) | (1.41 | ) | - | (0.16 | ) | (0.16 | ) | 13.75 | (9.22% | )b | 8,406 | 0.94% | a | 0.90% | a | 0.83% | a | |||||||||||||||||||||||||||||||
| 12/31/14 | 14.71 | 0.12 | 0.85 | 0.97 | (0.13 | ) | (0.23 | ) | (0.36 | ) | 15.32 | 6.59% | 18,333 | 0.88% | 0.88% | k | 0.79% | |||||||||||||||||||||||||||||||||||
| 12/31/13 | 11.12 | 0.16 | 3.60 | 3.76 | (0.17 | ) | - | (0.17 | ) | 14.71 | 33.85% | 81,923 | 0.88% | 0.83% | 1.24% | |||||||||||||||||||||||||||||||||||||
| 12/31/12 | 9.69 | 0.14 | 1.44 | 1.58 | (0.15 | ) | - | (0.15 | ) | 11.12 | 16.35% | 56,001 | 0.90% | 0.80% | 1.32% | |||||||||||||||||||||||||||||||||||||
| 12/31/11 | 10.09 | 0.12 | (0.41 | ) | (0.29 | ) | (0.11 | ) | - | (0.11 | ) | 9.69 | (2.84% | ) | 130,318 | 0.80% | 0.80% | k | 1.22% | |||||||||||||||||||||||||||||||||
Service Class |
| |||||||||||||||||||||||||||||||||||||||||||||||||||
| 09/30/16 | $ | 13.72 | $ | 0.12 | $ | 1.94 | $ | 2.06 | $ | (0.16 | ) | $ | (2.00 | ) | $ | (2.16 | ) | $ | 13.62 | 16.87% | $ | 2,158 | 1.14% | 1.00% | 0.95% | |||||||||||||||||||||||||||
| 09/30/15i | 15.29 | 0.08 | (1.49 | ) | (1.41 | ) | - | (0.16 | ) | (0.16 | ) | 13.72 | (9.30% | )b | 2,689 | 1.04% | a | 1.00% | a | 0.72% | a | |||||||||||||||||||||||||||||||
| 12/31/14 | 14.71 | 0.15 | 0.81 | 0.96 | (0.15 | ) | (0.23 | ) | (0.38 | ) | 15.29 | 6.57% | 5,022 | 0.99% | 0.99% | k | 0.96% | |||||||||||||||||||||||||||||||||||
| 12/31/13 | 11.12 | 0.15 | 3.60 | 3.75 | (0.16 | ) | - | (0.16 | ) | 14.71 | 33.73% | 2,574 | 0.98% | 0.93% | 1.14% | |||||||||||||||||||||||||||||||||||||
| 12/31/12 | 9.71 | 0.14 | 1.43 | 1.57 | (0.16 | ) | - | (0.16 | ) | 11.12 | 16.21% | 1,688 | 1.00% | 0.90% | 1.30% | |||||||||||||||||||||||||||||||||||||
| 12/31/11 | 10.12 | 0.12 | (0.43 | ) | (0.31 | ) | (0.10 | ) | - | (0.10 | ) | 9.71 | (3.02% | ) | 1,545 | 0.90% | 0.90% | k | 1.14% | |||||||||||||||||||||||||||||||||
Administrative Class |
| |||||||||||||||||||||||||||||||||||||||||||||||||||
| 09/30/16 | $ | 13.81 | $ | 0.13 | $ | 1.94 | $ | 2.07 | $ | (0.07 | ) | $ | (2.00 | ) | $ | (2.07 | ) | $ | 13.81 | 16.74% | $ | 656 | 1.24% | 1.10% | 0.97% | |||||||||||||||||||||||||||
| 09/30/15i | 15.40 | 0.06 | (1.49 | ) | (1.43 | ) | - | (0.16 | ) | (0.16 | ) | 13.81 | (9.36% | )b | 270 | 1.14% | a | 1.10% | a | 0.56% | a | |||||||||||||||||||||||||||||||
| 12/31/14 | 14.81 | 0.10 | 0.84 | 0.94 | (0.12 | ) | (0.23 | ) | (0.35 | ) | 15.40 | 6.39% | 1,147 | 1.10% | 1.10% | k | 0.69% | |||||||||||||||||||||||||||||||||||
| 12/31/13 | 11.19 | 0.13 | 3.62 | 3.75 | (0.13 | ) | - | (0.13 | ) | 14.81 | 33.57% | 4,260 | 1.13% | 1.08% | 1.01% | |||||||||||||||||||||||||||||||||||||
| 12/31/12 | 9.76 | 0.12 | 1.45 | 1.57 | (0.14 | ) | - | (0.14 | ) | 11.19 | 16.12% | 3,552 | 1.15% | 1.05% | 1.12% | |||||||||||||||||||||||||||||||||||||
| 12/31/11 | 10.10 | 0.07 | (0.41 | ) | (0.34 | ) | - | - | - | 9.76 | (3.37% | ) | 4,305 | 1.05% | 1.05% | k | 0.71% | |||||||||||||||||||||||||||||||||||
Class A |
| |||||||||||||||||||||||||||||||||||||||||||||||||||
| 09/30/16 | $ | 13.67 | $ | 0.08 | $ | 1.93 | $ | 2.01 | $ | (0.07 | ) | $ | (2.00 | ) | $ | (2.07 | ) | $ | 13.61 | 16.46% | $ | 1,755 | 1.49% | 1.35% | 0.62% | |||||||||||||||||||||||||||
| 09/30/15i | 15.27 | 0.04 | (1.48 | ) | (1.44 | ) | - | (0.16 | ) | (0.16 | ) | 13.67 | (9.51% | )b | 2,287 | 1.39% | a | 1.35% | a | 0.36% | a | |||||||||||||||||||||||||||||||
| 12/31/14 | 14.69 | 0.09 | 0.81 | 0.90 | (0.09 | ) | (0.23 | ) | (0.32 | ) | 15.27 | 6.18% | 5,759 | 1.35% | 1.35% | k | 0.58% | |||||||||||||||||||||||||||||||||||
| 12/31/13 | 11.11 | 0.10 | 3.58 | 3.68 | (0.10 | ) | - | (0.10 | ) | 14.69 | 33.18% | 6,092 | 1.38% | 1.33% | 0.73% | |||||||||||||||||||||||||||||||||||||
| 12/31/12 | 9.69 | 0.10 | 1.43 | 1.53 | (0.11 | ) | - | (0.11 | ) | 11.11 | 15.84% | 4,385 | 1.40% | 1.30% | 0.89% | |||||||||||||||||||||||||||||||||||||
| 12/31/11 | 10.08 | 0.06 | (0.40 | ) | (0.34 | ) | (0.05 | ) | - | (0.05 | ) | 9.69 | (3.39% | ) | 4,423 | 1.30% | 1.30% | k | 0.64% | |||||||||||||||||||||||||||||||||
Class R4 | ||||||||||||||||||||||||||||||||||||||||||||||||||||
| 09/30/16 | $ | 13.65 | $ | 0.10 | $ | 1.92 | $ | 2.02 | $ | (0.13 | ) | $ | (2.00 | ) | $ | (2.13 | ) | $ | 13.54 | 16.62% | $ | 94 | 1.39% | 1.25% | 0.75% | |||||||||||||||||||||||||||
| 09/30/15i | 15.24 | 0.06 | (1.49 | ) | (1.43 | ) | - | (0.16 | ) | (0.16 | ) | 13.65 | (9.46% | )b | 93 | 1.29% | a | 1.25% | a | 0.54% | a | |||||||||||||||||||||||||||||||
| 12/31/14h | 15.01 | 0.09 | 0.50 | 0.59 | (0.13 | ) | (0.23 | ) | (0.36 | ) | 15.24 | 3.98% | b | 104 | 1.25% | a | 1.25% | a,n | 0.79% | a | ||||||||||||||||||||||||||||||||
Class R3 |
| |||||||||||||||||||||||||||||||||||||||||||||||||||
| 09/30/16 | $ | 13.60 | $ | 0.07 | $ | 1.90 | $ | 1.97 | $ | (0.09 | ) | $ | (2.00 | ) | $ | (2.09 | ) | $ | 13.48 | 16.25% | $ | 102 | 1.64% | 1.50% | 0.52% | |||||||||||||||||||||||||||
| 09/30/15i | 15.21 | 0.03 | (1.48 | ) | (1.45 | ) | - | (0.16 | ) | (0.16 | ) | 13.60 | (9.61% | )b | 89 | 1.54% | a | 1.50% | a | 0.28% | a | |||||||||||||||||||||||||||||||
| 12/31/14 | 14.64 | 0.06 | 0.81 | 0.87 | (0.07 | ) | (0.23 | ) | (0.30 | ) | 15.21 | 5.99% | 106 | 1.53% | 1.53% | k | 0.42% | |||||||||||||||||||||||||||||||||||
| 12/31/13 | 11.07 | 0.06 | 3.57 | 3.63 | (0.06 | ) | - | (0.06 | ) | 14.64 | 32.77% | 95 | 1.68% | 1.63% | 0.43% | |||||||||||||||||||||||||||||||||||||
| 12/31/12 | 9.67 | 0.06 | 1.43 | 1.49 | (0.09 | ) | - | (0.09 | ) | 11.07 | 15.46% | 76 | 1.70% | 1.60% | 0.60% | |||||||||||||||||||||||||||||||||||||
| 12/31/11 | 10.07 | 0.04 | (0.41 | ) | (0.37 | ) | (0.03 | ) | - | (0.03 | ) | 9.67 | (3.67% | ) | 64 | 1.60% | 1.60% | k | 0.37% | |||||||||||||||||||||||||||||||||
| Year ended September 30, 2016 | Period ended September 30, 2015b | Year ended December 31 | ||||||||||||||||||||||
| 2014 | 2013 | 2012 | 2011 | |||||||||||||||||||||
Portfolio turnover rate | 96 | % | 105 | % | 112 | % | 109 | % | 85 | % | 82 | % | ||||||||||||
| a | Annualized. |
| b | Percentage represents the results for the period and is not annualized. |
| c | Per share amount calculated on the average shares method. |
| g | For the period December 7, 2011 (commencement of operations) through December 31, 2011. |
| h | For the period April 1, 2014 (commencement of operations) through December 31, 2014. |
| i | For the period January 1, 2015 through September 30, 2015. |
| j | Computed after giving effect to an agreement by MML Advisers and/or MassMutual to waive certain fees and expenses of the Fund. |
| k | Amount waived had no impact on the ratio of expenses to average daily net assets. |
| l | Employee retirement benefit plans that invest plan assets in the Separate Investment Accounts (SIAs) may be subject to certain charges as set forth in their respective Plan Documents. Total return figures would be lower for the periods presented if they reflected these charges. |
| m | Total return excludes sales charges, if any, and would be lower for the period presented if it reflected these charges. |
| n | Expenses incurred during the period fell under the expense cap. |
– 185 –
MASSMUTUAL SELECT SMALL CAP VALUE EQUITY FUND
| Income (loss) from investment operations | Less distributions to shareholders | Ratios / Supplemental Data | ||||||||||||||||||||||||||||||||||||||||||||||||||
| Net asset value, beginning of the period | Net investment income (loss)c,j | Net realized and unrealized gain (loss) on investments | Total income (loss) from investment operations | From net investment income | From net realized gains | Total distributions | Net asset value, end of the period | Total returnl,m | Net assets, end of the period (000’s) | Ratio of expenses to average daily net assets before expense waivers | Ratio of expenses to average daily net assets after expense waiversj | Net investment income (loss) to average daily net assets | ||||||||||||||||||||||||||||||||||||||||
Class I |
| |||||||||||||||||||||||||||||||||||||||||||||||||||
09/30/16 | $ | 14.62 | $ | 0.08 | $ | 2.08 | $ | 2.16 | $ | (0.09 | ) | $ | (0.50 | ) | $ | (0.59 | ) | $ | 16.19 | 15.20% | $ | 122,745 | 0.87% | 0.80% | 0.55% | |||||||||||||||||||||||||||
| 09/30/15i | 15.76 | 0.07 | (1.21 | ) | (1.14 | ) | (0.00 | )d | - | (0.00 | )d | 14.62 | (7.23% | )b | 65,868 | 0.87% | a | 0.80% | a | 0.62% | a | |||||||||||||||||||||||||||||||
| 12/31/14h | 15.09 | 0.09 | 0.69 | 0.78 | (0.11 | ) | - | (0.11 | ) | 15.76 | 5.19% | b | 60,528 | 0.83% | a | 0.80% | a | 0.80% | a | |||||||||||||||||||||||||||||||||
Class R5 |
| |||||||||||||||||||||||||||||||||||||||||||||||||||
| 09/30/16 | $ | 14.62 | $ | 0.06 | $ | 2.09 | $ | 2.15 | $ | (0.07 | ) | $ | (0.50 | ) | $ | (0.57 | ) | $ | 16.20 | 15.15% | $ | 49,774 | 0.97% | 0.90% | 0.43% | |||||||||||||||||||||||||||
| 09/30/15i | 15.77 | 0.06 | (1.21 | ) | (1.15 | ) | (0.00 | )d | - | (0.00 | )d | 14.62 | (7.29% | )b | 93,458 | 0.97% | a | 0.90% | a | 0.52% | a | |||||||||||||||||||||||||||||||
| 12/31/14 | 14.93 | 0.11 | 0.82 | 0.93 | (0.09 | ) | - | (0.09 | ) | 15.77 | 6.27% | 97,987 | 0.90% | 0.88% | 0.73% | |||||||||||||||||||||||||||||||||||||
| 12/31/13 | 10.71 | 0.06 | 4.23 | 4.29 | (0.07 | ) | - | (0.07 | ) | 14.93 | 40.05% | 138,272 | 0.85% | N/A | 0.50% | |||||||||||||||||||||||||||||||||||||
| 12/31/12 | 9.05 | 0.09 | 1.66 | 1.75 | (0.09 | ) | - | (0.09 | ) | 10.71 | 19.40% | 115,775 | 0.85% | N/A | 0.95% | |||||||||||||||||||||||||||||||||||||
| 12/31/11 | 9.45 | 0.03 | (0.40 | ) | (0.37 | ) | (0.03 | ) | - | (0.03 | ) | 9.05 | (3.91% | ) | 92,162 | 0.86% | N/A | 0.36% | ||||||||||||||||||||||||||||||||||
Service Class |
| |||||||||||||||||||||||||||||||||||||||||||||||||||
| 09/30/16 | $ | 14.66 | $ | 0.06 | $ | 2.07 | $ | 2.13 | $ | (0.07 | ) | $ | (0.50 | ) | $ | (0.57 | ) | $ | 16.22 | 14.97% | $ | 7,326 | 1.07% | 1.00% | 0.37% | |||||||||||||||||||||||||||
| 09/30/15i | 15.82 | 0.05 | (1.21 | ) | (1.16 | ) | (0.00 | )d | - | (0.00 | )d | 14.66 | (7.33% | )b | 3,272 | 1.07% | a | 1.00% | a | 0.46% | a | |||||||||||||||||||||||||||||||
| 12/31/14 | 14.93 | 0.10 | 0.83 | 0.93 | (0.04 | ) | - | (0.04 | ) | 15.82 | 6.21% | 1,472 | 1.00% | 0.98% | 0.66% | |||||||||||||||||||||||||||||||||||||
| 12/31/13 | 10.71 | 0.05 | 4.22 | 4.27 | (0.05 | ) | - | (0.05 | ) | 14.93 | 39.91% | 5,264 | 0.95% | N/A | 0.41% | |||||||||||||||||||||||||||||||||||||
| 12/31/12 | 9.06 | 0.08 | 1.65 | 1.73 | (0.08 | ) | - | (0.08 | ) | 10.71 | 19.15% | 3,186 | 0.95% | N/A | 0.83% | |||||||||||||||||||||||||||||||||||||
| 12/31/11 | 9.45 | 0.02 | (0.39 | ) | (0.37 | ) | (0.02 | ) | - | (0.02 | ) | 9.06 | (3.93% | ) | 3,055 | 0.96% | N/A | 0.22% | ||||||||||||||||||||||||||||||||||
Administrative Class |
| |||||||||||||||||||||||||||||||||||||||||||||||||||
| 09/30/16 | $ | 14.57 | $ | 0.03 | $ | 2.08 | $ | 2.11 | $ | (0.03 | ) | $ | (0.50 | ) | $ | (0.53 | ) | $ | 16.15 | 14.89% | $ | 4,908 | 1.17% | 1.10% | 0.22% | |||||||||||||||||||||||||||
| 09/30/15i | 15.74 | 0.04 | (1.21 | ) | (1.17 | ) | (0.00 | )d | - | (0.00 | )d | 14.57 | (7.43% | )b | 6,020 | 1.17% | a | 1.10% | a | 0.34% | a | |||||||||||||||||||||||||||||||
| 12/31/14 | 14.90 | 0.08 | 0.82 | 0.90 | (0.06 | ) | - | (0.06 | ) | 15.74 | 6.05% | 3,790 | 1.12% | 1.10% | 0.52% | |||||||||||||||||||||||||||||||||||||
| 12/31/13 | 10.69 | 0.03 | 4.22 | 4.25 | (0.04 | ) | - | (0.04 | ) | 14.90 | 39.73% | 4,359 | 1.10% | N/A | 0.27% | |||||||||||||||||||||||||||||||||||||
| 12/31/12 | 9.04 | 0.07 | 1.65 | 1.72 | (0.07 | ) | - | (0.07 | ) | 10.69 | 19.03% | 2,551 | 1.10% | N/A | 0.69% | |||||||||||||||||||||||||||||||||||||
| 12/31/11 | 9.45 | 0.00 | d | (0.41 | ) | (0.41 | ) | - | - | - | 9.04 | (4.34% | ) | 2,152 | 1.11% | N/A | 0.04% | |||||||||||||||||||||||||||||||||||
Class A |
| |||||||||||||||||||||||||||||||||||||||||||||||||||
| 09/30/16 | $ | 14.52 | $ | 0.00 | d | $ | 2.07 | $ | 2.07 | $ | (0.01 | ) | $ | (0.50 | ) | $ | (0.51 | ) | $ | 16.08 | 14.59% | $ | 8,850 | 1.42% | 1.35% | 0.00% | e | |||||||||||||||||||||||||
| 09/30/15i | 15.71 | 0.01 | (1.20 | ) | (1.19 | ) | (0.00 | )d | - | (0.00 | )d | 14.52 | (7.57% | )b | 6,458 | 1.42% | a | 1.35% | a | 0.07% | a | |||||||||||||||||||||||||||||||
| 12/31/14 | 14.87 | 0.04 | 0.82 | 0.86 | (0.02 | ) | - | (0.02 | ) | 15.71 | 5.82% | 6,467 | 1.37% | 1.35% | 0.26% | |||||||||||||||||||||||||||||||||||||
| 12/31/13 | 10.68 | (0.00 | )d | 4.19 | 4.19 | (0.00 | )d | - | (0.00 | ) | 14.87 | 39.28% | 6,526 | 1.35% | N/A | (0.01% | ) | |||||||||||||||||||||||||||||||||||
| 12/31/12 | 9.03 | 0.04 | 1.65 | 1.69 | (0.04 | ) | - | (0.04 | ) | 10.68 | 18.75% | 5,179 | 1.35% | N/A | 0.43% | |||||||||||||||||||||||||||||||||||||
| 12/31/11 | 9.44 | (0.02 | ) | (0.39 | ) | (0.41 | ) | - | - | - | 9.03 | (4.34% | ) | 4,694 | 1.36% | N/A | (0.18% | ) | ||||||||||||||||||||||||||||||||||
Class R4 |
| |||||||||||||||||||||||||||||||||||||||||||||||||||
| 09/30/16 | $ | 14.51 | $ | 0.02 | $ | 2.05 | $ | 2.07 | $ | (0.07 | ) | $ | (0.50 | ) | $ | (0.57 | ) | $ | 16.01 | 14.66% | $ | 1,748 | 1.32% | 1.25% | 0.12% | |||||||||||||||||||||||||||
| 09/30/15i | 15.69 | 0.02 | (1.20 | ) | (1.18 | ) | (0.00 | )d | - | (0.00 | )d | 14.51 | (7.51% | )b | 639 | 1.32% | a | 1.25% | a | 0.19% | a | |||||||||||||||||||||||||||||||
| 12/31/14h | 15.02 | 0.04 | 0.69 | 0.73 | (0.06 | ) | - | (0.06 | ) | 15.69 | 4.85% | b | 105 | 1.28% | a | 1.25% | a | 0.35% | a | |||||||||||||||||||||||||||||||||
Class R3 |
| |||||||||||||||||||||||||||||||||||||||||||||||||||
| 09/30/16 | $ | 14.48 | $ | (0.02 | ) | $ | 2.05 | $ | 2.03 | $ | (0.01 | ) | $ | (0.50 | ) | $ | (0.51 | ) | $ | 16.00 | 14.37% | $ | 440 | 1.57% | 1.50% | (0.12% | ) | |||||||||||||||||||||||||
| 09/30/15i | 15.69 | (0.01 | ) | (1.20 | ) | (1.21 | ) | (0.00 | )d | - | (0.00 | )d | 14.48 | (7.70% | )b | 123 | 1.57% | a | 1.50% | a | (0.07% | )a | ||||||||||||||||||||||||||||||
| 12/31/14h | 15.02 | 0.01 | 0.69 | 0.70 | (0.03 | ) | - | (0.03 | ) | 15.69 | 4.66% | b | 105 | 1.53% | a | 1.50% | a | 0.10% | a | |||||||||||||||||||||||||||||||||
| Year ended September 30, 2016 | Period ended September 30, 2015b | Year ended December 31 | ||||||||||||||||||||||
| 2014 | 2013 | 2012 | 2011 | |||||||||||||||||||||
Portfolio turnover rate | 26 | % | 18 | % | 22 | % | 28 | % | 32 | % | 25 | % | ||||||||||||
| a | Annualized. |
| b | Percentage represents the results for the period and is not annualized. |
| c | Per share amount calculated on the average shares method. |
| d | Amount is less than $0.005 per share. |
| e | Amount is less than 0.005%. |
| h | For the period April 1, 2014 (commencement of operations) through December 31, 2014. |
| i | For the period January 1, 2015 through September 30, 2015. |
| j | Computed after giving effect to an agreement by MML Advisers and/or MassMutual to waive certain fees and expenses of the Fund. |
| l | Employee retirement benefit plans that invest plan assets in the Separate Investment Accounts (SIAs) may be subject to certain charges as set forth in their respective Plan Documents. Total return figures would be lower for the periods presented if they reflected these charges. |
| m | Total return excludes sales charges, if any, and would be lower for the period presented if it reflected these charges. |
– 186 –
MASSMUTUAL SELECT SMALL COMPANY VALUE FUND
| Income (loss) from investment operations | Less distributions to shareholders | Ratios / Supplemental Data | ||||||||||||||||||||||||||||||||||||||||||||||||||
| Net asset value, beginning of the period | Net investment income (loss)c,j | Net realized and unrealized gain (loss) on investments | Total income (loss) from investment operations | From net investment income | From net realized gains | Total distributions | Net asset value, end of the period | Total returnl,m | Net assets, end of the period (000’s) | Ratio of expenses to average daily net assets before expense waivers | Ratio of expenses to average daily net assets after expense waiversj | Net investment income (loss) to average daily net assets | ||||||||||||||||||||||||||||||||||||||||
Class I |
| |||||||||||||||||||||||||||||||||||||||||||||||||||
| 09/30/16 | $ | 13.03 | $ | 0.10 | $ | 1.26 | $ | 1.36 | $ | (0.09 | ) | $ | (3.00 | ) | $ | (3.09 | ) | $ | 11.30 | 13.23% | $ | 125,482 | 0.94% | 0.92% | 0.96% | |||||||||||||||||||||||||||
| 09/30/15i | 14.38 | 0.04 | (1.18 | ) | (1.14 | ) | - | (0.21 | ) | (0.21 | ) | 13.03 | (7.99% | )b | 125,447 | 0.94% | a | 0.92% | a | 0.39% | a | |||||||||||||||||||||||||||||||
| 12/31/14 | 16.37 | 0.08 | 0.47 | 0.55 | (0.15 | ) | (2.39 | ) | (2.54 | ) | 14.38 | 4.10% | 132,465 | 0.91% | 0.89% | 0.50% | ||||||||||||||||||||||||||||||||||||
| 12/31/13 | 14.03 | 0.16 | 4.29 | 4.45 | (0.14 | ) | (1.97 | ) | (2.11 | ) | 16.37 | 32.46% | 126,064 | 0.94% | 0.86% | 0.97% | ||||||||||||||||||||||||||||||||||||
| 12/31/12 | 12.78 | 0.16 | 1.75 | 1.91 | (0.20 | ) | (0.46 | ) | (0.66 | ) | 14.03 | 15.04% | 74,820 | 0.94% | 0.86% | 1.17% | ||||||||||||||||||||||||||||||||||||
| 12/31/11 | 13.72 | 0.09 | (0.43 | ) | (0.34 | ) | (0.07 | ) | (0.53 | ) | (0.60 | ) | 12.78 | (2.34% | ) | 45,116 | 0.94% | 0.86% | 0.68% | |||||||||||||||||||||||||||||||||
Class R5 |
| |||||||||||||||||||||||||||||||||||||||||||||||||||
| 09/30/16 | $ | 13.06 | $ | 0.09 | $ | 1.27 | $ | 1.36 | $ | (0.07 | ) | $ | (3.00 | ) | $ | (3.07 | ) | $ | 11.35 | 13.18% | $ | 106,993 | 1.04% | 1.02% | 0.85% | |||||||||||||||||||||||||||
| 09/30/15i | 14.43 | 0.03 | (1.19 | ) | (1.16 | ) | - | (0.21 | ) | (0.21 | ) | 13.06 | (8.11% | )b | 128,043 | 1.04% | a | 1.02% | a | 0.27% | a | |||||||||||||||||||||||||||||||
| 12/31/14 | 16.41 | 0.06 | 0.47 | 0.53 | (0.12 | ) | (2.39 | ) | (2.51 | ) | 14.43 | 4.01% | 207,540 | 1.03% | 1.01% | 0.38% | ||||||||||||||||||||||||||||||||||||
| 12/31/13 | 14.06 | 0.12 | 4.31 | 4.43 | (0.11 | ) | (1.97 | ) | (2.08 | ) | 16.41 | 32.19% | 252,704 | 1.13% | �� | 1.05% | 0.77% | |||||||||||||||||||||||||||||||||||
| 12/31/12 | 12.81 | 0.13 | 1.75 | 1.88 | (0.17 | ) | (0.46 | ) | (0.63 | ) | 14.06 | 14.77% | 231,211 | 1.13% | 1.05% | 0.96% | ||||||||||||||||||||||||||||||||||||
| 12/31/11 | 13.74 | 0.03 | (0.40 | ) | (0.37 | ) | (0.03 | ) | (0.53 | ) | (0.56 | ) | 12.81 | (2.51% | ) | 229,298 | 1.13% | 1.05% | 0.22% | |||||||||||||||||||||||||||||||||
Service Class |
| |||||||||||||||||||||||||||||||||||||||||||||||||||
| 09/30/16 | $ | 13.00 | $ | 0.08 | $ | 1.26 | $ | 1.34 | $ | (0.05 | ) | $ | (3.00 | ) | $ | (3.05 | ) | $ | 11.29 | 13.05% | $ | 15,783 | 1.14% | 1.12% | 0.77% | |||||||||||||||||||||||||||
| 09/30/15i | 14.38 | 0.02 | (1.19 | ) | (1.17 | ) | - | (0.21 | ) | (0.21 | ) | 13.00 | (8.20% | )b | 16,672 | 1.14% | a | 1.12% | a | 0.17% | a | |||||||||||||||||||||||||||||||
| 12/31/14 | 16.36 | 0.05 | 0.47 | 0.52 | (0.11 | ) | (2.39 | ) | (2.50 | ) | 14.38 | 3.92% | 37,270 | 1.12% | 1.09% | 0.30% | ||||||||||||||||||||||||||||||||||||
| 12/31/13 | 14.02 | 0.12 | 4.29 | 4.41 | (0.10 | ) | (1.97 | ) | (2.07 | ) | 16.36 | 32.18% | 44,234 | 1.17% | 1.09% | 0.73% | ||||||||||||||||||||||||||||||||||||
| 12/31/12 | 12.76 | 0.12 | 1.75 | 1.87 | (0.15 | ) | (0.46 | ) | (0.61 | ) | 14.02 | 14.76% | 33,617 | 1.17% | 1.09% | 0.85% | ||||||||||||||||||||||||||||||||||||
| 12/31/11 | 13.70 | 0.02 | (0.40 | ) | (0.38 | ) | (0.03 | ) | (0.53 | ) | (0.56 | ) | 12.76 | (2.65% | ) | 52,720 | 1.17% | 1.09% | 0.18% | |||||||||||||||||||||||||||||||||
Administrative Class |
| |||||||||||||||||||||||||||||||||||||||||||||||||||
| 09/30/16 | $ | 12.85 | $ | 0.07 | $ | 1.24 | $ | 1.31 | $ | (0.04 | ) | $ | (3.00 | ) | $ | (3.04 | ) | $ | 11.12 | 12.95% | $ | 16,447 | 1.24% | 1.22% | 0.66% | |||||||||||||||||||||||||||
| 09/30/15i | 14.22 | 0.01 | (1.17 | ) | (1.16 | ) | - | (0.21 | ) | (0.21 | ) | 12.85 | (8.23% | )b | 18,220 | 1.24% | a | 1.22% | a | 0.08% | a | |||||||||||||||||||||||||||||||
| 12/31/14 | 16.21 | 0.03 | 0.46 | 0.49 | (0.09 | ) | (2.39 | ) | (2.48 | ) | 14.22 | 3.74% | 24,796 | 1.23% | 1.21% | 0.16% | ||||||||||||||||||||||||||||||||||||
| 12/31/13 | 13.90 | 0.09 | 4.26 | 4.35 | (0.07 | ) | (1.97 | ) | (2.04 | ) | 16.21 | 32.03% | 36,198 | 1.32% | 1.24% | 0.59% | ||||||||||||||||||||||||||||||||||||
| 12/31/12 | 12.67 | 0.10 | 1.74 | 1.84 | (0.15 | ) | (0.46 | ) | (0.61 | ) | 13.90 | 14.57% | 36,619 | 1.32% | 1.24% | 0.77% | ||||||||||||||||||||||||||||||||||||
| 12/31/11 | 13.60 | 0.00 | d | (0.40 | ) | (0.40 | ) | (0.00 | )d | (0.53 | ) | (0.53 | ) | 12.67 | (2.79% | ) | 35,901 | 1.32% | 1.24% | 0.02% | ||||||||||||||||||||||||||||||||
Class A |
| |||||||||||||||||||||||||||||||||||||||||||||||||||
| 09/30/16 | $ | 12.56 | $ | 0.04 | $ | 1.20 | $ | 1.24 | $ | (0.00 | )d | $ | (3.00 | ) | $ | (3.00 | ) | $ | 10.80 | 12.59% | $ | 26,790 | 1.49% | 1.47% | 0.40% | |||||||||||||||||||||||||||
| 09/30/15i | 13.93 | (0.02 | ) | (1.14 | ) | (1.16 | ) | - | (0.21 | ) | (0.21 | ) | 12.56 | (8.40% | )b | 30,820 | 1.49% | a | 1.47% | a | (0.17% | )a | ||||||||||||||||||||||||||||||
| 12/31/14 | 15.92 | (0.01 | ) | 0.45 | 0.44 | (0.04 | ) | (2.39 | ) | (2.43 | ) | 13.93 | 3.51% | 43,390 | 1.48% | 1.46% | (0.08% | ) | ||||||||||||||||||||||||||||||||||
| 12/31/13 | 13.66 | 0.06 | 4.17 | 4.23 | (0.00 | )d | (1.97 | ) | (1.97 | ) | 15.92 | 31.69% | 59,004 | 1.57% | 1.49% | 0.37% | ||||||||||||||||||||||||||||||||||||
| 12/31/12 | 12.46 | 0.07 | 1.70 | 1.77 | (0.11 | ) | (0.46 | ) | (0.57 | ) | 13.66 | 14.28% | 100,321 | 1.57% | 1.49% | 0.51% | ||||||||||||||||||||||||||||||||||||
| 12/31/11 | 13.41 | (0.03 | ) | (0.39 | ) | (0.42 | ) | - | (0.53 | ) | (0.53 | ) | 12.46 | (2.99% | ) | 100,184 | 1.57% | 1.49% | (0.21% | ) | ||||||||||||||||||||||||||||||||
Class R4 |
| |||||||||||||||||||||||||||||||||||||||||||||||||||
| 09/30/16 | $ | 12.52 | $ | 0.05 | $ | 1.21 | $ | 1.26 | $ | (0.04 | ) | $ | (3.00 | ) | $ | (3.04 | ) | $ | 10.74 | 12.80% | $ | 184 | 1.39% | 1.37% | 0.51% | |||||||||||||||||||||||||||
| 09/30/15i | 13.88 | (0.01 | ) | (1.14 | ) | (1.15 | ) | - | (0.21 | ) | (0.21 | ) | 12.52 | (8.36% | )b | 92 | 1.39% | a | 1.37% | a | (0.06% | )a | ||||||||||||||||||||||||||||||
| 12/31/14h | 16.27 | (0.01 | ) | 0.11 | 0.10 | (0.10 | ) | (2.39 | ) | (2.49 | ) | 13.88 | 1.34% | b | 101 | 1.35% | a | N/A | (0.05% | )a | ||||||||||||||||||||||||||||||||
Class R3 |
| |||||||||||||||||||||||||||||||||||||||||||||||||||
| 09/30/16 | $ | 12.03 | $ | 0.03 | $ | 1.13 | $ | 1.16 | $ | - | $ | (3.00 | ) | $ | (3.00 | ) | $ | 10.19 | 12.42% | $ | 84 | 1.64% | 1.62% | 0.28% | ||||||||||||||||||||||||||||
| 09/30/15i | 13.36 | (0.03 | ) | (1.09 | ) | (1.12 | ) | - | (0.21 | ) | (0.21 | ) | 12.03 | (8.46% | )b | 57 | 1.64% | a | 1.62% | a | (0.33% | )a | ||||||||||||||||||||||||||||||
| 12/31/14 | 15.37 | (0.04 | ) | 0.44 | 0.40 | (0.02 | ) | (2.39 | ) | (2.41 | ) | 13.36 | 3.34% | 80 | 1.67% | 1.65% | (0.27% | ) | ||||||||||||||||||||||||||||||||||
| 12/31/13 | 13.28 | 0.01 | 4.05 | 4.06 | (0.00 | )d | (1.97 | ) | (1.97 | ) | 15.37 | 31.30% | 194 | 1.87% | 1.79% | 0.03% | ||||||||||||||||||||||||||||||||||||
| 12/31/12 | 12.07 | 0.00 | d | 1.67 | 1.67 | - | (0.46 | ) | (0.46 | ) | 13.28 | 13.90% | 145 | 1.87% | 1.79% | 0.03% | ||||||||||||||||||||||||||||||||||||
| 12/31/11 | 13.05 | (0.07 | ) | (0.38 | ) | (0.45 | ) | - | (0.53 | ) | (0.53 | ) | 12.07 | (3.30% | ) | 675 | 1.87% | 1.79% | (0.51% | ) | ||||||||||||||||||||||||||||||||
| Year ended September 30, 2016 | Period ended September 30, 2015b | Year ended December 31 | ||||||||||||||||||||||
| 2014 | 2013 | 2012 | 2011 | |||||||||||||||||||||
Portfolio turnover rate | 60 | % | 86 | % | 38 | % | 44 | % | 34 | % | 32 | % | ||||||||||||
| a | Annualized. |
| b | Percentage represents the results for the period and is not annualized. |
| c | Per share amount calculated on the average shares method. |
| d | Amount is less than $0.005 per share. |
| h | For the period April 1, 2014 (commencement of operations) through December 31, 2014. |
| i | For the period January 1, 2015 through September 30, 2015. |
| j | Computed after giving effect to an agreement by MML Advisers and/or MassMutual to waive certain fees and expenses of the Fund. |
| l | Employee retirement benefit plans that invest plan assets in the Separate Investment Accounts (SIAs) may be subject to certain charges as set forth in their respective Plan Documents. Total return figures would be lower for the periods presented if they reflected these charges. |
| m | Total return excludes sales charges, if any, and would be lower for the period presented if it reflected these charges. |
– 187 –
MM S&P MID CAP INDEX FUND
| Income (loss) from investment operations | Less distributions to shareholders | Ratios / Supplemental Data | ||||||||||||||||||||||||||||||||||||||||||||||||||
| Net asset value, beginning of the period | Net investment income (loss)c,j | Net realized and unrealized gain (loss) on investments | Total income (loss) from investment operations | From net investment income | From net realized gains | Total distributions | Net asset value, end of the period | Total returnl,m | Net assets, end of the period (000’s) | Ratio of expenses to average daily net assets before expense waivers | Ratio of expenses to average daily net assets after expense waiversj | Net investment income (loss) to average daily net assets | ||||||||||||||||||||||||||||||||||||||||
Class I | ||||||||||||||||||||||||||||||||||||||||||||||||||||
| 09/30/16 | $ | 12.44 | $ | 0.19 | $ | 1.61 | $ | 1.80 | $ | (0.16 | ) | $ | (0.52 | ) | $ | (0.68 | ) | $ | 13.56 | 15.15% | $ | 73,807 | 0.20% | 0.20% | n | 1.49% | ||||||||||||||||||||||||||
| 09/30/15i | 13.11 | 0.13 | (0.75 | ) | (0.62 | ) | - | (0.05 | ) | (0.05 | ) | 12.44 | (4.77% | )b | 137,654 | 0.22% | a | 0.20% | a | 1.26% | a | |||||||||||||||||||||||||||||||
| 12/31/14 | 12.47 | 0.17 | 1.00 | 1.17 | (0.15 | ) | (0.38 | ) | (0.53 | ) | 13.11 | 9.55% | 144,235 | 0.20% | 0.19% | 1.35% | ||||||||||||||||||||||||||||||||||||
| 12/31/13 | 11.04 | 0.16 | 3.44 | 3.60 | (0.18 | ) | (1.99 | ) | (2.17 | ) | 12.47 | 33.20% | 93,319 | 0.23% | 0.19% | 1.25% | ||||||||||||||||||||||||||||||||||||
| 12/31/12g | 10.00 | 0.09 | 1.11 | 1.20 | (0.08 | ) | (0.08 | ) | (0.16 | ) | 11.04 | 12.06% | b | 87,245 | 0.29% | a | 0.19% | a | 1.85% | a | ||||||||||||||||||||||||||||||||
Class R5 | ||||||||||||||||||||||||||||||||||||||||||||||||||||
| 09/30/16 | $ | 12.41 | $ | 0.18 | $ | 1.60 | $ | 1.78 | $ | (0.15 | ) | $ | (0.52 | ) | $ | (0.67 | ) | $ | 13.52 | 15.01% | $ | 21,499 | 0.30% | 0.30% | n | 1.44% | ||||||||||||||||||||||||||
| 09/30/15i | 13.09 | 0.12 | (0.75 | ) | (0.63 | ) | - | (0.05 | ) | (0.05 | ) | 12.41 | (4.86% | )b | 11,433 | 0.32% | a | 0.30% | a | 1.18% | a | |||||||||||||||||||||||||||||||
| 12/31/14 | 12.46 | 0.15 | 0.99 | 1.14 | (0.13 | ) | (0.38 | ) | (0.51 | ) | 13.09 | 9.38% | 5,628 | 0.30% | 0.29% | 1.20% | ||||||||||||||||||||||||||||||||||||
| 12/31/13 | 11.04 | 0.16 | 3.42 | 3.58 | (0.17 | ) | (1.99 | ) | (2.16 | ) | 12.46 | 33.08% | 5,893 | 0.33% | 0.29% | 1.22% | ||||||||||||||||||||||||||||||||||||
| 12/31/12g | 10.00 | 0.08 | 1.12 | 1.20 | (0.08 | ) | (0.08 | ) | (0.16 | ) | 11.04 | 12.02% | b | 112 | 0.39% | a | 0.29% | a | 1.74% | a | ||||||||||||||||||||||||||||||||
Service Class |
| |||||||||||||||||||||||||||||||||||||||||||||||||||
| 09/30/16 | $ | 12.36 | $ | 0.16 | $ | 1.59 | $ | 1.75 | $ | (0.13 | ) | $ | (0.52 | ) | $ | (0.65 | ) | $ | 13.46 | 14.77% | $ | 23,328 | 0.45% | 0.45% | n | 1.26% | ||||||||||||||||||||||||||
| 09/30/15i | 13.05 | 0.10 | (0.74 | ) | (0.64 | ) | - | (0.05 | ) | (0.05 | ) | 12.36 | (4.95% | )b | 16,533 | 0.47% | a | 0.45% | a | 1.02% | a | |||||||||||||||||||||||||||||||
| 12/31/14 | 12.43 | 0.15 | 0.98 | 1.13 | (0.13 | ) | (0.38 | ) | (0.51 | ) | 13.05 | 9.31% | 12,480 | 0.45% | 0.44% | 1.16% | ||||||||||||||||||||||||||||||||||||
| 12/31/13 | 11.04 | 0.14 | 3.41 | 3.55 | (0.17 | ) | (1.99 | ) | (2.16 | ) | 12.43 | 32.81% | 3,206 | 0.48% | 0.44% | 1.07% | ||||||||||||||||||||||||||||||||||||
| 12/31/12g | 10.00 | 0.08 | 1.12 | 1.20 | (0.08 | ) | (0.08 | ) | (0.16 | ) | 11.04 | 12.01% | b | 225 | 0.54% | a | 0.44% | a | 1.79% | a | ||||||||||||||||||||||||||||||||
Administrative Class |
| |||||||||||||||||||||||||||||||||||||||||||||||||||
| 09/30/16 | $ | 12.35 | $ | 0.15 | $ | 1.59 | $ | 1.74 | $ | (0.12 | ) | $ | (0.52 | ) | $ | (0.64 | ) | $ | 13.45 | 14.69% | $ | 62,951 | 0.55% | 0.55% | n | 1.17% | ||||||||||||||||||||||||||
| 09/30/15i | 13.05 | 0.09 | (0.74 | ) | (0.65 | ) | - | (0.05 | ) | (0.05 | ) | 12.35 | (5.03% | )b | 50,069 | 0.57% | a | 0.55% | a | 0.92% | a | |||||||||||||||||||||||||||||||
| 12/31/14 | 12.43 | 0.13 | 0.98 | 1.11 | (0.11 | ) | (0.38 | ) | (0.49 | ) | 13.05 | 9.15% | 42,628 | 0.55% | 0.54% | 1.02% | ||||||||||||||||||||||||||||||||||||
| 12/31/13 | 11.03 | 0.13 | 3.41 | 3.54 | (0.15 | ) | (1.99 | ) | (2.14 | ) | 12.43 | 32.72% | 12,453 | 0.58% | 0.54% | 0.96% | ||||||||||||||||||||||||||||||||||||
| 12/31/12g | 10.00 | 0.09 | 1.10 | 1.19 | (0.08 | ) | (0.08 | ) | (0.16 | ) | 11.03 | 11.92% | b | 836 | 0.64% | a | 0.54% | a | 2.01% | a | ||||||||||||||||||||||||||||||||
Class A | ||||||||||||||||||||||||||||||||||||||||||||||||||||
| 09/30/16 | $ | 12.32 | $ | 0.11 | $ | 1.61 | $ | 1.72 | $ | (0.10 | ) | $ | (0.52 | ) | $ | (0.62 | ) | $ | 13.42 | 14.49% | $ | 42,316 | 0.80% | 0.80% | n | 0.91% | ||||||||||||||||||||||||||
| 09/30/15i | 13.04 | 0.07 | (0.74 | ) | (0.67 | ) | - | (0.05 | ) | (0.05 | ) | 12.32 | (5.18% | )b | 32,378 | 0.82% | a | 0.80% | a | 0.67% | a | |||||||||||||||||||||||||||||||
| 12/31/14 | 12.43 | 0.10 | 0.97 | 1.07 | (0.08 | ) | (0.38 | ) | (0.46 | ) | 13.04 | 8.83% | 28,715 | 0.81% | 0.80% | 0.76% | ||||||||||||||||||||||||||||||||||||
| 12/31/13 | 11.04 | 0.09 | 3.42 | 3.51 | (0.13 | ) | (1.99 | ) | (2.12 | ) | 12.43 | 32.40% | 8,961 | 0.88% | 0.84% | 0.68% | ||||||||||||||||||||||||||||||||||||
| 12/31/12g | 10.00 | 0.06 | 1.11 | 1.17 | (0.05 | ) | (0.08 | ) | (0.13 | ) | 11.04 | 11.76% | b | 112 | 0.94% | a | 0.84% | a | 1.19% | a | ||||||||||||||||||||||||||||||||
Class R4 | ||||||||||||||||||||||||||||||||||||||||||||||||||||
| 09/30/16 | $ | 12.32 | $ | 0.13 | $ | 1.59 | $ | 1.72 | $ | (0.13 | ) | $ | (0.52 | ) | $ | (0.65 | ) | $ | 13.39 | 14.56% | $ | 36,917 | 0.70% | 0.70% | n | 1.04% | ||||||||||||||||||||||||||
| 09/30/15i | 13.04 | 0.09 | (0.76 | ) | (0.67 | ) | - | (0.05 | ) | (0.05 | ) | 12.32 | (5.18% | )b | 14,014 | 0.72% | a | 0.70% | a | 0.86% | a | |||||||||||||||||||||||||||||||
| 12/31/14h | 12.77 | 0.09 | 0.66 | 0.75 | (0.10 | ) | (0.38 | ) | (0.48 | ) | 13.04 | 6.04% | b | 132 | 0.69% | a | 0.69% | a,n | 0.89% | a | ||||||||||||||||||||||||||||||||
Class R3 | ||||||||||||||||||||||||||||||||||||||||||||||||||||
| 09/30/16 | $ | 12.31 | $ | 0.10 | $ | 1.58 | $ | 1.68 | $ | (0.12 | ) | $ | (0.52 | ) | $ | (0.64 | ) | $ | 13.35 | 14.25% | $ | 33,905 | 0.95% | 0.95% | n | 0.81% | ||||||||||||||||||||||||||
| 09/30/15i | 13.04 | 0.06 | (0.74 | ) | (0.68 | ) | - | (0.05 | ) | (0.05 | ) | 12.31 | (5.26% | )b | 8,746 | 0.97% | a | 0.95% | a | 0.61% | a | |||||||||||||||||||||||||||||||
| 12/31/14h | 12.77 | 0.06 | 0.66 | 0.72 | (0.07 | ) | (0.38 | ) | (0.45 | ) | 13.04 | 5.84% | b | 142 | 0.95% | a | 0.95% | a,n | 0.60% | a | ||||||||||||||||||||||||||||||||
| Year ended September 30, 2016 | Period ended September 30, 2015b | Year ended December 31 | ||||||||||||||||||
| 2014 | 2013 | 2012 | ||||||||||||||||||
Portfolio turnover rate | 48 | % | 18 | % | 12 | % | 54 | % | 11 | %b | ||||||||||
| a | Annualized. |
| b | Percentage represents the results for the period and is not annualized. |
| c | Per share amount calculated on the average shares method. |
| g | For the period July 26, 2012 (commencement of operations) through December 31, 2012. |
| h | For the period April 1, 2014 (commencement of operations) through December 31, 2014. |
| i | For the period January 1, 2015 through September 30, 2015. |
| j | Computed after giving effect to an agreement by MML Advisers and/or MassMutual to waive certain fees and expenses of the Fund. |
| l | Employee retirement benefit plans that invest plan assets in the Separate Investment Accounts (SIAs) may be subject to certain charges as set forth in their respective Plan Documents. Total return figures would be lower for the periods presented if they reflected these charges. |
| m | Total return excludes sales charges, if any, and would be lower for the period presented if it reflected these charges. |
| n | Expenses incurred during the period fell under the expense cap. |
– 188 –
MM RUSSELL 2000 SMALL CAP INDEX FUND
| Income (loss) from investment operations | Less distributions to shareholders | Ratios / Supplemental Data | ||||||||||||||||||||||||||||||||||||||||||||||||||
| Net asset value, beginning of the period | Net investment income (loss)c,j | Net realized and unrealized gain (loss) on investments | Total income (loss) from investment operations | From net investment income | From net realized gains | Total distributions | Net asset value, end of the period | Total returnl,m | Net assets, end of the period (000’s) | Ratio of expenses to average daily net assets before expense waivers | Ratio of expenses to average daily net assets after expense waiversj | Net investment income (loss) to average daily net assets | ||||||||||||||||||||||||||||||||||||||||
Class I | ||||||||||||||||||||||||||||||||||||||||||||||||||||
| 09/30/16 | $ | 11.28 | $ | 0.17 | $ | 1.54 | $ | 1.71 | $ | (0.14 | ) | $ | (0.28 | ) | $ | (0.42 | ) | $ | 12.57 | 15.62% | $ | 127,660 | 0.21% | 0.20% | 1.48% | |||||||||||||||||||||||||||
| 09/30/15i | 12.24 | 0.13 | (1.08 | ) | (0.95 | ) | - | (0.01 | ) | (0.01 | ) | 11.28 | (7.79% | )b | 185,516 | 0.29% | a | 0.20% | a | 1.40% | a | |||||||||||||||||||||||||||||||
| 12/31/14 | 13.20 | 0.17 | 0.40 | 0.57 | (0.16 | ) | (1.37 | ) | (1.53 | ) | 12.24 | 4.94% | 97,737 | 0.27% | 0.20% | 1.33% | ||||||||||||||||||||||||||||||||||||
| 12/31/13 | 10.95 | 0.18 | 3.95 | 4.13 | (0.19 | ) | (1.69 | ) | (1.88 | ) | 13.20 | 38.47% | 91,466 | 0.29% | 0.19% | 1.40% | ||||||||||||||||||||||||||||||||||||
| 12/31/12g | 10.00 | 0.13 | 0.99 | 1.12 | (0.12 | ) | (0.05 | ) | (0.17 | ) | 10.95 | 11.24% | b | 86,679 | 0.30% | a | 0.19% | a | 2.88% | a | ||||||||||||||||||||||||||||||||
Class R5 | ||||||||||||||||||||||||||||||||||||||||||||||||||||
| 09/30/16 | $ | 11.28 | $ | 0.16 | $ | 1.53 | $ | 1.69 | $ | (0.13 | ) | $ | (0.28 | ) | $ | (0.41 | ) | $ | 12.56 | 15.42% | $ | 15,287 | 0.31% | 0.30% | 1.40% | |||||||||||||||||||||||||||
| 09/30/15i | 12.24 | 0.12 | (1.07 | ) | (0.95 | ) | - | (0.01 | ) | (0.01 | ) | 11.28 | (7.79% | )b | 7,948 | 0.39% | a | 0.30% | a | 1.27% | a | |||||||||||||||||||||||||||||||
| 12/31/14 | 13.19 | 0.15 | 0.40 | 0.55 | (0.13 | ) | (1.37 | ) | (1.50 | ) | 12.24 | 4.80% | 4,343 | 0.38% | 0.30% | 1.16% | ||||||||||||||||||||||||||||||||||||
| 12/31/13 | 10.95 | 0.19 | 3.93 | 4.12 | (0.19 | ) | (1.69 | ) | (1.88 | ) | 13.19 | 38.38% | 13,078 | 0.39% | 0.29% | 1.41% | ||||||||||||||||||||||||||||||||||||
| 12/31/12g | 10.00 | 0.13 | 0.98 | 1.11 | (0.11 | ) | (0.05 | ) | (0.16 | ) | 10.95 | 11.19% | b | 111 | 0.40% | a | 0.29% | a | 2.76% | a | ||||||||||||||||||||||||||||||||
Service Class |
| |||||||||||||||||||||||||||||||||||||||||||||||||||
| 09/30/16 | $ | 11.21 | $ | 0.14 | $ | 1.52 | $ | 1.66 | $ | (0.11 | ) | $ | (0.28 | ) | $ | (0.39 | ) | $ | 12.48 | 15.23% | $ | 13,347 | 0.46% | 0.45% | 1.22% | |||||||||||||||||||||||||||
| 09/30/15i | 12.17 | 0.10 | (1.05 | ) | (0.95 | ) | - | (0.01 | ) | (0.01 | ) | 11.21 | (7.84% | )b | 8,110 | 0.54% | a | 0.45% | a | 1.09% | a | |||||||||||||||||||||||||||||||
| 12/31/14 | 13.16 | 0.15 | 0.37 | 0.52 | (0.14 | ) | (1.37 | ) | (1.51 | ) | 12.17 | 4.55% | 6,499 | 0.52% | 0.45% | 1.14% | ||||||||||||||||||||||||||||||||||||
| 12/31/13 | 10.94 | 0.18 | 3.92 | 4.10 | (0.19 | ) | (1.69 | ) | (1.88 | ) | 13.16 | 38.24% | 997 | 0.54% | 0.44% | 1.31% | ||||||||||||||||||||||||||||||||||||
| 12/31/12g | 10.00 | 0.13 | 0.97 | 1.10 | (0.11 | ) | (0.05 | ) | (0.16 | ) | 10.94 | 11.03% | b | 129 | 0.55% | a | 0.44% | a | 2.73% | a | ||||||||||||||||||||||||||||||||
Administrative Class |
| |||||||||||||||||||||||||||||||||||||||||||||||||||
| 09/30/16 | $ | 11.23 | $ | 0.13 | $ | 1.52 | $ | 1.65 | $ | (0.10 | ) | $ | (0.28 | ) | $ | (0.38 | ) | $ | 12.50 | 15.11% | $ | 44,061 | 0.56% | 0.55% | 1.14% | |||||||||||||||||||||||||||
| 09/30/15i | 12.20 | 0.09 | (1.05 | ) | (0.96 | ) | - | (0.01 | ) | (0.01 | ) | 11.23 | (7.90% | )b | 30,993 | 0.64% | a | 0.55% | a | 1.00% | a | |||||||||||||||||||||||||||||||
| 12/31/14 | 13.18 | 0.13 | 0.39 | 0.52 | (0.13 | ) | (1.37 | ) | (1.50 | ) | 12.20 | 4.52% | 25,705 | 0.62% | 0.55% | 1.02% | ||||||||||||||||||||||||||||||||||||
| 12/31/13 | 10.94 | 0.15 | 3.94 | 4.09 | (0.16 | ) | (1.69 | ) | (1.85 | ) | 13.18 | 38.13% | 7,562 | 0.64% | 0.54% | 1.14% | ||||||||||||||||||||||||||||||||||||
| 12/31/12g | 10.00 | 0.12 | 0.97 | 1.09 | (0.10 | ) | (0.05 | ) | (0.15 | ) | 10.94 | 10.99% | b | 127 | 0.65% | a | 0.54% | a | 2.60% | a | ||||||||||||||||||||||||||||||||
Class A | ||||||||||||||||||||||||||||||||||||||||||||||||||||
| 09/30/16 | $ | 11.16 | $ | 0.10 | $ | 1.52 | $ | 1.62 | $ | (0.07 | ) | $ | (0.28 | ) | $ | (0.35 | ) | $ | 12.43 | 14.91% | $ | 19,806 | 0.81% | 0.80% | 0.89% | |||||||||||||||||||||||||||
| 09/30/15i | 12.16 | 0.07 | (1.06 | ) | (0.99 | ) | - | (0.01 | ) | (0.01 | ) | 11.16 | (8.18% | )b | 14,478 | 0.89% | a | 0.80% | a | 0.73% | a | |||||||||||||||||||||||||||||||
| 12/31/14 | 13.15 | 0.10 | 0.38 | 0.48 | (0.10 | ) | (1.37 | ) | (1.47 | ) | 12.16 | 4.24% | 15,338 | 0.88% | 0.81% | 0.76% | ||||||||||||||||||||||||||||||||||||
| 12/31/13 | 10.95 | 0.11 | 3.92 | 4.03 | (0.14 | ) | (1.69 | ) | (1.83 | ) | 13.15 | 37.66% | 5,547 | 0.94% | 0.84% | 0.82% | ||||||||||||||||||||||||||||||||||||
| 12/31/12g | 10.00 | 0.10 | 0.99 | 1.09 | (0.09 | ) | (0.05 | ) | (0.14 | ) | 10.95 | 10.83% | b | 111 | 0.95% | a | 0.84% | a | 2.21% | a | ||||||||||||||||||||||||||||||||
Class R4 | ||||||||||||||||||||||||||||||||||||||||||||||||||||
| 09/30/16 | $ | 11.17 | $ | 0.11 | $ | 1.51 | $ | 1.62 | $ | (0.11 | ) | $ | (0.28 | ) | $ | (0.39 | ) | $ | 12.40 | 14.93% | $ | 29,129 | 0.71% | 0.70% | 1.00% | |||||||||||||||||||||||||||
| 09/30/15i | 12.16 | 0.09 | (1.07 | ) | (0.98 | ) | - | (0.01 | ) | (0.01 | ) | 11.17 | (8.09% | )b | 9,367 | 0.79% | a | 0.70% | a | 0.96% | a | |||||||||||||||||||||||||||||||
| 12/31/14h | 13.27 | 0.08 | 0.30 | 0.38 | (0.12 | ) | (1.37 | ) | (1.49 | ) | 12.16 | 3.42% | b | 151 | 0.76% | a | 0.70% | a | 0.88% | a | ||||||||||||||||||||||||||||||||
Class R3 | ||||||||||||||||||||||||||||||||||||||||||||||||||||
| 09/30/16 | $ | 11.16 | $ | 0.09 | $ | 1.49 | $ | 1.58 | $ | (0.10 | ) | $ | (0.28 | ) | $ | (0.38 | ) | $ | 12.36 | 14.60% | $ | 22,081 | 0.96% | 0.95% | 0.75% | |||||||||||||||||||||||||||
| 09/30/15i | 12.16 | 0.07 | (1.06 | ) | (0.99 | ) | - | (0.01 | ) | (0.01 | ) | 11.16 | (8.18% | )b | 5,873 | 1.04% | a | 0.95% | a | 0.71% | a | |||||||||||||||||||||||||||||||
| 12/31/14h | 13.27 | 0.06 | 0.29 | 0.35 | (0.09 | ) | (1.37 | ) | (1.46 | ) | 12.16 | 3.20% | b | 138 | 1.01% | a | 0.95% | a | 0.61% | a | ||||||||||||||||||||||||||||||||
| Year ended September 30, 2016 | Period ended September 30, 2015b | Year ended December 31 | ||||||||||||||||||
| 2014 | 2013 | 2012 | ||||||||||||||||||
Portfolio turnover rate | 37 | % | 13 | % | 33 | % | 59 | % | 10 | %b | ||||||||||
| a | Annualized. |
| b | Percentage represents the results for the period and is not annualized. |
| c | Per share amount calculated on the average shares method. |
| g | For the period July 26, 2012 (commencement of operations) through December 31, 2012. |
| h | For the period April 1, 2014 (commencement of operations) through December 31, 2014. |
| i | For the period January 1, 2015 through September 30, 2015. |
| j | Computed after giving effect to an agreement by MML Advisers and/or MassMutual to waive certain fees and expenses of the Fund. |
| l | Employee retirement benefit plans that invest plan assets in the Separate Investment Accounts (SIAs) may be subject to certain charges as set forth in their respective Plan Documents. Total return figures would be lower for the periods presented if they reflected these charges. |
| m | Total return excludes sales charges, if any, and would be lower for the period presented if it reflected these charges. |
– 189 –
MASSMUTUAL SELECT MID CAP GROWTH EQUITY II FUND
| Income (loss) from investment operations | Less distributions to shareholders | Ratios / Supplemental Data | ||||||||||||||||||||||||||||||||||||||||||||||||||
| Net asset value, beginning of the period | Net investment income (loss)c,j | Net realized and unrealized gain (loss) on investments | Total income (loss) from investment operations | From net investment income | From net realized gains | Total distributions | Net asset value, end of the period | Total returnl,m | Net assets, end of the period (000’s) | Ratio of expenses to average daily net assets before expense waivers | Ratio of expenses to average daily net assets after expense waiversj | Net investment income (loss) to average daily net assets | ||||||||||||||||||||||||||||||||||||||||
Class I |
| |||||||||||||||||||||||||||||||||||||||||||||||||||
| 09/30/16 | $ | 18.74 | $ | 0.01 | $ | 1.91 | $ | 1.92 | $ | - | $ | (1.50 | ) | $ | (1.50 | ) | $ | 19.16 | 10.74% | $ | 1,668,899 | 0.73% | N/A | 0.07% | ||||||||||||||||||||||||||||
| 09/30/15i | 18.65 | (0.01 | ) | 0.24 | 0.23 | - | (0.14 | ) | (0.14 | ) | 18.74 | 1.22% | b | 816,703 | 0.75% | a | N/A | (0.08% | )a | |||||||||||||||||||||||||||||||||
| 12/31/14 | 18.42 | (0.02 | ) | 2.33 | 2.31 | - | (2.08 | ) | (2.08 | ) | 18.65 | 13.00% | 441,065 | 0.77% | 0.74% | (0.11% | ) | |||||||||||||||||||||||||||||||||||
| 12/31/13 | 15.03 | (0.02 | ) | 5.40 | 5.38 | - | (1.99 | ) | (1.99 | ) | 18.42 | 36.31% | 298,869 | 0.83% | 0.73% | (0.10% | ) | |||||||||||||||||||||||||||||||||||
| 12/31/12 | 14.27 | 0.02 | 2.07 | 2.09 | (0.03 | ) | (1.30 | ) | (1.33 | ) | 15.03 | 14.71% | 185,584 | 0.83% | 0.73% | 0.12% | ||||||||||||||||||||||||||||||||||||
| 12/31/11 | 15.76 | (0.03 | ) | (0.29 | ) | (0.32 | ) | - | (1.17 | ) | (1.17 | ) | 14.27 | (1.74% | ) | 150,571 | 0.84% | 0.74% | (0.20% | ) | ||||||||||||||||||||||||||||||||
Class R5 |
| |||||||||||||||||||||||||||||||||||||||||||||||||||
| 09/30/16 | $ | 18.63 | $ | (0.00 | )d | $ | 1.88 | $ | 1.88 | $ | - | $ | (1.50 | ) | $ | (1.50 | ) | $ | 19.01 | 10.58% | $ | 826,289 | 0.83% | N/A | (0.03% | ) | ||||||||||||||||||||||||||
| 09/30/15i | 18.56 | (0.03 | ) | 0.24 | 0.21 | - | (0.14 | ) | (0.14 | ) | 18.63 | 1.12% | b | 641,170 | 0.85% | a | N/A | (0.18% | )a | |||||||||||||||||||||||||||||||||
| 12/31/14 | 18.36 | (0.04 | ) | 2.32 | 2.28 | - | (2.08 | ) | (2.08 | ) | 18.56 | 12.88% | 668,005 | 0.87% | 0.85% | (0.22% | ) | |||||||||||||||||||||||||||||||||||
| 12/31/13 | 15.00 | (0.04 | ) | 5.39 | 5.35 | - | (1.99 | ) | (1.99 | ) | 18.36 | 36.19% | 569,238 | 0.96% | 0.86% | (0.22% | ) | |||||||||||||||||||||||||||||||||||
| 12/31/12 | 14.25 | (0.01 | ) | 2.07 | 2.06 | (0.01 | ) | (1.30 | ) | (1.31 | ) | 15.00 | 14.51% | 456,600 | 0.96% | 0.86% | (0.04% | ) | ||||||||||||||||||||||||||||||||||
| 12/31/11 | 15.76 | (0.06 | ) | (0.28 | ) | (0.34 | ) | - | (1.17 | ) | (1.17 | ) | 14.25 | (1.86% | ) | 442,760 | 0.96% | 0.86% | (0.38% | ) | ||||||||||||||||||||||||||||||||
Service Class |
| |||||||||||||||||||||||||||||||||||||||||||||||||||
| 09/30/16 | $ | 18.30 | $ | (0.02 | ) | $ | 1.86 | $ | 1.84 | $ | - | $ | (1.50 | ) | $ | (1.50 | ) | $ | 18.64 | 10.55% | $ | 234,465 | 0.93% | N/A | (0.13% | ) | ||||||||||||||||||||||||||
| 09/30/15i | 18.25 | (0.04 | ) | 0.23 | 0.19 | - | (0.14 | ) | (0.14 | ) | 18.30 | 1.03% | b | 238,436 | 0.95% | a | N/A | (0.28% | )a | |||||||||||||||||||||||||||||||||
| 12/31/14 | 18.10 | (0.06 | ) | 2.29 | 2.23 | - | (2.08 | ) | (2.08 | ) | 18.25 | 12.79% | 243,292 | 0.97% | 0.95% | (0.31% | ) | |||||||||||||||||||||||||||||||||||
| 12/31/13 | 14.83 | (0.06 | ) | 5.32 | 5.26 | - | (1.99 | ) | (1.99 | ) | 18.10 | 35.99% | 267,615 | 1.05% | 0.95% | (0.32% | ) | |||||||||||||||||||||||||||||||||||
| 12/31/12 | 14.10 | (0.02 | ) | 2.05 | 2.03 | - | (1.30 | ) | (1.30 | ) | 14.83 | 14.47% | 207,290 | 1.05% | 0.95% | (0.11% | ) | |||||||||||||||||||||||||||||||||||
| 12/31/11 | 15.63 | (0.07 | ) | (0.29 | ) | (0.36 | ) | - | (1.17 | ) | (1.17 | ) | 14.10 | (2.01% | ) | 182,810 | 1.05% | 0.95% | (0.47% | ) | ||||||||||||||||||||||||||||||||
Administrative Class |
| |||||||||||||||||||||||||||||||||||||||||||||||||||
| 09/30/16 | $ | 17.71 | $ | (0.04 | ) | $ | 1.79 | $ | 1.75 | $ | - | $ | (1.50 | ) | $ | (1.50 | ) | $ | 17.96 | 10.38% | $ | 340,187 | 1.03% | N/A | (0.23% | ) | ||||||||||||||||||||||||||
| 09/30/15i | 17.68 | (0.05 | ) | 0.22 | 0.17 | - | (0.14 | ) | (0.14 | ) | 17.71 | 0.95% | b | 364,801 | 1.05% | a | N/A | (0.38% | )a | |||||||||||||||||||||||||||||||||
| 12/31/14 | 17.61 | (0.08 | ) | 2.23 | 2.15 | - | (2.08 | ) | (2.08 | ) | 17.68 | 12.70% | 364,385 | 1.09% | 1.06% | (0.43% | ) | |||||||||||||||||||||||||||||||||||
| 12/31/13 | 14.49 | (0.08 | ) | 5.19 | 5.11 | - | (1.99 | ) | (1.99 | ) | 17.61 | 35.80% | 382,576 | 1.20% | 1.10% | (0.47% | ) | |||||||||||||||||||||||||||||||||||
| 12/31/12 | 13.82 | (0.04 | ) | 2.01 | 1.97 | - | (1.30 | ) | (1.30 | ) | 14.49 | 14.33% | 320,612 | 1.20% | 1.10% | (0.28% | ) | |||||||||||||||||||||||||||||||||||
| 12/31/11 | 15.37 | (0.10 | ) | (0.28 | ) | (0.38 | ) | - | (1.17 | ) | (1.17 | ) | 13.82 | (2.18% | ) | 328,331 | 1.20% | 1.10% | (0.63% | ) | ||||||||||||||||||||||||||||||||
Class A |
| |||||||||||||||||||||||||||||||||||||||||||||||||||
| 09/30/16 | $ | 16.75 | $ | (0.08 | ) | $ | 1.69 | $ | 1.61 | $ | - | $ | (1.50 | ) | $ | (1.50 | ) | $ | 16.86 | 10.12% | $ | 297,498 | 1.28% | N/A | (0.48% | ) | ||||||||||||||||||||||||||
| 09/30/15i | 16.76 | (0.08 | ) | 0.21 | 0.13 | - | (0.14 | ) | (0.14 | ) | 16.75 | 0.76% | b | 306,259 | 1.30% | a | N/A | (0.63% | )a | |||||||||||||||||||||||||||||||||
| 12/31/14 | 16.84 | (0.12 | ) | 2.12 | 2.00 | - | (2.08 | ) | (2.08 | ) | 16.76 | 12.38% | 322,121 | 1.34% | 1.31% | (0.68% | ) | |||||||||||||||||||||||||||||||||||
| 12/31/13 | 13.96 | (0.12 | ) | 4.99 | 4.87 | - | (1.99 | ) | (1.99 | ) | 16.84 | 35.44% | 333,489 | 1.44% | 1.34% | (0.72% | ) | |||||||||||||||||||||||||||||||||||
| 12/31/12 | 13.39 | (0.08 | ) | 1.95 | 1.87 | - | (1.30 | ) | (1.30 | ) | 13.96 | 14.05% | 347,186 | 1.45% | 1.35% | (0.52% | ) | |||||||||||||||||||||||||||||||||||
| 12/31/11 | 14.96 | (0.13 | ) | (0.27 | ) | (0.40 | ) | - | (1.17 | ) | (1.17 | ) | 13.39 | (2.37% | ) | 329,974 | 1.45% | 1.35% | (0.87% | ) | ||||||||||||||||||||||||||||||||
Class R4 |
| |||||||||||||||||||||||||||||||||||||||||||||||||||
| 09/30/16 | $ | 16.79 | $ | (0.06 | ) | $ | 1.69 | $ | 1.63 | $ | - | $ | (1.50 | ) | $ | (1.50 | ) | $ | 16.92 | 10.22% | $ | 54,177 | 1.18% | N/A | (0.39% | ) | ||||||||||||||||||||||||||
| 09/30/15i | 16.78 | (0.07 | ) | 0.22 | 0.15 | - | (0.14 | ) | (0.14 | ) | 16.79 | 0.88% | b | 11,441 | 1.20% | a | N/A | (0.53% | )a | |||||||||||||||||||||||||||||||||
| 12/31/14h | 17.37 | (0.07 | ) | 1.56 | 1.49 | - | (2.08 | ) | (2.08 | ) | 16.78 | 9.07% | b | 2,860 | 1.20% | a | N/A | (0.50% | )a | |||||||||||||||||||||||||||||||||
Class R3 |
| |||||||||||||||||||||||||||||||||||||||||||||||||||
| 09/30/16 | $ | 15.81 | $ | (0.10 | ) | $ | 1.59 | $ | 1.49 | $ | - | $ | (1.50 | ) | $ | (1.50 | ) | $ | 15.80 | 9.95% | $ | 14,056 | 1.43% | N/A | (0.63% | ) | ||||||||||||||||||||||||||
| 09/30/15i | 15.84 | (0.10 | ) | 0.21 | 0.11 | - | (0.14 | ) | (0.14 | ) | 15.81 | 0.68% | b | 4,788 | 1.45% | a | N/A | (0.78% | )a | |||||||||||||||||||||||||||||||||
| 12/31/14 | 16.05 | (0.14 | ) | 2.01 | 1.87 | - | (2.08 | ) | (2.08 | ) | 15.84 | 12.18% | 2,445 | 1.51% | 1.49% | (0.86% | ) | |||||||||||||||||||||||||||||||||||
| 12/31/13 | 13.42 | (0.16 | ) | 4.78 | 4.62 | - | (1.99 | ) | (1.99 | ) | 16.05 | 35.00% | 2,062 | 1.75% | 1.65% | (1.02% | ) | |||||||||||||||||||||||||||||||||||
| 12/31/12 | 12.95 | (0.12 | ) | 1.89 | 1.77 | - | (1.30 | ) | (1.30 | ) | 13.42 | 13.75% | 1,969 | 1.75% | 1.65% | (0.84% | ) | |||||||||||||||||||||||||||||||||||
| 12/31/11 | 14.56 | (0.17 | ) | (0.27 | ) | (0.44 | ) | - | (1.17 | ) | (1.17 | ) | 12.95 | (2.71% | ) | 2,052 | 1.75% | 1.65% | (1.18% | ) | ||||||||||||||||||||||||||||||||
| Year ended September 30, 2016 | Period ended September 30, 2015b | Year ended December 31 | ||||||||||||||||||||||
| 2014 | 2013 | 2012 | 2011 | |||||||||||||||||||||
Portfolio turnover rate | 36 | % | 31 | % | 33 | % | 32 | % | 36 | % | 38 | % | ||||||||||||
| a | Annualized. |
| b | Percentage represents the results for the period and is not annualized. |
| c | Per share amount calculated on the average shares method. |
| d | Amount is less than $.0005 per share. |
| h | For the period April 1, 2014 (commencement of operations) through December 31, 2014. |
| i | For the period January 1, 2015 through September 30, 2015. |
| j | Computed after giving effect to an agreement by MML Advisers and/or MassMutual to waive certain fees and expenses of the Fund. |
| l | Employee retirement benefit plans that invest plan assets in the Separate Investment Accounts (SIAs) may be subject to certain charges as set forth in their respective Plan Documents. Total return figures would be lower for the periods presented if they reflected these charges. |
| m | Total return excludes sales charges, if any, and would be lower for the period presented if it reflected these charges. |
– 190 –
MASSMUTUAL SELECT SMALL CAP GROWTH EQUITY FUND
| Income (loss) from investment operations | Less distributions to shareholders | Ratios / Supplemental Data | ||||||||||||||||||||||||||||||||||||||||||||||||||
| Net asset value, beginning of the period | Net investment income (loss)c,j | Net realized and unrealized gain (loss) on investments | Total income (loss) from investment operations | From net realized gains | Tax return of capital | Total distributions | Net asset value, end of the period | Total returnl,m | Net assets, end of the period (000’s) | Ratio of expenses to average daily net assets before expense waivers | Ratio of expenses to average daily net assets after expense waiversj | Net investment income (loss) to average daily net assets | ||||||||||||||||||||||||||||||||||||||||
Class I |
| |||||||||||||||||||||||||||||||||||||||||||||||||||
| 09/30/16 | $ | 15.17 | $ | (0.00 | )d | $ | 1.05 | $ | 1.05 | $ | (3.17 | ) | $ | (0.00 | )d | $ | (3.17 | ) | $ | 13.05 | 8.25% | $ | 276,267 | 0.87% | N/A | (0.03% | ) | |||||||||||||||||||||||||
| 09/30/15i | 16.37 | (0.01 | ) | (0.95 | ) | (0.96 | ) | (0.24 | ) | - | (0.24 | ) | 15.17 | (5.92% | )b | 237,215 | 0.85% | a | N/A | (0.08% | )a | |||||||||||||||||||||||||||||||
| 12/31/14 | 19.02 | (0.03 | ) | 1.03 | 1.00 | (3.65 | ) | - | (3.65 | ) | 16.37 | 6.16% | 523,725 | 0.85% | 0.84% | (0.19% | ) | |||||||||||||||||||||||||||||||||||
| 12/31/13 | 15.16 | (0.04 | ) | 7.14 | 7.10 | (3.24 | ) | - | (3.24 | ) | 19.02 | 47.86% | 237,249 | 0.92% | 0.85% | (0.23% | ) | |||||||||||||||||||||||||||||||||||
| 12/31/12 | 14.16 | (0.02 | ) | 1.92 | 1.90 | (0.90 | ) | - | (0.90 | ) | 15.16 | 13.53% | 136,266 | 0.92% | 0.86% | (0.12% | ) | |||||||||||||||||||||||||||||||||||
| 12/31/11 | 17.26 | (0.06 | ) | (0.96 | ) | (1.02 | ) | (2.08 | ) | - | (2.08 | ) | 14.16 | (5.41% | ) | 119,706 | 0.92% | 0.87% | (0.36% | ) | ||||||||||||||||||||||||||||||||
Class R5 |
| |||||||||||||||||||||||||||||||||||||||||||||||||||
| 09/30/16 | $ | 15.07 | $ | (0.02 | ) | $ | 1.05 | $ | 1.03 | $ | (3.17 | ) | $ | (0.00 | )d | $ | (3.17 | ) | $ | 12.93 | 8.16% | $ | 119,577 | 0.97% | N/A | (0.15% | ) | |||||||||||||||||||||||||
| 09/30/15i | 16.28 | (0.02 | ) | (0.95 | ) | (0.97 | ) | (0.24 | ) | - | (0.24 | ) | 15.07 | (6.07% | )b | 168,987 | 0.95% | a | N/A | (0.18% | )a | |||||||||||||||||||||||||||||||
| 12/31/14 | 18.94 | (0.06 | ) | 1.05 | 0.99 | (3.65 | ) | - | (3.65 | ) | 16.28 | 6.14% | 212,669 | 0.97% | 0.94% | (0.30% | ) | |||||||||||||||||||||||||||||||||||
| 12/31/13 | 15.12 | (0.06 | ) | 7.12 | 7.06 | (3.24 | ) | - | (3.24 | ) | 18.94 | 47.71% | 574,359 | 1.02% | 0.95% | (0.31% | ) | |||||||||||||||||||||||||||||||||||
| 12/31/12 | 14.14 | (0.03 | ) | 1.91 | 1.88 | (0.90 | ) | - | (0.90 | ) | 15.12 | 13.41% | 455,747 | 1.02% | 0.96% | (0.22% | ) | |||||||||||||||||||||||||||||||||||
| 12/31/11 | 17.25 | (0.09 | ) | (0.94 | ) | (1.03 | ) | (2.08 | ) | - | (2.08 | ) | 14.14 | (5.47% | ) | 429,979 | 1.02% | 0.97% | (0.53% | ) | ||||||||||||||||||||||||||||||||
Service Class |
| |||||||||||||||||||||||||||||||||||||||||||||||||||
| 09/30/16 | $ | 14.53 | $ | (0.03 | ) | $ | 1.00 | $ | 0.97 | $ | (3.17 | ) | $ | (0.00 | )d | $ | (3.17 | ) | $ | 12.33 | 8.02% | $ | 36,718 | 1.07% | N/A | (0.23% | ) | |||||||||||||||||||||||||
| 09/30/15i | 15.71 | (0.03 | ) | (0.91 | ) | (0.94 | ) | (0.24 | ) | - | (0.24 | ) | 14.53 | (6.10% | )b | 36,194 | 1.05% | a | N/A | (0.28% | )a | |||||||||||||||||||||||||||||||
| 12/31/14 | 18.43 | (0.07 | ) | 1.00 | 0.93 | (3.65 | ) | - | (3.65 | ) | 15.71 | 5.98% | 39,757 | 1.08% | 1.05% | (0.41% | ) | |||||||||||||||||||||||||||||||||||
| 12/31/13 | 14.80 | (0.08 | ) | 6.95 | 6.87 | (3.24 | ) | - | (3.24 | ) | 18.43 | 47.46% | 77,163 | 1.16% | 1.09% | (0.46% | ) | |||||||||||||||||||||||||||||||||||
| 12/31/12 | 13.87 | (0.06 | ) | 1.89 | 1.83 | (0.90 | ) | - | (0.90 | ) | 14.80 | 13.31% | 58,290 | 1.16% | 1.10% | (0.39% | ) | |||||||||||||||||||||||||||||||||||
| 12/31/11 | 17.00 | (0.12 | ) | (0.93 | ) | (1.05 | ) | (2.08 | ) | - | (2.08 | ) | 13.87 | (5.68% | ) | 64,304 | 1.16% | 1.11% | (0.68% | ) | ||||||||||||||||||||||||||||||||
Administrative Class |
| |||||||||||||||||||||||||||||||||||||||||||||||||||
| 09/30/16 | $ | 13.95 | $ | (0.04 | ) | $ | 0.95 | $ | 0.91 | $ | (3.17 | ) | $ | (0.00 | )d | $ | (3.17 | ) | $ | 11.69 | 7.92% | $ | 29,335 | 1.17% | N/A | (0.34% | ) | |||||||||||||||||||||||||
| 09/30/15i | 15.10 | (0.04 | ) | (0.87 | ) | (0.91 | ) | (0.24 | ) | - | (0.24 | ) | 13.95 | (6.15% | )b | 33,350 | 1.15% | a | N/A | (0.38% | )a | |||||||||||||||||||||||||||||||
| 12/31/14 | 17.87 | (0.09 | ) | 0.97 | 0.88 | (3.65 | ) | - | (3.65 | ) | 15.10 | 5.88% | 30,069 | 1.18% | 1.16% | (0.52% | ) | |||||||||||||||||||||||||||||||||||
| 12/31/13 | 14.44 | (0.10 | ) | 6.77 | 6.67 | (3.24 | ) | - | (3.24 | ) | 17.87 | 47.25% | 42,628 | 1.31% | 1.24% | (0.60% | ) | |||||||||||||||||||||||||||||||||||
| 12/31/12 | 13.58 | (0.08 | ) | 1.84 | 1.76 | (0.90 | ) | - | (0.90 | ) | 14.44 | 13.08% | 50,085 | 1.31% | 1.25% | (0.53% | ) | |||||||||||||||||||||||||||||||||||
| 12/31/11 | 16.71 | (0.14 | ) | (0.91 | ) | (1.05 | ) | (2.08 | ) | - | (2.08 | ) | 13.58 | (5.77% | ) | 50,193 | 1.31% | 1.26% | (0.83% | ) | ||||||||||||||||||||||||||||||||
Class A |
| |||||||||||||||||||||||||||||||||||||||||||||||||||
| 09/30/16 | $ | 12.97 | $ | (0.06 | ) | $ | 0.87 | $ | 0.81 | $ | (3.17 | ) | $ | (0.00 | )d | $ | (3.17 | ) | $ | 10.61 | 7.70% | $ | 40,045 | 1.42% | N/A | (0.59% | ) | |||||||||||||||||||||||||
| 09/30/15i | 14.09 | (0.07 | ) | (0.81 | ) | (0.88 | ) | (0.24 | ) | - | (0.24 | ) | 12.97 | (6.31% | )b | 46,014 | 1.40% | a | N/A | (0.63% | )a | |||||||||||||||||||||||||||||||
| 12/31/14 | 16.96 | (0.13 | ) | 0.91 | 0.78 | (3.65 | ) | - | (3.65 | ) | 14.09 | 5.60% | 56,296 | 1.43% | 1.41% | (0.77% | ) | |||||||||||||||||||||||||||||||||||
| 12/31/13 | 13.85 | (0.14 | ) | 6.49 | 6.35 | (3.24 | ) | - | (3.24 | ) | 16.96 | 46.94% | 71,667 | 1.56% | 1.49% | (0.86% | ) | |||||||||||||||||||||||||||||||||||
| 12/31/12 | 13.09 | (0.13 | ) | 1.79 | 1.66 | (0.90 | ) | - | (0.90 | ) | 13.85 | 12.80% | 60,764 | 1.56% | 1.50% | (0.89% | ) | |||||||||||||||||||||||||||||||||||
| 12/31/11 | 16.23 | (0.18 | ) | (0.88 | ) | (1.06 | ) | (2.08 | ) | - | (2.08 | ) | 13.09 | (6.01% | ) | 70,773 | 1.56% | 1.51% | (1.12% | ) | ||||||||||||||||||||||||||||||||
Class R4 |
| |||||||||||||||||||||||||||||||||||||||||||||||||||
| 09/30/16 | $ | 13.00 | $ | (0.05 | ) | $ | 0.87 | $ | 0.82 | $ | (3.17 | ) | $ | (0.00 | )d | $ | (3.17 | ) | $ | 10.65 | 7.78% | $ | 1,781 | 1.32% | N/A | (0.45% | ) | |||||||||||||||||||||||||
| 09/30/15i | 14.10 | (0.06 | ) | (0.80 | ) | (0.86 | ) | (0.24 | ) | - | (0.24 | ) | 13.00 | (6.23% | )b | 438 | 1.30% | a | N/A | (0.54% | )a | |||||||||||||||||||||||||||||||
| 12/31/14h | 17.12 | (0.08 | ) | 0.71 | 0.63 | (3.65 | ) | - | (3.65 | ) | 14.10 | 4.67% | b | 105 | 1.29% | a | N/A | (0.62% | )a | |||||||||||||||||||||||||||||||||
Class R3 |
| |||||||||||||||||||||||||||||||||||||||||||||||||||
| 09/30/16 | $ | 12.02 | $ | (0.06 | ) | $ | 0.78 | $ | 0.72 | $ | (3.17 | ) | $ | (0.00 | )d | $ | (3.17 | ) | $ | 9.57 | 7.52% | $ | 1,254 | 1.57% | N/A | (0.69% | ) | |||||||||||||||||||||||||
| 09/30/15i | 13.09 | (0.08 | ) | (0.75 | ) | (0.83 | ) | (0.24 | ) | - | (0.24 | ) | 12.02 | (6.41% | )b | 315 | 1.55% | a | N/A | (0.80% | )a | |||||||||||||||||||||||||||||||
| 12/31/14 | 16.04 | (0.16 | ) | 0.86 | 0.70 | (3.65 | ) | - | (3.65 | ) | 13.09 | 5.35% | 104 | 1.66% | 1.63% | (1.02% | ) | |||||||||||||||||||||||||||||||||||
| 12/31/13 | 13.27 | (0.19 | ) | 6.20 | 6.01 | (3.24 | ) | - | (3.24 | ) | 16.04 | 46.43% | 571 | 1.86% | 1.79% | (1.16% | ) | |||||||||||||||||||||||||||||||||||
| 12/31/12 | 12.61 | (0.14 | ) | 1.70 | 1.56 | (0.90 | ) | - | (0.90 | ) | 13.27 | 12.49% | 479 | 1.86% | 1.80% | (1.04% | ) | |||||||||||||||||||||||||||||||||||
| 12/31/11 | 15.77 | (0.21 | ) | (0.87 | ) | (1.08 | ) | (2.08 | ) | - | (2.08 | ) | 12.61 | (6.32% | ) | 426 | 1.86% | 1.81% | (1.37% | ) | ||||||||||||||||||||||||||||||||
| Year ended September 30, 2016 | Period ended September 30, 2015b | Year ended December 31 | ||||||||||||||||||||||
| 2014 | 2013 | 2012 | 2011 | |||||||||||||||||||||
Portfolio turnover rate | 85 | % | 82 | % | 76 | % | 97 | % | 104 | % | 88 | % | ||||||||||||
| a | Annualized. |
| b | Percentage represents the results for the period and is not annualized. |
| c | Per share amount calculated on the average shares method. |
| d | Amount is less than $0.005 per share. |
| h | For the period April 1, 2014 (commencement of operations) through December 31, 2014. |
| i | For the period January 1, 2015 through September 30, 2015. |
| j | Computed after giving effect to an agreement by MML Advisers and/or MassMutual to waive certain fees and expenses of the Fund. |
| l | Employee retirement benefit plans that invest plan assets in the Separate Investment Accounts (SIAs) may be subject to certain charges as set forth in their respective Plan Documents. Total return figures would be lower for the periods presented if they reflected these charges. |
| m | Total return excludes sales charges, if any, and would be lower for the period presented if it reflected these charges. |
– 191 –
MASSMUTUAL SELECT DIVERSIFIED INTERNATIONAL FUND
| Income (loss) from investment operations | Less distributions to shareholders | Ratios / Supplemental Data | ||||||||||||||||||||||||||||||||||||||||||||||||||
| Net asset value, beginning of the period | Net investment income (loss)c,j | Net realized and unrealized gain (loss) on investments | Total income (loss) from investment operations | From net investment income | Tax return of capital | Total distributions | Net asset value, end of the period | Total returnl,m | Net assets, end of the period (000)‘s | Ratio of expenses to average daily net assets before expense waivers | Ratio of expenses to average daily net assets after expense waiversj | Net investment income (loss) to average daily net assets | ||||||||||||||||||||||||||||||||||||||||
Class I | ||||||||||||||||||||||||||||||||||||||||||||||||||||
| 09/30/16 | $ | 6.35 | $ | 0.15 | $ | (0.08 | ) | $ | 0.07 | $ | (0.01 | ) | $ | - | $ | (0.01 | ) | $ | 6.41 | 1.07% | $ | 39,038 | 1.20% | 0.90% | 2.38% | |||||||||||||||||||||||||||
| 09/30/15i | 6.67 | 0.11 | (0.43 | ) | (0.32 | ) | - | - | - | 6.35 | (4.80% | )b | 65,202 | 1.19% | a | 0.90% | a | 2.14% | a | |||||||||||||||||||||||||||||||||
| 12/31/14h | 7.55 | 0.12 | (0.74 | ) | (0.62 | ) | (0.26 | ) | - | (0.26 | ) | 6.67 | (8.12% | )b | 60,663 | 0.96% | a | 0.90% | a | 2.14% | a | |||||||||||||||||||||||||||||||
Class R5 | ||||||||||||||||||||||||||||||||||||||||||||||||||||
| 09/30/16 | $ | 6.34 | $ | 0.17 | $ | (1.51 | ) | $ | (1.34 | ) | $ | - | $ | - | $ | - | $ | 5.00 | (21.14% | ) | $ | 0 | f | 1.31% | 1.00% | 2.63% | ||||||||||||||||||||||||||
| 09/30/15i | 6.68 | 0.00 | d | (0.34 | ) | (0.34 | ) | - | - | - | 6.34 | (4.94% | )b | 12 | 1.29% | a | 1.00% | a | (0.09% | )a | ||||||||||||||||||||||||||||||||
| 12/31/14 | 7.72 | 0.30 | (1.09 | ) | (0.79 | ) | (0.25 | ) | - | (0.25 | ) | 6.68 | (10.10% | ) | 110,644 | 1.06% | 1.00% | 4.06% | ||||||||||||||||||||||||||||||||||
| 12/31/13 | 6.49 | 0.15 | 1.26 | 1.41 | (0.18 | ) | (0.00 | )d | (0.18 | ) | 7.72 | 21.84% | 162,746 | 1.06% | 0.99% | 2.14% | ||||||||||||||||||||||||||||||||||||
| 12/31/12 | 5.70 | 0.17 | 0.81 | 0.98 | (0.19 | ) | - | (0.19 | ) | 6.49 | 17.29% | 151,060 | 1.07% | 0.99% | 2.86% | |||||||||||||||||||||||||||||||||||||
| 12/31/11 | 7.08 | 0.15 | (1.35 | ) | (1.20 | ) | (0.18 | ) | - | (0.18 | ) | 5.70 | (16.84% | ) | 121,002 | 1.09% | 0.99% | 2.24% | ||||||||||||||||||||||||||||||||||
Service Class |
| |||||||||||||||||||||||||||||||||||||||||||||||||||
| 09/30/16 | $ | 6.51 | $ | 0.15 | $ | (0.10 | ) | $ | 0.05 | $ | - | $ | - | $ | - | $ | 6.56 | 0.77% | $ | 160 | 1.40% | 1.10% | 2.27% | |||||||||||||||||||||||||||||
| 09/30/15i | 6.84 | 0.10 | (0.43 | ) | (0.33 | ) | - | - | - | 6.51 | (4.82% | )b | 142 | 1.39% | a | 1.10% | a | 1.92% | a | |||||||||||||||||||||||||||||||||
| 12/31/14 | 7.91 | 0.22 | (1.04 | ) | (0.82 | ) | (0.25 | ) | - | (0.25 | ) | 6.84 | (10.30% | ) | 146 | 1.16% | 1.10% | 2.89% | ||||||||||||||||||||||||||||||||||
| 12/31/13 | 6.65 | 0.14 | 1.29 | 1.43 | (0.17 | ) | (0.00 | )d | (0.17 | ) | 7.91 | 21.66% | 97 | 1.16% | 1.09% | 1.92% | ||||||||||||||||||||||||||||||||||||
| 12/31/12 | 5.84 | 0.17 | 0.83 | 1.00 | (0.19 | ) | - | (0.19 | ) | 6.65 | 17.12% | 74 | 1.17% | 1.09% | 2.75% | |||||||||||||||||||||||||||||||||||||
| 12/31/11 | 7.06 | 0.19 | (1.40 | ) | (1.21 | ) | (0.01 | ) | - | (0.01 | ) | 5.84 | (17.11% | ) | 55 | 1.19% | 1.09% | 2.69% | ||||||||||||||||||||||||||||||||||
Administrative Class |
| |||||||||||||||||||||||||||||||||||||||||||||||||||
| 09/30/16 | $ | 6.59 | $ | 0.14 | $ | (0.09 | ) | $ | 0.05 | $ | - | $ | - | $ | - | $ | 6.64 | 0.76% | $ | 138 | 1.50% | 1.20% | 2.11% | |||||||||||||||||||||||||||||
| 09/30/15i | 6.93 | 0.10 | (0.44 | ) | (0.34 | ) | - | - | - | 6.59 | (4.91% | )b | 85 | 1.49% | a | 1.20% | a | 1.82% | a | |||||||||||||||||||||||||||||||||
| 12/31/14 | 8.02 | 0.10 | (0.94 | ) | (0.84 | ) | (0.25 | ) | - | (0.25 | ) | 6.93 | (10.43% | ) | 89 | 1.26% | 1.20% | 1.29% | ||||||||||||||||||||||||||||||||||
| 12/31/13 | 6.74 | 0.13 | 1.31 | 1.44 | (0.16 | ) | (0.00 | )d | (0.16 | ) | 8.02 | 21.50% | 12 | 1.31% | 1.17% | 1.82% | ||||||||||||||||||||||||||||||||||||
| 12/31/12 | 5.79 | 0.20 | 0.75 | 0.95 | - | - | - | 6.74 | 16.61% | 18 | 1.32% | 1.17% | 3.36% | |||||||||||||||||||||||||||||||||||||||
| 12/31/11 | 7.06 | 0.21 | (1.41 | ) | (1.20 | ) | (0.07 | ) | - | (0.07 | ) | 5.79 | (17.06% | ) | 2,113 | 1.34% | 1.17% | 2.91% | ||||||||||||||||||||||||||||||||||
Class A | ||||||||||||||||||||||||||||||||||||||||||||||||||||
| 09/30/16 | $ | 6.33 | $ | 0.10 | $ | (0.07 | ) | $ | 0.03 | $ | - | $ | - | $ | - | $ | 6.36 | 0.47% | $ | 256 | 1.75% | 1.45% | 1.54% | |||||||||||||||||||||||||||||
| 09/30/15i | 6.68 | 0.08 | (0.43 | ) | (0.35 | ) | - | - | - | 6.33 | (5.24% | )b | 560 | 1.74% | a | 1.45% | a | 1.53% | a | |||||||||||||||||||||||||||||||||
| 12/31/14 | 7.71 | 0.28 | (1.10 | ) | (0.82 | ) | (0.21 | ) | - | (0.21 | ) | 6.68 | (10.60% | ) | 406 | 1.51% | 1.44% | 3.78% | ||||||||||||||||||||||||||||||||||
| 12/31/13 | 6.48 | 0.12 | 1.25 | 1.37 | (0.14 | ) | (0.00 | )d | (0.14 | ) | 7.71 | 21.28% | 764 | 1.56% | 1.42% | 1.64% | ||||||||||||||||||||||||||||||||||||
| 12/31/12 | 5.69 | 0.15 | 0.80 | 0.95 | (0.16 | ) | - | (0.16 | ) | 6.48 | 16.80% | 700 | 1.57% | 1.42% | 2.53% | |||||||||||||||||||||||||||||||||||||
| 12/31/11 | 7.05 | 0.13 | (1.34 | ) | (1.21 | ) | (0.15 | ) | - | (0.15 | ) | 5.69 | (17.13% | ) | 873 | 1.59% | 1.42% | 1.99% | ||||||||||||||||||||||||||||||||||
Class R4 | ||||||||||||||||||||||||||||||||||||||||||||||||||||
| 09/30/16 | $ | 6.32 | $ | 0.15 | $ | (0.12 | ) | $ | 0.03 | $ | (0.00 | )d | $ | - | $ | (0.00 | )d | $ | 6.35 | 0.53% | $ | 1,112 | 1.65% | 1.35% | 2.39% | |||||||||||||||||||||||||||
| 09/30/15i | 6.66 | 0.09 | (0.43 | ) | (0.34 | ) | - | - | - | 6.32 | (5.11% | )b | 87 | 1.64% | a | 1.35% | a | 1.67% | a | |||||||||||||||||||||||||||||||||
| 12/31/14h | 7.53 | 0.10 | (0.73 | ) | (0.63 | ) | (0.24 | ) | - | (0.24 | ) | 6.66 | (8.35% | )b | 92 | 1.41% | a | 1.35% | a | 1.76% | a | |||||||||||||||||||||||||||||||
Class R3 | ||||||||||||||||||||||||||||||||||||||||||||||||||||
| 09/30/16 | $ | 6.31 | $ | 0.11 | $ | (0.09 | ) | $ | 0.02 | $ | - | $ | - | $ | - | $ | 6.33 | 0.32% | $ | 196 | 1.90% | 1.60% | 1.79% | |||||||||||||||||||||||||||||
| 09/30/15i | 6.66 | 0.07 | (0.42 | ) | (0.35 | ) | - | - | - | 6.31 | (5.26% | )b | 100 | 1.89% | a | 1.60% | a | 1.39% | a | |||||||||||||||||||||||||||||||||
| 12/31/14h | 7.53 | 0.08 | (0.73 | ) | (0.65 | ) | (0.22 | ) | - | (0.22 | ) | 6.66 | (8.54% | )b | 91 | 1.66% | a | 1.60% | a | 1.51% | a | |||||||||||||||||||||||||||||||
| Year ended September 30, 2016 | Period ended September 30, 2015b | Year ended September 30 | ||||||||||||||||||||||
| 2014 | 2013 | 2012 | 2011 | |||||||||||||||||||||
Portfolio turnover rate for all share classes | 84 | % | 64 | % | 68 | % | 56 | % | 58 | % | 140 | % | ||||||||||||
| a | Annualized. |
| b | Percentage represents the results for the period and is not annualized. |
| c | Per share amount calculated on the average shares method. |
| d | Amount is less than $0.005 per share. |
| f | Amount is less than $500. |
| h | For the period April 1, 2014 (commencement of operations) through December 31, 2014. |
| i | For the period January 1, 2015 through September 30, 2015. |
| j | Computed after giving effect to an agreement by MML Advisers and/or MassMutual to waive certain fees and expenses of the Fund. |
| l | Employee retirement benefit plans that invest plan assets in the Separate Investment Accounts (SIAs) may be subject to certain charges as set forth in their respective Plan Documents. Total return figures would be lower for the periods presented if they reflected these charges. |
| m | Total return excludes sales charges, if any, and would be lower for the period presented if it reflected these charges. |
– 192 –
MM MSCI EAFE INTERNATIONAL INDEX FUND
| Income (loss) from investment operations | Less distributions to shareholders | Ratios / Supplemental Data | ||||||||||||||||||||||||||||||||||||||||||||||||||
| Net asset value, beginning of the period | Net investment income (loss)c,j | Net realized and unrealized gain (loss) on investments | Total income (loss) from investment operations | From net investment income | From net realized gains | Total distributions | Net asset value, end of the period | Total returnl,m | Net assets, end of the period (000)‘s | Ratio of expenses to average daily net assets before expense waivers | Ratio of expenses to average daily net assets after expense waiversj | Net investment income (loss) to average daily net assets | ||||||||||||||||||||||||||||||||||||||||
Class I | ||||||||||||||||||||||||||||||||||||||||||||||||||||
| 09/30/16 | $ | 11.68 | $ | 0.34 | $ | 0.38 | $ | 0.72 | $ | (0.27 | ) | $ | (0.03 | ) | $ | (0.30 | ) | $ | 12.10 | 6.26% | $ | 93,913 | 0.24% | 0.24% | n | 2.89% | ||||||||||||||||||||||||||
| 09/30/15i | 12.20 | 0.31 | (0.83 | ) | (0.52 | ) | - | - | - | 11.68 | (4.26% | )b | 278,051 | 0.29% | a | 0.25% | a | 3.22% | a | |||||||||||||||||||||||||||||||||
| 12/31/14 | 13.51 | 0.46 | (1.23 | ) | (0.77 | ) | (0.40 | ) | (0.14 | ) | (0.54 | ) | 12.20 | (5.64% | ) | 213,384 | 0.26% | 0.25% | 3.38% | |||||||||||||||||||||||||||||||||
| 12/31/13 | 11.80 | 0.37 | 2.19 | 2.56 | (0.40 | ) | (0.45 | ) | (0.85 | ) | 13.51 | 22.08% | 183,956 | 0.32% | 0.23% | 2.87% | ||||||||||||||||||||||||||||||||||||
| 12/31/12g | 10.00 | 0.11 | 1.84 | 1.95 | (0.14 | ) | (0.01 | ) | (0.15 | ) | 11.80 | 19.53% | b | 127,538 | 0.35% | a | 0.23% | a | 2.23% | a | ||||||||||||||||||||||||||||||||
Class R5 | ||||||||||||||||||||||||||||||||||||||||||||||||||||
| 09/30/16 | $ | 11.68 | $ | 0.34 | $ | 0.36 | $ | 0.70 | $ | (0.26 | ) | $ | (0.03 | ) | $ | (0.29 | ) | $ | 12.09 | 6.11% | $ | 32,195 | 0.34% | 0.34% | n | 2.96% | ||||||||||||||||||||||||||
| 09/30/15i | 12.21 | 0.32 | (0.85 | ) | (0.53 | ) | - | - | - | 11.68 | (4.34% | )b | 16,010 | 0.39% | a | 0.35% | a | 3.36% | a | |||||||||||||||||||||||||||||||||
| 12/31/14 | 13.50 | 0.59 | (1.37 | ) | (0.78 | ) | (0.37 | ) | (0.14 | ) | (0.51 | ) | 12.21 | (5.68% | ) | 4,052 | 0.36% | 0.34% | 4.35% | |||||||||||||||||||||||||||||||||
| 12/31/13 | 11.80 | 0.34 | 2.20 | 2.54 | (0.39 | ) | (0.45 | ) | (0.84 | ) | 13.50 | 21.95% | 10,414 | 0.42% | 0.33% | 2.54% | ||||||||||||||||||||||||||||||||||||
| 12/31/12g | 10.00 | 0.11 | 1.83 | 1.94 | (0.13 | ) | (0.01 | ) | (0.14 | ) | 11.80 | 19.48% | b | 120 | 0.45% | a | 0.33% | a | 2.15% | a | ||||||||||||||||||||||||||||||||
Service Class |
| |||||||||||||||||||||||||||||||||||||||||||||||||||
| 09/30/16 | $ | 11.64 | $ | 0.32 | $ | 0.36 | $ | 0.68 | $ | (0.24 | ) | $ | (0.03 | ) | $ | (0.27 | ) | $ | 12.05 | 5.94% | $ | 16,897 | 0.49% | 0.49% | n | 2.79% | ||||||||||||||||||||||||||
| 09/30/15i | 12.17 | 0.29 | (0.82 | ) | (0.53 | ) | - | - | - | 11.64 | (4.35% | )b | 14,896 | 0.54% | a | 0.50% | a | 3.00% | a | |||||||||||||||||||||||||||||||||
| 12/31/14 | 13.49 | 0.35 | (1.15 | ) | (0.80 | ) | (0.38 | ) | (0.14 | ) | (0.52 | ) | 12.17 | (5.88% | ) | 5,988 | 0.50% | 0.50% | k | 2.61% | ||||||||||||||||||||||||||||||||
| 12/31/13 | 11.80 | 0.33 | 2.19 | 2.52 | (0.38 | ) | (0.45 | ) | (0.83 | ) | 13.49 | 21.71% | 387 | 0.57% | 0.48% | 2.55% | ||||||||||||||||||||||||||||||||||||
| 12/31/12g | 10.00 | 0.10 | 1.84 | 1.94 | (0.13 | ) | (0.01 | ) | (0.14 | ) | 11.80 | 19.42% | b | 137 | 0.60% | a | 0.48% | a | 1.95% | a | ||||||||||||||||||||||||||||||||
Administrative Class |
| |||||||||||||||||||||||||||||||||||||||||||||||||||
| 09/30/16 | $ | 11.62 | $ | 0.32 | $ | 0.35 | $ | 0.67 | $ | (0.23 | ) | $ | (0.03 | ) | $ | (0.26 | ) | $ | 12.03 | 5.87% | $ | 39,646 | 0.59% | 0.59% | n | 2.72% | ||||||||||||||||||||||||||
| 09/30/15i | 12.17 | 0.28 | (0.83 | ) | (0.55 | ) | - | - | - | 11.62 | (4.52% | )b | 33,128 | 0.64% | a | 0.60% | a | 2.93% | a | |||||||||||||||||||||||||||||||||
| 12/31/14 | 13.49 | 0.32 | (1.13 | ) | (0.81 | ) | (0.37 | ) | (0.14 | ) | (0.51 | ) | 12.17 | (5.90% | ) | 22,634 | 0.60% | 0.60% | k | 2.43% | ||||||||||||||||||||||||||||||||
| 12/31/13 | 11.80 | 0.35 | 2.16 | 2.51 | (0.37 | ) | (0.45 | ) | (0.82 | ) | 13.49 | 21.60% | 4,450 | 0.67% | 0.58% | 2.67% | ||||||||||||||||||||||||||||||||||||
| 12/31/12g | 10.00 | 0.09 | 1.84 | 1.93 | (0.12 | ) | (0.01 | ) | (0.13 | ) | 11.80 | 19.35% | b | 120 | 0.70% | a | 0.58% | a | 1.88% | a | ||||||||||||||||||||||||||||||||
Class A | ||||||||||||||||||||||||||||||||||||||||||||||||||||
| 09/30/16 | $ | 11.59 | $ | 0.27 | $ | 0.38 | $ | 0.65 | $ | (0.21 | ) | $ | (0.03 | ) | $ | (0.24 | ) | $ | 12.00 | 5.63% | $ | 13,495 | 0.84% | 0.84% | n | 2.35% | ||||||||||||||||||||||||||
| 09/30/15i | 12.16 | 0.25 | (0.82 | ) | (0.57 | ) | - | - | - | 11.59 | (4.69% | )b | 12,681 | 0.89% | a | 0.85% | a | 2.65% | a | |||||||||||||||||||||||||||||||||
| 12/31/14 | 13.47 | 0.34 | (1.18 | ) | (0.84 | ) | (0.33 | ) | (0.14 | ) | (0.47 | ) | 12.16 | (6.20% | ) | 7,253 | 0.86% | 0.86% | k | 2.56% | ||||||||||||||||||||||||||||||||
| 12/31/13 | 11.80 | 0.30 | 2.16 | 2.46 | (0.34 | ) | (0.45 | ) | (0.79 | ) | 13.47 | 21.32% | 3,271 | 0.97% | 0.88% | 2.32% | ||||||||||||||||||||||||||||||||||||
| 12/31/12g | 10.00 | 0.08 | 1.84 | 1.92 | (0.11 | ) | (0.01 | ) | (0.12 | ) | 11.80 | 19.20% | b | 119 | 1.00% | a | 0.88% | a | 1.59% | a | ||||||||||||||||||||||||||||||||
Class R4 | ||||||||||||||||||||||||||||||||||||||||||||||||||||
| 09/30/16 | $ | 11.59 | $ | 0.32 | $ | 0.33 | $ | 0.65 | $ | (0.25 | ) | $ | (0.03 | ) | $ | (0.28 | ) | $ | 11.96 | 5.66% | $ | 25,933 | 0.74% | 0.74% | n | 2.74% | ||||||||||||||||||||||||||
| 09/30/15i | 12.15 | 0.19 | (0.75 | ) | (0.56 | ) | - | - | - | 11.59 | (4.69% | )b | 6,697 | 0.79% | a | 0.75% | a | 2.03% | a | |||||||||||||||||||||||||||||||||
| 12/31/14h | 13.53 | 0.22 | (1.11 | ) | (0.89 | ) | (0.35 | ) | (0.14 | ) | (0.49 | ) | 12.15 | (6.48% | )b | 141 | 0.75% | a | 0.75% | a,k | 2.22% | a | ||||||||||||||||||||||||||||||
Class R3 | ||||||||||||||||||||||||||||||||||||||||||||||||||||
| 09/30/16 | $ | 11.58 | $ | 0.28 | $ | 0.34 | $ | 0.62 | $ | (0.24 | ) | $ | (0.03 | ) | $ | (0.27 | ) | $ | 11.93 | 5.44% | $ | 24,798 | 0.99% | 0.99% | n | 2.46% | ||||||||||||||||||||||||||
| 09/30/15i | 12.16 | 0.22 | (0.80 | ) | (0.58 | ) | - | - | - | 11.58 | (4.69% | )b | 5,031 | 1.04% | a | 1.00% | a | 2.32% | a | |||||||||||||||||||||||||||||||||
| 12/31/14h | 13.53 | 0.21 | (1.12 | ) | (0.91 | ) | (0.32 | ) | (0.14 | ) | (0.46 | ) | 12.16 | (6.73% | )b | 97 | 1.00% | a | 1.00% | a,k | 2.09% | a | ||||||||||||||||||||||||||||||
| Year ended September 30, 2016 | Period ended September 30, 2015b | Year ended September 30 | ||||||||||||||||||
| 2014 | 2013 | 2012 | ||||||||||||||||||
Portfolio turnover rate for all share classes | 26 | % | 6 | % | 28 | % | 42 | % | 6 | %b | ||||||||||
| a | Annualized. |
| b | Percentage represents the results for the period and is not annualized. |
| c | Per share amount calculated on the average shares method. |
| g | For the period July 25, 2012 (commencement of operations) through December 31, 2012. |
| h | For the period April 1, 2014 (commencement of operations) through December 31, 2014. |
| i | For the period January 1, 2015 through September 30, 2015. |
| j | Computed after giving effect to an agreement by MML Advisers and/or MassMutual to waive certain fees and expenses of the Fund. |
| k | Amount waived had no impact on the ratio of expenses to average daily net assets. |
| l | Employee retirement benefit plans that invest plan assets in the Separate Investment Accounts (SIAs) may be subject to certain charges as set forth in their respective Plan Documents. Total return figures would be lower for the periods presented if they reflected these charges. |
| m | Total return excludes sales charges, if any, and would be lower for the period presented if it reflected these charges. |
| n | Expenses incurred during the period fell under the expense cap. |
– 193 –
MASSMUTUAL SELECT OVERSEAS FUND
| Income (loss) from investment operations | Less distributions to shareholders | Ratios / Supplemental Data | ||||||||||||||||||||||||||||||||||||||||||||||
| Net asset value, beginning of the period | Net investment income (loss)c,j | Net realized and unrealized gain (loss) on investments | Total income (loss) from investment operations | From net investment income | Total distributions | Net asset value, end of the period | Total returnl,m | Net assets, end of the period (000’s) | Ratio of expenses to average daily net assets before expense waivers | Ratio of expenses to average daily net assets after expense waiversj | Net investment income (loss) to average daily net assets | |||||||||||||||||||||||||||||||||||||
Class I | ||||||||||||||||||||||||||||||||||||||||||||||||
| 09/30/16 | $ | 7.68 | $ | 0.14 | $ | 0.19 | $ | 0.33 | $ | (0.13 | ) | $ | (0.13 | ) | $ | 7.88 | 4.28% | $ | 328,518 | 0.92% | N/A | 1.88% | ||||||||||||||||||||||||||
| 09/30/15i | 8.29 | 0.13 | (0.53 | ) | (0.40 | ) | (0.21 | ) | (0.21 | ) | 7.68 | (5.00% | )b | 290,692 | 0.93% | a | N/A | 1.95% | a | |||||||||||||||||||||||||||||
| 12/31/14 | 9.05 | 0.20 | (0.75 | ) | (0.55 | ) | (0.21 | ) | (0.21 | ) | 8.29 | (6.25% | ) | 305,063 | 0.97% | 0.90% | 2.22% | |||||||||||||||||||||||||||||||
| 12/31/13 | 7.57 | 0.15 | 1.54 | 1.69 | (0.21 | ) | (0.21 | ) | 9.05 | 22.65% | 270,927 | 1.16% | 0.85% | 1.76% | ||||||||||||||||||||||||||||||||||
| 12/31/12 | 6.26 | 0.15 | 1.28 | 1.43 | (0.12 | ) | (0.12 | ) | 7.57 | 23.14% | 255,215 | �� | 1.16% | 0.85% | 2.19% | |||||||||||||||||||||||||||||||||
| 12/31/11 | 7.34 | 0.07 | (1.02 | ) | (0.95 | ) | (0.13 | ) | (0.13 | ) | 6.26 | (12.97% | ) | 242,149 | 1.18% | 0.86% | 1.03% | |||||||||||||||||||||||||||||||
Class R5 |
| |||||||||||||||||||||||||||||||||||||||||||||||
| 09/30/16 | $ | 7.70 | $ | 0.13 | $ | 0.19 | $ | 0.32 | $ | (0.12 | ) | $ | (0.12 | ) | $ | 7.90 | 4.15% | $ | 138,668 | 1.02% | N/A | 1.71% | ||||||||||||||||||||||||||
| 09/30/15i | 8.31 | 0.12 | (0.54 | ) | (0.42 | ) | (0.19 | ) | (0.19 | ) | 7.70 | (5.13% | )b | 161,529 | 1.03% | a | N/A | 1.85% | a | |||||||||||||||||||||||||||||
| 12/31/14 | 9.06 | 0.19 | (0.76 | ) | (0.57 | ) | (0.18 | ) | (0.18 | ) | 8.31 | (6.40% | ) | 164,096 | 1.13% | 1.05% | 2.18% | |||||||||||||||||||||||||||||||
| 12/31/13 | 7.58 | 0.12 | 1.55 | 1.67 | (0.19 | ) | (0.19 | ) | 9.06 | 22.39% | 191,060 | 1.44% | 1.13% | 1.41% | ||||||||||||||||||||||||||||||||||
| 12/31/12 | 6.26 | 0.12 | 1.29 | 1.41 | (0.09 | ) | (0.09 | ) | 7.58 | 22.70% | 155,925 | 1.45% | 1.14% | 1.78% | ||||||||||||||||||||||||||||||||||
| 12/31/11 | 7.34 | 0.14 | (1.10 | ) | (0.96 | ) | (0.12 | ) | (0.12 | ) | 6.26 | (13.09% | ) | 99,517 | 1.43% | 1.14% | 1.90% | |||||||||||||||||||||||||||||||
Service Class |
| |||||||||||||||||||||||||||||||||||||||||||||||
| 09/30/16 | $ | 7.66 | $ | 0.12 | $ | 0.19 | $ | 0.31 | $ | (0.11 | ) | $ | (0.11 | ) | $ | 7.86 | 4.07% | $ | 69,873 | 1.12% | N/A | 1.63% | ||||||||||||||||||||||||||
| 09/30/15i | 8.26 | 0.11 | (0.52 | ) | (0.41 | ) | (0.19 | ) | (0.19 | ) | 7.66 | (5.10% | )b | 77,184 | 1.13% | a | N/A | 1.74% | a | |||||||||||||||||||||||||||||
| 12/31/14 | 9.01 | 0.17 | (0.75 | ) | (0.58 | ) | (0.17 | ) | (0.17 | ) | 8.26 | (6.52% | ) | 76,131 | 1.21% | 1.13% | 1.95% | |||||||||||||||||||||||||||||||
| 12/31/13 | 7.54 | 0.12 | 1.54 | 1.66 | (0.19 | ) | (0.19 | ) | 9.01 | 22.27% | 83,580 | 1.49% | 1.18% | 1.41% | ||||||||||||||||||||||||||||||||||
| 12/31/12 | 6.23 | 0.13 | 1.27 | 1.40 | (0.09 | ) | (0.09 | ) | 7.54 | 22.64% | 66,317 | 1.50% | 1.19% | 1.97% | ||||||||||||||||||||||||||||||||||
| 12/31/11 | 7.31 | 0.11 | (1.07 | ) | (0.96 | ) | (0.12 | ) | (0.12 | ) | 6.23 | (13.16% | ) | 75,356 | 1.49% | 1.19% | 1.60% | |||||||||||||||||||||||||||||||
Administrative Class |
| |||||||||||||||||||||||||||||||||||||||||||||||
| 09/30/16 | $ | 7.72 | $ | 0.12 | $ | 0.18 | $ | 0.30 | $ | (0.10 | ) | $ | (0.10 | ) | $ | 7.92 | 3.93% | $ | 37,189 | 1.22% | N/A | 1.54% | ||||||||||||||||||||||||||
| 09/30/15i | 8.32 | 0.11 | (0.52 | ) | (0.41 | ) | (0.19 | ) | (0.19 | ) | 7.72 | (5.08% | )b | 35,607 | 1.23% | a | N/A | 1.70% | a | |||||||||||||||||||||||||||||
| 12/31/14 | 9.09 | 0.17 | (0.76 | ) | (0.59 | ) | (0.18 | ) | (0.18 | ) | 8.32 | (6.59% | ) | 29,655 | 1.29% | 1.22% | 1.90% | |||||||||||||||||||||||||||||||
| 12/31/13 | 7.60 | 0.11 | 1.54 | 1.65 | (0.16 | ) | (0.16 | ) | 9.09 | 22.02% | 26,362 | 1.54% | 1.23% | 1.35% | ||||||||||||||||||||||||||||||||||
| 12/31/12 | 6.22 | 0.12 | 1.29 | 1.41 | (0.03 | ) | (0.03 | ) | 7.60 | 22.67% | 27,315 | 1.55% | 1.24% | 1.76% | ||||||||||||||||||||||||||||||||||
| 12/31/11 | 7.28 | 0.14 | (1.10 | ) | (0.96 | ) | (0.10 | ) | (0.10 | ) | 6.22 | (13.21% | ) | 26,070 | 1.53% | 1.23% | 1.97% | |||||||||||||||||||||||||||||||
Class A | ||||||||||||||||||||||||||||||||||||||||||||||||
| 09/30/16 | $ | 7.55 | $ | 0.10 | $ | 0.18 | $ | 0.28 | $ | (0.08 | ) | $ | (0.08 | ) | $ | 7.75 | 3.73% | $ | 58,816 | 1.47% | N/A | 1.31% | ||||||||||||||||||||||||||
| 09/30/15i | 8.14 | 0.09 | (0.52 | ) | (0.43 | ) | (0.16 | ) | (0.16 | ) | 7.55 | (5.39% | )b | 58,523 | 1.48% | a | N/A | 1.40% | a | |||||||||||||||||||||||||||||
| 12/31/14 | 8.89 | 0.15 | (0.75 | ) | (0.60 | ) | (0.15 | ) | (0.15 | ) | 8.14 | (6.80% | ) | 60,890 | 1.55% | 1.47% | 1.72% | |||||||||||||||||||||||||||||||
| 12/31/13 | 7.45 | 0.09 | 1.52 | 1.61 | (0.17 | ) | (0.17 | ) | 8.89 | 21.86% | 60,251 | 1.79% | 1.48% | 1.08% | ||||||||||||||||||||||||||||||||||
| 12/31/12 | 6.16 | 0.10 | 1.26 | 1.36 | (0.07 | ) | (0.07 | ) | 7.45 | 22.47% | 54,429 | 1.80% | 1.49% | 1.48% | ||||||||||||||||||||||||||||||||||
| 12/31/11 | 7.23 | 0.09 | (1.06 | ) | (0.97 | ) | (0.10 | ) | (0.10 | ) | 6.16 | (13.60% | ) | 42,720 | 1.79% | 1.49% | 1.33% | |||||||||||||||||||||||||||||||
Class R4 | ||||||||||||||||||||||||||||||||||||||||||||||||
| 09/30/16 | $ | 7.47 | $ | 0.12 | $ | 0.16 | $ | 0.28 | $ | (0.11 | ) | $ | (0.11 | ) | $ | 7.64 | 3.79% | $ | 6,660 | 1.37% | N/A | 1.57% | ||||||||||||||||||||||||||
| 09/30/15i | 8.09 | 0.08 | (0.49 | ) | (0.41 | ) | (0.21 | ) | (0.21 | ) | 7.47 | (5.24% | )b | 3,422 | 1.38% | a | N/A | 1.28% | a | |||||||||||||||||||||||||||||
| 12/31/14h | 8.80 | 0.11 | (0.61 | ) | (0.50 | ) | (0.21 | ) | (0.21 | ) | 8.09 | (5.81% | )b | 94 | 1.37% | a | N/A | 1.63% | a | |||||||||||||||||||||||||||||
Class R3 | ||||||||||||||||||||||||||||||||||||||||||||||||
| 09/30/16 | $ | 7.52 | $ | 0.09 | $ | 0.18 | $ | 0.27 | $ | (0.09 | ) | $ | (0.09 | ) | $ | 7.70 | $ | 3.63% | $ | 1,918 | 1.62% | N/A | 1.25% | |||||||||||||||||||||||||
| 09/30/15i | 8.15 | 0.10 | (0.55 | ) | (0.45 | ) | (0.18 | ) | (0.18 | ) | 7.52 | (5.60% | )b | 1,257 | 1.63% | a | N/A | 1.51% | a | |||||||||||||||||||||||||||||
| 12/31/14 | 8.76 | 0.17 | (0.78 | ) | (0.61 | ) | - | - | 8.15 | (6.96% | ) | 182 | 1.82% | 1.69% | 2.02% | |||||||||||||||||||||||||||||||||
| 12/31/13 | 7.37 | 0.06 | 1.51 | 1.57 | (0.18 | ) | (0.18 | ) | 8.76 | 21.53% | 732 | 2.09% | 1.78% | 0.79% | ||||||||||||||||||||||||||||||||||
| 12/31/12 | 6.11 | 0.07 | 1.26 | 1.33 | (0.07 | ) | (0.07 | ) | 7.37 | 21.96% | 549 | 2.10% | 1.79% | 1.12% | ||||||||||||||||||||||||||||||||||
| 12/31/11 | 7.15 | 0.07 | (1.05 | ) | (0.98 | ) | (0.06 | ) | (0.06 | ) | 6.11 | (13.78% | ) | 238 | 2.09% | 1.79% | 0.98% | |||||||||||||||||||||||||||||||
| Year ended September 30, 2016 | Period ended September 30, 2015b | Year ended September 30 | ||||||||||||||||||||||
| 2014 | 2013 | 2012 | 2011 | |||||||||||||||||||||
Portfolio turnover rate | 38% | 39% | 42 | % | 35 | % | 39 | % | 55 | % | ||||||||||||||
| a | Annualized. |
| b | Percentage represents the results for the period and is not annualized. |
| c | Per share amount calculated on the average shares method. |
| h | For the period April 1, 2014 (commencement of operations) through December 31, 2014. |
| i | For the period January 1, 2015 through September 30, 2015. |
| j | Computed after giving effect to an agreement by MML Advisers and/or MassMutual to waive certain fees and expenses of the Fund. |
| l | Employee retirement benefit plans that invest plan assets in the Separate Investment Accounts (SIAs) may be subject to certain charges as set forth in their respective Plan Documents. Total return figures would be lower for the periods presented if they reflected these charges. |
| m | Total return excludes sales charges, if any, and would be lower for the period presented if it reflected these charges. |
– 194 –
The Bloomberg Barclays U.S. Aggregate Bond Index measures the performance of the investment grade, U.S. dollar-denominated, fixed-rate taxable bond market, including Treasuries, government-related and corporate securities, MBS (agency fixed-rate and hybrid ARM pass-throughs), ABS, and CMBS. It rolls up into other Barclay’s flagship indexes, such as the multi-currency Global Aggregate Index and the U.S. Universal Index, which includes high yield and emerging markets debt. The Index does not reflect any deduction for fees, expenses, or taxes and cannot be purchased directly by investors.
The Citigroup Non-U.S. Dollar World Government Bond Index measures the performance of fixed-rate, local currency, investment-grade sovereign bonds of all WGBI countries except the United States and is stated in U.S. dollar terms. It is a subset of the Citigroup World Government Bond Index (WGBI). The Index does not reflect any deduction for fees, expenses, or taxes and cannot be purchased directly by investors.
The Citigroup World Government Bond Index measures the performance of fixed-rate, local currency, investment-grade sovereign bonds. The Index does not reflect any deduction for fees, expenses, or taxes and cannot be purchased directly by investors.
The Custom Global Allocation Index comprises the S&P 500, FTSE World ex U.S., BofA Merrill Lynch Current 5-Year U.S. Treasury, and Citigroup Non-U.S. Dollar World Government Bond Indexes. The weightings of each index are 36%, 24%, 24%, and 16%, respectively. The Index does not reflect any deduction for fees, expenses, or taxes and cannot be purchased directly by investors.
The FTSE World Index measures the performance of the large- and mid-capitalization universe for developed and advanced emerging market segments. It is part of the FTSE Global Equity Index Series. The Index does not reflect any deduction for fees, expenses, or taxes and cannot be purchased directly by investors.
The FTSE World ex U.S. Index is an unmanaged, market-capitalization-weighted index representing the performance of the large and mid cap stocks from the Developed and Advanced Emerging segments of the FTSE Global Equity Index Series excluding the United States. The Index does not reflect any deduction for fees, expenses, or taxes and cannot be purchased directly by investors.
The BofA Merrill Lynch Current 5-Year U.S. Treasury Index is an unmanaged index designed to track the total return of the current coupon five-year U.S. Treasury bond. The Index does not reflect any deduction for fees, expenses, or taxes and cannot be purchased directly by investors.
The MSCI EAFE Index measures the performance of the large- and mid-cap segments of developed markets, excluding the U.S. and Canada equity securities. It is free float-adjusted market-capitalization weighted. The Index does not reflect any deduction for fees or expenses and cannot be purchased directly by investors.
The MSCI EAFE Value Index measures the performance of the value large- and mid-cap segments of developed markets, excluding the U.S. and Canada equity securities. It is free float-adjusted market-capitalization weighted. The Index does not reflect any deduction for fees or expenses and cannot be purchased directly by investors.
The Russell Midcap Growth Index measures the performance of the mid-cap growth segment of the U.S. equity universe. It includes Russell Midcap Index companies with higher price-to-book ratios and higher forecasted growth values. It is market-capitalization weighted. The Index does not reflect any deduction for fees, expenses, or taxes and cannot be purchased directly by investors.
The Russell Midcap Value Index measures the performance of the mid-cap value segment of the U.S. equity universe. It includes Russell Midcap Index companies with lower price-to-book ratios and lower forecasted growth values. It is market-capitalization weighted. The Index does not reflect any deduction for fees, expenses, or taxes and cannot be purchased directly by investors.
– 195 –
The Russell 1000 Index measures the performance of the large-cap segment of U.S. equity securities. It is a subset of the Russell 3000 Index and includes approximately 1000 of the largest securities based on a combination of their market cap and current index membership. The Index does not reflect any deduction for fees, expenses, or taxes and cannot be purchased directly by investors.
The Russell 1000 Growth Index measures the performance of the large-cap growth segment of U.S. equity securities. It includes the Russell 1000 Index companies with higher price-to-book ratios and higher forecasted growth values. It is market-capitalization weighted. The Index does not reflect any deduction for fees, expenses, or taxes and cannot be purchased directly by investors.
The Russell 1000 Value Index measures the performance of the large-cap value segment of U.S. equity securities. It includes the Russell 1000 Index companies with lower price-to-book ratios and lower expected growth values. It is market-capitalization weighted. The Index does not reflect any deduction for fees, expenses, or taxes and cannot be purchased directly by investors.
The Russell 2000 Index measures the performance of the small-cap segment of the U.S. equity universe. It is a subset of the Russell 3000 Index and includes approximately 2000 of the smallest securities based on a combination of their market cap and current index membership. The Index does not reflect any deduction for fees, expenses, or taxes and cannot be purchased directly by investors.
The Russell 2000 Growth Index measures the performance of the small- to mid-cap growth segment of the U.S. equity universe. It includes Russell 2500 Index companies with higher price-to-book ratios and higher forecasted growth values. It is market-capitalization weighted. The Index does not reflect any deduction for fees, expenses, or taxes and cannot be purchased directly by investors.
The Russell 2000 Value Index measures the performance of the small-cap value segment of the U.S. equity universe. It includes those Russell 2000 Index companies with lower price-to-book ratios and lower forecasted growth values. It is market-capitalization weighted. The Index does not reflect any deduction for fees, expenses, or taxes and cannot be purchased directly by investors.
The S&P 500 Index measures the performance of 500 widely held stocks in U.S. equity market. Standard and Poor’s chooses member companies for the index based on market size, liquidity, and industry group representation. Included are the stocks of industrial, financial, utility, and transportation companies. Since mid-1989, this composition has been more flexible and the number of issues in each sector has varied. It is market capitalization-weighted. The Index does not reflect any deduction for fees, expenses, or taxes and cannot be purchased directly by investors.
The S&P MidCap 400 Index measures the performance of mid-sized U.S. companies, reflecting the distinctive risk and return characteristics of this market segment. It comprises stocks in the middle capitalization range, covering approximately 7% of the of U.S. equity market. The Index does not reflect any deduction for fees, expenses, or taxes and cannot be purchased directly by investors.
– 196 –
MASSMUTUAL SELECT FUNDS
100 Bright Meadow Blvd.
Enfield, Connecticut 06082-1981
Learning More About the Funds
You can learn more about the Funds by reading the Funds’ Annual and Semiannual Reports and the SAI. You may obtain free copies of this information from the Funds or from the SEC using one or more of the methods set forth below. In the Annual and Semiannual Reports, you will find a discussion of market conditions and investment strategies that significantly affected each Fund’s performance during the period covered by the Report and a listing of each Fund’s portfolio securities as of the end of such period. The SAI provides additional information about the Funds and will provide you with more detail regarding the organization and operation of the Funds, including their investment strategies. The SAI is incorporated by reference into this Prospectus and is therefore legally considered a part of this Prospectus.
How to Obtain Information
From MassMutual Select Funds: You may request information about the Funds free of charge (including the Annual/Semiannual Reports and the SAI) or make shareholder inquiries by calling 1-888-309-3539 or by writing MassMutual Select Funds, c/o Massachusetts Mutual Life Insurance Company, 100 Bright Meadow Blvd., Enfield, Connecticut 06082-1981, Attention: MassMutual U.S. Product and Marketing. You may also obtain copies of the Annual/Semiannual Reports and the SAI free of charge at http://www.massmutual.com/funds.
From the SEC: You may review and copy information about the Funds (including the Annual/ Semiannual Reports and the SAI) at the SEC’s Public Reference Room in Washington, D.C. (call 1-202-551-8090 for information regarding the operation of the SEC’s public reference room). You can get copies of this information, upon payment of a copying fee, by writing to the SEC’s Public Reference Section, Washington, D.C. 20549-1520 or by electronic request at publicinfo@sec.gov. Alternatively, if you have access to the Internet, you may obtain information about the Funds from the SEC’s EDGAR database on its Internet site at http://www.sec.gov.
When obtaining information about the Funds from the SEC, you may find it useful to reference the Funds’ SEC file number: 811-8274.
MASSMUTUAL SELECT FUNDS
100 BRIGHT MEADOW BLVD.
ENFIELD, CONNECTICUT 06082-1981
STATEMENT OF ADDITIONAL INFORMATION
THIS STATEMENT OF ADDITIONAL INFORMATION (“SAI”) IS NOT A PROSPECTUS. IT SHOULD BE READ IN CONJUNCTION WITH THE PROSPECTUS OF MASSMUTUAL SELECT FUNDS (THE “TRUST”) DATED FEBRUARY 1, 2017, AS AMENDED FROM TIME TO TIME (THE “PROSPECTUS”). THIS SAI INCORPORATES HEREIN THE FINANCIAL STATEMENTS OF THE FUNDS BY REFERENCE TO THE TRUST’S ANNUAL REPORTS AS OF SEPTEMBER 30, 2016 (THE “ANNUAL REPORTS”). TO OBTAIN A PROSPECTUS OR AN ANNUAL REPORT, CALL TOLL-FREE 1-888-309-3539, OR WRITE THE TRUST AT THE ABOVE ADDRESS.
This SAI relates to the following Funds:
Fund Name | Class I | Class R5 | Service Class | Administrative Class | Class A | Class R4 | Class R3 | |||||||
MassMutual Select Total Return Bond Fund | MSPZX | MSPSX | MSPHX | MSPLX | MPTRX | MSPGX | MSPNX | |||||||
MassMutual Select Strategic Bond Fund | MSBZX | MBSSX | MBSYX | MSBLX | MSBAX | MSBRX | MSBNX | |||||||
MassMutual Select BlackRock Global Allocation Fund | MGJIX | MGSSX | MGSYX | MGSLX | MGJAX | MGJFX | MGJRX | |||||||
MassMutual Select Diversified Value Fund | MDDIX | MDVSX | MDVYX | MDDLX | MDDAX | MDDRX | MDVNX | |||||||
MassMutual Select Fundamental Value Fund | MFUZX | MVUSX | MFUYX | MFULX | MFUAX | MFUFX | MFUNX | |||||||
MassMutual Select Large Cap Value Fund | MLVZX | MLVSX | MMLYX | MLVLX | MMLAX | MLVFX | MLVNX | |||||||
MM S&P 500® Index Fund | MMIZX | MIEZX | MMIEX | MIEYX | MMFFX | MIEAX | MMINX | |||||||
MassMutual Select Focused Value Fund | MFVZX | MFVSX | MMFYX | MMFVX | MFVAX | MFVFX | MFVNX | |||||||
MassMutual Select Fundamental Growth Fund | MOTZX | MOTCX | MOTYX | MOTLX | MOTAX | MFGFX | MOTNX | |||||||
MassMutual Select Blue Chip Growth Fund | MBCZX | MBCSX | MBCYX | MBCLX | MBCGX | MBGFX | MBCNX | |||||||
MassMutual Select Growth Opportunities Fund | MMAZX | MGRSX | MAGYX | MAGLX | MMAAX | MMGFX | MMANX | |||||||
MassMutual Select Mid-Cap Value Fund | MLUZX | MLUSX | MLUYX | MLULX | MLUAX | MLUFX | MLUNX | |||||||
MassMutual Select Small Cap Value Equity Fund | MMQIX | MMQSX | MMQYX | MMQLX | MMQAX | MMQFX | MMQTX | |||||||
MassMutual Select Small Company Value Fund | MSVZX | MSVSX | MMVYX | MMYLX | MMYAX | MMVFX | MSVNX | |||||||
MM S&P® Mid Cap Index Fund | MDKZX | MDKIX | MDKSX | MDKYX | MDKAX | MDKFX | MDKTX | |||||||
MM Russell 2000® Small Cap Index Fund | MCJZX | MCJIX | MCJSX | MCJYX | MCJAX | MCJFX | MCJTX | |||||||
MassMutual Select Mid Cap Growth Equity II Fund | MEFZX | MGRFX | MEFYX | MMELX | MEFAX | MEFFX | MEFNX | |||||||
MassMutual Select Small Cap Growth Equity Fund | MSGZX | MSGSX | MSCYX | MSGLX | MMGEX | MSERX | MSGNX | |||||||
MassMutual Select Diversified International Fund | MMZIX | MMZSX | MMZYX | MMZLX | MMZAX | MMZFX | MMZTX | |||||||
MM MSCI EAFE® International Index Fund | MKRZX | MKRIX | MKRSX | MKRYX | MKRAX | MKRFX | MKRTX | |||||||
MassMutual Select Overseas Fund | MOSZX | MOSSX | MOSYX | MOSLX | MOSAX | MOSFX | MOSNX |
No dealer, salesman or any other person has been authorized to give any information or to make any representations, other than those contained in this SAI or in the related Prospectus, in connection with the offer contained herein, and, if given or made, such other information or representation must not be relied upon as having been authorized by the Trust or MML Distributors, LLC (the “Distributor”). This SAI and the related Prospectus do not constitute an offer by the Trust or by the Distributor to sell or a solicitation of any offer to buy any of the securities offered hereby in any jurisdiction to any person to whom it is unlawful to make such offer in such jurisdiction.
Dated February 1, 2017
B-1
| Page | ||||
| B-3 | ||||
| B-4 | ||||
| B-49 | ||||
| B-51 | ||||
| B-53 | ||||
| B-63 | ||||
| B-95 | ||||
| B-108 | ||||
Class A, Class R4, and Class R3 Distribution and Service Plan | B-108 | |||
| B-109 | ||||
| B-110 | ||||
| B-110 | ||||
| B-110 | ||||
| B-111 | ||||
| B-116 | ||||
| B-117 | ||||
| B-117 | ||||
| B-119 | ||||
| B-132 | ||||
| B-132 | ||||
| B-134 | ||||
| B-138 | ||||
| B-297 | ||||
B-2
MassMutual Select Funds (the “Trust”) is a professionally managed, open-end investment company. This Statement of Additional Information (“SAI”) describes the following 19 diversified series of the Trust: (1) MassMutual Select Total Return Bond Fund (“Total Return Bond Fund”), (2) MassMutual Select Strategic Bond Fund (“Strategic Bond Fund”), (3) MassMutual Select BlackRock Global Allocation Fund (“BlackRock Global Allocation Fund”), (4) MassMutual Select Diversified Value Fund (“Diversified Value Fund”), (5) MassMutual Select Fundamental Value Fund (“Fundamental Value Fund”), (6) MassMutual Select Large Cap Value Fund (“Large Cap Value Fund”) (7) MM S&P 500® Index Fund (“S&P 500 Index Fund”), (8) MassMutual Select Fundamental Growth Fund (“Fundamental Growth Fund”), (9) MassMutual Select Blue Chip Growth Fund (“Blue Chip Growth Fund”), (10) MassMutual Select Mid-Cap Value Fund (“Mid-Cap Value Fund”), (11) MassMutual Select Small Cap Value Equity Fund (“Small Cap Value Equity Fund”), (12) MassMutual Select Small Company Value Fund (“Small Company Value Fund”), (13) MM S&P® Mid Cap Index Fund (“S&P Mid Cap Index Fund”), (14) MM Russell 2000® Small Cap Index Fund (“Russell 2000 Small Cap Index Fund”), (15) MassMutual Select Mid Cap Growth Equity II Fund (“Mid Cap Growth Equity II Fund”), (16) MassMutual Select Small Cap Growth Equity Fund (“Small Cap Growth Equity Fund”), (17) MassMutual Select Diversified International Fund (“Diversified International Fund”), (18) MM MSCI EAFE® International Index Fund (“MSCI EAFE International Index Fund”), and (19) MassMutual Select Overseas Fund (“Overseas Fund”); and two non-diversified series of Trust: (1) MassMutual Select Focused Value Fund (“Focused Value Fund”) and (2) MassMutual Select Growth Opportunities Fund (“Growth Opportunities Fund”) (each individually referred to as a “Fund” or collectively as the “Funds”). Currently, the Trustees have authorized a total of 39 separate series. Additional series may be created by the Trustees from time-to-time.
The Trust is organized under the laws of The Commonwealth of Massachusetts as a Massachusetts business trust pursuant to an Agreement and Declaration of Trust dated May 28, 1993, as amended and restated as of November 21, 2011, as it may be further amended from time to time (the “Declaration of Trust”). The investment adviser for each of the Funds is MML Investment Advisers, LLC (“MML Advisers”). The subadviser for the Total Return Bond Fund is Metropolitan West Asset Management, LLC (“MetWest”), located at 865 S. Figueroa Street, Suite 1800, Los Angeles, California 90017. The subadvisers for the Strategic Bond Fund are Western Asset Management Company (“Western Asset”), located at 385 E. Colorado Boulevard, Pasadena, California 91101, and Western Asset Management Company Limited (“Western Asset Limited”), located at 10 Exchange Square, Primrose Street, London EC 2A2EN, United Kingdom. The subadviser for the BlackRock Global Allocation Fund is BlackRock Investment Management, LLC (“BlackRock”), located at 1 University Square, Princeton, New Jersey 08540. The subadvisers for the Diversified Value Fund are Brandywine Global Investment Management, LLC (“Brandywine Global”), located at 2929 Arch Street, 8th Floor, Philadelphia, Pennsylvania 19104, and Loomis, Sayles & Company, L.P. (“Loomis Sayles”) located at One Financial Center, Boston, Massachusetts 02111. The subadviser for the Fundamental Value Fund is Wellington Management Company LLP (“Wellington Management”), located at 280 Congress Street, Boston, Massachusetts 02210. The subadvisers for the Large Cap Value Fund are Barrow, Hanley, Mewhinney & Strauss, LLC (“Barrow Hanley”), located at 2200 Ross Avenue, 31st Floor, Dallas, Texas 75201, and Huber Capital Management, LLC (“Huber Capital Management”), located at 2321 Rosecrans Avenue, Suite 3245, El Segundo, California 90245. The subadviser for the S&P 500 Index Fund is Northern Trust Investments, Inc. (“NTI”), located at 50 South LaSalle Street, Chicago, Illinois 60603. The subadviser for the Focused Value Fund is Harris Associates L.P. (“Harris”), located at 111 S. Wacker Drive, Suite 4600, Chicago, Illinois 60606. The subadviser for the Fundamental Growth Fund is Wellington Management. The subadvisers for the Blue Chip Growth Fund are T. Rowe Price Associates, Inc. (“T. Rowe Price”), located at 100 East Pratt Street, Baltimore, Maryland 21202, and Loomis Sayles. The subadvisers for the Growth Opportunities Fund are Sands Capital Management, LLC (“Sands Capital”), located at 1000 Wilson Boulevard, Suite 3000, Arlington, Virginia 22209, and Jackson Square Partners, LLC (“Jackson Square”), located at 101 California Street, Suite 3750, San Francisco, CA 94111. The subadvisers for the Mid-Cap Value Fund are American Century Investment Management, Inc. (“American Century”), located at 4500 Main Street, Kansas City, Missouri 64111, and Systematic Financial Management, L.P. (“Systematic”), located at 300 Frank W. Burr Boulevard, Glenpointe East, 7th Floor, Teaneck, New Jersey 07666. The subadvisers for the
B-3
Small Cap Value Equity Fund are Wellington Management and Barrow Hanley. The subadvisers for the Small Company Value Fund are Federated Clover Investment Advisors (“Federated Clover”), located at 400 Meridian Centre, Suite 200, Rochester, New York 14618, T. Rowe Price, and Invesco Advisers, Inc. (“Invesco”), located at 1555 Peachtree Street, N.E., Atlanta, Georgia 30309. The subadviser for the S&P Mid Cap Index Fund is NTI. The subadviser for the Russell 2000 Small Cap Index Fund is NTI. The subadvisers for the Mid Cap Growth Equity II Fund are T. Rowe Price and Frontier Capital Management Company, LLC (“Frontier”), located at 99 Summer Street, Boston, Massachusetts 02110. The subadvisers for the Small Cap Growth Equity Fund are Wellington Management and OFI Global Institutional, Inc. (“OFI Global”), located at 225 Liberty Street, 11th Floor, New York, NY 10281. The subadviser for the Diversified International Fund is J.P. Morgan Investment Management Inc. (“J.P. Morgan”), located at 270 Park Avenue, New York, New York 10017. The subadviser for the MSCI EAFE International Index Fund is NTI. The subadvisers for the Overseas Fund are J.P. Morgan, Massachusetts Financial Services Company (“MFS”), located at 111 Huntington Avenue, Boston, Massachusetts 02199, and Harris.
ADDITIONAL INVESTMENT POLICIES
Each Fund has a distinct investment objective which it pursues through separate investment policies, as described in the Prospectus and below. The fundamental investment policies and fundamental investment restrictions of a Fund may not be changed without the vote of a majority of that Fund’s outstanding voting securities (which, under the Investment Company Act of 1940, as amended (the “1940 Act”) and the rules thereunder and as used in this SAI and in the Prospectus, means the lesser of (l) 67% of the shares of that Fund present at a meeting if the holders of more than 50% of the outstanding shares of that Fund are present in person or by proxy, or (2) more than 50% of the outstanding shares of that Fund). The Board of Trustees of the Trust (the “Board”) may adopt new or amend or delete existing non-fundamental investment policies and restrictions without shareholder approval. There is no guarantee that any Fund will achieve its investment objective.
Unless otherwise specified, each Fund may engage in the investment practices and techniques described below to the extent consistent with such Fund’s investment objective and fundamental investment restrictions. Not all Funds necessarily will utilize all or any of these practices and techniques at any one time or at all. Investment policies and restrictions described below are non-fundamental and may be changed by the Trustees without shareholder approval, unless otherwise noted. For a description of the ratings of corporate debt securities and money market instruments in which the various Funds may invest, reference should be made to the Appendix.
Investments in the Select Cayman Fund
In order to earn qualifying income under applicable tax rules from commodities and commodities-related investments, the BlackRock Global Allocation Fund may invest up to 25% of its total assets in the MassMutual Select Cayman Global Allocation Fund I, Ltd. (the “Select Cayman Fund”); the Select Cayman Fund is a wholly-owned and controlled subsidiary of the BlackRock Global Allocation Fund, which seeks to invest primarily in commodities and commodities-related investments. BlackRock, the BlackRock Global Allocation Fund’s subadviser, is the investment adviser for the Select Cayman Fund. The Select Cayman Fund (unlike the BlackRock Global Allocation Fund) may invest without limitation in commodities and commodities-related investments. The Select Cayman Fund is a company organized under the laws of the Cayman Islands, and is overseen by its own board of directors (all of whom are currently employees of Massachusetts Mutual Life Insurance Company (“MassMutual”). The BlackRock Global Allocation Fund is the sole shareholder of the Select Cayman Fund, and shares of the Select Cayman Fund are not sold or offered to other investors.
State Street Bank and Trust Company (“State Street”) provides administrative services to the Select Cayman Fund. The Select Cayman Fund has also entered into separate contracts for the provision of custody, transfer agency, and audit services with the same or with affiliates of the same service providers that provide those services to the BlackRock Global Allocation Fund.
B-4
The financial statements of the Select Cayman Fund will be consolidated with the Trust’s Annual and Semiannual Reports provided to shareholders. The Trust’s Annual and Semiannual Reports are distributed to shareholders.
There is no guarantee that the BlackRock Global Allocation Fund’s investment in the Select Cayman Fund will achieve the desired purpose. Changes in the laws of the United States and/or the Cayman Islands could result in the inability of the BlackRock Global Allocation Fund and/or the Select Cayman Fund to operate as described in the BlackRock Global Allocation Fund’s Prospectus and this SAI and could adversely affect the BlackRock Global Allocation Fund. For example, the Cayman Islands does not currently impose any income, corporate, or capital gains tax, estate duty, inheritance tax, gift tax, or withholding tax on the Select Cayman Fund. If Cayman Islands law changes such that the Select Cayman Fund must pay Cayman Islands taxes, BlackRock Global Allocation Fund shareholders would likely experience decreased investment returns. However, the Select Cayman Fund has applied for and received an undertaking from the Governor-in-Cabinet of the Cayman Islands that provides that, in accordance with section 6 of the Tax Concessions Law (1999 Revision) of the Cayman Islands, for a period of 20 years from the date of the undertaking, no law which is enacted in the Cayman Islands imposing any tax to be levied on profits, income, gains, or appreciations shall apply to the Select Cayman Fund or its operations and, in addition, that no tax to be levied on profits, income, gains, or appreciations or which is in the nature of estate duty or inheritance tax shall be payable (i) on or in respect of the shares, debentures, or other obligations of the Select Cayman Fund, or (ii) by way of the withholding in whole or in part of a payment of dividend or other distribution of income or capital by the Select Cayman Fund to its members or a payment of principal or interest or other sums due under a debenture or other obligation of the Select Cayman Fund.
The Select Cayman Fund has appointed CT Corporation System, located at 111 Eighth Avenue, New York, New York 10011, as agent in the United States for service of process in any suit, action, or proceeding before the Securities and Exchange Commission (“SEC”) or any appropriate court.
See “Taxation” below for a discussion of special U.S. federal income tax considerations related to the BlackRock Global Allocation Fund’s investment in the Select Cayman Fund.
Commodities-Related Investments. The Select Cayman Fund may hold investments in issuers with significant exposures to commodities, including, without limitation, exchange-traded funds (“ETFs”), and through these investments may be exposed to the risks of investing in commodities. In addition, the Select Cayman Fund may, but will not necessarily, invest in instruments that provide exposure to, and are subject to the risks of, investments in commodities. These may include, by way of example, futures contracts, options, swaps, asset-based securities, and other instruments, the return on which is dependent upon the return of one or more commodities or commodity indices. Commodities may include, among other things, oil, gas, coal, alternative energy, electricity, steel, timber, agricultural products, precious metals (e.g., gold, silver, platinum, and palladium), livestock, industrial metals, and other resources.
Commodity prices (including precious metals) can be extremely volatile and exposure to commodities can cause the net asset value (“NAV”) of the Fund’s shares to decline or fluctuate in a rapid and unpredictable manner. The values of physical commodities or commodity-linked derivative investments may be affected by, among other things, unpredictable monetary and political policies, such as currency devaluations or revaluations, economic and social conditions within a country, trade imbalances, or trade or currency restrictions between countries; real or perceived inflationary trends; changes in interest rates; population growth and changing demographics; international, political or political developments; energy conservation; changes in the costs of discovering, developing, refining, transporting, and storing commodities; the success of commodity exploration projects; tax and other government regulations; temporary or long term price dislocations and inefficiencies in commodity markets generally or in the market for a particular commodity; and natural phenomena such as drought, floods, and other adverse weather conditions and livestock disease. In addition, commodity prices may experience high degrees of volatility in response to actual or anticipated changes in economic and market conditions generally or as a result of speculation by investors generally. Commodity prices may be more or less
B-5
volatile than securities of companies engaged in commodity-related businesses. A liquid secondary market may not exist for certain commodity investments, which may make it difficult for the Fund to sell them at a desirable price or at the price at which it is carrying them. Investments in commodity-related companies are subject to the risk that the performance of such companies may not correlate with the broader equity market or with returns on commodity investments to the extent expected by the investment adviser or subadviser. Such companies may be significantly affected by import controls, worldwide competition, changes in consumer sentiment, and spending, and can be subject to liability for, among other things, environmental damage, depletion of resources, and mandated expenditures for safety and pollution control.
S&P 500 Index Fund, S&P Mid Cap Index Fund, Russell 2000 Small Cap Index Fund, and MSCI EAFE International Index Fund
Tracking Error. There are several reasons why the performance of the S&P 500 Index Fund, S&P Mid Cap Index Fund, Russell 2000 Small Cap Index Fund, and MSCI EAFE International Index Fund may not track its respective index exactly. Unlike the indexes, the Funds incur administrative expenses and transaction costs in trading stocks. In addition, the composition of the indexes and each Fund’s portfolio may occasionally diverge. Furthermore, the timing and magnitude of cash inflows from investors buying shares could create balances of uninvested cash for the Funds. Conversely, the timing and magnitude of cash outflows to investors selling shares could require ready reserves of uninvested cash. Either situation would likely cause a Fund’s performance to deviate from the “fully invested” index. The Funds’ subadviser, NTI, seeks a correlation of 95% or better between the performance of each Fund, before expenses, and its respective index. A figure of 100% would indicate perfect correlation.
Disclaimer. The S&P 500 Index and S&P MidCap 400 Index are each a product of S&P Dow Jones Indices LLC (“SPDJI”), and have been licensed for use by MML Advisers. Standard & Poor’s®, S&P®, S&P 500®, and S&P MidCap 400® are registered trademarks of Standard & Poor’s Financial Services LLC (“S&P”); Dow Jones® is a registered trademark of Dow Jones Trademark Holdings LLC (“Dow Jones”); and these trademarks have been licensed for use by SPDJI and sublicensed for certain purposes by MML Advisers. The S&P 500 Index Fund and S&P Mid Cap Index Fund are not sponsored, endorsed, sold or promoted by SPDJI, Dow Jones, S&P, any of their respective affiliates (collectively, “S&P Dow Jones Indices”). S&P Dow Jones Indices makes no representation or warranty, express or implied, to the owners of the S&P 500 Index Fund or the S&P Mid Cap Index Fund or any member of the public regarding the advisability of investing in securities generally or in the S&P 500 Index Fund or the S&P Mid Cap Index Fund particularly or the ability of the S&P 500 Index or the S&P MidCap 400 Index to track general market performance. S&P Dow Jones Indices’ only relationship to MML Advisers with respect to the S&P 500 Index or the S&P MidCap 400 Index is the licensing of each Index and certain trademarks, service marks and/or trade names of S&P Dow Jones Indices or its licensors. The S&P 500 Index and S&P MidCap 400 Index are determined, composed and calculated by S&P Dow Jones Indices without regard to MML Advisers or the S&P 500 Index Fund and S&P Mid Cap Index Fund, as applicable. S&P Dow Jones Indices have no obligation to take the needs of MML Advisers or the owners of S&P 500 Index Fund or the S&P Mid Cap Index Fund into consideration in determining, composing or calculating the S&P 500 Index or the S&P MidCap 400 Index. S&P Dow Jones Indices is not responsible for and has not participated in the determination of the prices, and amount of the S&P 500 Index Fund or the S&P Mid Cap Index Fund or the timing of the issuance or sale of the S&P 500 Index Fund or the S&P Mid Cap Index Fund or in the determination or calculation of the equation by which the S&P 500 Index Fund or the S&P Mid Cap Index Fund are to be converted into cash, surrendered or redeemed, as the case may be. S&P Dow Jones Indices has no obligation or liability in connection with the administration, marketing or trading of the S&P 500 Index Fund or the S&P Mid Cap Index Fund. There is no assurance that investment products based on the S&P 500 Index or the S&P MidCap 400 Index will accurately track index performance or provide positive investment returns. S&P Dow Jones Indices LLC is not an investment adviser. Inclusion of a security within an index is not a recommendation by S&P Dow Jones Indices to buy, sell, or hold such security, nor is it considered to be investment advice. Notwithstanding the foregoing, CME Group Inc. and its affiliates may independently issue and/or sponsor financial products unrelated to the S&P 500 Index Fund or the S&P Mid Cap Index Fund
B-6
currently being issued by MML Advisers, but which may be similar to and competitive with the S&P 500 Index Fund and S&P Mid Cap Index Fund. In addition, CME Group Inc. and its affiliates may trade financial products which are linked to the performance of the S&P 500 Index and S&P MidCap 400 Index.
S&P DOW JONES INDICES DOES NOT GUARANTEE THE ADEQUACY, ACCURACY, TIMELINESS AND/OR THE COMPLETENESS OF THE S&P 500 INDEX OR THE S&P MIDCAP 400 INDEX OR ANY DATA RELATED THERETO OR ANY COMMUNICATION, INCLUDING BUT NOT LIMITED TO, ORAL OR WRITTEN COMMUNICATION (INCLUDING ELECTRONIC COMMUNICATIONS) WITH RESPECT THERETO. S&P DOW JONES INDICES SHALL NOT BE SUBJECT TO ANY DAMAGES OR LIABILITY FOR ANY ERRORS, OMISSIONS, OR DELAYS THEREIN. S&P DOW JONES INDICES MAKES NO EXPRESS OR IMPLIED WARRANTIES, AND EXPRESSLY DISCLAIMS ALL WARRANTIES, OF MERCHANTABILITY OR FITNESS FOR A PARTICULAR PURPOSE OR USE OR AS TO RESULTS TO BE OBTAINED BY MML ADVISERS, OWNERS OF THE S&P 500 INDEX FUND OR THE S&P MID CAP INDEX FUND, OR ANY OTHER PERSON OR ENTITY FROM THE USE OF THE S&P 500 INDEX OR THE S&P MIDCAP 400 INDEX OR WITH RESPECT TO ANY DATA RELATED THERETO. WITHOUT LIMITING ANY OF THE FOREGOING, IN NO EVENT WHATSOEVER SHALL S&P DOW JONES INDICES BE LIABLE FOR ANY INDIRECT, SPECIAL, INCIDENTAL, PUNITIVE, OR CONSEQUENTIAL DAMAGES INCLUDING BUT NOT LIMITED TO, LOSS OF PROFITS, TRADING LOSSES, LOST TIME OR GOODWILL, EVEN IF THEY HAVE BEEN ADVISED OF THE POSSIBILITY OF SUCH DAMAGES, WHETHER IN CONTRACT, TORT, STRICT LIABILITY, OR OTHERWISE. THERE ARE NO THIRD PARTY BENEFICIARIES OF ANY AGREEMENTS OR ARRANGEMENTS BETWEEN S&P DOW JONES INDICES AND MML ADVISERS, OTHER THAN THE LICENSORS OF S&P DOW JONES INDICES.
Russell reserves the right, at any time and without notice, to alter, amend, terminate or in any way change the Russell Indexes. Russell has no obligation to take the needs of any particular fund or its participants or any other product or person into consideration in determining, composing or calculating any of the Russell Indexes.
Russell’s publication of the Russell Indexes in no way suggests or implies an opinion by Russell as to the attractiveness or appropriateness of investment in any or all securities upon which the Russell Indexes are based. RUSSELL MAKES NO REPRESENTATION, WARRANTY, OR GUARANTEE AS TO THE ACCURACY, COMPLETENESS, RELIABILITY, OR OTHERWISE OF THE RUSSELL INDEXES OR ANY DATA INCLUDED IN THE RUSSELL INDEXES. RUSSELL MAKES NO REPRESENTATION, WARRANTY OR GUARANTEE REGARDING THE USE, OR THE RESULTS OF USE, OF THE RUSSELL INDEXES OR ANY DATA INCLUDED THEREIN, OR ANY SECURITY (OR COMBINATION THEREOF) COMPRISING THE RUSSELL INDEXES. RUSSELL MAKES NO OTHER EXPRESS OR IMPLIED WARRANTY, AND EXPRESSLY DISCLAIMS ANY WARRANTY, OF ANY KIND, INCLUDING WITHOUT LIMITATION, ANY WARRANTY OF MERCHANTABILITY OR FITNESS FOR A PARTICULAR PURPOSE WITH RESPECT TO THE RUSSELL INDEX(ES) OR ANY DATA OR ANY SECURITY (OR COMBINATION THEREOF) INCLUDED THEREIN.
THE MSCI EAFE INTERNATIONAL INDEX FUND IS NOT SPONSORED, ENDORSED, SOLD OR PROMOTED BY MSCI INC. (“MSCI”), ANY OF ITS AFFILIATES, ANY OF ITS INFORMATION PROVIDERS OR ANY OTHER THIRD PARTY INVOLVED IN, OR RELATED TO, COMPILING, COMPUTING OR CREATING ANY MSCI INDEX (COLLECTIVELY, THE “MSCI PARTIES”). THE MSCI INDEXES ARE THE EXCLUSIVE PROPERTY OF MSCI. MSCI AND THE MSCI INDEX NAMES ARE SERVICE MARK(S) OF MSCI OR ITS AFFILIATES AND HAVE BEEN LICENSED FOR USE FOR CERTAIN PURPOSES BY MASSMUTUAL. NONE OF THE MSCI PARTIES MAKES ANY REPRESENTATION OR WARRANTY, EXPRESS OR IMPLIED, TO THE ISSUER OR OWNERS OF THIS FUND OR ANY OTHER PERSON OR ENTITY REGARDING THE ADVISABILITY OF INVESTING IN FUNDS GENERALLY OR IN THIS FUND PARTICULARLY OR THE ABILITY OF ANY MSCI INDEX TO TRACK CORRESPONDING STOCK MARKET PERFORMANCE. MSCI OR ITS AFFILIATES ARE THE
B-7
LICENSORS OF CERTAIN TRADEMARKS, SERVICE MARKS AND TRADE NAMES AND OF THE MSCI INDEXES WHICH ARE DETERMINED, COMPOSED AND CALCULATED BY MSCI WITHOUT REGARD TO THIS FUND OR THE ISSUER OR OWNERS OF THIS FUND OR ANY OTHER PERSON OR ENTITY. NONE OF THE MSCI PARTIES HAS ANY OBLIGATION TO TAKE THE NEEDS OF THE ISSUER OR OWNERS OF THIS FUND OR ANY OTHER PERSON OR ENTITY INTO CONSIDERATION IN DETERMINING, COMPOSING OR CALCULATING THE MSCI INDEXES. NONE OF THE MSCI PARTIES IS RESPONSIBLE FOR OR HAS PARTICIPATED IN THE DETERMINATION OF THE TIMING OF, PRICES AT, OR QUANTITIES OF THIS FUND TO BE ISSUED OR IN THE DETERMINATION OR CALCULATION OF THE EQUATION BY OR THE CONSIDERATION INTO WHICH THIS FUND IS REDEEMABLE. FURTHER, NONE OF THE MSCI PARTIES HAS ANY OBLIGATION OR LIABILITY TO THE ISSUER OR OWNERS OF THIS FUND OR ANY OTHER PERSON OR ENTITY IN CONNECTION WITH THE ADMINISTRATION, MARKETING OR OFFERING OF THIS FUND.
ALTHOUGH MSCI SHALL OBTAIN INFORMATION FOR INCLUSION IN OR FOR USE IN THE CALCULATION OF THE MSCI INDEXES FROM SOURCES THAT MSCI CONSIDERS RELIABLE, NONE OF THE MSCI PARTIES WARRANTS OR GUARANTEES THE ORIGINALITY, ACCURACY AND/OR THE COMPLETENESS OF ANY MSCI INDEX OR ANY DATA INCLUDED THEREIN. NONE OF THE MSCI PARTIES MAKES ANY WARRANTY, EXPRESS OR IMPLIED, AS TO RESULTS TO BE OBTAINED BY THE ISSUER OF THE FUND, OWNERS OF THE FUND, OR ANY OTHER PERSON OR ENTITY, FROM THE USE OF ANY MSCI INDEX OR ANY DATA INCLUDED THEREIN. NONE OF THE MSCI PARTIES SHALL HAVE ANY LIABILITY FOR ANY ERRORS, OMISSIONS OR INTERRUPTIONS OF OR IN CONNECTION WITH ANY MSCI INDEX OR ANY DATA INCLUDED THEREIN. FURTHER, NONE OF THE MSCI PARTIES MAKES ANY EXPRESS OR IMPLIED WARRANTIES OF ANY KIND, AND THE MSCI PARTIES HEREBY EXPRESSLY DISCLAIM ALL WARRANTIES OF MERCHANTABILITY AND FITNESS FOR A PARTICULAR PURPOSE, WITH RESPECT TO EACH MSCI INDEX AND ANY DATA INCLUDED THEREIN. WITHOUT LIMITING ANY OF THE FOREGOING, IN NO EVENT SHALL ANY OF THE MSCI PARTIES HAVE ANY LIABILITY FOR ANY DIRECT, INDIRECT, SPECIAL, PUNITIVE, CONSEQUENTIAL OR ANY OTHER DAMAGES (INCLUDING LOST PROFITS) EVEN IF NOTIFIED OF THE POSSIBILITY OF SUCH DAMAGES.
Asset-Based Securities
A Fund may invest in debt, preferred, or convertible securities, the principal amount, redemption terms, or conversion terms of which are related to the market price of some natural resource asset such as gold bullion. These securities are referred to as “asset-based securities.” If an asset-based security is backed by a bank letter of credit or other similar facility, the investment adviser or subadviser may take such backing into account in determining the creditworthiness of the issuer. While the market prices for an asset-based security and the related natural resource asset generally are expected to move in the same direction, there may not be perfect correlation in the two price movements. Asset-based securities may not be secured by a security interest in or claim on the underlying natural resource asset. The asset-based securities in which a Fund may invest may bear interest or pay preferred dividends at below market (or even relatively nominal) rates. Certain asset-based securities may be payable at maturity in cash at the stated principal amount or, at the option of the holder, directly in a stated amount of the asset to which it is related. In such instance, because no Fund presently intends to invest directly in natural resource assets, a Fund would sell the asset-based security in the secondary market, to the extent one exists, prior to maturity if the value of the stated amount of the asset exceeds the stated principal amount and thereby realize the appreciation in the underlying asset. Certain restrictions imposed on the Funds by the Internal Revenue Code of 1986, as amended (the “Code”), may limit the Funds’ ability to invest in certain natural resource-based securities.
Precious Metal-Related Securities. A Fund may invest in the equity securities of companies that explore for, extract, process, or deal in precious metals (e.g., gold, silver, and platinum), and in asset-based securities indexed to the value of such metals. Such securities may be purchased when they are believed to be attractively priced in relation to the value of a company’s precious metal-related assets or when the values of precious metals are
B-8
expected to benefit from inflationary pressure or other economic, political, or financial uncertainty or instability. Based on historical experience, during periods of economic or financial instability the securities of companies involved in precious metals may be subject to extreme price fluctuations, reflecting the high volatility of precious metal prices during such periods. In addition, the instability of precious metal prices may result in volatile earnings of precious metal-related companies, which may, in turn, adversely affect the financial condition of such companies.
The major producers of gold include the Republic of South Africa, Russia, Canada, the United States, Brazil, and Australia. Sales of gold by Russia are largely unpredictable and often relate to political and economic considerations rather than to market forces. Economic, financial, social, and political factors within South Africa may significantly affect South African gold production.
Bank Capital Securities
Certain of the Funds may invest in bank capital securities. Bank capital securities are issued by banks to help fulfill their regulatory capital requirements. Many bank capital securities are commonly thought of as hybrids of debt and preferred stock. Some bank capital securities are perpetual (with no maturity date), callable, and have a cumulative interest deferral feature. This means that under certain conditions, the issuer bank can withhold payment of interest until a later date, likely increasing the credit and interest rate risks of an investment in those securities.
Bank Loans
Certain of the Funds may invest in bank loans including, for example, corporate loans, loan participations, direct debt, bank debt, and bridge debt. A Fund may invest in a loan by lending money to a borrower directly as part of a syndicate of lenders. In a syndicated loan, the agent that originated and structured the loan typically administers and enforces the loan on behalf of the syndicate. In such cases, the agent is normally responsible for the collection of principal and interest payments from the borrower and the apportionment of these payments to the credit of all institutions that are parties to the loan agreement. A Fund will generally rely on the agent to receive and forward to the Fund its portion of the principal and interest payments on the loan. Failure by the agent to fulfill its obligations may delay or adversely affect receipt of payment by a Fund.
A Fund may invest in loans through novations, assignments, and participation interests. In a novation, a Fund typically assumes all of the rights of a lending institution in a loan, including the right to receive payments of principal and interest and other amounts directly from the borrower and to enforce its rights as a lender directly against the borrower. When a Fund takes an assignment of a loan, the Fund acquires some or all of the interest of another lender (or assignee) in the loan. In such cases, the Fund may be required generally to rely upon the assignor to demand payment and enforce rights under the loan. (There may be one or more assignors prior in time to the Fund.) If a Fund acquires a participation in the loan made by a third party loan investor, the Fund typically will have a contractual relationship only with the loan investor, not with the borrower. As a result, a Fund may have the right to receive payments of principal, interest, and any fees to which it is entitled only from the loan investor selling the participation and only upon receipt by such loan investor of such payments from the borrower. In connection with participations, a Fund generally will have no right to enforce compliance by the borrower with the terms of the loan agreement, nor any rights with respect to any funds acquired by other loan investors through set-off against the borrower, and the Fund may not directly benefit from the collateral supporting the loan in which it has purchased the participation. As a result, a Fund assumes the credit risk of both the borrower and the loan investor selling the participation. In the event of the insolvency of the loan investor selling a participation, a Fund may be treated as a general creditor of such loan investor. In addition, because loan participations are not generally rated by independent credit rating agencies, a decision by a Fund to invest in a particular loan participation will depend almost exclusively on its investment adviser’s or subadviser’s credit analysis of the borrower.
B-9
Loans in which a Fund may invest are subject generally to the same risks as debt securities in which the Fund may invest. In addition, loans in which a Fund may invest, including bridge loans, are generally made to finance internal growth, mergers, acquisitions, stock repurchases, leveraged buy-outs, and other corporate activities, including bridge loans. A significant portion of the loans purchased by a Fund may represent interests in loans made to finance highly leveraged corporate acquisitions, known as “leveraged buy-out” transactions, leveraged recapitalization loans, and other types of acquisition financing. The highly leveraged capital structure of the borrowers in such transactions may make such loans especially vulnerable to adverse changes in economic or market conditions.
Loans generally are subject to restrictions on transfer, and only limited opportunities may exist to sell loans in secondary markets. In some cases, negotiations involved in disposing of indebtedness may require weeks to complete. As a result, a Fund may be unable to sell loans at a time when it may otherwise be desirable to do so or may be able to sell them only at a price that is less than their fair market value. The settlement time for certain loans is longer than the settlement time for many other types of investments, and a Fund may not receive the payment for a loan sold by it until well after the sale; that cash would be unavailable for payment of redemption proceeds or for reinvestment.
Certain of the loans acquired by a Fund may involve revolving credit facilities under which a borrower may from time to time borrow and repay amounts up to the maximum amount of the facility. In such cases, the Fund would have an obligation to advance its portion of such additional borrowings upon the terms specified in the loan participation. A Fund may be required to fund such advances at times and in circumstances where the Fund might not otherwise choose to make a loan to the borrower.
The value of collateral, if any, securing a loan can decline, or may be insufficient to meet the borrower’s obligations or difficult to liquidate, or a Fund may be prevented or delayed from realizing the collateral. In addition, a Fund’s access to collateral may be limited by bankruptcy or other insolvency laws. If a secured loan is foreclosed, a Fund could become part owner of any collateral, and would bear the costs and liabilities associated with owning and disposing of the collateral. A bankruptcy or restructuring can result in the loan being converted to an equity ownership interest in the borrower. In addition, under legal theories of lender liability, a Fund potentially might be held liable as a co-lender.
Loans may not be considered “securities,” and a Fund that purchases a loan may not be entitled to rely on anti-fraud and other protections under the federal securities laws.
Banking Relationships
NTI and its affiliates, including its parent Northern Trust Corporation, deal, trade, and invest for their own account in the types of securities in which the S&P 500 Index Fund, S&P Mid Cap Index Fund, Russell 2000 Small Cap Index Fund, and MSCI EAFE International Index Fund may invest and may have deposit, loan, and commercial banking relationships with the issuers of securities purchased by the Funds.
Below Investment Grade Debt Securities
A Fund may purchase below investment grade debt securities, sometimes referred to as “junk” or “high yield” bonds. The lower ratings of certain securities held by a Fund reflect a greater possibility that adverse changes in the financial condition of the issuer, or in general economic conditions, or both, or an unanticipated rise in interest rates, may impair the ability of the issuer to make payments of interest and principal. The inability (or perceived inability) of issuers to make timely payment of interest and principal would likely make the values of securities held by the Fund more volatile and could limit the Fund’s ability to sell its securities at prices approximating the values a Fund had placed on such securities. In the absence of a liquid trading market for securities held by it, the Fund may be unable at times to establish the fair market value of such securities. The rating assigned to a security by Standard & Poor’s Ratings Group (“S&P”) or Moody’s Investors Service, Inc. (“Moody’s”) does not reflect an assessment of the volatility of the security’s market value or of the liquidity of an investment in the security. (The term “below investment grade debt securities” includes securities that are not
B-10
rated but are considered by a Fund’s investment adviser or subadviser to be of comparable quality to other below investment grade debt securities.)
Like those of other fixed income securities, the values of below investment grade debt securities fluctuate in response to changes in interest rates. Thus, a decrease in interest rates generally will result in an increase in the value of a Fund’s fixed income securities. Conversely, during periods of rising interest rates, the value of a Fund’s fixed income securities generally will decline. In addition, the values of such securities are also affected by changes in general economic conditions and business conditions, which are more likely to lead to a weakened capacity to make principal and interest payments than in the case of higher grade securities. Changes by recognized rating services in their ratings of any fixed income security and in the ability of an issuer to make payments of interest and principal may also affect the value of these investments. Changes in the values of portfolio securities generally will not affect cash income derived from such securities, but will affect the Fund’s NAV.
Issuers of below investment grade debt securities are often highly leveraged, so that their ability to service their debt obligations during an economic downturn or during sustained periods of rising interest rates may be impaired. In the past, economic downturns or an increase in interest rates have, under certain circumstances, resulted in a higher incidence of default by the issuers of these instruments and may do so in the future, especially in the case of highly leveraged issuers. In addition, such issuers may not have more traditional methods of financing available to them, and may be unable to repay debt at maturity by refinancing. The risk of loss due to default in payment of interest or principal by such issuers is significantly greater because such securities frequently are unsecured and subordinated to the prior payment of senior indebtedness. Certain of the below investment grade debt securities in which a Fund may invest are issued to raise funds in connection with the acquisition of a company, in so-called “leveraged buy-out” transactions. The highly leveraged capital structure of such issuers may make them especially vulnerable to adverse changes in economic conditions.
Under adverse market or economic conditions or in the event of adverse changes in the financial condition of the issuer, a Fund could find it more difficult to sell below investment grade debt securities when the Fund’s investment adviser or subadviser believes it advisable to do so or may be able to sell such securities only at prices lower than might otherwise be available. In many cases, below investment grade debt securities may be purchased in private placements and, accordingly, will be subject to restrictions on resale as a matter of contract or under securities laws. Under such circumstances, it may also be more difficult to determine the fair values of such securities for purposes of computing a Fund’s NAV. In order to enforce its rights in the event of a default under below investment grade debt securities, a Fund may be required to take possession of and manage assets securing the issuer’s obligations on such securities, which may increase the Fund’s operating expenses and adversely affect the Fund’s NAV. A Fund may also be limited in its ability to enforce its rights and may incur greater costs in enforcing its rights in the event an issuer becomes the subject of bankruptcy proceedings. In addition, the Funds’ intention to qualify as “regulated investment companies” under the Code may limit the extent to which a Fund may exercise its rights by taking possession of such assets.
Certain securities held by a Fund may permit the issuer at its option to “call,” or redeem, its securities. If an issuer were to redeem securities held by a Fund during a time of declining interest rates, the Fund may not be able to reinvest the proceeds in securities providing the same investment return as the securities redeemed.
The prices for below investment grade debt securities may be affected by legislative and regulatory developments. Below investment grade debt securities may also be subject to certain risks not typically associated with “investment grade” securities, such as the following: (i) reliable and objective information about the value of below investment grade debt securities may be difficult to obtain because the market for such securities may be thinner and less active than that for investment grade obligations; (ii) adverse publicity and investor perceptions, whether or not based on fundamental analysis, may decrease the values and liquidity of lower than investment grade obligations, and, in turn, adversely affect their market; (iii) companies that issue below investment grade debt securities may be in the growth stage of their development, or may be financially troubled or highly leveraged, so they may not have more traditional methods of financing available to them; (iv) when other institutional investors dispose of their holdings of below investment grade debt securities, the
B-11
general market and the prices for such securities could be adversely affected; and (v) the market for below investment grade debt securities could be impaired if legislative proposals to limit their use in connection with corporate reorganizations or to limit their tax and other advantages are enacted.
Borrowings
A Fund is required at all times to maintain its assets at a level at least three times the amount of all of its borrowings (the “300% asset coverage test”). Borrowings for this purpose include obligations under any futures contract on a debt obligation. The SEC has taken the position that certain transactions, such as entering into reverse repurchase agreements, engaging in dollar roll transactions, selling securities short (other than short sales “against-the-box”), buying and selling certain derivatives (such as future contracts), and selling (or writing) put and call options, and other trading practices that have a leveraging effect on the capital structure of a fund or are economically equivalent to borrowing can be viewed as borrowing by the fund for purposes of the 1940 Act. A borrowing transaction (including, without limitation, a reverse repurchase agreement transaction) will not be considered to constitute the issuance of a “senior security” by a fund, and therefore such transaction will not be subject to the 300% asset coverage requirement otherwise applicable to borrowings by a fund, if the fund (1) maintains an offsetting financial position; (2) segregates liquid assets equal (as determined on a daily mark-to-market basis) in value to the fund’s potential economic exposure under the borrowing transaction; or (3) otherwise “covers” the transaction in accordance with SEC guidance. Any borrowings that come to exceed the 300% asset coverage requirement will be reduced within three days (not including Sundays and holidays) to the extent necessary to comply with this requirement.
Cash and Short-Term Debt Securities
Money Market Instruments Generally. The Funds may invest in money market securities, including money market funds. Money market securities are high-quality, short-term debt instruments that may be issued by the U.S. Government, corporations, banks, or other entities. They may have fixed, variable, or floating interest rates. Some money market securities in which the Funds may invest are described below.
Bank Obligations. The Funds may invest in bank obligations, including certificates of deposit, time deposits, bankers’ acceptances, and other short-term obligations of domestic banks, foreign subsidiaries of domestic banks, foreign branches of domestic banks, and domestic and foreign branches of foreign banks, domestic savings and loan associations, and other banking institutions.
Certificates of deposit (“CDs”) are negotiable certificates evidencing the obligations of a bank to repay funds deposited with it for a specified period of time. Time deposits are non-negotiable deposits maintained in a banking institution for a specified period of time at a stated interest rate. Time deposits which may be held by the Funds will not benefit from insurance from the Bank Insurance Fund or the Savings Association Insurance Fund administered by the Federal Deposit Insurance Corporation. Bankers’ acceptances are credit instruments evidencing the obligation of a bank to pay a draft drawn on it by a customer. These instruments reflect the obligation both of the bank and the drawer to pay the face amount of the instrument upon maturity. The other short-term obligations may include uninsured, direct obligations, bearing fixed, floating, or variable interest rates.
The Funds may invest in certificates of deposit and bankers’ acceptances of U.S. banks and savings and loan associations, London branches of U.S. banks, and U.S. branches of foreign banks. Obligations of foreign banks and of foreign branches of U.S. banks may be affected by foreign governmental action, including imposition of currency controls, interest limitations, withholding or other taxes, seizure of assets, or the declaration of a moratorium or restriction on payments of principal or interest. Foreign banks and foreign branches of U.S. banks may provide less public information than, and may not be subject to the same accounting, auditing, and financial recordkeeping standards as, domestic banks.
Cash, Short-Term Instruments, and Temporary Investments. The Funds may hold a significant portion of their assets in cash or cash equivalents at the sole discretion of the Fund’s investment adviser or subadviser. The Funds’ investment adviser or subadvisers will determine the amount of the Funds’ assets to
B-12
be held in cash or cash equivalents at their sole discretion, based on such factors as they may consider appropriate under the circumstances. The Funds may hold a portion of their assets in cash, for example, in order to provide for expenses or anticipated redemption payments or for temporary defensive purposes. The Funds may also hold a portion of their assets in cash as part of the Funds’ investment programs or asset allocation strategies, in amounts considered appropriate by the Funds’ investment adviser or subadvisers. To the extent the Funds hold assets in cash and otherwise uninvested, its investment returns may be adversely affected and the Funds may not achieve their respective investment objectives. The Funds may invest in high quality money market instruments. The instruments in which the Funds may invest include, without limitation: (i) short-term obligations issued or guaranteed by the U.S. Government, its agencies or instrumentalities (including government-sponsored enterprises); (ii) CDs, bankers’ acceptances, fixed time deposits, and other obligations of domestic banks (including foreign branches); (iii) non-convertible corporate debt securities (e.g., bonds and debentures) with remaining maturities at the date of purchase of not more than one year; (iv) repurchase agreements; and (v) short-term obligations of foreign banks (including U.S. branches).
Commercial Paper and Short-Term Corporate Debt Instruments. The Funds may invest in commercial paper (including variable amount master demand notes) consisting of short-term, unsecured promissory notes issued by corporations to finance short-term credit needs. Commercial paper is usually sold on a discount basis and, other than asset-backed commercial paper, usually has a maturity at the time of issuance not exceeding nine months. Variable amount master demand notes are demand obligations that permit the investment of fluctuating amounts at varying market rates of interest pursuant to arrangements between the issuer and a commercial bank acting as agent for the payee of such notes whereby both parties have the right to vary the amount of the outstanding indebtedness on the notes. The investment adviser or subadvisers monitor on an ongoing basis the ability of an issuer of a demand instrument to pay principal and interest on demand. The Funds also may invest in non-convertible corporate debt securities (e.g., bonds and debentures) with not more than one year remaining to maturity at the date of settlement.
Letters of Credit. Certain of the debt obligations (including municipal securities, certificates of participation, commercial paper, and other short-term obligations) which the Funds may purchase may be backed by an unconditional and irrevocable letter of credit of a bank, savings and loan association, or insurance company which assumes the obligation for payment of principal and interest in the event of default by the issuer.
Common and Preferred Stocks
Stocks represent shares of ownership in a company. Generally, preferred stock has a specified dividend and ranks after bonds and before common stocks in its claim on income for dividend payments and on assets should the company be liquidated. After other claims are satisfied, common stockholders participate in company profits on a pro-rata basis. Profits may be paid out in dividends or reinvested in the company to help it grow. Increases and decreases in earnings are usually reflected in a company’s stock price, so common stocks generally have the greatest appreciation and depreciation potential of all corporate securities. Like other equity securities, preferred stock is subject to the risk that its value may decrease based on actual or perceived changes in the business or financial condition of the issuer. In addition, changes in interest rates may adversely affect the value of a preferred stock that pays a fixed dividend.
Concentration Policy
For purposes of each Fund’s concentration limitation as disclosed in this SAI, the Funds apply such policy to direct investments in the securities of issuers in a particular industry, as determined by a Fund’s investment adviser or subadviser. A Fund’s investment adviser or subadviser may analyze the characteristics of a particular issuer and security and assign an industry or sector classification consistent with those characteristics in the event that the third party classification provider used by the investment adviser or subadviser does not assign a classification or the investment adviser or subadviser, in consultation with the Fund’s Chief Compliance Officer, determines that another industry or sector classification is more appropriate.
B-13
Convertible Securities
The Funds may invest in debt or preferred equity securities convertible into, or exchangeable for, common stock at a stated price or rate. Traditionally, convertible securities have paid dividends or interest at rates higher than common stocks but lower than nonconvertible securities. They generally participate in the appreciation or depreciation of the underlying stock into which they are convertible, but to a lesser degree. In recent years, convertibles have been developed which combine higher or lower current income with options and other features. Convertible securities are subject to the risks of debt and equity securities.
Cyber Security
With the increased use of technologies such as the Internet and the dependence on computer systems to perform business and operational functions, investment companies (such as the Funds) and their service providers (such as the Funds’ investment adviser, subadvisers, custodians, and transfer agents) may be prone to operational and information security risks resulting from cyber-attacks and/or technological malfunctions. In general, cyber-attacks are deliberate, but unintentional events may have similar effects. Cyber-attacks include, among others, stealing or corrupting data maintained online or digitally, preventing legitimate users from accessing information or services on a website, releasing confidential information without authorization, and causing operational disruption. Successful cyber-attacks against, or security breakdowns of, a Fund, the investment adviser, a subadviser, a custodian, transfer agent, or service provider may adversely affect the Fund or its shareholders. For instance, cyber-attacks may interfere with the processing of shareholder transactions, affect a Fund’s ability to calculate its NAV, cause the release of private shareholder information or confidential Fund information, impede trading, cause reputational damage, and subject the Fund to regulatory fines, penalties or financial losses, reimbursement or other compensation costs, and additional compliance costs. Cyber-attacks may render records of Fund assets and transactions, shareholder ownership of Fund shares, and other data integral to the functioning of the Fund inaccessible or inaccurate or incomplete. A Fund may also incur substantial costs for cyber security risk management in order to prevent cyber incidents in the future. A Fund and its shareholders could be negatively impacted as a result. While the Funds and their service providers have established business continuity plans and systems designed to minimize the risk of cyber-attacks through the use of technology, processes and controls, there are inherent limitations in such plans and systems, including the possibility that certain risks have not been identified given the evolving nature of this threat. The Funds rely on third-party service providers for many of their day-to-day operations, and will be subject to the risk that the protections and protocols implemented by those service providers will be ineffective to protect the Funds from cyber-attack. Similar types of cyber security risks also are present for issuers of securities in which the Funds invest, which could result in material adverse consequences for such issuers, and may cause a Fund’s investment in such securities to lose value.
Debtor-in-Possession Financings
The Funds may invest in debtor-in-possession financings (commonly known as “DIP financings”) through participation interests in direct loans, purchase of assignments, and other means. DIP financings are arranged when an entity seeks the protections of the bankruptcy court under Chapter 11 of the U.S. Bankruptcy Code (“Chapter 11”). These financings allow the entity to continue its business operations while reorganizing under Chapter 11. Such financings constitute senior liens on an unencumbered security (i.e., a security not subject to other creditors’ claims). DIP financings are generally subject to the same risks as investments in senior bank loans and similar debt instruments, but involve a greater risk of loss of principal and interest. For example, there is a risk that the entity will not emerge from Chapter 11 and be forced to liquidate its assets under Chapter 7 of the U.S. Bankruptcy Code, as well as a risk that the bankruptcy court will not approve a proposed reorganization plan or will require substantial and unfavorable changes to an initial plan. In the event of liquidation, a Fund’s only recourse will be against the property securing the DIP financing. Companies in bankruptcy may also be undergoing significant financial and operational changes that may cause their financial performance to have elevated levels of volatility. DIP financings may involve payment-in-kind interest or principal interest payments, and a Fund may receive securities of a reorganized issuer (e.g. common stock, preferred stock, warrants) in return for its investment, which may include illiquid investments and investments that are difficult to value.
B-14
Derivatives
General. Derivatives are financial instruments whose values are based on the values of one or more indicators, such as a security, asset, currency, interest rate, or index. Derivative transactions can create investment leverage and may be highly volatile. Losses from derivatives can be substantially greater than the derivatives’ original cost and can sometimes be unlimited. A Fund may not be able to close out a derivative transaction at a favorable time or price.
A Fund’s use of derivative instruments involves risks different from, and possibly greater than, the risks associated with investing directly in securities and other more traditional investments. Derivative products can be highly specialized instruments that may require investment techniques and risk analyses different from those associated with stocks and bonds. Derivatives are subject to a number of risks, such as potential changes in value in response to interest rate changes or other market developments or as a result of the counterparty’s credit quality and the risk that a derivative transaction may not have the effect a Fund’s investment adviser or subadviser anticipated. Derivatives also involve the risk of mispricing or improper valuation and the risk that changes in the value of a derivative may not correlate perfectly with the underlying asset, rate, or index. Derivative transactions can create investment leverage and may be highly volatile. When a Fund invests in a derivative instrument, it could lose more than the principal amount invested. Also, suitable derivative transactions may not be available in all circumstances, and there can be no assurance that a Fund will engage in these transactions to reduce exposure to other risks when that would be beneficial. Many derivative transactions are entered into “over the counter” (not on an exchange or contract market); as a result, the value of such a derivative transaction will depend on the ability and the willingness of the Fund’s counterparty to perform its obligations under the transaction. A Fund may be required to segregate certain of its assets on the books of its custodian with respect to derivatives transactions entered into by the Fund. A liquid secondary market may not always exist for a Fund’s derivative positions at any time. Use of derivatives may affect the amount, timing, and character of distributions to shareholders. Although the use of derivatives is intended to enhance a Fund’s performance, it may instead reduce returns and increase volatility.
A Fund may enter into cleared derivatives transactions. In a cleared derivative transaction, a Fund typically enters into the transaction with a financial institution counterparty, and performance of the transaction is effectively guaranteed by a central clearinghouse, thereby reducing or eliminating the Fund’s exposure to the credit risk of its original counterparty (although the Fund is subject to the credit risk of the clearinghouse). Counterparty risk with respect to derivatives has been and may continue to be affected by new rules and regulations concerning the derivatives market. Credit risk of market participants with respect to derivatives that are centrally cleared is concentrated in a few clearing houses, and it is not clear how an insolvency proceeding of a clearing house, or the clearing member through which the Fund holds its positions at a clearing house, would be conducted, what effect the insolvency proceeding would have on any recovery by a Fund, and what impact an insolvency of a clearing house or clearing member would have on the financial system more generally.
No Fund has the obligation to enter into derivatives transactions at any time or under any circumstances. In addition, nothing in this SAI is intended to limit in any way any purpose for which a Fund may enter into any type of derivatives transaction; a Fund may use derivatives transactions for hedging purposes or generally for purposes of enhancing its investment return.
Foreign Currency Exchange Transactions
A Fund may enter into foreign currency exchange transactions for hedging purposes in order to protect against uncertainty in the level of future foreign currency exchange rates, or for other, non-hedging purposes—for example, a Fund may take a long or short position with respect to a foreign currency in which none of the Fund’s assets or liabilities are denominated, or where the position is in excess of the amount of any such assets or liabilities, in order to take advantage of anticipated changes in the relative values of those currencies. There can be no assurance that appropriate foreign currency transactions will be available for a Fund at any time or that a Fund will enter into such transactions at any time or under any circumstances even if appropriate transactions are
B-15
available to it. A Fund may purchase or sell a foreign currency on a spot (i.e., cash) basis at the prevailing spot rate. A Fund may also enter into contracts to deliver in the future an amount of one currency in return for an amount of another currency (“forward contracts”) and may purchase and sell foreign currency futures contracts. (Foreign currency futures contracts are similar to financial futures contracts, except that they typically contemplate the delivery of foreign currencies; see “Financial Futures Contracts,” below.) A Fund may also purchase or sell options on foreign currencies or options on foreign currency futures contracts.
A Fund may enter into foreign currency exchange transactions in order to hedge against a change in the values of assets or liabilities denominated in one or more foreign currencies due to changes in currency exchange rates.
A Fund may also enter into foreign currency transactions to adjust generally the exposure of its portfolio to various foreign currencies. For example, a Fund with a large exposure to securities denominated in euros might want to continue to hold those securities, but to trade its exposure to the euro to exposure to, say, the Japanese Yen. In that case, the Fund might take a short position in the euro and a long position in the Yen. A Fund may also use foreign currency transactions to hedge the value of the Fund’s portfolio against the Fund’s benchmark index.
The value of any currency, including U.S. dollars and foreign currencies, may be affected by complex political and economic factors applicable to the issuing country. In addition, the exchange rates of foreign currencies (and therefore the values of foreign currency options, forward contracts, and futures contracts) may be affected significantly, fixed, or supported directly or indirectly by U.S. and foreign government actions. Government intervention may increase risks involved in purchasing or selling foreign currency options, forward contracts, and futures contracts, since exchange rates may not be free to fluctuate in response to other market forces. Foreign governmental restrictions or taxes could result in adverse changes in the cost of acquiring or disposing of foreign currencies.
Because foreign currency transactions occurring in the interbank market involve substantially larger amounts than those that may be involved in the use of foreign currency options, investors may be disadvantaged by having to deal in an odd lot market (generally consisting of transactions of less than $1 million) for the underlying foreign currencies at prices that are less favorable than for round lots.
There is no systematic reporting of last-sale information for foreign currencies and there is no regulatory requirement that quotations available through dealers or other market sources be firm or revised on a timely basis. Available quotation information is generally representative of very large transactions in the interbank market and thus may not reflect relatively smaller transactions (less than $1 million) where rates may be less favorable. The interbank market in foreign currencies is a global, around-the-clock market.
Currency Forward and Futures Contracts. A foreign currency forward contract involves an obligation to deliver in the future, which may be any fixed number of days from the date of the contract as agreed by the parties, an amount of one currency in return for an amount of another currency, at an exchange rate set at the time of the contract. The contracts are traded in the interbank market conducted directly between currency traders (usually large commercial banks) and their customers. A forward contract frequently has no margin requirement, and no commissions are charged for trades. A foreign currency futures contract is a standardized contract for the future delivery of a specified amount of a foreign currency at a future date at an exchange rate set at the time of the contract. Foreign currency futures contracts traded in the United States are designed by and traded on exchanges regulated by the Commodity Futures Trading Commission (the “CFTC”), such as the New York Mercantile Exchange. Foreign currency futures contracts will typically require a Fund to post both initial margin and variation margin.
Foreign currency forward contracts differ from foreign currency futures contracts in certain respects. For example, the maturity date of a forward contract may be any fixed number of days from the date of the contract agreed upon by the parties, rather than a predetermined date in a given month. Forward contracts may be in any amounts agreed upon by the parties rather than predetermined amounts. Also, forward foreign exchange contracts are traded directly between currency traders so that no intermediary is required. A forward contract generally requires no margin or other deposit.
B-16
At the maturity of a forward or futures contract, a Fund will make delivery of the currency or currencies specified in the contract in return for the other currency or currencies specified in the contract (or, if the forward contract is a non-deliverable forward contract, settle the contract on a net basis with the counterparty) or, at or prior to maturity, enter into a closing transaction involving the purchase or sale of an offsetting contract. Closing transactions with respect to forward contracts are usually effected with the currency trader who is a party to the original forward contract. Closing transactions with respect to futures contracts are effected on a commodities exchange and a clearing corporation associated with the exchange assumes responsibility for closing out such contracts.
Positions in foreign currency futures contracts and related options may be closed out only on an exchange or board of trade which provides a secondary market in such contracts or options. Although a Fund will normally purchase or sell foreign currency futures contracts and related options only on exchanges or boards of trade where there appears to be an active secondary market, there is no assurance that a secondary market on an exchange or board of trade will exist for any particular contract or option or at any particular time. In such event, it may not be possible to close a futures or related option position and, in the event of adverse price movements, a Fund would continue to be required to make daily cash payments of variation margin on its futures positions. A Fund’s ability to close out a foreign currency forward contract will depend on the willingness of its counterparty to engage in an offsetting transaction.
Because foreign currency forward contracts are private transactions between a Fund and its counterparty, any benefit of such contracts to the Fund will depend upon the willingness and ability of the counterparty to perform its obligations. In the case of a futures contract, a Fund would typically look to the commodity exchange or contract market (or its clearinghouse) for performance. Certain non-deliverable forward currency contracts are expected to become subject to mandatory clearing requirements in the future, and a Fund’s counterparty in such a case would be a central derivatives clearing organization.
Foreign Currency Options. Options on foreign currencies operate similarly to options on securities, and are traded primarily in the over-the-counter (“OTC”) market, although options on foreign currencies have recently been listed on several exchanges. Such options will be purchased or written only when an investment adviser or subadviser believes that a liquid secondary market exists for such options. There can be no assurance that a liquid secondary market will exist for a particular option at any specific time. Options on foreign currencies are affected by all of those factors which influence exchange rates and investments generally.
The value of a foreign currency option is dependent upon the value of the foreign currency and the U.S. dollar, and may have no relationship to the investment merits of a foreign security.
Foreign Currency Conversion. Although foreign exchange dealers do not charge a fee for currency conversion, they do realize a profit based on the difference (the “spread”) between prices at which they buy and sell various currencies. Thus, a dealer may offer to sell a foreign currency to a Fund at one rate, while offering a lesser rate of exchange should a Fund desire to resell that currency to the dealer.
Foreign Currency Swap Agreements. A Fund may enter into currency swaps to protect against adverse changes in exchange rates between the U.S. dollar and other currencies or as a means of making indirect investments in foreign currencies. Currency swaps involve the individually negotiated exchange by a Fund with another party of a series of payments in specified currencies in amounts determined pursuant to the terms of the swap agreement. (See “Swap Agreements and Options on Swap Agreements,” below.)
Foreign currency derivatives transactions may be highly volatile and may give rise to investment leverage.
Financial Futures Contracts
A Fund may enter into futures contracts, including interest rate futures contracts, securities index futures contracts, and futures contracts on fixed income securities (collectively referred to as “financial futures contracts”).
B-17
A Fund may use interest rate futures contracts to adjust the interest rate sensitivity (duration) of its portfolio or the credit exposure of the portfolio. Interest rate futures contracts obligate the long or short holder to take or make delivery of a specified quantity of a financial instrument, such as a specific fixed income security, during a specified future period at a specified price.
A Fund may use index futures contracts to hedge against broad market risks to its portfolio or to gain broad market exposure when it holds uninvested cash or as an inexpensive substitute for cash investments directly in securities or other assets, including commodities and precious metals. Securities index futures contracts are contracts to buy or sell units of a securities index at a specified future date at a price agreed upon when the contract is made and are settled in cash.
The following example illustrates generally the manner in which index futures contracts operate. The Standard & Poor’s 100 Stock Index (the “S&P 100 Index”) is composed of 100 selected common stocks, most of which are listed on the New York Stock Exchange (the “NYSE”). The S&P 100 Index assigns relative weightings to the common stocks included in the Index, and the Index fluctuates with changes in the market values of those common stocks. In the case of the S&P 100 Index, contracts are to buy or sell 100 units. Thus, if the value of the S&P 100 Index were $180, one contract would be worth $18,000 (100 units x $180). The stock index futures contract specifies that no delivery of the actual stocks making up the index will take place. Instead, settlement in cash must occur upon the termination of the contract, with the settlement being the difference between the contract price and the actual level of the stock index at the expiration of the contract. For example, if a Fund enters into a stock index futures contract to buy 100 units of the S&P 100 Index at a specified future date at a contract price of $180 and the S&P 100 Index is at $184 on that future date, the Fund will gain $400 (100 units x gain of $4). If the Fund enters into a stock index futures contract to sell 100 units of the stock index at a specified future date at a contract price of $180 and the S&P 100 Index is at $182 on that future date, the Fund will lose $200 (100 units x loss of $2).
Positions in financial futures contracts may be closed out only on an exchange or board of trade which provides a secondary market for such futures.
There are special risks associated with entering into financial futures contracts. The skills needed to use financial futures contracts effectively are different from those needed to select a Fund’s investments. There may be an imperfect correlation between the price movements of financial futures contracts and the price movements of the securities in which a Fund invests. There is also a risk that a Fund will be unable to close a position in a financial futures contract when desired because there is no liquid secondary market for it.
The risk of loss in trading financial futures contracts can be substantial due to the low margin deposits required and the extremely high degree of leverage involved in futures pricing. Relatively small price movements in a financial futures contract could have an immediate and substantial impact, which may be favorable or unfavorable to a Fund. It is possible for a price-related loss to exceed the amount of a Fund’s margin deposit. An investor could also suffer losses if it is unable to close out a futures contract because of an illiquid secondary market. Futures are subject to the creditworthiness of the futures commission merchant or broker and clearing organizations involved in the transaction.
Although some financial futures contracts by their terms call for the actual delivery or acquisition of securities at expiration, in most cases the contractual commitment is closed out before expiration. The offsetting of a contractual obligation is accomplished by purchasing (or selling as the case may be) on a commodities or futures exchange an identical financial futures contract calling for delivery in the same month. Such a transaction, if effected through a member of an exchange, cancels the obligation to make or take delivery of the securities. A Fund will incur brokerage fees when it purchases or sells financial futures contracts, and will be required to maintain margin deposits. If a liquid secondary market does not exist when a Fund wishes to close out a financial futures contract, it will not be able to do so and will continue to be required to make daily cash payments of variation margin in the event of adverse price movements.
B-18
Each Fund has claimed an exclusion from the definition of the term “commodity pool operator” under the Commodity Exchange Act (the “CEA”) and, therefore, is not subject to registration or regulation as a pool operator under the CEA. To be eligible to claim such an exclusion, a Fund may only use futures contracts, options on such futures, commodity options and certain swaps solely for “bona fide hedging purposes,” or must limit its use of such instruments for non-bona fide hedging purposes to certain de minimis amounts. It is possible that that exclusion may in the future cease to be available with respect to one or more Funds. In any case where the exclusion is unavailable to a Fund, additional CFTC-mandated disclosure, reporting, and recordkeeping obligations would apply with respect to that Fund. Compliance with the CFTC’s regulatory requirements could increase Fund expenses and potentially adversely affect a Fund’s total return.
Margin Payments. When a Fund purchases or sells a financial futures contract, it is required to deposit with the broker an amount of cash, U.S. Treasury bills, or other permissible collateral equal to a small percentage of the amount of the financial futures contract. This amount is known as “initial margin.” The nature of initial margin is different from that of margin in security transactions in that it does not involve borrowing money to finance transactions. Rather, initial margin is similar to a performance bond or good faith deposit that is returned to a Fund upon termination of the contract, assuming the Fund satisfies its contractual obligations.
Subsequent payments to and from the broker occur on a daily basis in a process known as “marking to market.” These payments are called “variation margin” and are made as the value of the underlying financial futures contract fluctuates. For example, when a Fund sells an index futures contract and the price of the underlying index rises above the delivery price, the Fund’s position declines in value. The Fund then pays the broker a variation margin payment equal to the difference between the delivery price of the index futures contract and the value of the index underlying the index futures contract. Conversely, if the price of the underlying index falls below the delivery price of the contract, the Fund’s futures position increases in value. The broker then must make a variation margin payment equal to the difference between the delivery price of the index futures contract and the value of the index underlying the index futures contract.
When a Fund terminates a position in a financial futures contract, a final determination of variation margin is made, additional cash is paid by or to the Fund, and the Fund realizes a loss or a gain. Such closing transactions involve additional commission costs.
Options on Financial Futures Contracts. A Fund may purchase and write call and put options on financial futures contracts. An option on a financial futures contract gives the purchaser the right, in return for the premium paid, to assume a position in a financial futures contract (a long position if the option is a call and a short position if the option is a put) at a specified exercise price at any time during the period of the option. Upon exercise of the option, the holder would assume the underlying futures position and would receive a variation margin payment of cash or securities approximating the increase in the value of the holder’s option position. If an option is exercised on the last trading day prior to the expiration date of the option, the settlement will be made entirely in cash. Purchasers of options who fail to exercise their options prior to the exercise date suffer a loss of the premium paid.
Options on Swaps. Options on swaps are similar to options on securities except that the premium paid or received is to buy or grant the right to enter into a previously agreed upon interest rate or credit default contract. Forward premium swap option contracts include premiums that have extended settlement dates. The delayed settlement of the premiums is factored into the daily valuation of the option contracts. In the case of interest rate cap and floor contracts, in return for a premium, ongoing payments between two parties are based on interest rates exceeding a specified rate, in the case of a cap contract, or falling below a specified rate in the case of a floor contract.
Special Risks of Transactions in Financial Futures Contracts and Related Options. Financial futures contracts entail risks. The risks associated with purchasing and writing put and call options on financial futures contracts can be influenced by the market for financial futures contracts. An increase in the market value of a financial futures contract on which the Fund has written an option may cause the option to be exercised. In this situation, the benefit to a Fund would be limited to the value of the exercise price of the option and, if a Fund
B-19
closes out the option, the cost of entering into the offsetting transaction could exceed the premium the Fund initially received for writing the option. In addition, a Fund’s ability to enter into an offsetting transaction depends upon the market’s demand for such financial futures contracts. If a purchased option expires unexercised, a Fund would realize a loss in the amount of the premium paid for the option.
If an investment adviser’s or subadviser’s judgment about the general direction of interest rates or markets is wrong, the overall performance may be poorer than if no financial futures contracts had been entered into.
Liquidity risks. Positions in financial futures contracts may be closed out only on an exchange or board of trade which provides a secondary market for such futures. Although the Funds intend to purchase or sell financial futures contracts only on exchanges or boards of trade where there appears to be an active secondary market, there is no assurance that a liquid secondary market on an exchange or board of trade will exist for any particular contract or at any particular time. If there is not a liquid secondary market at a particular time, it may not be possible to close a position in a financial futures contract at such time and, in the event of adverse price movements, a Fund would continue to be required to make daily cash payments of variation margin. However, in the event financial futures contracts are used to hedge portfolio securities, such securities will not generally be sold until the financial futures contracts can be terminated. In such circumstances, an increase in the price of the portfolio securities, if any, may partially or completely offset losses on the financial futures contracts.
The ability to establish and close out positions in options on financial futures contracts will be subject to the development and maintenance of a liquid secondary market. It is not certain that such a market will develop. Although a Fund generally will purchase only those options for which there appears to be an active secondary market, there is no assurance that a liquid secondary market on an exchange will exist for any particular option or at any particular time. In the event no such market exists for particular options, it might not be possible to effect closing transactions in such options, with the result that a Fund would have to exercise the options in order to realize any profit.
Hedging risks. There are several risks in connection with the use by a Fund of financial futures contracts and related options as a hedging device. One risk arises because of the imperfect correlation between movements in the prices of the financial futures contracts and options and movements in the underlying securities or index or movements in the prices of a Fund’s securities which are the subject of a hedge.
Successful use of financial futures contracts and options by a Fund for hedging purposes is also subject to an investment adviser’s or subadviser’s ability to predict correctly movements in the direction of the market. It is possible that, where a Fund has purchased puts on financial futures contracts to hedge its portfolio against a decline in the market, the securities or index on which the puts are purchased may increase in value and the value of securities held in the portfolio may decline. If this occurred, the Fund would lose money on the puts and also experience a decline in the value of its portfolio securities. In addition, the prices of financial futures contracts, for a number of reasons, may not correlate perfectly with movements in the underlying securities or index due to certain market distortions. First, all participants in the futures market are subject to margin deposit requirements. Such requirements may cause investors to close financial futures contracts through offsetting transactions which could distort the normal relationship between the underlying security or index and futures markets. Second, the margin requirements in the futures markets are less onerous than margin requirements in the securities markets in general, and as a result the futures markets may attract more speculators than the securities markets do. Increased participation by speculators in the futures markets may also cause temporary price distortions. Due to the possibility of price distortion, even a correct forecast of general market trends by an investment adviser or subadviser still may not result in a successful hedging transaction over a very short time period.
Other Risks. A Fund will incur brokerage fees in connection with its transactions in financial futures contracts and related options. In addition, while financial futures contracts and options on financial futures contracts will be purchased and sold to reduce certain risks, those transactions themselves entail certain other risks. Thus, while a Fund may benefit from the use of financial futures contracts and related options, unanticipated changes in interest rates or stock price movements may result in a poorer overall performance for the Fund than if
B-20
it had not entered into any financial futures contracts or options transactions. Moreover, in the event of an imperfect correlation between the position in the financial futures contract and the portfolio position that is intended to be protected, the desired protection may not be obtained and the Fund may be exposed to risk of loss.
Swap Agreements and Options on Swap Agreements
A Fund may engage in swap transactions, including interest rate swap agreements, credit default swaps, and total return swaps.
Swap agreements are two party contracts entered into primarily by institutional investors for periods ranging from a few weeks to more than one year. In a standard “swap” transaction, two parties agree to exchange the returns (or differentials in rates of return) earned or realized on particular predetermined investments or instruments, which may be adjusted for an interest factor. The gross returns to be exchanged or “swapped” between the parties are generally calculated with respect to a “notional amount,” (i.e., the return on or increase in value of a particular dollar amount invested at a particular interest rate or in a “basket” of securities representing a particular index). When a Fund enters into an interest rate swap, it typically agrees to make payments to its counterparty based on a specified long- or short-term interest rate, and will receive payments from its counterparty based on another interest rate. Other forms of swap agreements include interest rate caps, under which, in return for a specified payment stream, one party agrees to make payments to the other to the extent that interest rates exceed a specified rate, or “cap”; interest rate floors, under which, in return for a specified payment stream, one party agrees to make payments to the other to the extent that interest rates fall below a specified rate, or “floor”; and interest rate collars, under which a party sells a cap and purchases a floor or vice versa in an attempt to protect itself against interest rate movements exceeding given minimum or maximum levels. A Fund may enter into an interest rate swap in order, for example, to hedge against the effect of interest rate changes on the value of specific securities in its portfolio, or to adjust the interest rate sensitivity (duration) or the credit exposure of its portfolio overall, or otherwise as a substitute for a direct investment in debt securities.
A Fund may enter into total return swaps. In a total return swap, one party typically agrees to pay to the other a short-term interest rate in return for a payment at one or more times in the future based on the increase in the value of an underlying security or other asset, or index of securities or assets; if the underlying security, asset, or index declines in value, the party that pays the short-term interest rate must also pay to its counterparty a payment based on the amount of the decline. A Fund may take either side of such a swap, and so may take a long or short position in the underlying security, asset, or index. A Fund may enter into a total return swap to hedge against an exposure in its portfolio (including to adjust the duration or credit quality of a Fund’s bond portfolio) or generally to put cash to work efficiently in the markets in anticipation of, or as a replacement for, cash investments. A Fund may also enter into a total return swap to gain exposure to securities or markets in which it might not be able to invest directly (in so-called market access transactions).
A Fund also may enter into credit default swap transactions. In a credit default swap, one party provides what is in effect insurance against a default or other adverse credit event affecting an issuer of debt securities (typically referred to as a “reference entity”). In general, the protection “buyer” in a credit default swap is obligated to pay the protection “seller” an upfront amount or a periodic stream of payments over the term of the swap. If a “credit event” occurs, the buyer has the right to deliver to the seller bonds or other obligations of the reference entity (with a value up to the full notional value of the swap), and to receive a payment equal to the par value of the bonds or other obligations. Credit events that would trigger a request that the seller make payment are specific to each credit default swap agreement, but generally include bankruptcy, failure to pay, restructuring, obligation acceleration, obligation default, or repudiation/moratorium. A Fund may be either the buyer or seller in a credit default swap transaction. When a Fund buys protection, it may or may not own securities of the reference entity. If it does own securities of the reference entity, the swap serves as a hedge against a decline in the value of the securities due to the occurrence of a credit event involving the issuer of the securities. If the Fund does not own securities of the reference entity, the credit default swap may be seen to create a short position in the reference entity. If a Fund is a buyer and no credit event occurs, the Fund will typically recover nothing under the swap, but will have had to pay the required upfront payment or stream of continuing payments under the swap. When a Fund
B-21
sells protection under a credit default swap, the position may have the effect of creating leverage in the Fund’s portfolio through the Fund’s indirect long exposure to the issuer or securities on which the swap is written. When a Fund sells protection, it may do so either to earn additional income or to create such a “synthetic” long position. Credit default swaps involve general market risks, illiquidity risk, counterparty risk, and credit risk.
A Fund may also enter into options on swap agreements (“swaptions”). A swaption is a contract that gives a counterparty the right (but not the obligation) to enter into a new swap agreement or to shorten, extend, cancel, or otherwise modify an existing swap agreement, at some designated future time on specified terms. A Fund may write (sell) and purchase put and call swaptions. Depending on the terms of the particular option agreement, a Fund will generally incur a greater degree of risk when it writes a swaption than it will incur when it purchases a swaption. When a Fund purchases a swaption, it risks losing only the amount of the premium it has paid should it decide to let the option expire unexercised. However, when a Fund writes a swaption, upon exercise of the option the Fund will become obligated according to the terms of the underlying agreement. A Fund may enter into swaptions for the same purposes as swaps.
Whether a Fund’s use of swap agreements or swaptions will be successful will depend on the investment adviser’s or subadviser’s ability to predict correctly whether certain types of investments are likely to produce greater returns than other investments. Moreover, a Fund bears the risk of loss of the amount expected to be received under a swap agreement in the event of the default or bankruptcy of a swap agreement counterparty. Certain restrictions imposed on the Funds by the Code may limit the Funds’ ability to use swap agreements. The swap market is largely unregulated. It is possible that developments in the swaps market, including potential government regulation, could adversely affect a Fund’s ability to terminate existing swap agreements or to realize amounts to be received under such agreements.
Swaps are highly specialized instruments that require investment techniques, risk analyses, and tax planning different from those associated with traditional investments. The use of a swap requires an understanding not only of the referenced asset, reference rate, or index but also of the swap itself, without the benefit of observing the performance of the swap under all possible market conditions. Because they are two party contracts that may be subject to contractual restrictions on transferability and termination and because they may have terms of greater than seven days, swap agreements may be considered to be illiquid and subject to a Fund’s limitation on investments in illiquid securities. To the extent that a swap is not liquid, it may not be possible to initiate a transaction or liquidate a position at an advantageous time or price, which may result in significant losses.
Like most other investments, swap agreements are subject to the risk that the market value of the instrument will change in a way detrimental to a Fund’s interest. A Fund bears the risk that an investment adviser or subadviser will not accurately forecast future market trends or the values of assets, reference rates, indexes, or other economic factors in establishing swap positions for the Fund. If an investment adviser or subadviser attempts to use a swap as a hedge against, or as a substitute for, a portfolio investment, the Fund will be exposed to the risk that the swap will have or will develop imperfect or no correlation with the portfolio investment. This could cause substantial losses for the Fund. While hedging strategies involving swap instruments can reduce the risk of loss, they can also reduce the opportunity for gain or even result in losses by offsetting favorable price movements in other Fund investments. Many swaps are complex and often valued subjectively.
Counterparty risk with respect to derivatives has been and may continue to be affected by new rules and regulations concerning the derivatives market. Some derivatives transactions, including many interest rate, index, and credit default swaps, are required to be centrally cleared, and a party to a cleared derivatives transaction is subject to the credit risk of the clearing house and the clearing member through which it holds the position, rather than the credit risk of its original counterparty to the derivatives transaction. Credit risk of market participants with respect to derivatives that are centrally cleared is concentrated in a few clearing houses and clearing members, and it is not clear how an insolvency proceeding of a clearing house or clearing member would be conducted, what effect the insolvency proceeding would have on any recovery by a Fund, and what impact an insolvency of a clearing house or clearing member would have on the financial system more generally.
B-22
The U.S. Congress, various exchanges and regulatory and self-regulatory authorities have undertaken reviews of derivatives trading in recent periods. Among the actions that have been taken or proposed to be taken are new position limits and reporting requirements, new or more stringent daily price fluctuation limits for futures and options transactions, new or increased margin and reserve requirements for various types of derivatives transactions, and mandatory clearing, trading, and reporting requirements for many derivatives. Additional measures are under active consideration and as a result there may be further actions that adversely affect the regulation of instruments in which the Funds invest. It is possible that these or similar measures could potentially limit or completely restrict the ability of a Fund to use these instruments as a part of its investment strategy. Limits or restrictions applicable to the counterparties with which the Funds engage in derivative transactions could also prevent the Funds from using these instruments.
Options, Rights, and Warrants
A Fund may purchase and sell put and call options on securities to enhance investment performance or to protect against changes in market prices. A Fund that invests in debt securities may also purchase and sell put and call options to adjust the interest rate sensitivity of its portfolio or the credit exposure of the portfolio.
Call options. A Fund may write call options on its securities to realize a greater current return through the receipt of premiums. Such option transactions may also be used as a limited form of hedging against a decline in the price of securities owned by the Fund.
A call option gives the holder the right to purchase, and obligates the writer to sell, a security at the exercise price at any time before the expiration date. A Fund may write covered call options or uncovered call options. A call option is “covered” if the writer, at all times while obligated as a writer, either owns the underlying securities (or comparable securities satisfying the cover requirements of the securities exchanges), or has the right to acquire such securities through immediate conversion of securities. When a Fund has written an uncovered call option, the Fund will not necessarily hold securities offsetting the risk to the Fund. As a result, if the call option were exercised, the Fund might be required to purchase the security that is the subject of the call at the market price at the time of exercise. The Fund’s exposure on such an option is theoretically unlimited. There is also a risk, especially with less liquid preferred and debt securities, that the security may not be available for purchase.
A Fund will receive a premium from writing a call option, which increases the Fund’s return in the event the option expires unexercised or is closed out at a profit. The amount of the premium reflects, among other things, the relationship between the exercise price and the current market value of the underlying security, the volatility of the underlying security, the amount of time remaining until expiration, current interest rates, and the effect of supply and demand in the options market and in the market for the underlying security.
In return for the premium received when it writes a covered call option, a Fund takes the risk during the life of the option that it will be required to deliver the underlying security at a price below the current market value of the security or, in the case of a covered call option, to give up some or all of the opportunity to profit from an increase in the market price of the securities covering the call option.
In the case of a covered option, the Fund also retains the risk of loss should the price of the securities decline. If the covered option expires unexercised, the Fund realizes a gain equal to the premium, which may be offset by a decline in price of the underlying security. If the option is exercised, the Fund realizes a gain or loss equal to the difference between the Fund’s cost for the underlying security and the proceeds of sale (exercise price minus commissions) plus the amount of the premium.
A Fund may enter into closing purchase transactions in order to realize a profit or limit a loss on a previously written call option or, in the case of a covered call option, to free itself to sell the underlying security or to write another call on the security, or protect a security from being called in an unexpected market rise. Any profits from a closing purchase transaction in the case of a covered call option may be offset by a decline in the value of the underlying security. Conversely, because increases in the market price of a call option will generally
B-23
reflect increases in the market price of the underlying security, any loss resulting from a closing purchase transaction relating to a covered call option is likely to be offset in whole or in part by unrealized appreciation of the underlying security owned by the Fund.
Put options. A Fund may write put options in order to enhance its current return by taking a long directional position as to a security or index of securities. Such options transactions may also be used as a limited form of hedging against an increase in the price of securities that the Fund plans to purchase. A put option gives the holder the right to sell, and obligates the writer to buy, a security at the exercise price at any time before the expiration date. A Fund may write covered or uncovered put options. A put option is “covered” if the writer segregates cash and high-grade short-term debt obligations or other permissible collateral equal to the price to be paid if the option is exercised.
By writing a put option, the Fund assumes the risk that it may be required to purchase the underlying security for an exercise price higher than its then current market value, resulting in a potential capital loss unless the security later appreciates in value. A Fund may terminate a put option that it has written before it expires by entering into a closing purchase transaction. Any loss from this transaction may be partially or entirely offset by the premium received on the terminated option.
Purchasing put and call options. A Fund may also purchase put options to protect portfolio holdings against a decline in market value. This protection lasts for the life of the put option because the Fund, as a holder of the option, may sell the underlying security at the exercise price regardless of any decline in its market price. A Fund may also purchase a put option hoping to profit from an anticipated decline in the value of the underlying security. In order for a put option to be profitable, the market price of the underlying security must decline sufficiently below the exercise price to cover the premium and transaction costs that the Fund must pay. If the Fund holds the security underlying the option, these costs will reduce any profit the Fund might have realized had it sold the underlying security instead of buying the put option.
A Fund may purchase call options to hedge against an increase in the price of securities that the Fund wants ultimately to buy. Such hedge protection is provided during the life of the call option since the Fund, as holder of the call option, is able to buy the underlying security at the exercise price regardless of any increase in the underlying security’s market price. A Fund may also purchase a call option as a long directional investment hoping to profit from an anticipated increase in the value of the underlying security. In order for a call option to be profitable, the market price of the underlying security must rise sufficiently above the exercise price to cover the premium and transaction costs. These costs will reduce any profit the Fund might have realized had it bought the underlying security at the time it purchased the call option.
A Fund may also buy and sell combinations of put and call options on the same underlying security to earn additional income.
A Fund may purchase or sell “structured options,” which may comprise multiple option exposures within a single security. The risk and return characteristics of a structured option will vary depending on the nature of the underlying option exposures. The Fund may use such options for hedging purposes or as a substitute for direct investments in options or securities. The Fund’s use of structured options may create investment leverage.
Options on foreign securities. A Fund may purchase and sell options on foreign securities if an investment adviser or subadviser believes that the investment characteristics of such options, including the risks of investing in such options, are consistent with the Fund’s investment objective. It is expected that risks related to such options will not differ materially from risks related to options on U.S. securities. However, position limits and other rules of foreign exchanges may differ from those in the United States. In addition, options markets in some countries, many of which are relatively new, may be less liquid than comparable markets in the United States.
Options on securities indices. A Fund may write or purchase options on securities indices, subject to its general investment restrictions regarding options transactions. Index options are similar to options on individual
B-24
securities in that the purchaser of an index option acquires the right to buy (in the case of a call) or sell (in the case of a put), and the writer undertakes the obligation to sell or buy (as the case may be), units of an index at a stated exercise price during the term of the option. Instead of giving the right to take or make actual delivery of securities, the holder of an index option has the right to receive a cash “exercise settlement amount.” This amount is equal to the amount by which the fixed exercise price of the option exceeds (in the case of a put) or is less than (in the case of a call) the closing value of the underlying index on the date of the exercise, multiplied by a fixed “index multiplier.” If the Fund has written an index call option, it will lose money if the index level rises above the option exercise price (plus the amount of the premium received by the Fund on the option). If the Fund has written an index put option, it will lose money if the index level falls below the option exercise price (less the amount of the premium received by the Fund).
In cases where a Fund uses index options for hedging purposes, price movements in securities which a Fund owns or intends to purchase probably will not correlate perfectly with movements in the level of a securities index and, therefore, a Fund bears the risk of a loss on a securities index option which is not completely offset by movements in the price of such securities. Because securities index options are settled in cash, a call writer cannot determine the amount of its settlement obligations in advance and, unlike call writing on a specific security, cannot provide in advance for, or cover, its potential settlement obligations by acquiring and holding underlying securities. A Fund may, however, cover call options written on a securities index by holding a mix of securities which substantially replicate the movement of the index or by holding a call option on the securities index with an exercise price no higher than the call option sold.
A Fund may purchase or sell options on stock indices in order to close out its outstanding positions in options on stock indices which it has purchased. A Fund may also allow such options to expire unexercised.
Compared to the purchase or sale of futures contracts, the purchase of call or put options on an index involves less potential risk to a Fund because the maximum amount at risk is the premium paid for the options plus transactions costs. The writing of a put or call option on an index involves risks similar to those risks relating to the purchase or sale of index futures contracts.
Risks involved in the sale of options. The successful use of a Fund’s options strategies depends on the ability of an investment adviser or subadviser to forecast correctly interest rate and market movements. For example, if a Fund were to write a covered call option based on an investment adviser’s or subadviser’s expectation that the price of the underlying security would fall, but the price were to rise instead, the Fund could be required to sell the security upon exercise at a price below the current market price. Similarly, if a Fund were to write a put option based on an investment adviser’s or subadviser’s expectation that the price of the underlying security would rise, but the price were to fall instead, the Fund could be required to purchase the security upon exercise at a price higher than the current market price.
When a Fund purchases an option, it runs the risk that it will lose its entire investment in the option in a relatively short period of time, unless the Fund exercises the option or enters into a closing sale transaction before the option’s expiration. If the price of the underlying security does not rise (in the case of a call) or fall (in the case of a put) to an extent sufficient to cover the option premium and transaction costs, the Fund will lose part or all of its investment in the option. This contrasts with an investment by a Fund in the underlying security, since the Fund will not realize a loss if the security’s price does not change.
The effective use of options also depends on a Fund’s ability to terminate option positions at times when an investment adviser or subadviser deems it desirable to do so. There is no assurance that a Fund will be able to effect closing transactions at any particular time or at an acceptable price.
If a secondary market in options were to become unavailable, a Fund could no longer engage in closing transactions. Lack of investor interest might adversely affect the liquidity of the market for particular options or series of options. A market may discontinue trading of a particular option or options generally. In addition, a market could become temporarily unavailable if unusual events—such as volume in excess of trading or clearing capability—were to interrupt its normal operations.
B-25
A market may at times find it necessary to impose restrictions on particular types of options transactions, such as opening transactions. If an underlying security ceases to meet qualifications imposed by the market or the Options Clearing Corporation, new series of options on that security will no longer be opened to replace expiring series, and opening transactions in existing series may be prohibited. If an options market were to become unavailable, a Fund as a holder of an option would be able to realize profits or limit losses only by exercising the option, and the Fund, as option writer, would remain obligated under the option until expiration or exercise.
Disruptions in the markets for the securities underlying options purchased or sold by a Fund could result in losses on the options. If trading is interrupted in an underlying security, the trading of options on that security is normally halted as well. As a result, a Fund as purchaser or writer of an option will be unable to close out its positions until options trading resumes, and it may be faced with considerable losses if trading in the security reopens at a substantially different price. In addition, the Options Clearing Corporation or other options markets may impose exercise restrictions. If a prohibition on exercise is imposed at the time when trading in the option has also been halted, a Fund as purchaser or writer of an option will be locked into its position until one of the two restrictions has been lifted. If the Options Clearing Corporation were to determine that the available supply of an underlying security appears insufficient to permit delivery by the writers of all outstanding calls in the event of exercise, it may prohibit indefinitely the exercise of put options. A Fund, as holder of such a put option, could lose its entire investment if the prohibition remained in effect until the put option’s expiration.
Foreign-traded options are subject to many of the same risks presented by internationally-traded securities. In addition, because of time differences between the United States and various foreign countries, and because different holidays are observed in different countries, foreign options markets may be open for trading during hours or on days when U.S. markets are closed. As a result, option premiums may not reflect the current prices of the underlying interest in the United States.
Exchanges have established limits on the maximum number of options an investor or group of investors acting in concert may write. The Funds, an investment adviser or subadviser, and other clients of the investment adviser or subadviser may constitute such a group. These limits restrict a Fund’s ability to purchase or sell particular options.
Over-the-counter options. A Fund may purchase or sell OTC options. OTC options are not traded on securities or options exchanges or backed by clearinghouses. Rather, they are entered into directly between a Fund and the counterparty to the option. In the case of an OTC option purchased by the Fund, the value of the option to the Fund will depend on the willingness and ability of the option writer to perform its obligations to the Fund. In addition, OTC options may not be transferable and there may be little or no secondary market for them, so they may be considered illiquid. It may not be possible to enter into closing transactions with respect to OTC options or otherwise to terminate such options, and as a result a Fund may be required to remain obligated on an unfavorable OTC option until its expiration. It may be difficult under certain circumstances to value OTC options.
Rights and Warrants to Purchase Securities; Index Warrants; International. A Fund may invest in rights and warrants to purchase securities. Rights or warrants generally give the holder the right to receive, upon exercise, a security at a stated price. Funds typically use rights and warrants in a manner similar to their use of options on securities, as described above. Risks associated with the use of rights or warrants are generally similar to risks associated with the use of options. Rights and warrants typically do not carry with them dividend or voting rights with respect to the underlying securities, or any rights in the assets of the issuer. In addition, the value of a right or a warrant will likely, but will not necessarily, change with the value of the underlying securities, and a right or a warrant ceases to have value if it is not exercised prior to its expiration date.
Bonds issued with warrants attached to purchase equity securities have many characteristics of convertible bonds and their prices may, to some degree, reflect the performance of the underlying stock. Bonds also may be issued with warrants attached to purchase additional fixed income securities.
B-26
A Fund may also invest in equity-linked warrants. A Fund purchases equity-linked warrants from a broker, who in turn is expected to purchase shares in the local market. If the Fund exercises its warrant, the shares are expected to be sold and the warrant redeemed with the proceeds. Typically, each warrant represents one share of the underlying stock. Therefore, the price and performance of the warrant are directly linked to the underlying stock, less transaction costs. In addition to the market risk related to the underlying holdings, a Fund bears counterparty risk with respect to the issuing broker. There is currently no active trading market for equity-linked warrants, and they may be highly illiquid.
In addition to warrants on securities, a Fund may purchase put warrants and call warrants whose values vary depending on the change in the value of one or more specified securities indices (“index-linked warrants”). Index-linked warrants are generally issued by banks or other financial institutions and give the holder the right, at any time during the term of the warrant, to receive upon exercise of the warrant a cash payment from the issuer based on the value of the underlying index at the time of exercise. In general, if the value of the underlying index rises above the exercise price of the index-linked warrant, the holder of a call warrant will be entitled to receive a cash payment from the issuer upon exercise based on the difference between the value of the index and the exercise price of the warrant; if the value of the underlying index falls, the holder of a put warrant will be entitled to receive a cash payment from the issuer upon exercise based on the difference between the exercise price of the warrant and the value of the index. The holder of a warrant would not be entitled to any payments from the issuer at any time when, in the case of a call warrant, the exercise price is greater than the value of the underlying index, or, in the case of a put warrant, the exercise price is less than the value of the underlying index. If a Fund were not to exercise an index-linked warrant prior to its expiration, then the Fund would lose the amount of the purchase price paid by it for the warrant.
A Fund using index-linked warrants would normally do so in a manner similar to its use of options on securities indices. The risks of a Fund’s use of index-linked warrants are generally similar to those relating to its use of index options. Unlike most index options, however, index-linked warrants are issued in limited amounts and are not obligations of a regulated clearing agency, but are backed only by the credit of the bank or other institution that issues the warrant. Also, index-linked warrants may have longer terms than index options. Index-linked warrants are not likely to be as liquid as certain index options backed by a recognized clearing agency. In addition, the terms of index-linked warrants may limit a Fund’s ability to exercise the warrants at such time, or in such quantities, as the Fund would otherwise wish to do.
A Fund may make indirect investment in foreign equity securities, through international warrants, local access products, participation notes, or low exercise price warrants. International warrants are financial instruments issued by banks or other financial institutions, which may or may not be traded on a foreign exchange. International warrants are a form of derivative security that may give holders the right to buy or sell an underlying security or a basket of securities from or to the issuer for a particular price or may entitle holders to receive a cash payment relating to the value of the underlying security or basket of securities. International warrants are similar to options in that they are exercisable by the holder for an underlying security or the value of that security, but are generally exercisable over a longer term than typical options. These types of instruments may be American style exercise, which means that they can be exercised at any time on or before the expiration date of the international warrant, or European style exercise, which means that they may be exercised only on the expiration date. International warrants have an exercise price, which is typically fixed when the warrants are issued.
A Fund may invest in low exercise price warrants, which are warrants with an exercise price that is very low relative to the market price of the underlying instrument at the time of issue (e.g., one cent or less). The buyer of a low exercise price warrant effectively pays the full value of the underlying common stock at the outset. In the case of any exercise of warrants, there may be a time delay between the time a holder of warrants gives instructions to exercise and the time the price of the common stock relating to exercise or the settlement date is determined, during which time the price of the underlying security could change significantly. These warrants entail substantial credit risk, since the issuer of the warrant holds the purchase price of the warrant (approximately equal to the value of the underlying investment at the time of the warrant’s issue) for the life of the warrant.
B-27
The exercise or settlement date of the warrants and other instruments described above may be affected by certain market disruption events, such as difficulties relating to the exchange of a local currency into U.S. dollars, the imposition of capital controls by a local jurisdiction or changes in the laws relating to foreign investments. These events could lead to a change in the exercise date or settlement currency of the instruments, or postponement of the settlement date. In some cases, if the market disruption events continue for a certain period of time, the warrants may become worthless, resulting in a total loss of the purchase price of the warrants.
Investments in these instruments involve the risk that the issuer of the instrument may default on its obligation to deliver the underlying security or cash in lieu thereof. These instruments may also be subject to liquidity risk because there may be a limited secondary market for trading the warrants. They are also subject, like other investments in foreign securities, to foreign risk and currency risk.
Equity-Linked Notes
An equity-linked note (ELN) is a debt instrument whose value changes based on changes in the value of a single equity security, basket of equity securities, or an index of equity securities. An equity-linked note may or may not pay interest. See “Hybrid Instruments,” below.
Hybrid Instruments
Hybrid instruments are generally considered derivatives and include indexed or structured securities, and combine elements of many derivatives transactions with those of debt, preferred equity, or a depositary instrument. A Fund may use a hybrid instrument as a substitute for any type of cash or derivative investment which it might make for any purpose.
A hybrid instrument may be a debt security, preferred stock, warrant, convertible security, certificate of deposit, or other evidence of indebtedness on which a portion of or all interest payments, and/or the principal or stated amount payable at maturity, redemption or retirement, is determined by reference to prices, changes in prices, or differences between prices, of securities, currencies, intangibles, goods, articles, or commodities (collectively, “underlying assets”), or by another index, economic factor, or other measure, including interest rates, currency exchange rates, or commodities or securities indices (collectively, “benchmarks”). Hybrid instruments may take a number of forms, including, for example, debt instruments with interest or principal payments or redemption terms determined by reference to the value of an index, security, or other measure at a future time, preferred stock with dividend rates determined by reference to the value of a currency, or convertible securities where the conversion terms relate to a particular commodity.
The risks of investing in a hybrid instrument may, depending on the nature of the instrument, reflect a combination of the risks of investing in securities, options, futures, currencies, or other types of investments. An investment in a hybrid instrument as a debt instrument may entail significant risks that are not associated with a similar investment in a traditional debt instrument. The risks of a particular hybrid instrument will depend upon the terms of the instrument, but may include the possibility of significant changes in the level of the benchmark(s) or the prices of the underlying assets to which the instrument is linked. Such risks generally depend upon factors unrelated to the operations or credit quality of the issuer of the hybrid instrument, and may not be foreseen by the purchaser, such as financial or market developments, economic and political events, the supply and demand of the underlying assets, and interest rate movements. Hybrid instruments may be highly volatile and their use by a Fund may not be successful.
Hybrid instruments are potentially more volatile and carry greater market risks than traditional debt instruments. Hybrid instruments may be highly leveraged. Depending on the structure of the particular hybrid instrument, changes in a benchmark may be magnified by the terms of the hybrid instrument and have an even more dramatic and substantial effect upon the value of the hybrid instrument. Also, the prices of the hybrid instrument and the benchmark or underlying asset may not move in the same direction or at the same time.
B-28
Hybrid instruments may also carry liquidity risk since they typically trade OTC, and are not backed by a central clearing organization. The instruments are often “customized” to meet the portfolio needs of a particular investor, and therefore, the number of investors that are willing and able to buy such instruments in the secondary market may be smaller than that for more traditional debt securities. Under certain conditions, the redemption value of such an investment could be zero. In addition, because the purchase and sale of hybrid investments would likely take place in an OTC market without the guarantee of a central clearing organization, or in a transaction between a Fund and the issuer of the hybrid instrument, the instruments will not likely be actively traded. Hybrid instruments also may not be subject to regulation by the CFTC, the SEC, or any other governmental regulatory authority.
When a Fund invests in a hybrid instrument, it takes on the credit risk of the issuer of the hybrid instrument. In that respect, a hybrid instrument may create greater risks than investments directly in the securities or other assets underlying the hybrid instrument because the Fund is exposed both to losses on those securities or other assets and to the credit risk of the issuer of the hybrid instrument. A hybrid instrument may also pose greater risks than other derivatives based on the same securities or assets because, when it purchases the instrument, a Fund may be required to pay all, or most, of the notional amount of the investment by way of purchase price, whereas many other derivatives require a Fund to post only a relatively small portion of the notional amount by way of margin or similar arrangements.
Structured Investments
A structured investment is typically issued by a specially created corporation or trust that purchases one or more securities or other assets (“underlying instruments”), and that in turn issues one or more classes of securities (“structured securities”) backed by, or representing different interests in, the underlying instruments. The cash flow on the underlying instruments may be apportioned among the newly issued structured securities to create securities with different investment characteristics, such as varying maturities, payment priorities, and interest rate provisions, and the extent of such payments made with respect to structured securities is dependent on the extent of the cash flow on the underlying instruments. Because structured securities typically involve no credit enhancement, their credit risk generally will reflect that of the underlying instruments. Investments in a structured security may be subordinated to the right of payment of another class of securities. Subordinated structured securities typically have higher yields and present greater risks than unsubordinated structured securities. Structured securities are typically sold in private placement transactions, and there currently is no active trading market for structured securities, and they may be highly illiquid and difficult to value. Because the purchase and sale of structured securities would likely take place in an OTC market without the guarantee of a central clearing organization, or in a transaction between a Fund and the issuer of the structured securities, the creditworthiness of the counterparty of the issuer of the structured securities would be an additional risk factor the Fund would have to consider and monitor.
Commodity-Linked “Structured” Securities. Certain structured products may provide exposure to the commodities markets. Commodity-linked structured securities may be equity or debt securities, may be leveraged or unleveraged, and may present investment characteristics and risks of an investment in a security and one or more underlying commodities. Certain restrictions imposed on the Funds by the Code may limit the Funds’ ability to invest in certain commodity-linked structured securities.
Credit-Linked Securities. Credit-linked securities are typically issued by a limited purpose trust or other vehicle that, in turn, invests in a basket of derivative instruments, such as credit default swaps, interest rate swaps, and other securities or transactions, in order to provide exposure to certain high yield or other fixed income issuers or markets. For example, a Fund may invest in credit-linked securities in order to gain exposure to the high yield markets pending investment of cash and/or to remain fully invested when more traditional income producing securities are not available. A Fund’s return on its investments in credit-linked securities will depend on the investment performance of the investments held in the trust or other vehicle. A Fund’s investments in these instruments are indirectly subject to the risks associated with the derivative instruments in which the trust or other vehicle invests, including, among others, credit risk, default, or similar event risk, counterparty risk,
B-29
interest rate risk, leverage risk, and management risk. There will likely be no established trading market for credit-linked securities and they may be illiquid.
Because the performance of structured hybrid instruments is linked to the performance of an underlying commodity, commodity index, or other economic variable, those investments are subject to “market risks” with respect to the movements of the commodity markets and may be subject to certain other risks that do not affect traditional equity and debt securities. If the interest payment on a hybrid instrument is linked to the value of a particular commodity, commodity index, or other economic variable and the underlying investment loses value, the purchaser might not receive the anticipated interest on its investment. If the amount of principal to be repaid on a structured hybrid instrument is linked to the value of a particular commodity, commodity index, or other economic variable, the purchaser might not receive all or any of the principal at maturity of the investment.
The values of structured hybrid instruments may fluctuate significantly because the values of the underlying investments to which they are linked are themselves extremely volatile, and the Fund may lose most or all of the value of its investment in a hybrid instrument. Additionally, the particular terms of a structured hybrid instrument may create economic leverage by contemplating payments that are based on a multiple of the price increase or decrease of the underlying commodity, commodity index, or other economic variable. A liquid secondary market may not exist for structured hybrid instruments, which may make it difficult to sell such instruments at an acceptable price or to value them accurately.
A Fund’s investment in structured products may be subject to limits under applicable law.
When-Issued, Delayed-Delivery, To-Be-Announced, Forward Commitment, and Standby Commitment Transactions
A Fund may enter into when-issued, delayed-delivery, to-be-announced (“TBA”), or forward commitment transactions in order to lock in the purchase price of the underlying security or in order to adjust the interest rate exposure of the Fund’s existing portfolio. In when-issued, delayed-delivery, or forward commitment transactions, a Fund commits to purchase or sell particular securities, with payment and delivery to take place at a future date. In the case of TBA purchase commitments, the unit price and the estimated principal amount are established when the Fund enters into a commitment, with the actual principal amount being within a specified range of the estimate. Although a Fund does not typically pay for the securities in these types of transactions until they are delivered, it immediately assumes the risks of ownership, including the risk of price fluctuation. As a result, each of these types of transactions may create investment leverage in a Fund’s portfolio and increase the volatility of the Fund. If a Fund’s counterparty fails to deliver a security purchased on a when-issued, delayed-delivery, TBA, or forward commitment basis, there may be a loss, and the Fund may have missed an opportunity to make an alternative investment.
A Fund may also enter into standby commitment agreements, obligating the Fund, for a specified period, to buy a specified amount of a security at the option of the issuer, upon the issuance of the security. The price at which the Fund would purchase the security is set at the time of the agreement. In return for its promise to purchase the security, a Fund receives a commitment fee. The Fund receives this fee whether or not it is ultimately required to purchase the security. The securities subject to a standby commitment will not necessarily be issued, and, if they are issued, the value of the securities on the date of issuance may be significantly less than the price at which the Fund is required to purchase them.
Distressed Securities
A Fund may invest in securities, including loans purchased in the secondary market, that are the subject of bankruptcy proceedings or otherwise in default or in risk of being in default as to the repayment of principal and/ or interest at the time of acquisition by the Fund or that are rated in the lower rating categories by one or more nationally recognized statistical rating organizations (for example, Ca or lower by Moody’s and CC or lower by S&P or Fitch Ratings (“Fitch”) or, if unrated, are in the judgment of the investment adviser or subadviser of
B-30
equivalent quality (“Distressed Securities”). Investment in Distressed Securities is speculative and involves significant risks and a Fund could lose all of its investment in any Distressed Security.
Distressed Securities are subject to greater credit and liquidity risks than other types of loans. A bankruptcy proceeding or other court proceeding could delay or limit the ability of the Fund to collect the principal and interest payments on Distressed Securities or adversely affect the Fund’s rights in collateral relating to a Distressed Security. If a lawsuit is brought by creditors of a borrower under a Distressed Security, a court or a trustee in bankruptcy could take certain actions that would be adverse to a Fund. For example:
| · | Other creditors might convince the court to set aside a loan or the collateralization of the loan as a “fraudulent conveyance” or “preferential transfer.” In that event, the court could recover from the Fund the interest and principal payments that the borrower made before becoming insolvent. There can be no assurance that the Fund would be able to prevent that recapture. |
| · | A bankruptcy court may restructure the payment obligations under the loan so as to reduce the amount to which the Fund would be entitled. |
| · | The court might discharge the amount of the loan that exceeds the value of the collateral. |
| · | The court could subordinate the Fund’s rights to the rights of other creditors of the borrower under applicable law, decreasing, potentially significantly, the likelihood of any recovery on the Fund’s investment. |
A Fund may, but will not necessarily, invest in a Distressed Security when the investment adviser or subadviser believes it is likely that the issuer of the Distressed Securities will make an exchange offer or will be the subject of a plan of reorganization pursuant to which the Fund will receive new securities in return for the Distressed Securities. There can be no assurance that such an exchange offer will be made or that such a plan of reorganization will be adopted. In addition, a significant period of time may pass between the time at which a Fund makes its investment in Distressed Securities and the time that any such exchange offer or plan of reorganization is completed. Even if an exchange offer is made or plan of reorganization is adopted with respect to Distressed Securities held by a Fund, there can be no assurance that the securities or other assets received by a Fund in connection with such exchange offer or plan of reorganization will not have a lower value or income potential than may have been anticipated when the investment was made. If a Fund participates in negotiations with respect to any exchange offer or plan of reorganization with respect to an issuer of Distressed Securities, the Fund may be restricted from disposing of such securities.
Dollar Roll Transactions
A Fund may enter into dollar roll transactions, in which the Fund sells mortgage-backed securities for delivery in the current month and simultaneously contracts to purchase substantially similar securities on a specified future date from the same party. A Fund may invest in dollar rolls in order to benefit from anticipated changes in pricing for the mortgage-backed securities during the term of the transaction, or for the purpose of creating investment leverage.
In a dollar roll, the securities that are to be purchased will be of the same type as the securities sold, but will be supported by different pools of mortgages. A Fund that engages in a dollar roll forgoes principal and interest paid on the sold securities during the roll period, but is compensated by the difference between the current sales price and the lower forward price for the future purchase. In addition, a Fund may benefit by investing the transaction proceeds during the roll period. Dollar roll transactions generally have the effect of creating leverage in a Fund’s portfolio.
Dollar rolls involve the risk that the Fund’s counterparty will be unable to deliver the mortgage-backed securities underlying the dollar roll at the fixed time. If the counterparty files for bankruptcy or becomes insolvent, the counterparty or its representative may ask for and receive an extension of time to decide whether to enforce the Fund’s repurchase obligation. A Fund’s use of the transaction proceeds may be restricted pending
B-31
such decision. A Fund may enter into dollar roll transactions without limit up to the amount permitted under applicable law.
Exchange Traded Notes (ETNs)
ETNs are senior, unsecured, debt securities typically issued by financial institutions. An ETN’s return is typically based on the performance of a particular market index, and the value of the index may be impacted by market forces that affect the value of ETNs in unexpected ways. ETNs are similar to Structured Investments, except that they are typically listed on an exchange and traded in the secondary market. See “Structured Investments” in this SAI. The return on an ETN is based on the performance of the specified market index, and an investor may, at maturity, realize a negative return on the investment. ETNs typically do not make periodic interest payments and principal is not protected. The repayment of principal and any additional return due either at maturity or upon repurchase by the issuer depends on the issuer’s ability to pay, regardless of the performance of the underlying index. Accordingly, ETNs are subject to credit risk that the issuer will default or will be unable to make timely payments of principal. Certain events can impact an ETN issuer’s financial situation and ability to make timely payments to ETN holders, including economic, political, legal, or regulatory changes and natural disasters. Event risk is unpredictable and can significantly impact ETN holders.
The market value of an ETN may be influenced by, among other things, time to maturity, level of supply and demand of the ETN, volatility and lack of liquidity in the underlying assets, changes in the applicable interest rates, the current performance of the market index to which the ETN is linked, and the credit rating of the ETN issuer. The market value of an ETN may differ from the performance of the applicable market index and there may be times when an ETN trades at a premium or discount. This difference in price may be due to the fact that the supply and demand in the market for ETNs at any point in time is not always identical to the supply and demand in the market for the securities underlying the market index that the ETN seeks to track. A change in the issuer’s credit rating may also impact the value of an ETN without regard to the level of the underlying market index. ETNs are also subject to tax risk. No assurance can be given that the Internal Revenue Service (“IRS”) will accept, or a court will uphold, how the Funds characterize and treat ETNs for tax purposes.
A Fund’s ability to sell its ETN holdings may be limited by the availability of a secondary market. In addition, although an ETN may be listed on an exchange, the issuer may not be required to maintain the listing and there can be no assurance that a secondary market will exist for an ETN. Some ETNs may be relatively illiquid and may therefore be difficult to purchase or sell at a fair price. Leveraged ETNs may offer the potential for greater return, but their values may be highly volatile.
Fixed Income Securities
Certain of the debt securities in which the Funds may invest may not offer as high a yield as may be achieved from lower quality instruments having less safety. If a Fund disposes of an obligation prior to maturity, it may realize a loss or a gain. An increase in interest rates will generally reduce the value of portfolio investments, and a decline in interest rates will generally increase the value of portfolio investments. In addition, investments are subject to the ability of the issuer to make payment at maturity.
As discussed, a decline in prevailing levels of interest rates generally increases the value of debt securities in a Fund’s portfolio, while an increase in rates usually reduces the value of those securities. As a result, to the extent that a Fund invests in debt securities, interest rate fluctuations will affect its NAV, but not the income it receives from its debt securities. In addition, if the debt securities contain call, prepayment, or redemption provisions, during a period of declining interest rates, those securities are likely to be redeemed, and a Fund would probably be unable to replace them with securities having as great a yield. Certain events, such as market or economic developments, regulatory or government actions, natural disasters, terrorist attacks, war, and other geopolitical events can have a dramatic adverse effect on the debt market and the overall liquidity of the market for fixed income securities.
B-32
Investment in medium- or lower-grade debt securities involves greater investment risk, including the possibility of issuer default or bankruptcy. An economic downturn could severely disrupt this market and adversely affect the value of outstanding bonds and the ability of the issuers to repay principal and interest. In addition, lower-quality bonds are less sensitive to interest rate changes than higher-quality instruments and generally are more sensitive to adverse economic changes or individual corporate developments. During a period of adverse economic changes, including a period of rising interest rates, issuers of such bonds may experience difficulty in servicing their principal and interest payment obligations. Furthermore, medium- and lower-grade debt securities tend to be less marketable than higher-quality debt securities because the market for them is less broad. The market for unrated debt securities is even narrower. During periods of thin trading in these markets, the spread between bid and asked prices is likely to increase significantly, and a Fund may have greater difficulty selling its portfolio securities. The market value of these securities and their liquidity may be affected by adverse publicity and investor perceptions.
Foreign Securities
Each Fund may invest in foreign securities. Foreign securities include securities of foreign companies and foreign governments (or agencies or subdivisions thereof). If a Fund’s securities are held abroad, the countries in which such securities may be held and the sub-custodian holding them must be approved by the Board or its delegate under applicable rules adopted by the SEC. In buying foreign securities, each Fund may convert U.S. dollars into foreign currency.
The globalization and integration of the world economic system and related financial markets have made it increasingly difficult to define issuers geographically. Accordingly, the Funds intend to construe geographic terms such as “foreign,” “non-U.S.,” “European,” “Latin American,” “Asian,” and “emerging markets” in the manner that affords to the Funds the greatest flexibility in seeking to achieve the investment objective(s) of the relevant Fund. Specifically, unless otherwise stated, in circumstances where the investment objective and/or strategy is to invest (a) exclusively in “foreign securities,” “non-U.S. securities,” “European securities,” “Latin American securities,” “Asian securities,” or “emerging markets” (or similar directions) or (b) at least some percentage of the Fund’s assets in foreign securities, etc., the Fund will take the view that a security meets this description so long as the issuer of a security is tied economically to the particular country or geographic region indicated by words of the relevant investment objective and/or strategy (the “Relevant Language”). For these purposes the issuer of a security is deemed to have that tie if:
(i) the issuer is organized under the laws of the country or a country within the geographic region suggested by the Relevant Language or maintains its principal place of business in that country or region; or
(ii) the securities are traded principally in the country or region suggested by the Relevant Language; or
(iii) the issuer, during its most recent fiscal year, derived at least 50% of its revenues or profits from goods produced or sold, investments made, or services performed in the country or region suggested by the Relevant Language or has at least 50% of its assets in that country or region.
In addition, the Funds intend to treat derivative securities (e.g., call options) by reference to the underlying security. Conversely, if the investment objective and/or strategy of a Fund limits the percentage of assets that may be invested in “foreign securities,” etc. or prohibits such investments altogether, a Fund intends to categorize securities as “foreign,” etc. only if the security possesses all of the attributes described above in clauses (i), (ii), and (iii).
Foreign securities also include a Fund’s investment in foreign securities through depositary receipts, in the form of American Depositary Receipts (“ADRs”), European Depositary Receipts (“EDRs”), Global Depositary Receipts (“GDRs”), or other similar securities. An ADR is a U.S. dollar-denominated security issued by a U.S. bank or trust company that represents, and may be converted into, a foreign security. An EDR or a GDR is similar but is issued by a non-U.S. bank. Depositary receipts are subject to the same risks as direct investment in foreign securities. Depositary receipts may not necessarily be denominated in the same currency as the underlying securities into which they may be converted, and changes in currency exchange rates may affect the
B-33
value of an ADR investment in ways different from direct investments in foreign securities. Funds may invest in both sponsored and unsponsored depositary receipts. Unsponsored depositary receipts are organized independently and without the cooperation of the issuer of the underlying securities. As a result, available information concerning the issuers may not be as current for unsponsored depositary receipts and the prices of unsponsored depositary receipts may be more volatile than if such instruments were sponsored by the issuer. An investment in an ADR is subject to the credit risk of the issuer of the ADR.
Investments in foreign securities involve special risks and considerations. As foreign companies are not generally subject to uniform accounting, auditing, and financial reporting standards, practices, and requirements comparable to those applicable to domestic companies, there may be less publicly available information about a foreign company than about a domestic company. For example, foreign markets have different clearance and settlement procedures. Delays in settlement could result in temporary periods when assets of a Fund are uninvested. The inability of a Fund to make intended security purchases due to settlement problems could cause it to miss certain investment opportunities. Foreign securities may also entail certain other risks, such as the possibility of one or more of the following: imposition of dividend or interest withholding or confiscatory taxes, higher brokerage costs, thinner trading markets, currency blockages or transfer restrictions, expropriation, nationalization, military coups, economic sanctions, or other adverse political or economic developments; less government supervision and regulation of securities exchanges, brokers and listed companies; and the difficulty of enforcing obligations in other countries. Purchases of foreign securities are usually made in foreign currencies and, as a result, a Fund may incur currency conversion costs and may be affected favorably or unfavorably by changes in the value of foreign currencies against the U.S. dollar. Further, it may be more difficult for a Fund’s agents to keep currently informed about corporate actions which may affect the prices of portfolio securities. Communications between the United States and foreign countries may be less reliable than within the United States, thus increasing the risk of delayed settlements of portfolio transactions or loss of certificates for portfolio securities. Certain markets may require payment for securities before delivery. In addition, there may be a possibility of nationalization or expropriation of assets, imposition of currency exchange controls, confiscatory taxation, political or financial instability, and diplomatic developments that could adversely affect the values of the Fund’s investments in certain non-U.S. countries.
A number of current significant political, demographic, and economic developments may affect investments in foreign securities and in securities of companies with operations overseas. The course of any one or more of these events and the effect on trade barriers, competition, and markets for consumer goods and services are uncertain. Similar considerations are of concern with respect to developing countries. For example, the possibility of revolution and the dependence on foreign economic assistance may be greater in these countries than in developed countries. Management seeks to mitigate the risks associated with these considerations through diversification and active professional management.
In addition to the general risks of investing in foreign securities, investments in emerging markets involve special risks. Securities of many issuers in emerging markets may be less liquid and more volatile than securities of comparable domestic issuers. Emerging markets may have different clearance and settlement procedures, and in certain markets there have been times when settlements have been unable to keep pace with the volume of securities transactions, making it difficult to conduct such transactions. Delays in settlement could result in temporary periods when a portion of the assets of a Fund is uninvested and no return is earned thereon. The inability of a Fund to make intended security purchases due to settlement problems could cause a Fund to miss attractive investment opportunities. Inability to dispose of portfolio securities due to settlement problems could result in losses to a Fund due to subsequent declines in values of the portfolio securities, decrease in the level of liquidity in a Fund’s portfolio, or, if a Fund has entered into a contract to sell the security, possible liability to the purchaser. Certain markets may require payment for securities before delivery, and in such markets a Fund bears the risk that the securities will not be delivered and that the Fund’s payments will not be returned. Securities prices in emerging markets can be significantly more volatile than in the more developed nations of the world, reflecting the greater uncertainties of investing in less established markets and economies. In particular, countries with emerging markets may have relatively unstable governments, present the risk of nationalization of
B-34
businesses, or may have restrictions on foreign ownership or prohibitions of repatriation of assets, and may have less protection of property rights than more developed countries. The economies of countries with emerging markets may be predominantly based on only a few industries, may be highly vulnerable to changes in local or global trade conditions, and may suffer from extreme and volatile debt burdens or inflation rates. Local securities markets may trade a small number of securities and may be unable to respond effectively to increases in trading volume, potentially making prompt liquidation of substantial holdings difficult or impossible at times. Securities of issuers located in countries with emerging markets may have limited marketability and may be subject to more abrupt or erratic price movements.
Certain emerging markets may require governmental approval for the repatriation of investment income, capital, or the proceeds of sales of securities by foreign investors. In addition, if a deterioration occurs in an emerging market’s balance of payments or for other reasons, a country could impose temporary restrictions on foreign capital remittances. A Fund could be adversely affected by delays in, or a refusal to grant, any required governmental approval for repatriation of capital, as well as by the application to that Fund of any restrictions on investments.
Investment in certain foreign emerging market debt obligations may be restricted or controlled to varying degrees. These restrictions or controls may at times preclude investment in certain foreign emerging market debt obligations and increase the expenses of a Fund.
Risk of Investing in China through Stock Connect. China A-shares are equity securities of companies based in mainland China that trade on Chinese stock exchanges such as the Shanghai Stock Exchange (“SSE”) and the Shenzhen Stock Exchange (“SZSE”) (“A-shares”). Foreign investment in A-shares on the SSE and SZSE is historically not permitted, other than through a license granted under regulations in the PRC known as the Qualified Foreign Institutional Investor and Renminbi Qualified Foreign Institutional Investor systems. Each license permits investment in A-shares only up to a specified quota.
Investment in eligible A-shares listed and traded on the SSE is also permitted through the Shanghai-Hong Kong Stock Connect program (“Stock Connect”). Stock Connect is a securities trading and clearing program established by Hong Kong Securities Clearing Company Limited (“HKSCC”), the SSE and China Securities Depository and Clearing Corporation Limited (“CSDCC”) that aims to provide mutual stock market access between the PRC and Hong Kong by permitting investors to trade and settle shares on each market through their local exchanges. Certain Funds may invest in A-shares through Stock Connect or on such other stock exchanges in China which participate in Stock Connect from time to time. Under Stock Connect, a Fund’s trading of eligible A-shares listed on the SSE would be effectuated through its Hong Kong broker.
Although no individual investment quotas or licensing requirements apply to investors in Stock Connect, trading through Stock Connect’s Northbound Trading Link is subject to aggregate and daily investment quota limitations that require that buy orders for A-shares be rejected once the remaining balance of the relevant quota drops to zero or the daily quota is exceeded (although a Fund will be permitted to sell A-shares regardless of the quota balance). These limitations may restrict a Fund from investing in A-shares on a timely basis, which could affect the Fund’s ability to effectively pursue its investment strategy. Investment quotas are also subject to change.
Investment in eligible A-shares through Stock Connect is subject to trading, clearance and settlement procedures that could pose risks to a Fund. A-shares purchased through Stock Connect generally may not be sold or otherwise transferred other than through Stock Connect in accordance with applicable rules. For example, PRC regulations require that in order for an investor to sell any A-share on a certain trading day, there must be sufficient A-shares in the investor’s account before the market opens on that day. If there are insufficient A-shares in the investor’s account, the sell order will be rejected by the SSE. The Stock Exchange of Hong Kong (“SEHK”) carries out pre-trade checking on sell orders of certain stocks listed on the SSE market (“SSE Securities”) of its participants (i.e., stock brokers) to ensure that this requirement is satisfied. While shares must be designated as eligible to be traded under Stock Connect, those shares may also lose such designation, and if
B-35
this occurs, such shares may be sold but cannot be purchased through Stock Connect. In addition, Stock Connect will only operate on days when both the Chinese and Hong Kong markets are open for trading and when banks in both markets are open on the corresponding settlement days. Therefore, an investment in A-shares through Stock Connect may subject a Fund to a risk of price fluctuations on days where the Chinese market is open, but Stock Connect is not trading. Moreover, day (turnaround) trading is not permitted on the A-shares market. If an investor buys A-shares on day “T,” the investor will only be able to sell the A-shares on or after day T+1. Further, since all trades of eligible Stock Connect A-shares must be settled in RMB, investors must have timely access to a reliable supply of offshore RMB, which cannot be guaranteed.
A-shares held through the nominee structure under Stock Connect will be held through HKSCC as nominee on behalf of investors. The precise nature and rights of a Fund as the beneficial owner of the SSE Securities through HKSCC as nominee is not well defined under PRC law. There is lack of a clear definition of, and distinction between, legal ownership and beneficial ownership under PRC law and there have been few cases involving a nominee account structure in the PRC courts. The exact nature and methods of enforcement of the rights and interests of a Fund under PRC law is also uncertain. In the unlikely event that HKSCC becomes subject to winding up proceedings in Hong Kong there is a risk that the SSE Securities may not be regarded as held for the beneficial ownership of a Fund or as part of the general assets of HKSCC available for general distribution to its creditors. Notwithstanding the fact that HKSCC does not claim proprietary interests in the SSE Securities held in its omnibus stock account in the CSDCC, the CSDCC as the share registrar for SSE listed companies will still treat HKSCC as one of the shareholders when it handles corporate actions in respect of such SSE Securities. HKSCC monitors the corporate actions affecting SSE Securities and keeps participants of Central Clearing and Settlement System (“CCASS”) informed of all such corporate actions that require CCASS participants to take steps in order to participate in them. Investors may only exercise their voting rights by providing their voting instructions to the HKSCC through participants of the CCASS. All voting instructions from CCASS participants will be consolidated by HKSCC, who will then submit a combined single voting instruction to the relevant SSE-listed company.
A Fund’s investments through Stock Connect’s Northbound Trading Link are not covered by Hong Kong’s Investor Compensation Fund. Hong Kong’s Investor Compensation Fund is established to pay compensation to investors of any nationality who suffer pecuniary losses as a result of default of a licensed intermediary or authorized financial institution in relation to exchange-traded products in Hong Kong. In addition, since a Fund is carrying out Northbound trading through securities brokers in Hong Kong but not PRC brokers, it is not protected by the China Securities Investor Protection Fund in the PRC.
Market participants are able to participate in Stock Connect subject to meeting certain information technology capability, risk management and other requirements as may be specified by the relevant exchange and/or clearing house. Further, the “connectivity” in Stock Connect requires the routing of orders across the border of Hong Kong and the PRC. This requires the development of new information technology systems on the part of the SEHK and exchange participants. There is no assurance that these systems will function properly or will continue to be adapted to changes and developments in both markets. In the event that the relevant systems fail to function properly, trading in A-shares through Stock Connect could be disrupted.
Stock Connect launched on November 17, 2014 and is in its initial stages. The current regulations are untested and there is no certainty as to how they will be applied or interpreted going forward. In addition, the current regulations are subject to change and there can be no assurance that Stock Connect will not be discontinued. New regulations may be issued from time to time by the regulators and stock exchanges in China and Hong Kong in connection with operations, legal enforcement and cross-border trades under Stock Connect. A Fund may be adversely affected as a result of such changes. Furthermore, the securities regimes and legal systems of China and Hong Kong differ significantly and issues may arise based on these differences. In the event that the relevant systems fail to function properly, trading in both markets through Stock Connect could be disrupted and a Fund’s ability to achieve its investment objective may be adversely affected. In addition, a Fund’s investments in A-shares through Stock Connect are generally subject to Chinese securities regulations
B-36
and listing rules, among other restrictions. Further, different fees, costs and taxes are imposed on foreign investors acquiring A-shares obtained through Stock Connect, and these fees, costs and taxes may be higher than comparable fees, costs and taxes imposed on owners of other securities providing similar investment exposure.
A-Share Market Suspension Risk. A-shares may only be bought from, or sold to, a Fund at times when the relevant A-shares may be sold or purchased on the relevant Chinese stock exchange. The A-shares market has a higher propensity for trading suspensions than many other global equity markets. Trading suspensions in certain stocks could lead to greater market execution risk and costs for a Fund. The SSE currently applies a daily price limit, set at 10%, of the amount of fluctuation permitted in the prices of A-shares during a single trading day. The daily price limit refers to price movements only and does not restrict trading within the relevant limit. There can be no assurance that a liquid market on an exchange will exist for any particular A-share or for any particular time.
Illiquid Securities
Each Fund may invest not more than 15% of its net assets in “illiquid securities,” which are securities that are not readily marketable (including securities whose disposition is restricted by contract or under federal securities laws), including, generally, securities that cannot be sold or disposed of in the ordinary course of business within seven calendar days at approximately the values ascribed to them by a Fund. A Fund may not be able to dispose of such securities in a timely fashion and for a fair price, which could result in losses to a Fund. In addition, illiquid securities are generally more difficult to value. Illiquid securities may include repurchase agreements with maturities greater than seven days, futures contracts and options thereon for which a liquid secondary market does not exist, time deposits maturing in more than seven calendar days, and securities of new and early stage companies whose securities are not publicly traded. The Funds may also purchase securities eligible for resale to qualified institutional buyers pursuant to Rule 144A under the Securities Act of 1933, as amended (the “1933 Act”). Such securities may be determined to be liquid based on an analysis taking into account, among other things, trading activity for such securities and the availability of reliable pricing information, among other factors. If there is a lack of trading interest in particular Rule 144A securities, a Fund’s holdings of those securities may be illiquid, resulting in undesirable delays in selling these securities at prices representing fair value.
Index-Related Securities (Equity Equivalents)
The Funds may invest in certain types of securities that enable investors to purchase or sell shares in a portfolio of securities that seeks to track the performance of an underlying index or a portion of an index. Such Equity Equivalents include, among others, DIAMONDS (interests in a portfolio of securities that seeks to track the performance of the Dow Jones Industrial Average), SPDRs or Standard & Poor’s Depositary Receipts (interests in a portfolio of securities that seeks to track the performance of the S&P 500 Index), and the Nasdaq-100 Trust (interests in a portfolio of securities of the largest and most actively traded non-financial companies listed on the Nasdaq Stock Market). Such securities are similar to index mutual funds, but they are traded on various stock exchanges or secondary markets. The value of these securities is dependent upon the performance of the underlying index on which they are based. Thus, these securities are subject to the same risks as their underlying indexes as well as the securities that make up those indices. For example, if the securities comprising an index that an index-related security seeks to track perform poorly, the index-related security will lose value.
Equity Equivalents may be used for several purposes, including to simulate full investment in the underlying index while retaining a cash balance for fund management purposes, to facilitate trading, to reduce transaction costs, or to seek higher investment returns where an Equity Equivalent is priced more attractively than securities in the underlying index. Because the expense associated with an investment in Equity Equivalents may be substantially lower than the expense of small investments directly in the securities comprising the indices they seek to track, investments in Equity Equivalents may provide a cost-effective means of diversifying the fund’s assets across a broad range of equity securities.
B-37
The prices of Equity Equivalents are derived and based upon the securities held by the particular investment company. Accordingly, the level of risk involved in the purchase or sale of an Equity Equivalent is similar to the risk involved in the purchase or sale of traditional common stock, with the exception that the pricing mechanism for such instruments is based on a basket of stocks. The market prices of Equity Equivalents are expected to fluctuate in accordance with both changes in the NAVs of their underlying indices and the supply and demand for the instruments on the exchanges on which they are traded. Substantial market or other disruptions affecting an Equity Equivalent could adversely affect the liquidity and value of the shares of the fund investing in such instruments.
Inflation-Indexed Bonds
Inflation-indexed bonds are fixed income securities whose principal value or coupon is periodically adjusted according to the rate of inflation. Inflation-indexed securities issued by the U.S. Treasury have maturities of five, ten, twenty, or thirty years, although it is possible that securities with other maturities will be issued in the future. The U.S. Treasury securities pay interest on a semi-annual basis, equal to a fixed percentage of the inflation-adjusted principal amount. For example, if a Fund purchased an inflation-indexed bond with a par value of $1,000 and a 3% real rate of return coupon (payable 1.5% semi-annually), and inflation over the first six months were 1%, the mid-year par value of the bond would be $1,010 and the first semi-annual interest payment would be $15.15 ($1,010 times 1.5%). If inflation during the second half of the year resulted in the whole years’ inflation equaling 3%, the end-of-year par value of the bond would be $1,030 and the second semi-annual interest payment would be $15.45 ($1,030 times 1.5%).
If the periodic adjustment rate measuring inflation falls, the principal value of inflation-indexed bonds will be adjusted downward, and consequently the interest payable on these securities (calculated with respect to a smaller principal amount) will be reduced. Repayment of the original bond principal upon maturity (as adjusted for inflation) is guaranteed in the case of U.S. Treasury inflation-indexed bonds, even during a period of deflation. However, the current market value of the bonds is not guaranteed, and will fluctuate. The Funds may also invest in other inflation related bonds which may or may not provide a similar guarantee. If a guarantee of principal is not provided, the adjusted principal value of the bond repaid at maturity may be less than the original principal.
The value of inflation-indexed bonds is expected to change in response to changes in real interest rates. Real interest rates in turn are tied to the relationship between nominal interest rates and the rate of inflation. Therefore, if inflation were to rise at a faster rate than nominal interest rates, real interest rates might decline, leading to an increase in value of inflation-indexed bonds. In contrast, if nominal interest rates increased at a faster rate than inflation, real interest rates might rise, leading to a decrease in value of inflation-indexed bonds.
While the values of these securities are expected to be protected from long-term inflationary trends, short-term increases in inflation may lead to a decline in value. If interest rates rise due to reasons other than inflation (for example, due to changes in currency exchange rates), investors in these securities may not be protected to the extent that the increase is not reflected in the bond’s inflation measure.
The periodic adjustment of U.S. Treasury inflation-indexed bonds is tied to the Consumer Price Index for All Urban Consumers (“CPI-U”), which is calculated monthly by the U.S. Bureau of Labor Statistics. The CPI-U is a measurement of changes in the cost of living, made up of components such as housing, food, transportation, and energy. Inflation-indexed bonds issued by a foreign government are generally adjusted to reflect a comparable inflation index, calculated by that government. There can be no assurance that the CPI-U or any foreign inflation index will accurately measure the real rate of inflation in the prices of goods and services. Moreover, there can be no assurance that the rate of inflation in a foreign country will be correlated to the rate of inflation in the United States.
Any increase in the principal amount of an inflation-indexed bond will be considered taxable ordinary income, even though investors do not receive their principal until maturity.
B-38
IPOs and Other Limited Opportunities
A Fund may purchase securities of companies that are offered pursuant to an initial public offering (“IPO”) or other similar limited opportunities. Although companies can be any age or size at the time of their IPO, they are often smaller and have a limited operating history, which involves a greater potential for the value of their securities to be impaired following the IPO. The price of a company’s securities may be highly unstable at the time of its IPO and for a period thereafter due to factors such as market psychology prevailing at the time of the IPO, the absence of a prior public market, the small number of shares available, and limited availability of investor information. Securities purchased in IPOs have a tendency to fluctuate in value significantly shortly after the IPO relative to the price at which they were purchased. These fluctuations could impact the NAV and return earned on a Fund’s shares. Investors in IPOs can be adversely affected by substantial dilution in the value of their shares, by sales of additional shares, and by concentration of control in existing management and principal shareholders. In addition, all of the factors that affect the performance of an economy or equity markets may have a greater impact on the shares of IPO companies. IPO securities tend to involve greater risk due, in part, to public perception and the lack of publicly available information and trading history.
Master Limited Partnerships
Certain of the Funds may invest in master limited partnerships (“MLPs”), which are limited partnerships in which ownership units are publicly traded. MLPs often own or own interests in properties or businesses that are related to oil and gas industries, including pipelines, although MLPs may invest in other types of investments, including credit-related investments. Generally, an MLP is operated under the supervision of one or more managing general partners. Limited partners (like a Fund when it invests in an MLP) are not involved in the day-to-day management of the partnership. Certain of the Funds also may invest in companies who serve (or whose affiliates serve) as MLP general partners.
Investments in MLPs are generally subject to many of the risks that apply to partnerships. For example, holders of the units of MLPs may have limited control and limited voting rights on matters affecting the partnership. There may be fewer corporate protections afforded investors in an MLP than investors in a corporation. Conflicts of interest may exist among unit holders, subordinated unit holders, and the general partner of an MLP, including those arising from incentive distribution payments. MLPs that concentrate in a particular industry or region are subject to risks associated with such industry or region. MLPs holding credit-related investments are subject to interest rate risk and the risk of default on payment obligations by debt issuers. Investments held by MLPs may be illiquid. MLP units may trade infrequently and in limited volume, and they may be subject to more abrupt or erratic price movements than securities of larger or more broadly based companies.
Certain of the Funds may also hold investments in limited liability companies that have many of the same characteristics and are subject to many of the same risks as master limited partnerships.
The manner and extent of a Fund’s investments in MLPs and limited liability companies may be limited by its intention to qualify as a regulated investment company under the Code, and any such investments by the Fund may adversely affect the ability of the Fund so to qualify.
Mortgage- and Asset-Backed Securities
Mortgage-backed securities, including collateralized mortgage obligations (“CMOs”) and certain stripped mortgage-backed securities, represent a participation in, or are secured by, mortgage loans. Asset-backed securities are structured like mortgage-backed securities, but instead of mortgage loans or interests in mortgage loans, the underlying assets may include such items as motor vehicle installment sales or installment loan contracts, leases of various types of real and personal property, receivables from credit card agreements, home equity loans, and student loans. Asset-backed securities may also include collateralized debt obligations as described below.
B-39
A Fund may invest in mortgage-backed securities issued or guaranteed by (i) U.S. Government agencies or instrumentalities such as the Government National Mortgage Association (“GNMA”) (also known as Ginnie Mae), the Federal National Mortgage Association (“FNMA”) (also known as Fannie Mae), and the Federal Home Loan Mortgage Corporation (“FHLMC”) (also known as Freddie Mac) or (ii) other issuers, including private companies. Privately issued mortgage-backed securities may include securities backed by commercial mortgages, which are mortgages on commercial, rather than residential, real estate. There is no assurance that the U.S. Government would provide financial support to its agencies and instrumentalities if not required to do so. In addition, certain governmental entities have been subject to regulatory scrutiny regarding their accounting policies and practices and other concerns that may result in legislation, changes in regulatory oversight and/or other consequences that could adversely affect the credit quality, availability, or investment character of securities issued by these entities.
Mortgage-backed securities have yield and maturity characteristics corresponding to the underlying assets. Unlike traditional debt securities, which may pay a fixed rate of interest until maturity, when the entire principal amount comes due, payments on certain mortgage-backed securities include both interest and a partial repayment of principal. Besides the scheduled repayment of principal, repayments of principal may result from the voluntary prepayment, refinancing, or foreclosure of the underlying mortgage loans. If property owners make unscheduled prepayments of their mortgage loans, these prepayments will result in early payment of the applicable mortgage-related securities. In that event a Fund may be unable to invest the proceeds from the early payment of the mortgage-related securities in an investment that provides as high a yield as the mortgage-related securities. Consequently, early payment associated with mortgage-related securities may cause these securities to experience significantly greater price and yield volatility than that experienced by traditional fixed income securities. The occurrence of mortgage prepayments is affected by factors including the level of interest rates, general economic conditions, the location and age of the mortgages, and other social and demographic conditions. During periods of falling interest rates, the rate of mortgage prepayments tends to increase, thereby tending to decrease the life of mortgage-related securities. During periods of rising interest rates, the rate of mortgage prepayments usually decreases, thereby tending to increase the life of mortgage-related securities. If the life of a mortgage-related security is inaccurately predicted, a Fund may not be able to realize the rate of return the investment adviser or subadviser expected.
Mortgage-backed and asset-backed securities are less effective than other types of securities as a means of “locking in” attractive long-term interest rates. One reason is the need to reinvest prepayments of principal; another is the possibility of significant unscheduled prepayments resulting from declines in interest rates. These prepayments would have to be reinvested at lower rates. As a result, these securities may have less potential for capital appreciation during periods of declining interest rates than other securities of comparable maturities, although they may have a similar or greater risk of decline in market value during periods of rising interest rates. Prepayments may also significantly shorten the effective maturities of these securities, especially during periods of declining interest rates. Conversely, during periods of rising interest rates, a reduction in prepayments may increase the effective maturities of these securities, subjecting them to a greater risk of decline in market value in response to rising interest rates than traditional debt securities, and, therefore, potentially increasing the volatility of the Funds. The terms of certain asset-backed securities may require early prepayment in response to certain credit events potentially affecting the values of the asset-backed securities.
At times, some mortgage-backed and asset-backed securities will have higher than market interest rates and therefore will be purchased at a premium above their par value. Prepayments may cause losses on securities purchased at a premium.
CMOs may be issued by a U.S. Government agency or instrumentality or by a private issuer. Although payment of the principal of, and interest on, the underlying collateral securing privately issued CMOs may be guaranteed by the U.S. Government or its agencies or instrumentalities, these CMOs represent obligations solely of the private issuer and are not insured or guaranteed by the U.S. Government, its agencies or instrumentalities, or any other person or entity.
B-40
CMOs typically issue multiple classes of securities, having different maturities, interest rates, and payment schedules, and with the principal and interest on the underlying mortgages allocated among the several classes in various ways. Payment of interest or principal on some classes or series of CMOs may be subordinated to payments on other classes or series and may be subject to contingencies; or some classes or series may bear some or all of the risk of default on the underlying mortgages. CMOs of different classes or series are generally retired in sequence as the underlying mortgage loans in the mortgage pool are repaid. If enough mortgages are repaid ahead of schedule, the classes or series of a CMO with the earliest maturities generally will be retired prior to their maturities. Thus, the early retirement of particular classes or series of a CMO would have the same effect as the prepayment of mortgages underlying other mortgage-backed securities. Conversely, slower than anticipated prepayments can extend the effective maturities of CMOs, subjecting them to a greater risk of decline in market value in response to rising interest rates than traditional debt securities, and, therefore, potentially increasing their volatility. Certain classes or series of CMOs may experience high levels of volatility in response to changes in interest rates and other factors.
Stripped mortgage-backed securities are usually structured with two classes that receive payments of interest or principal on a pool of mortgage loans. Stripped mortgage-backed securities may experience very high levels of volatility in response to changes in interest rates. The yield to maturity on an interest only or “IO” class of stripped mortgage-backed securities is extremely sensitive not only to changes in prevailing interest rates but also to the rate of principal payments (including prepayments) on the underlying assets. A rapid rate of principal prepayments will typically result in a substantial decline in the value of IOs and may have a significant adverse effect on a Fund’s yield to maturity to the extent it invests in IOs. If the assets underlying the IO experience greater than anticipated prepayments of principal, the Fund may fail to recoup fully, or at all, its initial investment in these securities. Conversely, principal only securities or “POs” tend to increase in value if prepayments are greater than anticipated and decline if prepayments are slower than anticipated.
The secondary market for stripped mortgage-backed securities may be more volatile and less liquid than that for other mortgage-backed securities, potentially limiting a Fund’s ability to buy or sell those securities at any particular time.
Subprime mortgage loans, which typically are made to less creditworthy borrowers, have a higher risk of default than conventional mortgage loans. Therefore, mortgage-backed securities backed by subprime mortgage loans may suffer significantly greater declines in value due to defaults, and may experience high levels of volatility.
A Fund may invest in collateralized debt obligations (“CDOs”), including collateralized bond obligations (“CBOs”), collateralized loan obligations (“CLOs”), and other similarly structured securities. CBOs, CLOs, and other CDOs are types of asset-backed securities. A CBO is typically an obligation of a trust backed (or collateralized) by a pool of securities, often including high risk, below investment grade debt securities. The collateral may include many different types of debt securities such as high yield debt, residential privately issued mortgage-related securities, commercial privately issued mortgage-related securities, trust preferred securities, and emerging market debt. A CLO is typically an obligation of a trust backed (or collateralized) by a pool of loans, which may include, among others, domestic and foreign senior secured loans, senior unsecured loans, and subordinate corporate loans, including loans that may be rated below investment grade or equivalent unrated loans. Other types of CDOs may include, by way of example, obligations of trusts backed by other types of assets representing obligations of various types, and may include high risk, below investment grade debt obligations. CBOs, CLOs, and other CDOs may pay management fees and administrative expenses. The risk profile of an investment in a CBO, CLO, or other CDO depends largely on the type of the collateral securities and the class of the instrument in which a Fund invests.
For CBOs, CLOs, and other CDOs, the cash flows from the trust are split into two or more portions, called tranches, varying in risk and yield. The riskiest portion is the “equity” tranche which typically bears the effects of defaults from the bonds or loans in the trust in the first instance and may serve to protect other, senior tranches from defaults. Typically, the more senior the tranche in a CBO, CLO, or other CDO, the higher its rating, although senior tranches can experience substantial losses due to actual defaults. The market values of CBO,
B-41
CLO, and CDO obligations may be affected by a number of factors, including, among others, changes in interest rates, defaults affecting junior tranches, market anticipation of defaults, and general market aversion to CBO, CLO, or other CDO securities as a class, or to the collateral backing them.
CBOs, CLOs, and other CDOs may be illiquid. In addition to the risks associated with debt securities discussed elsewhere in this SAI and the Funds’ Prospectus (e.g., interest rate risk and the risk of default), CBOs, CLOs, and other CDOs carry additional risks including, but not limited to: (i) the possibility that distributions from collateral securities will not be adequate to make interest or other payments on a CBO’s, CLO’s, or other CDO’s obligations; (ii) the collateral may decline in value or be in default; (iii) the risk that Funds may invest in tranches of CBOs, CLOs, or other CDOs that are subordinate to other classes; and (iv) the complex structure of the security may not be fully understood at the time of investment and may produce disputes with the issuer or unexpected investment results.
Other Income-Producing Securities
Other types of income-producing securities the Funds may purchase, include, but are not limited to, the following:
| · | Variable and floating rate obligations. These types of securities have variable or floating rates of interest and, under certain limited circumstances, may have varying principal amounts. These securities pay interest at rates that are adjusted periodically according to a specified formula, usually with reference to some interest rate index or market interest rate. The floating rate tends to decrease the security’s price sensitivity to changes in interest rates. These types of securities are relatively long-term instruments that often carry demand features permitting the holder to demand payment of principal at any time or at specified intervals prior to maturity. |
| In order to use these investments most effectively, a Fund’s investment adviser or subadviser must correctly assess probable movements in interest rates. This involves different skills than those used to select most portfolio securities. If the investment adviser or subadviser incorrectly forecasts such movements, a Fund could be adversely affected by the use of variable or floating rate obligations. |
| · | Standby commitments. These instruments, which are similar to a put, give a Fund the option to obligate a broker, dealer, or bank to repurchase a security held by the Fund at a specified price. |
| · | Tender option bonds. Tender option bonds are relatively long-term bonds that are coupled with the agreement of a third party, such as a broker, dealer, or bank, to grant the holders of such securities the option to tender the securities to the institution at periodic intervals. |
| · | Inverse floaters. These are debt instruments whose interest bears an inverse relationship to the interest rate on another security. Similar to variable and floating rate obligations, effective use of inverse floaters requires skills different from those needed to select most portfolio securities. If movements in interest rates are incorrectly anticipated, a Fund could lose money or the NAV of its shares could decline by the use of inverse floaters. |
| · | Strip bonds. Strip bonds are debt securities that are stripped of their interest, usually by a financial intermediary, after the securities are issued. The market value of these securities generally fluctuates more in response to changes in interest rates than interest-paying securities of comparable maturities. |
Standby commitments, tender option bonds, and instruments with demand features are primarily used by the Funds for the purpose of increasing the liquidity of a Fund’s portfolio.
Other Investment Companies
A Fund may invest in securities of other open- or closed-end investment companies, including ETFs, traded on one or more national securities exchanges. Provisions of the 1940 Act may limit the ability of a Fund to invest in certain investment companies or may limit the amount of its assets that a Fund may invest in any investment company or investment companies in general.
B-42
A Fund may, for example, invest in other investment companies during periods when it has large amounts of uninvested cash, when its investment adviser or subadviser believes share prices of other investment companies offer attractive values, or to gain or maintain exposure to various asset classes and markets or types of strategies and investments. A Fund may invest in shares of another investment company in order to gain indirect exposure to markets in a country where the Fund is not able to invest freely, or to gain indirect exposure to one or more issuers whose securities it may not buy directly. As a stockholder in an investment company, a Fund would bear its ratable share of that investment company’s expenses and would remain subject to payment of the Fund’s management fees with respect to assets so invested. Shareholders would therefore be subject to duplicative expenses to the extent a Fund invests in other investment companies. Shares of open-end investment companies traded on a securities exchange may not be redeemable by a Fund in all cases.
If a Fund invests in another investment company, it is exposed to the risk that the other investment company will not perform as expected. A Fund is exposed indirectly to all of the risks applicable to an investment in such other investment company. In addition, lack of liquidity in the other investment company could result in its value being more volatile than the underlying portfolio of securities, and may limit the ability of a Fund to sell or redeem its interest in the investment company at a time or at a price it might consider desirable. The investment policies and limitations of the other investment company may not be the same as those of the investing Fund; as a result, the Fund may be subject to additional or different risks, or may achieve a reduced investment return, as a result of its investment in another investment company. If the other investment company is an ETF or other product traded on a securities exchange or otherwise actively traded, its shares may trade at a premium or discount to their NAV, an effect that might be more pronounced in less liquid markets. A Fund’s investment adviser or subadviser or their affiliates may serve as investment adviser to an investment company in which the Fund may invest, leading to potential conflicts of interest. For example, a Fund’s investment adviser or subadviser may receive fees based on the amount of assets invested in the other investment company. Investment by a Fund in another investment company may be beneficial to its investment adviser or subadviser in the management of the other investment company, by helping to achieve economies of scale or enhancing cash flows. Due to this and other factors, a Fund’s investment adviser or subadviser may have an incentive to invest the Fund’s assets in an investment company sponsored or managed by it or its affiliates in lieu of investments by the Fund directly in portfolio securities, or may have an incentive to invest in such an investment company over an investment company sponsored or managed by others. Similarly, a Fund’s investment adviser or subadviser may have an incentive to delay or decide against the sale of interests held by the Fund in an investment company sponsored or managed by it or its affiliates. It is possible that other clients of a Fund’s investment adviser or subadviser or its affiliates will purchase or sell interests in an investment company sponsored or managed by it at prices and at times more favorable than those at which the Fund does so.
T. Rowe Price may invest the assets of the Blue Chip Growth Fund, Mid Cap Growth Equity II Fund, or Small Company Value Fund, respectively, into money market funds managed pursuant to applicable SEC exemptive orders. T. Rowe Price offers a diversified and cost-effective investment vehicle for the cash reserves of client accounts. Therefore, T. Rowe Price may choose to invest any available cash reserves in a money market fund established for the exclusive use of the T. Rowe Price family of mutual funds and other T. Rowe Price clients. Currently, one such money market fund is in operation—T. Rowe Price Government Reserve Fund (“GRF”), a series of the T. Rowe Price Reserve Investment Funds, Inc. Additional series may be created in the future. This Fund was created and operates under an Exemptive Order issued by the SEC (Investment Company Act Release No. IC-22770, July 29, 1997).
The Funds subadvised by T. Rowe Price may invest up to 25% of total assets in the GRF. GRF must comply with the requirements of Rule 2a-7 under the 1940 Act governing money market funds. The GRF invests primarily in a portfolio of U.S. Government backed securities, primarily U.S. Treasuries and repurchase agreements thereon. The funds do not pay an advisory fee to the investment manager at T. Rowe Price, but will incur other expenses. However, GRF is expected by T. Rowe Price to operate at a very low expense ratio. The
B-43
Funds will only invest in GRF to the extent it is consistent with its investment objective and program. GRF is not insured nor guaranteed by the U.S. Government, and there is no assurance it will maintain a stable NAV of $1.00 per share.
Partly Paid Securities
These securities are paid for on an installment basis. A partly paid security trades net of outstanding installment payments—the buyer “takes over payments.” The buyer’s rights are typically restricted until the security is fully paid. If the value of a partly paid security declines before a Fund finishes paying for it, the Fund will still owe the payments, but may find it hard to sell and as a result will incur a loss.
Portfolio Management
A Fund’s investment adviser or subadviser uses trading as a means of managing the portfolio of the Fund in seeking to achieve its investment objective. Transactions will occur when a Fund’s investment adviser or subadviser believes that the trade, net of transaction costs, will improve interest income or capital appreciation potential, or will lessen capital loss potential. Whether the goals discussed above will be achieved through trading depends on the Fund’s investment adviser’s or subadviser’s ability to evaluate particular securities and anticipate relevant market factors, including interest rate trends and variations from such trends. If such evaluations and expectations prove to be incorrect, a Fund’s income or capital appreciation may be reduced and its capital losses may be increased. In addition, high turnover in a Fund could result in additional brokerage commissions to be paid by that Fund. See also “Taxation” below.
The Funds may pay brokerage commissions to affiliates of one or more affiliates of the Funds’ investment adviser or subadvisers.
Portfolio Turnover
Portfolio turnover involves brokerage commissions and other transaction costs, which the relevant Fund will bear directly, and could involve realization of taxable capital gains. To the extent that portfolio turnover results in realization of net short-term capital gains, such gains ordinarily are treated as ordinary income when distributed to shareholders. Portfolio turnover rates are shown in the “Fees and Expenses of the Fund” and “Financial Highlights” sections of the Prospectus. See the “Taxation” and “Portfolio Transactions and Brokerage” sections in this SAI for additional information.
Real Estate-Related Investments; Real Estate Investment Trusts
Factors affecting the performance of real estate may include excess supply of real property in certain markets, changes in zoning laws, environmental regulations and other governmental action, completion of construction, changes in real estate value and property taxes, losses from casualty, condemnation, or natural disaster, sufficient level of occupancy, adequate rent to cover operating expenses, and local and regional markets for competing assets. The performance of real estate may also be affected by changes in interest rates, prudent management of insurance risks, and social and economic trends.
Real estate investment trusts (“REITs”) that may be purchased by a Fund include equity REITs, which own real estate directly, mortgage REITs, which make construction, development, or long-term mortgage loans, and hybrid REITs, which share characteristics of equity REITs and mortgage REITs. Equity REITs will be affected by, among other things, changes in the value of the underlying property owned by the REITs, while mortgage REITs will be affected by, among other things, the value of the properties to which they have extended credit. REITs are dependent upon the skill of each REIT’s management.
A Fund could, under certain circumstances, own real estate directly as a result of a default on debt securities it owns or from an in-kind distribution of real estate from a REIT. Risks associated with such ownership could
B-44
include potential liabilities under environmental laws and the costs of other regulatory compliance. If a Fund has rental income or income from the direct disposition of real property, the receipt of such income may adversely affect its ability to retain its tax status as a regulated investment company and thus its ability to avoid taxation on its income and gains distributed to its shareholders. REITs are also subject to substantial cash flow dependency, defaults by borrowers, self-liquidation, and the risk of failing to qualify for favorable tax treatment under the Code and/or to maintain exempt status under the 1940 Act. If a Fund invests in REITs, investors would bear not only a proportionate share of the expenses of that Fund, but also, indirectly, expenses of the REITs.
Repurchase Agreements
A repurchase agreement is a contract under which a Fund acquires a security for a relatively short period (usually not more than one week) subject to the obligation of the seller to repurchase and the Fund to resell such security at a fixed time and price (representing the Fund’s cost plus interest). Repurchase agreements may also be viewed as loans made by a Fund which are collateralized by the securities subject to repurchase. The investment adviser or subadviser will monitor such transactions to ensure that the value of the underlying securities will be at least equal at all times to the total amount of the repurchase obligation, including the interest factor. If the seller defaults, a Fund could realize a loss on the sale of the underlying security to the extent that the proceeds of the sale including accrued interest are less than the resale price provided in the agreement including interest. In addition, if the seller should be involved in bankruptcy or insolvency proceedings, the Fund may incur delay and costs in selling the underlying security or may suffer a loss of principal and interest if the Fund is treated as an unsecured creditor and required to return the underlying collateral to the seller’s estate. There is no limit on the Funds’ investment in repurchase agreements.
Restricted Securities
Restricted securities are subject to legal restrictions on their sale. Difficulty in selling securities may result in a loss or be costly to a Fund. Restricted securities generally can be sold in privately negotiated transactions, pursuant to an exemption from registration under the 1933 Act, or in a registered public offering. Where registration is required, the holder of a registered security may be obligated to pay all or part of the registration expense and a considerable period may elapse between the time it decides to seek registration and the time it may be permitted to sell a security under an effective registration statement. If, during such a period, adverse market conditions were to develop, the holder might obtain a less favorable price than prevailed when it decided to seek registration of the security.
Reverse Repurchase Agreements and Treasury Rolls
A Fund may enter into reverse repurchase agreements or Treasury rolls with banks and broker-dealers to enhance return. Reverse repurchase agreements involve sales by a Fund of portfolio securities concurrently with an agreement by the Fund to repurchase the same securities at a later date at a fixed price (typically equal to the original sale price plus interest). During the reverse repurchase agreement period, the Fund continues to receive principal and interest payments on the securities and also has the opportunity to earn a return on the purchase price received by it from the counterparty. Similarly, in a Treasury roll transaction, a Fund sells a Treasury security and simultaneously enters into an agreement to repurchase the security from the buyer at a later date, at the original sale price plus interest. The repurchase price is typically adjusted to provide the Fund the economic benefit of any interest that accrued on the Treasury security during the term of the transaction. The Fund may use the purchase price received by it to earn additional return during the term of the Treasury roll transaction. Reverse repurchase agreements and Treasury rolls are similar to a secured borrowing of a Fund and generally create investment leverage. If the counterparty in such a transaction files for bankruptcy or becomes insolvent, a Fund’s use of the proceeds from the sale of its securities may be restricted or forfeited, and the counterparty may fail to return/resell the securities in question to the Fund. A Fund may enter into reverse repurchase agreements or Treasury rolls without limit up to the amount permitted under applicable law.
B-45
Securities Lending
A Fund may lend its portfolio securities. The Fund expects that, in connection with any securities loan: (1) the loan will be secured continuously by collateral consisting of U.S. Government securities, cash, or cash equivalents adjusted daily to have market value at least equal to the current market value of the securities loaned; (2) the Fund will have the right at any time on reasonable notice to call the loan and regain the securities loaned; (3) the Fund will receive an amount equal to any interest or dividends paid on the loaned securities; and (4) the aggregate market value of securities the Fund has loaned will not at any time exceed one-third (or such other lower limit as the Board may establish) of the total assets of the Fund. The risks in lending portfolio securities, as with other extensions of credit, include a possible delay in recovering the loaned securities or a possible loss of rights in the collateral should the borrower fail financially. Voting rights or rights to consent with respect to the loaned securities pass to the borrower, although a Fund would retain the right to call the loans at any time on reasonable notice, and may do so in order that the securities may be voted in an appropriate case.
A Fund’s securities loans will be made by a third-party agent appointed by the Fund, although the agent is only permitted to make loans to borrowers previously approved by the Fund’s Board. Any cash collateral securing a loan of securities by a Fund will typically be invested by the agent. The investment of the collateral will be at the risk and for the account of the Fund. The earnings on the investment of collateral will be split between the Fund and the agent; as a result, the agent may have an incentive to invest the collateral in riskier investments than if it were not to share in the earnings. It is possible that any loss on the investment of collateral for a securities loan will exceed (potentially by a substantial amount) the Fund’s earnings on the loan.
Short Sales
A short sale is a transaction in which a fund sells a security it does not own in anticipation that the market price of that security will decline. When a fund makes a short sale on a security, it must borrow the security sold short and deliver it to a broker dealer through which it made the short sale as collateral for its obligation to deliver the security upon the conclusion of the sale. A fund may have to pay a fee to borrow particular securities and is often obligated to pay over any accrued interest and dividends on such borrowed securities. If the price of the security sold short increases between the time of the short sale and the time a fund replaces the borrowed security, a fund will incur a loss, which could be unlimited, in cases where a fund is unable for whatever reason to close out its short position; conversely, if the price declines, a fund will realize a capital gain. Any gain will be decreased, and any loss increased, by the transaction costs described above. The successful use of short selling may be adversely impacted by imperfect correlation between movements in the price of the security sold short and the securities being hedged.
Selling short “against-the-box” refers to the sale of securities actually owned by the seller but held in safekeeping. In such short sales, while the short position is open, a fund must own an equal amount of such securities, or by virtue of ownership of securities have the right, without payment of further consideration, to obtain an equal amount of securities sold short. Short sales against-the-box generally produce current recognition of gain (but not loss) for federal income tax purposes on the constructive sale of securities “in the box” prior to the time the short position is closed out.
Trade Claims
Certain of the Funds may purchase trade claims and other obligations of, or claims against, companies in bankruptcy proceedings. Trade claims are claims for payment by vendors and suppliers for products and services previously furnished to the companies in question. Other claims may include, for example, claims for payment under financial or derivatives obligations. Trade claims may be purchased directly from the creditor or through brokers or from dealers, and are typically purchased at a significant discount from their face amounts. There is no guarantee that a debtor will ever be able to satisfy its obligations on such claims. Trade claims are subject to the risks associated with low-quality and distressed obligations.
B-46
Trust Preferred Securities
Trust preferred securities are typically issued by corporations, generally in the form of interest bearing notes with preferred securities characteristics, or by an affiliated trust, generally in the form of beneficial interests in subordinated debentures or similarly structured securities. Trust preferred securities may pay interest at either fixed or adjustable rates. Trust preferred securities may be issued with a final maturity date, or may be perpetual.
Trust preferred securities are typically junior and fully subordinated liabilities of an issuer and benefit from a guarantee that is junior and fully subordinated to the other liabilities of the guarantor. In addition, trust preferred securities typically permit an issuer to defer the payment of income for five years or more without triggering an event of default. Because of their subordinated position in the capital structure of an issuer, the ability to defer payments for extended periods of time without default consequences to the issuer, and certain other features (such as restrictions on common dividend payments by the issuer or ultimate guarantor when full cumulative payments on the trust preferred securities have not been made), these trust preferred securities are often treated as close substitutes for traditional preferred securities, both by issuers and investors.
Many trust preferred securities are issued by trusts or other special purpose entities established by operating companies and are not a direct obligation of an operating company. At the time the trust or special purpose entity sells such preferred securities to investors, it purchases debt of the operating company (with terms comparable to those of the trust or special purpose entity securities). The trust or special purpose entity is generally required to be treated as transparent for Federal income tax purposes, and the holders of the trust preferred securities are treated for tax purposes as owning beneficial interests in the underlying debt of the operating company. Accordingly, payments on the trust preferred securities are treated as interest rather than dividends for Federal income tax purposes. The trust or special purpose entity in turn would be a holder of the operating company’s debt and would typically be subordinated to other classes of the operating company’s debt.
U.S. Government Securities
The Funds may invest in U.S. Government securities. These include obligations issued or guaranteed by the U.S. Government or any of its agencies or instrumentalities. Payment of principal and interest on U.S. Government obligations (i) may be backed by the full faith and credit of the United States (as with U.S. Treasury obligations and GNMA certificates) or (ii) may be backed solely by the issuing or guaranteeing agency or instrumentality itself (as with FNMA notes). In the latter case, the investor must look principally to the agency or instrumentality issuing or guaranteeing the obligation for ultimate repayment. Such agency or instrumentality may be privately owned. There can be no assurance that the U.S. Government would provide financial support to its agencies or instrumentalities where it is not obligated to do so. U.S. Government securities are subject to interest rate risk, and, in some cases, may be subject to credit risk. Although FHLMC and FNMA are now under conservatorship by the Federal Housing Finance Agency, and are benefiting from a liquidity backstop of the U.S. Treasury, no assurance can be given that these initiatives will be successful. As a general matter, the value of debt instruments, including U.S. Government obligations, declines when market interest rates increase and rises when market interest rates decrease. Certain types of U.S. Government obligations are subject to fluctuations in yield or value due to their structure or contract terms.
Utility Industries
Risks that are intrinsic to the utility industries include difficulty in obtaining an adequate return on invested capital, difficulty in financing large construction programs during an inflationary period, restrictions on operations and increased cost and delays attributable to environmental considerations and regulation, difficulty in raising capital in adequate amounts on reasonable terms in periods of high inflation and unsettled capital markets, technological innovations that may render existing plants, equipment, or products obsolete, the potential impact of natural or man-made disasters, increased costs and reduced availability of certain types of fuel, occasionally reduced availability and high costs of natural gas for resale, the effects of energy conservation, the effects of a
B-47
national energy policy and lengthy delays and greatly increased costs and other problems associated with the design, construction, licensing, regulation, and operation of nuclear facilities for electric generation, including, among other considerations, the problems associated with the use of radioactive materials and the disposal of radioactive wastes. There are substantial differences among the regulatory practices and policies of various jurisdictions, and any given regulatory agency may make major shifts in policy from time to time. There is no assurance that regulatory authorities will, in the future, grant rate increases or that such increases will be adequate to permit the payment of dividends on common stocks issued by a utility company. Additionally, existing and possible future regulatory legislation may make it even more difficult for utilities to obtain adequate relief. Certain of the issuers of securities held in the Fund’s portfolio may own or operate nuclear generating facilities. Governmental authorities may from time to time review existing policies and impose additional requirements governing the licensing, construction and operation of nuclear power plants. Prolonged changes in climatic conditions can also have a significant impact on both the revenues of an electric and gas utility as well as the expenses of a utility, particularly a hydro-based electric utility.
Utility companies in the United States and in foreign countries are generally subject to regulation. In the United States, most utility companies are regulated by state and/or federal authorities. Such regulation is intended to ensure appropriate standards of service and adequate capacity to meet public demand. Generally, prices are also regulated in the United States and in foreign countries with the intention of protecting the public while ensuring that the rate of return earned by utility companies is sufficient to allow them to attract capital in order to grow and continue to provide appropriate services. There can be no assurance that such pricing policies or rates of return will continue in the future.
The nature of regulation of the utility industries continues to evolve both in the United States and in foreign countries. In recent years, changes in regulation in the United States increasingly have allowed utility companies to provide services and products outside their traditional geographic areas and lines of business, creating new areas of competition within the industries. In some instances, utility companies are operating on an unregulated basis. Because of trends toward deregulation and the evolution of independent power producers as well as new entrants to the field of telecommunications, non-regulated providers of utility services have become a significant part of their respective industries. The investment adviser or subadviser believes that the emergence of competition and deregulation will result in certain utility companies being able to earn more than their traditional regulated rates of return, while others may be forced to defend their core business from increased competition and may be less profitable. Reduced profitability, as well as new uses of funds (such as for expansion, operations, or stock buybacks) could result in cuts in dividend payout rates. The investment adviser or subadviser seeks to take advantage of favorable investment opportunities that may arise from these structural changes. Of course, there can be no assurance that favorable developments will occur in the future.
Foreign utility companies are also subject to regulation, although such regulations may or may not be comparable to those in the United States. Foreign utility companies may be more heavily regulated by their respective governments than utilities in the United States and, as in the United States, generally are required to seek government approval for rate increases. In addition, many foreign utilities use fuels that may cause more pollution than those used in the United States, which may require such utilities to invest in pollution control equipment to meet any proposed pollution restrictions. Foreign regulatory systems vary from country to country and may evolve in ways different from regulation in the United States.
A Fund’s investment policies are designed to enable it to capitalize on evolving investment opportunities throughout the world. For example, the rapid growth of certain foreign economies will necessitate expansion of capacity in the utility industries in those countries. Although many foreign utility companies currently are government-owned, thereby limiting current investment opportunities for a Fund, the investment adviser or subadviser believes that, in order to attract significant capital for growth, foreign governments are likely to seek global investors through the privatization of their utility industries. Privatization, which refers to the trend toward investor ownership of assets rather than government ownership, is expected to occur in newer, faster-growing economies and in mature economies. Of course, there is no assurance that such favorable developments will occur or that investment opportunities in foreign markets will increase.
B-48
The revenues of domestic and foreign utility companies generally reflect the economic growth and development in the geographic areas in which they do business. The investment adviser or subadviser will take into account anticipated economic growth rates and other economic developments when selecting securities of utility companies.
Zero-Coupon, Step Coupon and Pay-In-Kind Securities
Other debt securities in which the Funds may invest include zero coupon, step coupon, and pay-in-kind instruments. Zero coupon bonds are issued and traded at a discount from their face value. They do not entitle the holder to any periodic payment of interest prior to maturity. Step coupon bonds trade at a discount from their face value and pay coupon interest. The coupon rate is low for an initial period and then increases to a higher coupon rate thereafter. The discount from the face amount or par value depends on the time remaining until cash payments begin, prevailing interest rates, liquidity of the security, and the perceived credit quality of the issue. Pay-in-kind securities are debt or preferred stock securities that require or permit payment of interest in the form of additional securities. Payment-in-kind securities allow the issuer to avoid or delay the need to generate cash to meet current interest payments and, as a result, may involve greater risk than securities that pay interest currently or in cash.
Current federal income tax law requires holders of zero coupon and step coupon securities to report the portion of the original issue discount on such securities that accrues during a given year as interest income, even though holders receive no cash payments of interest during the year. In order to qualify as a regulated investment company under the Code, a Fund must distribute its investment company taxable income, including the original issue discount accrued on zero coupon or step coupon bonds. Because a Fund will not receive cash payments on a current basis in respect of accrued original issue discount on zero coupon or step coupon bonds during the period before interest payments begin, and may not receive cash payments on payment-in-kind securities until maturity or redemption, in some years that Fund may have to distribute cash obtained from other sources in order to satisfy the distribution requirements under the Code. A Fund might obtain such cash from selling other portfolio holdings which might cause a Fund to incur capital gains or losses on the sale. Additionally, these actions are likely to reduce the assets to which Fund expenses could be allocated and to reduce the rate of return for a Fund. In some circumstances, such sales might be necessary in order to satisfy cash distribution requirements even though investment considerations might otherwise make it undesirable for a Fund to sell the securities at the time.
Generally, the market prices of zero coupon, step coupon, and pay-in-kind securities are more volatile than the prices of securities that pay interest periodically and in cash and are likely to respond to changes in interest rates to a greater degree than other types of debt securities.
DISCLOSURE OF PORTFOLIO HOLDINGS
The Trustees of the Funds, including a majority of Trustees who are not “interested persons” of the Funds (as defined in the 1940 Act), have adopted policies and procedures with respect to the disclosure of the Funds’ portfolio holdings. These policies and procedures generally provide that no disclosure of portfolio holdings information may be made unless publicly disclosed as described below or made as part of the daily investment activities of the Funds to the Funds’ investment adviser, subadvisers, or any of their affiliates who provide services to the Funds, which by explicit agreement or by virtue of their respective duties to the Funds, are required to maintain confidentiality of the information disclosed. Certain limited exceptions pursuant to the Funds’ policies and procedures are described below. The Funds’ portfolio holdings information may not be disseminated for compensation. Any exceptions to the Funds’ policies and procedures may be made only if approved in writing by the Funds’ Principal Executive Officer and the Funds’ Chief Compliance Officer as being in the best interests of the relevant Fund, and then only if the recipients are subject to a written confidentiality agreement specifying that the relevant Fund’s portfolio holdings information is the confidential property of the Fund and may not be used for any purpose except in connection with the provision of services to the Fund and, in particular, that such information may not be traded upon. Any such exceptions must be reported to the Funds’
B-49
Board at its next regularly scheduled meeting. It was determined that these policies and procedures are reasonably designed to ensure that disclosure of portfolio holdings information is in the best interests of a Fund’s shareholders and appropriately address the potential for conflicts between the interests of a Fund’s shareholders, on the one hand, and those of MML Advisers or any affiliated person of the Fund or MML Advisers on the other.
Acting pursuant to the policies and procedures adopted by the Trustees of the Funds, the Funds’ investment adviser and subadvisers are primarily responsible for compliance with these policies and procedures, which includes maintaining such internal informational barriers (e.g., “Chinese walls”) as each believes are reasonably necessary for preventing the unauthorized disclosure of portfolio holdings information. Pursuant to Rule 38a-1 under the 1940 Act, the Trustees will periodically (as needed, but at least annually) receive reports from the Funds’ Chief Compliance Officer regarding the operation of these policies and procedures, including a confirmation by the Chief Compliance Officer that the investment adviser’s and the subadvisers’ policies, procedures, and/or processes are reasonably designed to comply with the Funds’ policies and procedures in this regard.
Public Disclosures
The Funds’ portfolio holdings are currently disclosed to the public through required filings with the SEC and as described below. The Funds file their portfolio holdings with the SEC for each fiscal quarter on Form N-CSR (with respect to each annual period and semi-annual period) no later than 70 days after the end of the applicable quarter and Form N-Q (with respect to the first and third quarters of the Funds’ fiscal year) no later than 60 days after the end of the applicable quarter. Shareholders may obtain the Funds’ Form N-CSR and N-Q filings on the SEC’s Web site at http://www.sec.gov. The Funds’ annual and semiannual reports are also mailed to shareholders no later than 60 days after the end of the applicable quarter.
The Funds’ most recent portfolio holdings as of the end of each quarter are available on http://www.massmutual.com/funds no earlier than 15 calendar days after the end of each quarter.
A Fund’s portfolio holdings may also be made available on http://www.massmutual.com/funds at other times as approved in writing by the Funds’ Principal Executive Officer and the Funds’ Chief Compliance Officer as being in the best interests of the relevant Fund.
Other Disclosures
Acting pursuant to the policies and procedures adopted by the Trustees of the Funds, and to the extent permitted under the 1933 and 1940 Acts, the Funds, the Funds’ investment adviser, and the Funds’ subadvisers may distribute (or authorize the Funds’ custodians to distribute) information regarding the Funds’ portfolio holdings more frequently than as provided to the public on a confidential basis to various service providers and others who require such information in order to fulfill their contractual duties with respect to the routine investment activities or operations of the Funds. Such service providers or others must, by explicit agreement or by virtue of their respective duties to the Funds, be required to maintain confidentiality of the information disclosed. These service providers include the Funds’ custodians (State Street or Brown Brothers Harriman & Co., as applicable), the Funds’ sub-administrators (State Street and MassMutual), the Funds’ independent registered public accounting firm (Deloitte & Touche LLP), legal counsel (Ropes & Gray LLP), financial printer (R.R. Donnelley), any proxy voting service employed by the Funds, MML Advisers, or any of the Funds’ subadvisers, providers of portfolio analysis tools, and any pricing services employed by the Funds. The Funds or the Funds’ investment adviser may also periodically provide non-public information about their portfolio holdings to rating and ranking organizations, such as Lipper Inc. and Morningstar Inc., in connection with those firms’ research on and classification of the Funds and in order to gather information about how the Funds’ attributes (such as volatility, turnover, and expenses) compared with those of peer funds. The Funds, the Funds’ investment adviser, or the Funds’ subadvisers may distribute (or authorize the Funds’ custodian to distribute) information regarding the Funds’ portfolio holdings more frequently than as provided to the public on a confidential basis to various service providers and others who require such information in order to fulfill
B-50
non-routine legitimate business activities related to the management, investment activities, or operations of the Funds. Such disclosures may be made only if (i) the recipients of such information are subject to a written confidentiality agreement specifying that the Funds’ portfolio holdings information is the confidential property of the Funds and may not be used for any purpose except in connection with the provision of services to the Funds and, in particular, that such information may not be traded upon; and (ii) if the Funds’ Chief Compliance Officer (or a person designated by the Chief Compliance Officer) determines that, under the circumstances, disclosure is in the best interests of the relevant Fund’s shareholders. The information distributed is limited to the information that the Funds, MML Advisers, or the relevant subadviser believes is reasonably necessary in connection with the services provided by the recipient receiving the information.
INVESTMENT RESTRICTIONS OF THE FUNDS
FUNDAMENTAL INVESTMENT RESTRICTIONS OF THE FUNDS
The following is a description of certain fundamental restrictions on investments of the Funds which may not be changed without a vote of a majority of the outstanding shares of the applicable Fund. Investment restrictions that appear below or elsewhere in this SAI and in the Prospectus which involve a maximum percentage of securities or assets shall not be considered violated unless an excess over the percentage occurs immediately after, and is caused by, an acquisition or encumbrance of securities or assets of, or borrowings by or on behalf of, a Fund. Each Fund may not:
(1) with the exception of the Focused Value Fund and Growth Opportunities Fund, purchase securities (other than securities issued, guaranteed or sponsored by the U.S. Government or its agencies or instrumentalities or securities issued by investment companies) of any one issuer if, as a result, more than 5% of a Fund’s total assets would be invested in the securities of such issuer or the Fund would own more than 10% of the outstanding voting securities of such issuer, except that up to 25% of the Fund’s total assets may be invested without regard to these limitations.
(2) purchase commodities or commodity contracts, except that a Fund may enter into futures contracts, options, options on futures, and other financial or commodity transactions to the extent consistent with applicable law and the Fund’s Prospectus and SAI at the time.
(3) purchase or sell real estate except that it may dispose of real estate acquired as a result of the ownership of securities or other instruments. (This restriction does not prohibit a Fund from investing in securities or other instruments backed by real estate or in securities of companies engaged in the real estate business.)
(4) participate in the underwriting of securities, except to the extent that a Fund may be deemed an underwriter under federal securities laws by reason of acquisitions or distributions of portfolio securities (e.g., investments in restricted securities and instruments subject to such limits as imposed by the Board and/or law).
(5) make loans, except to the extent permitted by the 1940 Act, the rules and regulations thereunder (as such statute, rules or regulations may be amended from time to time) or by guidance regarding or interpretations of, or exemptive orders under, the 1940 Act or the rules or regulations thereunder published by appropriate regulatory authorities.
(6) borrow money or issue senior securities, except to the extent permitted by the 1940 Act, the rules and regulations thereunder (as such statute, rules or regulations may be amended from time to time) or by guidance regarding or interpretations of, or exemptive orders under, the 1940 Act or the rules or regulations thereunder published by appropriate regulatory authorities.
(7) concentrate its investments in any one industry, as determined by the Board, and in this connection a Fund will not acquire securities of companies in any one industry if, immediately after giving effect to any such acquisition, 25% or more of the value of the total assets of the Fund would be invested in such industry, with the following exceptions:
B-51
(a) There is no limitation for securities issued or guaranteed by the U.S. Government or its agencies or instrumentalities.
(b) In the case of the S&P 500 Index Fund, S&P Mid Cap Index Fund, Russell 2000 Small Cap Index Fund, and MSCI EAFE International Index Fund, except to the extent the Index is so concentrated.
(c) There is no limitation for securities issued by other investment companies.
NON-FUNDAMENTAL INVESTMENT RESTRICTIONS OF THE FUNDS
In addition to the investment restrictions adopted as fundamental policies set forth above, the Funds operate with certain non-fundamental policies that may be changed by a vote of a majority of the Board members at any time.
In accordance with such policies, each Fund may not:
(1) to the extent required by applicable law at the time, purchase additional securities when its borrowings, less amounts receivable on sales of portfolio securities, exceed 5% of its total assets.
(2) with the exception of the Total Return Bond Fund and BlackRock Global Allocation Fund, sell securities short, but reserves the right to sell securities short against the box.
(3) invest more than 15% of its net assets in illiquid securities. This restriction does not limit the purchase of securities eligible for resale to qualified institutional buyers pursuant to Rule 144A under the 1933 Act, provided that such securities are determined to be liquid by MML Advisers or the subadviser pursuant to Board approved guidelines.
(4) to the extent that shares of the Fund are purchased or otherwise acquired by other series of the Trust, acquire any securities of registered open-end investment companies or registered unit investment trusts in reliance on Section 12(d)(1)(F) or Section 12(d)(1)(G) of the 1940 Act, except this restriction shall not prohibit the investment by the Blue Chip Growth Fund, Mid Cap Growth Equity II Fund, or the Small Company Value Fund in money market funds managed by T. Rowe Price pursuant to an exemptive order.
With respect to limitation (3) above, if there is a lack of trading interest in particular Rule 144A securities, a Fund’s holdings of those securities may be illiquid, resulting in the possibility of undesirable delays in selling these securities at prices representing fair value. If, through a change in values, net assets, or other circumstances, the Fund were in a position where more than 15% of its net assets was invested in illiquid securities, it would take appropriate orderly steps, as deemed necessary, to protect liquidity.
None of the foregoing fundamental or non-fundamental investment restrictions will limit the investment by the BlackRock Global Allocation Fund in any subsidiary of the Fund. The BlackRock Global Allocation Fund currently expects that it will consider the investments of the Select Cayman Fund to be investments of the Fund directly for purposes of meeting any applicable limitations on the BlackRock Global Allocation Fund’s investments in any single industry and for purposes of determining its compliance with the diversification requirements under the 1940 Act; in addition, to the extent the Select Cayman Fund borrows money, the BlackRock Global Allocation Fund will consider such borrowings to be borrowings by the BlackRock Global Allocation Fund directly for purposes of meeting any express limitation on the ability of the Fund to borrow money.
B-52
The Trust has a Board comprised of seven Trustees, a majority of which are not “interested persons” (as defined in the 1940 Act) of the Trust. The Board is generally responsible for the management and oversight of the business and affairs of the Trust. The Trustees formulate the general policies of the Trust and the Funds, approve contracts, and authorize Trust officers to carry out the decisions of the Board. To assist them in this role, the Trustees who are not “interested persons” of the Trust (“Independent Trustees”) have retained independent legal counsel. As investment adviser and subadvisers to the Funds, respectively, MML Advisers and American Century, Barrow Hanley, BlackRock, Brandywine Global, Federated Clover, Frontier, Harris, Huber Capital Management, Invesco, J.P. Morgan, Jackson Square, Loomis Sayles, MetWest, MFS, NTI, OFI Global, Sands Capital, Systematic, T. Rowe Price, Wellington Management, Western Asset, and Western Asset Limited may be considered part of the management of the Trust. The Trustees and principal officers of the Trust are listed below together with information on their positions with the Trust, address, age, principal occupations, and other principal business affiliations during the past five years.
The Board has appointed an Independent Trustee Chairperson of the Trust. The Chairperson presides at Board meetings and may call a Board or committee meeting when he deems it necessary. The Chairperson participates in the preparation of Board meeting agendas and may generally facilitate communications among the Trustees, and between the Trustees and the Trust’s management, officers, and independent legal counsel, between meetings. The Chairperson may also perform such other functions as may be requested by the Board from time to time. The Board has established the four standing committees described below, and may form working groups or ad hoc committees as needed.
The Board believes this leadership structure is appropriate because it allows the Board to exercise informed and independent judgment, and allocates areas of responsibility among committees or working groups of Trustees and the full Board in a manner that enhances effective oversight. The Board also believes that having a majority of Independent Trustees is appropriate and in the best interest of the Funds’ shareholders. However, in the Board’s opinion, having interested persons serve as Trustees brings both corporate and financial viewpoints that are significant elements in its decision-making process. The Board reviews it leadership structure at least annually and may make changes to it at any time, including in response to changes in the characteristics or circumstances of the Trust.
Independent Trustees
Allan W. Blair | Trustee of the Trust | |
100 Bright Meadow Blvd. | ||
Enfield, CT 06082-1981 | ||
Age: 68 | ||
Trustee since 2003 | ||
Trustee of 94 portfolios in fund complex |
Retired; President and Chief Executive Officer (1996-2014), Economic Development Council of Western Massachusetts (non-profit development company); President and Chief Executive Officer (1984-2014), Westover Metropolitan Development Corporation (quasi-public development company); Trustee (since 2003), MML Series Investment Fund (open-end investment company); Trustee (since 2012), MML Series Investment Fund II (open-end investment company); Trustee (since 2012), MassMutual Premier Funds (open-end investment company).
Nabil N. El-Hage | Trustee of the Trust | |
100 Bright Meadow Blvd. | ||
Enfield, CT 06082-1981 | ||
Age: 58 | ||
Trustee since 2012 | ||
Trustee of 94 portfolios in fund complex |
B-53
Founder and sole member of PR Academy of Executive Education, LLC (since 2016); Chairman (2011-2016), Academy of Executive Education, LLC (predecessor to PR Academy of Executive Education, LLC); Director (2011-2015), Argo Group International Holdings, Ltd. (underwriter of specialty insurance and reinsurance products); Trustee (since 2003), Chairman (2006-2012), MassMutual Premier Funds (open-end investment company); Trustee (since 2005), Chairman (2006-2012), MML Series Investment Fund II (open-end investment company); Trustee (since 2012), MML Series Investment Fund (open-end investment company).
Maria D. Furman | Trustee of the Trust | |
100 Bright Meadow Blvd. | ||
Enfield, CT 06082-1981 | ||
Age: 63 | ||
Trustee since 2012 | ||
Trustee of 94 portfolios in fund complex |
Retired; Trustee (since 2011), GMO Series Trust (open-end investment company); Trustee (since 2004), MassMutual Premier Funds (open-end investment company); Trustee (since 2005), MML Series Investment Fund II (open-end investment company); Trustee (since 2012), MML Series Investment Fund (open-end investment company).
R. Alan Hunter, Jr. | Chairperson and Trustee of the Trust | |
100 Bright Meadow Blvd. | ||
Enfield, CT 06082-1981 | ||
Age: 70 | ||
Chairperson since 2016 | ||
Trustee since 2003 | ||
Trustee of 94 portfolios in fund complex |
Retired; Director (since 2007), Actuant Corporation (diversified industrial company); Chairperson (since 2016), Trustee (since 2003), MML Series Investment Fund (open-end investment company); Chairperson (since 2016), Trustee (since 2012), MML Series Investment Fund II (open-end investment company); Chairperson (since 2016), Trustee (since 2012), MassMutual Premier Funds (open-end investment company).
C. Ann Merrifield | Trustee of the Trust | |
100 Bright Meadow Blvd. | ||
Enfield, CT 06082-1981 | ||
Age: 65 | ||
Trustee since 2012 | ||
Trustee of 94 portfolios in fund complex |
Retired; President and Chief Executive Officer (2012-2014), PathoGenetix (genomics company); Director (since 2015), Juniper Pharmaceuticals Inc. (specialty pharmaceutical company); Director (since 2014), Flexion Therapeutics (specialty pharmaceutical company); Director (since 2014), InVivo Therapeutics (research and clinical-stage biomaterials and biotechnology company); Trustee (since 2004), MassMutual Premier Funds (open-end investment company); Trustee (since 2005), MML Series Investment Fund II (open-end investment company); Trustee (since 2012), MML Series Investment Fund (open-end investment company).
Susan B. Sweeney | Trustee of the Trust | |
100 Bright Meadow Blvd. | ||
Enfield, CT 06082-1981 | ||
Age: 64 | ||
Trustee since 2009 | ||
Trustee of 96 portfolios in fund complex1 |
Retired; Senior Vice President and Chief Investment Officer (2010-2014), Selective Insurance Group (property and casualty company); Trustee (since 2012), Barings Corporate Investors (closed-end investment company); Trustee (since 2012), Barings Participation Investors (closed-end investment company); Trustee (since 2009), MML Series Investment Fund (open-end investment company); Trustee (since 2012), MML Series Investment Fund II (open-end investment company); Trustee (since 2012), MassMutual Premier Funds (open-end investment company).
B-54
Interested Trustee
Robert E. Joyal2 | Trustee of the Trust | |
100 Bright Meadow Blvd. | ||
Enfield, CT 06082-1981 | ||
Age: 72 | ||
Trustee since 2003 | ||
Trustee of 96 portfolios in fund complex1 |
Retired; Director (since 2013), Leucadia National Corporation (holding company); Director (since 2012), Ormat Technologies, Inc. (provider of alternative and renewable energy technology); Director (2006-2014), Jefferies Group LLC (investment bank); Trustee (since 2003), Barings Corporate Investors (closed-end investment company); Trustee (since 2003), Barings Participation Investors (closed-end investment company); Trustee (since 2003), MML Series Investment Fund (open-end investment company); Trustee (since 2012), MML Series Investment Fund II (open-end investment company); Trustee (since 2012), MassMutual Premier Funds (open-end investment company).
Principal Officers
Michael C. Eldredge 100 Bright Meadow Blvd. Enfield, CT 06082-1981 Age: 52 Officer since 2009 Officer of 94 portfolios in fund complex | Vice President of the Trust |
Head of Asset Allocation Funds (since 2016), portfolio manager (2014-2016), Head of Investments (2014-2016), MML Advisers; Vice President (since 2008), MassMutual; Vice President (since 2009), MassMutual Premier Funds (open-end investment company); Vice President (since 2009), MML Series Investment Fund (open-end investment company); Vice President (since 2009), MML Series Investment Fund II (open-end investment company).
Andrew M. Goldberg 100 Bright Meadow Blvd. Enfield, CT 06082-1981 Age: 50 Officer since 2001 Officer of 94 portfolios in fund complex | Vice President, Secretary, and Chief Legal Officer of the Trust |
| 1 | Barings Participation Investors and Barings Corporate Investors are deemed to be a part of the Fund Complex, because they are managed by Barings LLC (formerly known as Babson Capital Management LLC), an affiliate of MML Advisers. |
| 2 | Mr. Joyal is an “Interested Person,” as that term is defined in the 1940 Act, through his position as a director of Leucadia National Corporation, which controls Jefferies Group LLC, a broker-dealer that may execute portfolio transactions and/or engage in principal transactions with the Funds, other investment companies advised by MML Advisers or holding themselves out to investors as related companies for purposes of investment or investor services, or any other advisory accounts over which MML Advisers has brokerage placement discretion. |
B-55
Assistant Vice President and Counsel (since 2004), MassMutual; Secretary (since 2015), Assistant Secretary (2013-2015), MML Advisers; Vice President, Secretary (formerly known as “Clerk”), and Chief Legal Officer (since 2008), Assistant Clerk (2004-2008), MassMutual Premier Funds (open-end investment company); Vice President, Secretary, and Chief Legal Officer (since 2008), Assistant Secretary (2001- 2008), MML Series Investment Fund (open-end investment company); Vice President, Secretary (formerly known as “Clerk”), and Chief Legal Officer (since 2008), Assistant Clerk (2005-2008), MML Series Investment Fund II (open-end investment company).
Brian K. Haendiges 100 Bright Meadow Blvd. Enfield, CT 06082-1981 Age: 56 Officer since 2014 Officer of 94 portfolios in fund complex | Vice President of the Trust |
Vice President (since 2014), MML Advisers; Senior Vice President (since 2014), Vice President (2010-2014), MassMutual; Vice President (since 2014), MassMutual Premier Funds (open-end investment company); President (since 2016), Vice President (2014-2016), MML Series Investment Fund (open-end investment company); President (since 2016), Vice President (2014-2016), MML Series Investment Fund II (open-end investment company).
Renee Hitchcock 100 Bright Meadow Blvd. Enfield, CT 06082-1981 Age: 46 Officer since 2006 Officer of 94 portfolios in fund complex | Chief Financial Officer and Treasurer of the Trust |
Assistant Vice President (since 2015), Director (2007-2015), MassMutual; Chief Financial Officer and Treasurer (since 2016), Assistant Treasurer (2007-2016), MassMutual Premier Funds (open-end investment company); Chief Financial Officer and Treasurer (since 2016), Assistant Treasurer (2007-2016), MML Series Investment Fund (open-end investment company); Chief Financial Officer and Treasurer (since 2016), Assistant Treasurer (2007-2016), MML Series Investment Fund II (open-end investment company).
Douglas Steele 100 Bright Meadow Blvd. Enfield, CT 06082-1981 Age: 41 Officer since 2016 Officer of 94 portfolios in fund complex | Vice President of the Trust |
Head of Investment Due Diligence (since 2016), MML Advisers; Assistant Vice President (since 2013), Investment Director (2005-2013), MassMutual; Vice President (since 2016), MassMutual Premier Funds (open-end investment company); Vice President (since 2016), MML Series Investment Fund (open-end investment company); Vice President (since 2016), MML Series Investment Fund II (open-end investment company).
Philip S. Wellman 100 Bright Meadow Blvd. Enfield, CT 06082-1981 Age: 52 Officer since 2007 Officer of 94 portfolios in fund complex | Vice President and Chief Compliance Officer of the Trust |
B-56
Vice President and Chief Compliance Officer (since 2013), MML Advisers; Vice President, Associate General Counsel, and Chief Compliance Officer (Mutual Funds) (since 2014), Vice President, Associate General Counsel, and Chief Compliance Officer (Mutual Funds and Investment Advisory) (2008-2014), MassMutual; Vice President and Chief Compliance Officer (since 2007), MassMutual Premier Funds (open-end investment company); Vice President and Chief Compliance Officer (since 2007), MML Series Investment Fund (open-end investment company); Vice President and Chief Compliance Officer (since 2007), MML Series Investment Fund II (open-end investment company).
Eric H. Wietsma 100 Bright Meadow Blvd. Enfield, CT 06082-1981 Age: 50 Officer since 2006 Officer of 94 portfolios in fund complex | President of the Trust |
Director and President (since 2013), MML Advisers; Senior Vice President (since 2010), MassMutual; President (since 2008), Vice President (2006-2008), MassMutual Premier Funds (open-end investment company); Vice President (since 2006), MML Series Investment Fund (open-end investment company); Vice President (since 2006), MML Series Investment Fund II (open-end investment company).
Tina Wilson 100 Bright Meadow Blvd. Enfield, CT 06082-1981 Age: 46 Officer since 2016 Officer of 94 portfolios in fund complex | Vice President of the Trust |
Vice President and Head of Investments (since 2016), MML Advisers; Senior Vice President (since 2014), Vice President (2009-2014), MassMutual; Vice President (since 2016), MassMutual Premier Funds (open-end investment company); Vice President (since 2016), MML Series Investment Fund (open-end investment company); Vice President (since 2016), MML Series Investment Fund II (open-end investment company).
Each Trustee of the Trust serves until the next meeting of shareholders called for the purpose of electing Trustees and until the election and qualification of his or her successor or until he or she dies, resigns, or is removed. Notwithstanding the foregoing, unless the Trustees determine that it is desirable and in the best interest of the Trust that an exception to the retirement policy of the Trust be made, a Trustee shall retire and cease to serve as a Trustee upon the conclusion of the calendar year in which such Trustee attains the age of seventy-two years.
The Chairperson is elected to hold such office for a term of three years or until their successor is elected and qualified to carry out the duties and responsibilities of their office, or until he or she retires, dies, resigns, is removed, or becomes disqualified.
The President, Treasurer, and Secretary and such other officers as the Trustees may in their discretion from time to time elect are elected to hold such office until their successor is elected and qualified to carry out the duties and responsibilities of their office, or until he or she dies, resigns, is removed, or becomes disqualified.
Each officer and the Chairperson shall hold office at the pleasure of the Trustees.
Additional Information About the Trustees
In addition to the information set forth above, the following specific experience, qualifications, attributes, and skills apply to each Trustee. Each Trustee was appointed to serve on the Board based on his or her overall experience and the Board did not identify any specific qualification as all-important or controlling. The
B-57
information in this section should not be understood to mean that any of the Trustees is an “expert” within the meaning of the federal securities laws.
Allan W. Blair—As a former trustee and audit and compliance committee member of a large healthcare system, Mr. Blair has experience with financial, regulatory, and operational issues. He also has served as CEO of several non-profit organizations for over 30 years. Mr. Blair holds a BA from the University of Massachusetts at Amherst and a JD from Western New England College School of Law.
Nabil N. El-Hage—As a former CEO or CFO of various public and private companies, Mr. El-Hage has experience with financial, regulatory, and operational issues. He has also taught corporate finance at the graduate level, and has served as a director for more than a dozen public and private companies and as an associate at a venture capital firm. Mr. El-Hage holds a BS in Electronic Engineering from Yale University and an MBA with high distinction from Harvard University.
Maria D. Furman—As a trustee and chairperson or member of the audit and investment committees of various educational organizations, Ms. Furman has experience with financial, regulatory, and operational issues. She also has served as an audit and investment committee member and a director, treasurer, and investment committee chair for environmental, educational, and healthcare organizations. Ms. Furman is a CFA charterholder and holds a BA from the University of Massachusetts at Dartmouth.
R. Alan Hunter, Jr.—As the former and current chairman of the board of non-profit organizations and a current director of a publicly traded company, Mr. Hunter has experience with financial, regulatory, and operational issues. He also held executive positions with a manufacturing company. Mr. Hunter holds a BA from Dickinson College and an MBA from the University of Pennsylvania.
Robert E. Joyal—As a director of several publicly traded companies, a trustee of various investment companies, and a former executive of an investment management company, Mr. Joyal has experience with financial, regulatory, and operational issues. Mr. Joyal is a Chartered Financial Analyst. He holds a BA from St. Michael’s College and an MBA from Western New England College.
C. Ann Merrifield—As a trustee of a healthcare organization, former biotechnology executive, former partner of a consulting firm, and investment officer at a large insurance company, Ms. Merrifield has experience with financial, regulatory, and operational issues. She also has served as an audit committee member for a manufacturing company and currently serves as such for two life sciences companies. Ms. Merrifield holds a BA and M. Ed. from the University of Maine and an MBA from Amos Tuck School of Business Administration at Dartmouth College.
Susan B. Sweeney—As an executive of a financial services company with over 30 years of financial services experience, Ms. Sweeney has experience with financial, regulatory, and operational issues. Ms. Sweeney holds a BS in Business Studies from Connecticut Board for State Academic Awards, an MBA from Harvard Business School, and a Doctor of Humane Letters from Charter Oak State College.
Board Committees and Meetings
The full Board met five times during the fiscal year ended September 30, 2016.
Audit Committee. The Trust has an Audit Committee, consisting of Trustees who are not “interested persons” (as defined in the 1940 Act) of the Trust. The Audit Committee, whose members are Messrs. Blair and El-Hage and Msses. Furman, Merrifield, and Sweeney, oversees the Trust’s accounting and financial reporting policies and practices, its internal controls, and internal controls of certain service providers; oversees the quality and objectivity of the Trust’s financial statements and the independent audit thereof; evaluates the independence of the Trust’s independent registered public accounting firm; evaluates the overall performance and compensation of the Chief Compliance Officer; acts as liaison between the Trust’s independent registered public
B-58
accounting firm and the full Board; and provides immediate access for the Trust’s independent registered public accounting firm to report any special matters they believe should be brought to the attention of the full Board. During the fiscal year ended September 30, 2016, the Audit Committee met three times.
Nominating Committee. The Trust has a Nominating Committee, consisting of each Trustee who is not an “interested person” of the Trust. There are no regular meetings of the Nominating Committee, but rather meetings are held as appropriate. During the fiscal year ended September 30, 2016, the Nominating Committee met once. The Nominating Committee (a) identifies individuals qualified to become independent members of the Funds’ Board in the event that a position currently filled by an Independent Trustee is vacated or created; (b) evaluates the qualifications of Independent Trustee candidates; (c) nominates Independent Trustee nominees for election or appointment to the Board; (d) sets any standards necessary or qualifications for service on the Board; (e) recommends periodically to the full Board an Independent Trustee to serve as Chairperson; (f) evaluates at least annually the independence and overall performance of counsel to the Independent Trustees; and (g) annually reviews the compensation of the Independent Trustees.
The Nominating Committee will consider and evaluate nominee candidates properly submitted by shareholders of the Trust in the same manner as it considers and evaluates candidates recommended by other sources. The Nominating Committee may also consider any other facts and circumstances attendant to such shareholder submission as may be deemed appropriate by the Nominating Committee, including, without limitation, the value of the Funds’ securities owned by the shareholder and the length of time such shares have been held by the shareholder. A recommendation of a shareholder of the Trust must be submitted as described below to be considered properly submitted for purposes of the Nominating Committee’s consideration. The shareholders of the Trust must submit any such recommendation (a “Shareholder Recommendation”) in writing to the Trust’s Nominating Committee, to the attention of the Secretary, at the address of the principal executive offices of the Trust, which is 100 Bright Meadow Blvd., Enfield, CT 06082-1981. The Shareholder Recommendation must be delivered to or mailed and received at the principal executive offices of the Trust at least 60 calendar days before the date of the meeting at which the Nominating Committee is to select a nominee for Independent Trustee. The Shareholder Recommendation must include: (i) a statement in writing setting forth: (A) the name, age, date of birth, phone number, business address, residence address, nationality, and pertinent qualifications of the person recommended by the shareholder (the “Shareholder Candidate”), including an explanation of why the shareholder believes the Candidate will make a good Trustee; (B) the class or series and number of all shares of the Funds owned of record or beneficially by the Shareholder Candidate, as reported to such shareholder by the Shareholder Candidate; (C) any other information regarding the Shareholder Candidate called for with respect to director nominees by paragraphs (a), (d), (e), and (f) of Item 401 of Regulation S-K or paragraph (b) of Item 22 of Rule 14a-101 (Schedule 14A) under the Securities Exchange Act of 1934, as amended (the “Exchange Act”), adopted by the SEC (or the corresponding provisions of any regulation or rule subsequently adopted by the SEC or any successor agency applicable to the Funds); (D) any other information regarding the Shareholder Candidate that would be required to be disclosed if the Shareholder Candidate were a nominee in a proxy statement or other filing required to be made in connection with solicitation of proxies for election of trustees or directors pursuant to Section 14 of the Exchange Act and the rules and regulations promulgated thereunder; and (E) whether the recommending shareholder believes that the Shareholder Candidate is or will be an “interested person” (as defined in Section 2(a)(19) of the 1940 Act) of the Funds and, if not an “interested person,” information regarding the Shareholder Candidate that will be sufficient for the Funds to make such determination; (ii) the written and signed consent of the Shareholder Candidate to be named as a nominee, consenting to (1) the disclosure, as may be necessary or appropriate, of such Shareholder Candidate’s information submitted in accordance with (i) above; and (2) service as a Trustee if elected; (iii) the recommending shareholder’s name as it appears on the Funds’ books, the number of all shares of each series of the Funds owned beneficially and of record by the recommending shareholder; (iv) a description of all arrangements or understandings between the recommending shareholder and the Shareholder Candidate and any other person or persons (including their names) pursuant to which the Shareholder Recommendation is being made by the recommending shareholder; and (v) such other information as the Nominating Committee may require the Shareholder Candidate to furnish as it may reasonably require or deem necessary to determine the eligibility of such Shareholder Candidate to serve as a Trustee or to satisfy applicable law.
B-59
Shareholders may send other communications to the Trustees by addressing such correspondence directly to the Secretary of the Trust, c/o Massachusetts Mutual Life Insurance Company, 100 Bright Meadow Blvd., Enfield, CT 06082-1981. When writing to the Board, shareholders should identify themselves, the fact that the communication is directed to the Board, the Fund they are writing about, and any relevant information regarding their Fund holdings. Except as provided below, the Secretary shall either (i) provide a copy of each shareholder communication to the Board at its next regularly scheduled meeting or (ii) if the Secretary determines that the communication requires more immediate attention, forward the communication to the Board promptly after receipt. The Secretary will also provide a copy of each shareholder communication to the Trust’s Chief Compliance Officer.
The Secretary may, in good faith, determine that a shareholder communication should not be provided to the Board because it does not reasonably relate to the Trust or its operations, management, activities, policies, service providers, Board, officers, shareholders, or other matters relating to an investment in the Funds or is otherwise ministerial in nature (such as a request for Fund literature, share data, or financial information). The Secretary will provide to the Board on a quarterly basis a summary of the shareholder communications not provided to the Board by virtue of this paragraph.
Contract Committee. The Trust has a Contract Committee, consisting of each Trustee who is not an “interested person” of the Trust. During the fiscal year ended September 30, 2016, the Contract Committee met three times. The Contract Committee performs the specific tasks assigned to independent trustees by the 1940 Act, including the periodic consideration of the Trust’s investment management agreements and subadvisory agreements.
Governance Committee. The Trust has a Governance Committee, whose members are Messrs. Blair and Joyal and Msses. Furman and Merrifield. During the fiscal year ended September 30, 2016, the Governance Committee met once. The Governance Committee oversees board governance issues including, but not limited to, the following: (i) to evaluate the board and committee structure and the performance of Trustees, (ii) to consider and address any conflicts, and (iii) to consider the retirement policies of the Board.
Risk Oversight
As registered investment companies, the Funds are subject to a variety of risks, including, among others, investment risks, financial risks, compliance risks, and operational risks. The Funds’ investment adviser and administrator, MML Advisers, has primary responsibility for the Funds’ risk management on a day-to-day basis as part of its overall responsibilities. The Funds’ subadvisers are primarily responsible for managing investment risk as part of their day-to-day investment management responsibilities, as well as operational risks at their respective firms. The Funds’ investment adviser and Chief Compliance Officer also assist the Board in overseeing the significant investment policies of the Funds and monitor the various compliance policies and procedures approved by the Board as a part of its oversight responsibilities.
In discharging its oversight responsibilities, the Board considers risk management issues throughout the year by reviewing regular reports prepared by the Funds’ investment adviser and Chief Compliance Officer, as well as special written reports or presentations provided on a variety of risk issues, as needed. For example, the investment adviser reports to the Board quarterly on the investment performance of each of the Funds, the financial performance of the Funds, overall market and economic conditions, and legal and regulatory developments that may impact the Funds. The Funds’ Chief Compliance Officer, who reports directly to the Board’s Independent Trustees, provides presentations to the Board at its quarterly meetings and an annual report to the Board concerning (i) compliance matters relating to the Funds, the Funds’ investment adviser and subadvisers, and the Funds’ other key service providers; (ii) regulatory developments; (iii) business continuity programs; and (iv) various risks identified as part of the Funds’ compliance program assessments. The Funds’ Chief Compliance Officer also meets at least quarterly in executive session with the Independent Trustees, and communicates significant compliance-related issues and regulatory developments to the Audit Committee between Board meetings.
B-60
In addressing issues regarding the Funds’ risk management between meetings, appropriate representatives of the investment adviser communicate with the Chairperson of the Trust, the Chairperson of the Audit Committee, or the Funds’ Chief Compliance Officer. As appropriate, the Trustees confer among themselves, or with the Funds’ Chief Compliance Officer, the investment adviser, other service providers, and independent legal counsel, to identify and review risk management issues that may be placed on the full Board’s agenda.
The Board also relies on its committees to administer the Board’s oversight function. The Audit Committee assists the Board in reviewing with the investment adviser and the Funds’ independent auditors, at various times throughout the year, matters relating to the annual audits, financial accounting and reporting matters, and the internal control environment at the service providers that provide financial accounting and reporting for the Funds. The Audit Committee also meets annually with representatives of the investment adviser’s Corporate Audit Department to review the results of internal audits of relevance to the Funds. This and the Board’s other committees present reports to the Board that may prompt further discussion of issues concerning the oversight of the Funds’ risk management. The Board may also discuss particular risks that are not addressed in the committee process.
Share Ownership of Trustees and Officers of the Trust
The table below sets forth information regarding the Trustees’ beneficial ownership of Fund shares, based on the value of such shares as of December 31, 2016.
Name of Trustee | The Dollar Range of Equity | Aggregate Dollar Range of Equity | ||
Independent Trustees | ||||
Allan W. Blair | None | over $100,000 | ||
Nabil N. El-Hage | None | None | ||
Maria D. Furman | None | None | ||
R. Alan Hunter, Jr. | None | None | ||
C. Ann Merrifield | None | None | ||
Susan B. Sweeney | None | None | ||
Interested Trustees | ||||
Robert E. Joyal | None | None | ||
Elaine A. Sarsynski1 | None | None |
| 1 | Resigned as of February 1, 2017. |
The ownership information shown above does not include units of separate investment accounts that invest in one or more registered investment companies overseen by a Trustee in the family of investment companies held in a 401(k) plan or amounts held under a deferred compensation plan that are valued based on “shadow investments” in one or more such registered investment companies. As of December 31, 2016, these amounts were as follows: Mr. Blair, over $100,000; Mr. El-Hage, over $100,000; Ms. Furman, over $100,000; Mr. Hunter, over $100,000; Mr. Joyal, over $100,000; Ms. Merrifield, None; Ms. Sweeney, None; and Ms. Sarsynski, over $100,000.
As of January 3, 2017, the Trustees and officers of the Trust, individually and as a group, did not beneficially own outstanding shares of any of the Funds.
To the knowledge of the Trust, as of December 31, 2016, the Independent Trustees and their immediate family members did not own beneficially or of record securities of an investment adviser, subadviser, principal underwriter, or sponsoring insurance company of the Funds or a person (other than a registered investment company) directly or indirectly controlling, controlled by, or under common control with an investment adviser, subadviser, principal underwriter, or sponsoring insurance company of the Funds.
B-61
Trustee Compensation
Effective January 1, 2017, the Trust, on behalf of each Fund, pays each of its Trustees who is not an officer or employee of MassMutual a fee of $20,000 per quarter plus a fee of $3,000 per in-person meeting attended plus a fee of $3,000 for the annual Contract Committee meeting. The Chairperson of the Board is paid an additional 50% of the quarterly fee, the in-person meeting fee, and the Contract Committee meeting fee. The Chairpersons of each of the Audit Committee and the Contract Committee are paid an additional 10% of the quarterly fee, the in-person meeting fee, and the Contract Committee meeting fee. The Chairpersons of each of the Nominating Committee and the Governance Committee are paid an additional 5% of the quarterly fee, the in-person meeting fee, and the Contract Committee meeting fee. Such Trustees who serve on the Audit Committee, other than the Chairperson, are paid an additional 4% of the quarterly fee, the in-person meeting fee, and the Contract Committee meeting fee. No additional fees are paid for attending any other committee meetings or any special telephonic meetings. In addition, the Trust reimburses out-of-pocket business travel expenses to such Trustees. Trustees who are officers or employees of MassMutual receive no fees from the Trust.
During 2016, the Trust, on behalf of each Fund, paid each of its Trustees who was not an officer or employee of MassMutual a fee of $18,375 per quarter plus a fee of $2,940 per in-person meeting attended plus a fee of $2,940 for the annual Contract Committee meeting. The Chairperson of the Board was paid an additional 50% of the quarterly fee, the in-person meeting fee, and the Contract Committee meeting fee. The Chairperson of the Audit Committee was paid an additional 10% of the quarterly fee, the in-person meeting fee, and the Contract Committee meeting fee. The Chairpersons of each of the Contract Committee, the Nominating Committee, and the Governance Committee were paid an additional 5% of the quarterly fee, the in-person meeting fee, and the Contract Committee meeting fee. Such Trustees who served on the Audit Committee, other than the Chairperson, were paid an additional 4% of the quarterly fee, the in-person meeting fee, and the Contract Committee meeting fee. No additional fees were paid for attending any other committee meetings or any special telephonic meetings. In addition, the Trust reimbursed out-of-pocket business travel expenses to such Trustees. Trustees who were officers or employees of MassMutual received no fees from the Trust.
The following table discloses actual compensation paid to Trustees of the Trust during the 2016 fiscal year. The Trust has no pension or retirement plan, but does have a deferred compensation plan. The plan provides for amounts deferred prior to July 1, 2008, plus interest, to be credited a rate of interest of eight percent (8%). Amounts deferred after July 1, 2008, plus or minus earnings, are “shadow invested.” These amounts are valued based on changes in the values of one or more registered investment companies overseen by a Trustee.
Name of Trustee | Aggregate Compensation from the Trust | Deferred Compensation and Interest Accrued as part of Fund Expenses | Total Compensation from the Trust and Fund Complex Paid to Trustees | |||||||||
Richard H. Ayers1 | N/A | $ | 54,706 | $ | 122,533 | |||||||
Allan W. Blair | $ | 93,963 | N/A | $ | 192,910 | |||||||
Nabil N. El-Hage | $ | 22,301 | $ | 111,382 | $ | 279,885 | ||||||
Maria D. Furman | N/A | $ | 99,375 | $ | 227,258 | |||||||
R. Alan Hunter, Jr. | $ | 122,352 | $ | 42,529 | $ | 313,108 | ||||||
Robert E. Joyal | N/A | $ | 197,235 | $ | 366,428 | |||||||
F. William Marshall, Jr.1 | $ | 10,456 | $ | 18,720 | $ | 343,035 | ||||||
C. Ann Merrifield | $ | 93,119 | N/A | $ | 191,150 | |||||||
Elaine A. Sarsynski2,3 | $ | 0 | $ | 0 | $ | 0 | ||||||
Susan B. Sweeney | $ | 94,625 | N/A | $ | 257,560 | |||||||
| 1 | Retired as of December 31, 2015. |
| 2 | Ms. Sarsynski, as an employee of MassMutual, received no compensation for her role as a Trustee to the Trust. |
| 3 | Resigned as of February 1, 2017. |
B-62
CONTROL PERSONS AND PRINCIPAL HOLDERS OF SECURITIES
As of January 3, 2017, to the Trust’s knowledge, the following persons owned of record or beneficially 5% or more of the outstanding shares of the indicated classes of the Funds set forth below. Such ownership may be beneficially held by individuals or entities other than the owner listed. To the extent that any listed shareholder beneficially owns more than 25% of a Fund, it may be deemed to “control” such Fund within the meaning of the 1940 Act. The effect of such control may be to reduce the ability of other shareholders of the Fund to take actions requiring the affirmative vote of holders of a plurality or majority of the Fund’s shares without the approval of the controlling shareholder.
MassMutual Select Total Return Bond Fund1
Class | Name and Address | Percent of Class | ||||
Class I | MassMutual 100 Bright Meadow Blvd Enfield, CT 06082 | 54.34 | % | |||
Taynik & Co. c/o State Street Bank One Lincoln Street Boston, MA 02111 | 22.22 | % | ||||
Class R5 | MassMutual 100 Bright Meadow Blvd Enfield, CT 06082 | 73.68 | % | |||
Taynik & Co. c/o State Street Bank One Lincoln Street Boston, MA 02111 | 26.09 | % | ||||
Service Class | MassMutual 100 Bright Meadow Blvd Enfield, CT 06082 | 72.06 | % | |||
Taynik & Co. c/o State Street Bank One Lincoln Street Boston, MA 02111 | 27.88 | % | ||||
Administrative Class | Taynik & Co. c/o State Street Bank One Lincoln Street Boston, MA 02111 | 58.11 | % | |||
MassMutual 100 Bright Meadow Blvd Enfield, CT 06082 | 41.89 | % | ||||
Class A | Taynik & Co. c/o State Street Bank One Lincoln Street Boston, MA 02111 | 78.64 | % | |||
MassMutual 100 Bright Meadow Blvd Enfield, CT 06082 | 21.36 | % | ||||
B-63
Class | Name and Address | Percent of Class | ||||
Class R4 | MassMutual 100 Bright Meadow Blvd Enfield, CT 06082 | 74.69 | % | |||
Taynik & Co. c/o State Street Bank One Lincoln Street Boston, MA 02111 | 23.76 | % | ||||
Class R3 | MassMutual 100 Bright Meadow Blvd Enfield, CT 06082 | 69.87 | % | |||
Taynik & Co. c/o State Street Bank One Lincoln Street Boston, MA 02111 | 23.72 | % | ||||
Hartford Life Insurance Co. 1 Griffin Rd. North Windsor, CT 06095 | 5.15 | % | ||||
MassMutual Select Strategic Bond Fund2
Class | Name and Address | Percent of Class | ||||
Class I | MassMutual 100 Bright Meadow Blvd Enfield, CT 06082 | 22.89 | % | |||
Taynik & Co. c/o State Street Bank One Lincoln Street Boston, MA 02111 | 16.02 | % | ||||
MassMutual RetireSMARTSM 2020 Fund 1 Iron Street Boston, MA 02210 | 12.75 | % | ||||
MassMutual RetireSMARTSM Conservative Fund 1 Iron Street Boston, MA 02210 | 11.65 | % | ||||
MassMutual RetireSMARTSM Moderate Fund 1 Iron Street Boston, MA 02210 | 11.15 | % | ||||
Class R5 | MassMutual 100 Bright Meadow Blvd Enfield, CT 06082 | 80.35 | % | |||
Taynik & Co. c/o State Street Bank One Lincoln Street Boston, MA 02111 | 16.12 | % | ||||
B-64
Class | Name and Address | Percent of Class | ||||
Service Class | MassMutual 100 Bright Meadow Blvd Enfield, CT 06082 | 60.35 | % | |||
Taynik & Co. c/o State Street Bank One Lincoln Street Boston, MA 02111 | 39.41 | % | ||||
Administrative Class | MassMutual 100 Bright Meadow Blvd Enfield, CT 06082 | 70.49 | % | |||
Taynik & Co. c/o State Street Bank One Lincoln Street Boston, MA 02111 | 29.51 | % | ||||
Class A | MassMutual 100 Bright Meadow Blvd Enfield, CT 06082 | 69.21 | % | |||
Taynik & Co. c/o State Street Bank One Lincoln Street Boston, MA 02111 | 26.41 | % | ||||
Class R4 | MassMutual 100 Bright Meadow Blvd Enfield, CT 06082 | 58.54 | % | |||
Taynik & Co. c/o State Street Bank One Lincoln Street Boston, MA 02111 | 29.90 | % | ||||
Hartford Life Insurance Co. 1 Griffin Rd. North Windsor, CT 06095 | 6.60 | % | ||||
Class R3 | Hartford Life Insurance Co. 1 Griffin Rd. North Windsor, CT 06095 | 56.75 | % | |||
MassMutual 100 Bright Meadow Blvd Enfield, CT 06082 | 33.40 | % | ||||
Reliance Trust Company Mutual Omnibus PPL/SMF 1100 Abernathy Road Atlanta, GA. 30328 | 8.07 | % | ||||
B-65
MassMutual Select BlackRock Global Allocation Fund3
Class | Name and Address | Percent of Class | ||||
Class I | Mac & Co. Mutual Fund Operations P.O. Box 3198 525 William Penn Place Pittsburgh, PA 15230 | 98.19 | % | |||
Class R5 | MassMutual 100 Bright Meadow Blvd Enfield, CT 06082 | 93.30 | % | |||
Taynik & Co. c/o State Street Bank One Lincoln Street Boston, MA 02111 | 6.69 | % | ||||
Service Class | MassMutual 100 Bright Meadow Blvd Enfield, CT 06082 | 67.89 | % | |||
Taynik & Co. c/o State Street Bank One Lincoln Street Boston, MA 02111 | 32.11 | % | ||||
Administrative Class | MassMutual 100 Bright Meadow Blvd Enfield, CT 06082 | 98.75 | % | |||
Class A | MassMutual 100 Bright Meadow Blvd Enfield, CT 06082 | 61.53 | % | |||
Taynik & Co. c/o State Street Bank One Lincoln Street Boston, MA 02111 | 38.47 | % | ||||
Class R4 | MassMutual 100 Bright Meadow Blvd Enfield, CT 06082 | 95.12 | % | |||
Class R3 | MassMutual 100 Bright Meadow Blvd Enfield, CT 06082 | 85.60 | % | |||
Hartford Life Insurance Co. 1 Griffin Rd. North Windsor, CT 06095 | 13.00 | % | ||||
B-66
MassMutual Select Diversifed Value Fund4
Class | Name and Address | Percent of Class | ||||
Class I | Elevator Constructors Annuity & 401(k) Retirement Plan 19 Campus BLVD #200 Newton Square, PA. 19073 | 55.56 | % | |||
Taynik & Co. c/o State Street Bank One Lincoln Street Boston, MA 02111 | 22.21 | % | ||||
Class R5 | MassMutual 100 Bright Meadow Blvd Enfield, CT 06082 | 98.90 | % | |||
Service Class | Taynik & Co. c/o State Street Bank One Lincoln Street Boston, MA 02111 | 68.20 | % | |||
MassMutual 100 Bright Meadow Blvd Enfield, CT 06082 | 30.71 | % | ||||
Administrative Class | MassMutual 100 Bright Meadow Blvd Enfield, CT 06082 | 62.71 | % | |||
Taynik & Co. c/o State Street Bank One Lincoln Street Boston, MA 02111 | 37.25 | % | ||||
Class A | MassMutual 100 Bright Meadow Blvd Enfield, CT 06082 | 65.37 | % | |||
Taynik & Co. c/o State Street Bank One Lincoln Street Boston, MA 02111 | 21.98 | % | ||||
Class R4 | MassMutual 100 Bright Meadow Blvd Enfield, CT 06082 | 84.06 | % | |||
Taynik & Co. c/o State Street Bank One Lincoln Street Boston, MA 02111 | 15.94 | % | ||||
Class R3 | MassMutual 100 Bright Meadow Blvd Enfield, CT 06082 | 65.21 | % | |||
Hartford Life Insurance Co. 1 Griffin Rd. North Windsor, CT 06095 | 34.79 | % | ||||
B-67
MassMutual Select Fundamental Value Fund5
Class | Name and Address | Percent of Class | ||||
Class I | MassMutual 100 Bright Meadow Blvd Enfield, CT 06082 | 71.03 | % | |||
Taynik & Co. c/o State Street Bank One Lincoln Street Boston, MA 02111 | 16.55 | % | ||||
Class R5 | MassMutual 100 Bright Meadow Blvd Enfield, CT 06082 | 93.64 | % | |||
Taynik & Co. c/o State Street Bank One Lincoln Street Boston, MA 02111 | 6.32 | % | ||||
Service Class | MassMutual 100 Bright Meadow Blvd Enfield, CT 06082 | 74.07 | % | |||
Taynik & Co. c/o State Street Bank One Lincoln Street Boston, MA 02111 | 25.03 | % | ||||
Administrative Class | MassMutual 100 Bright Meadow Blvd Enfield, CT 06082 | 74.52 | % | |||
Taynik & Co. c/o State Street Bank One Lincoln Street Boston, MA 02111 | 24.45 | % | ||||
Class A | MassMutual 100 Bright Meadow Blvd Enfield, CT 06082 | 70.38 | % | |||
Taynik & Co. c/o State Street Bank One Lincoln Street Boston, MA 02111 | 25.49 | % | ||||
Class R4 | MassMutual 100 Bright Meadow Blvd Enfield, CT 06082 | 100 | % | |||
Class R3 | MassMutual 100 Bright Meadow Blvd Enfield, CT 06082 | 67.61 | % | |||
Hartford Life Insurance Co. 1 Griffin Rd. North Windsor, CT 06095 | 28.34 | % | ||||
B-68
MassMutual Select Large Cap Value Fund6
Class | Name and Address | Percent of Class | ||||
Class I | MassMutual RetireSMARTSM 2030 Fund 1 Iron Street Boston, MA 02210 | 18.73 | % | |||
MassMutual RetireSMARTSM 2040 Fund 1 Iron Street Boston, MA 02210 | 14.37 | % | ||||
MassMutual RetireSMARTSM 2020 Fund 1 Iron Street Boston, MA 02210 | 10.74 | % | ||||
MassMutual RetireSMARTSM Moderate Growth Fund 1 Iron Street Boston, MA 02210 | 9.24 | % | ||||
MassMutual RetireSMARTSM 2050 Fund 1 Iron Street Boston, MA 02210 | 8.33 | % | ||||
MassMutual RetireSMARTSM 2035 Fund 1 Iron Street Boston, MA 02210 | 8.09 | % | ||||
MassMutual RetireSMARTSM 2025 Fund 1 Iron Street Boston, MA 02210 | 7.87 | % | ||||
MassMutual RetireSMARTSM Moderate Fund 1 Iron Street Boston, MA 02210 | 5.76 | % | ||||
MassMutual RetireSMARTSM 2045 Fund 1 Iron Street Boston, MA 02210 | 5.71 | % | ||||
MassMutual RetireSMARTSM Growth Fund 1 Iron Street Boston, MA 02210 | 5.34 | % | ||||
Class R5 | MassMutual 100 Bright Meadow Blvd Enfield, CT 06082 | 98.13 | % | |||
B-69
Class | Name and Address | Percent of Class | ||||
Service Class | MassMutual 100 Bright Meadow Blvd Enfield, CT 06082 | 66.52 | % | |||
Taynik & Co. c/o State Street Bank One Lincoln Street Boston, MA 02111 | 12.12 | % | ||||
SEI Private Trust Company c/o State Street Bank ID571 Mutual Fund Administration One Freedom Valley Drive Oaks, PA 19456 | 10.79 | % | ||||
SEI Private Trust Company c/o State Street Bank ID571 FBO A/C 4601292 One Freedom Valley Drive Oaks, PA 19456 | 10.57 | % | ||||
Administrative Class | MassMutual 100 Bright Meadow Blvd Enfield, CT 06082 | 99.22 | % | |||
Class A | MassMutual 100 Bright Meadow Blvd Enfield, CT 06082 | 70.56 | % | |||
Taynik & Co. c/o State Street Bank One Lincoln Street Boston, MA 02111 | 13.93 | % | ||||
Class R4 | MassMutual 100 Bright Meadow Blvd Enfield, CT 06082 | 100 | % | |||
Class R3 | MassMutual 100 Bright Meadow Blvd Enfield, CT 06082 | 100 | % | |||
MassMutual Select S&P 500 Index Fund7
Class | Name and Address | Percent of Class | ||||
Class I | MassMutual 100 Bright Meadow Blvd Enfield, CT 06082 | 64.94 | % | |||
Taynik & Co. c/o State Street Bank One Lincoln Street Boston, MA 02111 | 31.61 | % | ||||
B-70
Class | Name and Address | Percent of Class | ||||
Class R5 | MassMutual 100 Bright Meadow Blvd Enfield, CT 06082 | 61.04 | % | |||
Taynik & Co. c/o State Street Bank One Lincoln Street Boston, MA 02111 | 35.82 | % | ||||
Service Class | MassMutual 100 Bright Meadow Blvd Enfield, CT 06082 | 70.06 | % | |||
Taynik & Co. c/o State Street Bank One Lincoln Street Boston, MA 02111 | 26.61 | % | ||||
Administrative Class | MassMutual 100 Bright Meadow Blvd Enfield, CT 06082 | 51.21 | % | |||
Taynik & Co. c/o State Street Bank One Lincoln Street Boston, MA 02111 | 47.29 | % | ||||
Class A | MassMutual 100 Bright Meadow Blvd Enfield, CT 06082 | 49.94 | % | |||
Taynik & Co. c/o State Street Bank One Lincoln Street Boston, MA 02111 | 48.58 | % | ||||
Class R4 | MassMutual 100 Bright Meadow Blvd Enfield, CT 06082 | 59.26 | % | |||
Taynik & Co. c/o State Street Bank One Lincoln Street Boston, MA 02111 | 35.34 | % | ||||
Class R3 | MassMutual 100 Bright Meadow Blvd Enfield, CT 06082 | 79.66 | % | |||
Hartford Life Insurance Co. 1 Griffin Rd. North Windsor, CT 06095 | 17.52 | % | ||||
B-71
MassMutual Select Focused Value Fund8
Class | Name and Address | Percent of Class | ||||
Class I | MassMutual 100 Bright Meadow Blvd Enfield, CT 06082 | 48.88 | % | |||
Taynik & Co. c/o State Street Bank One Lincoln Street Boston, MA 02111 | 17.47 | % | ||||
The Metropolitan Museum of Art Retirement Plan For Covered Union Employees 1000 Fifth Avenue New York, NY 10028 | 6.71 | % | ||||
Class R5 | MassMutual 100 Bright Meadow Blvd Enfield, CT 06082 | 94.24 | % | |||
Service Class | Taynik & Co. c/o State Street Bank One Lincoln Street Boston, MA 02111 | 50.03 | % | |||
MassMutual 100 Bright Meadow Blvd Enfield, CT 06082 | 47.52 | % | ||||
Administrative Class | MassMutual 100 Bright Meadow Blvd Enfield, CT 06082 | 79.29 | % | |||
Taynik & Co. c/o State Street Bank One Lincoln Street Boston, MA 02111 | 19.28 | % | ||||
Class A | MassMutual 100 Bright Meadow Blvd Enfield, CT 06082 | 75.92 | % | |||
Taynik & Co. c/o State Street Bank One Lincoln Street Boston, MA 02111 | 16.70 | % | ||||
Class R4 | MassMutual 100 Bright Meadow Blvd Enfield, CT 06082 | 49.06 | % | |||
Hartford Life Insurance Co. 1 Griffin Rd. North Windsor, CT 06095 | 23.49 | % | ||||
B-72
Class | Name and Address | Percent of Class | ||||
Taynik & Co. c/o State Street Bank One Lincoln Street Boston, MA 02111 | 16.67 | % | ||||
Reliance Trust Company Mutual Omnibus PPL/SMF 1100 Abernathy Road Atlanta, GA. 30328 | 10.79 | % | ||||
Class R3 | MassMutual 100 Bright Meadow Blvd Enfield, CT 06082 | 79.12 | % | |||
Hartford Life Insurance Co. 1 Griffin Rd. North Windsor, CT 06095 | 19.38 | % | ||||
MassMutual Select Fundamental Growth Fund9
Class | Name and Address of Beneficial Owner | Percent of Class | ||||
Class I | MassMutual RetireSMARTSM 2030 Fund 1 Iron Street Boston, MA 02210 | 18.53 | % | |||
MassMutual RetireSMARTSM 2040 Fund 1 Iron Street Boston, MA 02210 | 14.20 | % | ||||
MassMutual RetireSMARTSM 2020 Fund 1 Iron Street Boston, MA 02210 | 10.59 | % | ||||
MassMutual RetireSMARTSM Moderate Growth Fund | 9.13 | % | ||||
MassMutual RetireSMARTSM 2050 Fund 1 Iron Street Boston, MA 02210 | 8.25 | % | ||||
MassMutual RetireSMARTSM 2035 Fund 1 Iron Street Boston, MA 02210 | 8.02 | % | ||||
MassMutual RetireSMARTSM 2025 Fund 1 Iron Street Boston, MA 02210 | 7.79 | % | ||||
B-73
Class | Name and Address of Beneficial Owner | Percent of Class | ||||
MassMutual RetireSMARTSM Moderate Fund 1 Iron Street Boston, MA 02210 | 5.70 | % | ||||
MassMutual RetireSMARTSM 2045 Fund 1 Iron Street Boston, MA 02210 | 5.66 | % | ||||
MassMutual RetireSMARTSM Growth Fund 1 Iron Street Boston, MA 02210 | 5.29 | % | ||||
Class R5 | MassMutual 100 Bright Meadow Blvd Enfield, CT 06082 | 89.74 | % | |||
Taynik & Co. c/o State Street Bank One Lincoln Street Boston, MA 02111 | 10.26 | % | ||||
Service Class | MassMutual 100 Bright Meadow Blvd Enfield, CT 06082 | 54.53 | % | |||
Taynik & Co. c/o State Street Bank One Lincoln Street Boston, MA 02111 | 43.87 | % | ||||
Administrative Class | MassMutual 100 Bright Meadow Blvd Enfield, CT 06082 | 84.31 | % | |||
Taynik & Co. c/o State Street Bank One Lincoln Street Boston, MA 02111 | 15.69 | % | ||||
Class A | MassMutual 100 Bright Meadow Blvd Enfield, CT 06082 | 88.93 | % | |||
Taynik & Co. c/o State Street Bank One Lincoln Street Boston, MA 02111 | 6.68 | % | ||||
Class R4 | MassMutual 100 Bright Meadow Blvd Enfield, CT 06082 | 80.25 | % | |||
Taynik & Co. c/o State Street Bank One Lincoln Street Boston, MA 02111 | 19.75 | % | ||||
B-74
Class | Name and Address of Beneficial Owner | Percent of Class | ||||
Class R3 | MassMutual 100 Bright Meadow Blvd Enfield, CT 06082 | 93.34 | % | |||
Taynik & Co. c/o State Street Bank One Lincoln Street Boston, MA 02111 | 6.66 | % | ||||
MassMutual Select Blue Chip Growth Fund10
Class | Name and Address | Percent of Class | ||||
Class I | MassMutual 100 Bright Meadow Blvd Enfield, CT 06082 | 35.69 | % | |||
T. Rowe Price FBO Retireman Plan 4515 Painters Mill Road Owings Mills, MD 01117 | 26.91 | % | ||||
Taynik & Co. c/o State Street Bank One Lincoln Street Boston, MA 02111 | 24.22 | % | ||||
Class R5 | MassMutual 100 Bright Meadow Blvd Enfield, CT 06082 | 86.56 | % | |||
Taynik & Co. c/o State Street Bank One Lincoln Street Boston, MA 02111 | 8.83 | % | ||||
Service Class | MassMutual 100 Bright Meadow Blvd Enfield, CT 06082 | 58.38 | % | |||
Taynik & Co. c/o State Street Bank One Lincoln Street Boston, MA 02111 | 40.65 | % | ||||
Administrative Class | MassMutual 100 Bright Meadow Blvd Enfield, CT 06082 | 83.41 | % | |||
Taynik & Co. c/o State Street Bank One Lincoln Street Boston, MA 02111 | 16.23 | % | ||||
B-75
Class | Name and Address | Percent of Class | ||||
Class A | MassMutual 100 Bright Meadow Blvd Enfield, CT 06082 | 73.99 | % | |||
Taynik & Co. c/o State Street Bank One Lincoln Street Boston, MA 02111 | 20.70 | % | ||||
Class R4 | MassMutual 100 Bright Meadow Blvd Enfield, CT 06082 | 74.07 | % | |||
Taynik & Co. c/o State Street Bank One Lincoln Street Boston, MA 02111 | 11.28 | % | ||||
Reliance Trust Company Mutual Omnibus PPL/SMF 1100 Abernathy Road Atlanta, GA. 30328 | 10.71 | % | ||||
Class R3 | MassMutual 100 Bright Meadow Blvd Enfield, CT 06082 | 62.72 | % | |||
Hartford Life Insurance Co. 1 Griffin Rd. North Windsor, CT 06095 | 24.37 | % | ||||
Reliance Trust Company Mutual Omnibus PPL/SMF 1100 Abernathy Road Atlanta, GA. 30328 | 7.28 | % | ||||
Taynik & Co. c/o State Street Bank One Lincoln Street Boston, MA 02111 | 5.13 | % | ||||
MassMutual Select Growth Opportunities Fund11
Class | Name and Address of Beneficial Owner | Percent of Class | ||||
Class I | Taynik & Co. c/o State Street Bank One Lincoln Street Boston, MA 02111 | 57.99 | % | |||
MassMutual 100 Bright Meadow Blvd Enfield, CT 06082 | 29.07 | % | ||||
B-76
Class | Name and Address of Beneficial Owner | Percent of Class | ||||
Class R5 | MassMutual 100 Bright Meadow Blvd Enfield, CT 06082 | 74.29 | % | |||
Taynik & Co. c/o State Street Bank One Lincoln Street Boston, MA 02111 | 14.08 | % | ||||
NFS LLC FEBO FIIOC as Agent for Qualified Employee Benefit Plans (401K) FINOPS-IC Funds 100 Magellan Way # KW1C Covington, KY. 41015 | 10.57 | % | ||||
Service Class | Taynik & Co. c/o State Street Bank One Lincoln Street Boston, MA 02111 | 69.76 | % | |||
MassMutual 100 Bright Meadow Blvd Enfield, CT 06082 | 27.98 | % | ||||
Administrative Class | MassMutual 100 Bright Meadow Blvd Enfield, CT 06082 | 69.85 | % | |||
Taynik & Co. c/o State Street Bank One Lincoln Street Boston, MA 02111 | 23.00 | % | ||||
Hartford Life Insurance Co. 1 Griffin Rd. North Windsor, CT 06095 | 6.94 | % | ||||
Class A | MassMutual 100 Bright Meadow Blvd Enfield, CT 06082 | 64.12 | % | |||
Taynik & Co. c/o State Street Bank One Lincoln Street Boston, MA 02111 | 31.70 | % | ||||
Class R4 | MassMutual 100 Bright Meadow Blvd Enfield, CT 06082 | 47.01 | % | |||
Taynik & Co. c/o State Street Bank One Lincoln Street Boston, MA 02111 | 27.21 | % | ||||
B-77
Class | Name and Address of Beneficial Owner | Percent of Class | ||||
Hartford Life Insurance Co. 1 Griffin Rd. North Windsor, CT 06095 | 16.85 | % | ||||
TIAA-CREF Trust Co. FBO Retirement Plans 211 North Boradway, Suite 1000 St. Louis, MO 63102 | 6.89 | % | ||||
Class R3 | MassMutual 100 Bright Meadow Blvd Enfield, CT 06082 | 89.14 | % | |||
Hartford Life Insurance Co. 1 Griffin Rd. North Windsor, CT 06095 | 10.66 | % | ||||
MassMutual Select Mid-Cap Value Fund12
Class | Name and Address | Percent of Class | ||||
Class I | MassMutual 100 Bright Meadow Blvd Enfield, CT 06082 | 16.78 | % | |||
Taynik & Co. c/o State Street Bank One Lincoln Street Boston, MA 02111 | 13.12 | % | ||||
MassMutual RetireSMARTSM 2030 Fund 1 Iron Street Boston, MA 02210 | 12.07 | % | ||||
MassMutual RetireSMARTSM 2020 Fund 1 Iron Street Boston, MA 02210 | 10.85 | % | ||||
MassMutual RetireSMARTSM 2040 Fund 1 Iron Street Boston, MA 02210 | 7.47 | % | ||||
MassMutual RetireSMARTSM Moderate Fund 1 Iron Street Boston, MA 02210 | 7.15 | % | ||||
MassMutual RetireSMARTSM Moderate Growth Fund 1 Iron Street Boston, MA 02210 | 6.14 | % | ||||
B-78
Class | Name and Address | Percent of Class | ||||
MassMutual RetireSMARTSM 2025 Fund 100 Bright Meadow Blvd Enfield, CT 06082 | 5.79 | % | ||||
Class R5 | MassMutual 100 Bright Meadow Blvd Enfield, CT 06082 | 100 | % | |||
Service Class | MassMutual 100 Bright Meadow Blvd Enfield, CT 06082 | 100 | % | |||
Administrative Class | MassMutual 100 Bright Meadow Blvd Enfield, CT 06082 | 100 | % | |||
Class A | MassMutual 100 Bright Meadow Blvd Enfield, CT 06082 | 72.88 | % | |||
Taynik & Co. c/o State Street Bank One Lincoln Street Boston, MA 02111 | 25.59 | % | ||||
Class R4 | MassMutual 100 Bright Meadow Blvd Enfield, CT 06082 | 98.29 | % | |||
Class R3 | MassMutual 100 Bright Meadow Blvd Enfield, CT 06082 | 100 | % | |||
MassMutual Select Small Cap Value Equity Fund13
Class | Name and Address of Beneficial Owner | Percent of Class | ||||
Class I | Elevator Constructors Annuity & 401(k) Retirement Plan c/o State Street Bank 19 Campus Blvd #200 Newton Square, PA 19073 | 47.80 | % | |||
MassMutual RetireSMARTSM 2030 Fund 1 Iron Street Boston, MA 02210 | 9.80 | % | ||||
MassMutual RetireSMARTSM 2040 Fund 1 Iron Street Boston, MA 02210 | 6.57 | % | ||||
MassMutual RetireSMARTSM 2020 Fund 1 Iron Street Boston, MA 02210 | 5.43 | % | ||||
B-79
Class | Name and Address of Beneficial Owner | Percent of Class | ||||
Class R5 | MassMutual 100 Bright Meadow Blvd Enfield, CT 06082 | 97.91 | % | |||
Service Class | MassMutual 100 Bright Meadow Blvd Enfield, CT 06082 | 69.76 | % | |||
Taynik & Co. c/o State Street Bank One Lincoln Street Boston, MA 02111 | 30.24 | % | ||||
Administrative Class | MassMutual 100 Bright Meadow Blvd Enfield, CT 06082 | 41.91 | % | |||
Mercer Trust Co. FBO Stewart & Stevenson LLC 401(k) Savings Plan One Investors Way Norwood, MA 02062 | 39.36 | % | ||||
Taynik & Co. c/o State Street Bank One Lincoln Street Boston, MA 02111 | 18.73 | % | ||||
Class A | MassMutual 100 Bright Meadow Blvd Enfield, CT 06082 | 53.20 | % | |||
Taynik & Co. c/o State Street Bank One Lincoln Street Boston, MA 02111 | 40.87 | % | ||||
Class R4 | Taynik & Co. c/o State Street Bank One Lincoln Street Boston, MA 02111 | 42.72 | % | |||
MassMutual 100 Bright Meadow Blvd Enfield, CT 06082 | 33.98 | % | ||||
Hartford Life Insurance Co. 1 Griffin Rd. North Windsor, CT 06095 | 22.39 | % | ||||
Class R3 | MassMutual 100 Bright Meadow Blvd Enfield, CT 06082 | 96.60 | % | |||
B-80
MassMutual Select Small Company Value Fund14
Class | Name and Address of Beneficial Owner | Percent of Class | ||||
Class I | Taynik & Co. c/o State Street Bank One Lincoln Street Boston, MA 02111 | 44.19 | % | |||
MassMutual 100 Bright Meadow Blvd Enfield, CT 06082 | 36.52 | % | ||||
Class R5 | MassMutual 100 Bright Meadow Blvd Enfield, CT 06082 | 93.58 | % | |||
Taynik & Co. c/o State Street Bank One Lincoln Street Boston, MA 02111 | 5.01 | % | ||||
Service Class | MassMutual 100 Bright Meadow Blvd Enfield, CT 06082 | 47.96 | % | |||
Taynik & Co. c/o State Street Bank One Lincoln Street Boston, MA 02111 | 39.15 | % | ||||
Matrix Trust Company FBO Hunter Engeering Company P.O. Box 52129 Phoenix, AZ. 85072 | 9.92 | % | ||||
Administrative Class | MassMutual 100 Bright Meadow Blvd Enfield, CT 06082 | 80.58 | % | |||
Taynik & Co. c/o State Street Bank One Lincoln Street Boston, MA 02111 | 19.08 | % | ||||
Class A | MassMutual 100 Bright Meadow Blvd Enfield, CT 06082 | 69.98 | % | |||
Taynik & Co. c/o State Street Bank One Lincoln Street Boston, MA 02111 | 12.28 | % | ||||
Class R4 | MassMutual 100 Bright Meadow Blvd Enfield, CT 06082 | 77.30 | % | |||
B-81
Class | Name and Address of Beneficial Owner | Percent of Class | ||||
Hartford Life Insurance Co. 1 Griffin Rd. North Windsor, CT 06095 | 22.70 | % | ||||
Class R3 | MassMutual 100 Bright Meadow Blvd Enfield, CT 06082 | 95.34 | % | |||
MM S&P Mid-Cap Index Fund15
Class | Name and Address | Percent of Class | ||||
Class I | MassMutual 100 Bright Meadow Blvd Enfield, CT 06082 | 65.59 | % | |||
Taynik & Co. c/o State Street Bank One Lincoln Street Boston, MA 02111 | 33.17 | % | ||||
Class R5 | Taynik & Co. c/o State Street Bank One Lincoln Street Boston, MA 02111 | 56.13 | % | |||
MassMutual 100 Bright Meadow Blvd Enfield, CT 06082 | 36.96 | % | ||||
Hartford Life Insurance Co. 1 Griffin Rd. North Windsor, CT 06095 | 6.88 | % | ||||
Service Class | Taynik & Co. c/o State Street Bank One Lincoln Street Boston, MA 02111 | 53.49 | % | |||
MassMutual 100 Bright Meadow Blvd Enfield, CT 06082 | 39.22 | % | ||||
Administrative Class | Taynik & Co. c/o State Street Bank One Lincoln Street Boston, MA 02111 | 52.87 | % | |||
MassMutual 100 Bright Meadow Blvd Enfield, CT 06082 | 46.99 | % | ||||
Class A | MassMutual 100 Bright Meadow Blvd Enfield, CT 06082 | 54.06 | % | |||
B-82
Class | Name and Address | Percent of Class | ||||
Taynik & Co. c/o State Street Bank One Lincoln Street Boston, MA 02111 | 44.80 | % | ||||
Class R4 | MassMutual 100 Bright Meadow Blvd Enfield, CT 06082 | 62.78 | % | |||
Taynik & Co. c/o State Street Bank One Lincoln Street Boston, MA 02111 | 21.07 | % | ||||
Hartford Life Insurance Co. 1 Griffin Rd. North Windsor, CT 06095 | 13.82 | % | ||||
Class R3 | MassMutual 100 Bright Meadow Blvd Enfield, CT 06082 | 70.14 | % | |||
Hartford Life Insurance Co. 1 Griffin Rd. North Windsor, CT 06095 | 25.64 | % | ||||
MM Russell 2000 Small Cap Index Fund16
Class | Name and Address | Percent of Class | ||||
Class I | MassMutual 100 Bright Meadow Blvd Enfield, CT 06082 | 75.76 | % | |||
Taynik & Co. c/o State Street Bank One Lincoln Street Boston, MA 02111 | 18.68 | % | ||||
Class R5 | MassMutual 100 Bright Meadow Blvd Enfield, CT 06082 | 62.63 | % | |||
Taynik & Co. c/o State Street Bank One Lincoln Street Boston, MA 02111 | 31.33 | % | ||||
Hartford Life Insurance Co. 1 Griffin Rd. North Windsor, CT 06095 | 5.88 | % | ||||
Service Class | Taynik & Co. c/o State Street Bank One Lincoln Street Boston, MA 02111 | 51.68 | % | |||
B-83
Class | Name and Address | Percent of Class | ||||
MassMutual 100 Bright Meadow Blvd Enfield, CT 06082 | 40.20 | % | ||||
Hartford Life Insurance Co. 1 Griffin Rd. North Windsor, CT 06095 | 5.18 | % | ||||
Administrative Class | Taynik & Co. c/o State Street Bank One Lincoln Street Boston, MA 02111 | 56.26 | % | |||
MassMutual 100 Bright Meadow Blvd Enfield, CT 06082 | 43.29 | % | ||||
Class A | Taynik & Co. c/o State Street Bank One Lincoln Street Boston, MA 02111 | 67.40 | % | |||
MassMutual 100 Bright Meadow Blvd Enfield, CT 06082 | 31.90 | % | ||||
Class R4 | MassMutual 100 Bright Meadow Blvd Enfield, CT 06082 | 52.61 | % | |||
Hartford Life Insurance Co. 1 Griffin Rd. North Windsor, CT 06095 | 23.99 | % | ||||
Taynik & Co. c/o State Street Bank One Lincoln Street Boston, MA 02111 | 20.38 | % | ||||
Class R3 | MassMutual 100 Bright Meadow Blvd Enfield, CT 06082 | 75.26 | % | |||
Hartford Life Insurance Co. 1 Griffin Rd. North Windsor, CT 06095 | 19.75 | % | ||||
MassMutual Select Mid Cap Growth Equity II Fund17
Class | Name and Address | Percent of Class | ||||
Class I | MassMutual 100 Bright Meadow Blvd Enfield, CT 06082 | 20.72 | % | |||
B-84
Class | Name and Address | Percent of Class | ||||
NFS LLC FEBO FIIOC as Agent for Qualified Employee Benefit Plans (401K) FINOPS-IC Funds 100 Magellan Way # KW1C Covington, KY. 41015 | 19.93 | % | ||||
Taynik & Co. c/o State Street Bank One Lincoln Street Boston, MA 02111 | 18.46 | % | ||||
Class R5 | MassMutual 100 Bright Meadow Blvd Enfield, CT 06082 | 46.35 | % | |||
NFS LLC FEBO FIIOC as Agent for Qualified Employee Benefit Plans (401K) FINOPS-IC Funds 100 Magellan Way # KW1C Covington, KY. 41015 | 13.20 | % | ||||
Taynik & Co. c/o State Street Bank One Lincoln Street Boston, MA 02111 | 9.81 | % | ||||
Charles Schwab & Co. Inc. 211 Main Street San Francisco, CA 94105 | 5.01 | % | ||||
Service Class | MassMutual 100 Bright Meadow Blvd Enfield, CT 06082 | 40.17 | % | |||
Taynik & Co. c/o State Street Bank One Lincoln Street Boston, MA 02111 | 33.11 | % | ||||
NFS LLC FEBO FIIOC as Agent for Qualified Employee Benefit Plans (401K) FINOPS-IC Funds 100 Magellan Way # KW1C Covington, KY. 41015 | 8.53 | % | ||||
Administrative Class | MassMutual 100 Bright Meadow Blvd Enfield, CT 06082 | 68.60 | % | |||
Taynik & Co. c/o State Street Bank One Lincoln Street Boston, MA 02111 | 21.23 | % | ||||
B-85
Class | Name and Address | Percent of Class | ||||
Class A | MassMutual 100 Bright Meadow Blvd Enfield, CT 06082 | 65.28 | % | |||
Taynik & Co. c/o State Street Bank One Lincoln Street Boston, MA 02111 | 23.75 | % | ||||
Class R4 | MassMutual 100 Bright Meadow Blvd Enfield, CT 06082 | 25.97 | % | |||
Taynik & Co. c/o State Street Bank One Lincoln Street Boston, MA 02111 | 14.06 | % | ||||
Great-West Trust Company LLC Employee Benefits Clients 401K 8515 E Orchard Rd 2T2 Greenwood Village, CO 80111 | 8.13 | % | ||||
DCGT as Trustee and/or Custodian FBO PLIC Various Retirement Plans Omnibus 711 High Street Des Moines, IA 50392 | 8.05 | % | ||||
Reliance Trust Company Mutual Omnibus PPL/SMF 1100 Abernathy Road Atlanta, GA. 30328 | 7.49 | % | ||||
Hartford Life Insurance Co. 1 Griffin Rd. North Windsor, CT 06095 | 5.48 | % | ||||
Class R3 | MassMutual 100 Bright Meadow Blvd Enfield, CT 06082 | 55.43 | % | |||
Hartford Life Insurance Co. 1 Griffin Rd. North Windsor, CT 06095 | 16.27 | % | ||||
Reliance Trust Company c/o Fascore LLC FBO Retirement Plans Serviced by Metlife 8515 E Orchard Rd 2T2 Greenwood Village, CO 80111 | 9.28 | % | ||||
DCGT as Trustee and/or Custodian FBO PLIC Various Retirement Plans Omnibus 711 High Street Des Moines, IA 50392 | 7.13 | % | ||||
B-86
MassMutual Select Small Cap Growth Equity Fund18
Class | Name and Address | Percent of Class | ||||
Class I | MassMutual 100 Bright Meadow Blvd Enfield, CT 06082 | 69.58 | % | |||
Taynik & Co. c/o State Street Bank One Lincoln Street Boston, MA 02111 | 11.97 | % | ||||
Class R5 | MassMutual 100 Bright Meadow Blvd Enfield, CT 06082 | 96.62 | % | |||
Service Class | MassMutual 100 Bright Meadow Blvd Enfield, CT 06082 | 72.95 | % | |||
Taynik & Co. c/o State Street Bank One Lincoln Street Boston, MA 02111 | 14.11 | % | ||||
Matrix Trust Company FBO Arthur J. Gallagher Corp. Supplemental Savings THR - WTRISC P.O. Box 52129 Phoenix, AZ. 85072 | 11.99 | % | ||||
Administrative Class | MassMutual 100 Bright Meadow Blvd Enfield, CT 06082 | 82.97 | % | |||
Taynik & Co. c/o State Street Bank One Lincoln Street Boston, MA 02111 | 16.50 | % | ||||
Class A | MassMutual 100 Bright Meadow Blvd Enfield, CT 06082 | 82.03 | % | |||
Taynik & Co. c/o State Street Bank One Lincoln Street Boston, MA 02111 | 7.39 | % | ||||
Class R4 | Taynik & Co. c/o State Street Bank One Lincoln Street Boston, MA 02111 | 44.97 | % | |||
MassMutual 100 Bright Meadow Blvd Enfield, CT 06082 | 21.47 | % | ||||
B-87
Class | Name and Address | Percent of Class | ||||
Hartford Life Insurance Co. 1 Griffin Rd. North Windsor, CT 06095 | 17.78 | % | ||||
Reliance Trust Company Mutual Omnibus PPL/SMF 1100 Abernathy Road Atlanta, GA. 30328 | 15.78 | % | ||||
Class R3 | Hartford Life Insurance Co. 1 Griffin Rd. North Windsor, CT 06095 | 60.91 | % | |||
MassMutual 100 Bright Meadow Blvd Enfield, CT 06082 | 27.67 | % | ||||
Reliance Trust Company Mutual Omnibus PPL/SMF 1100 Abernathy Road Atlanta, GA. 30328 | 10.87 | % | ||||
MassMutual Select Diversified International Fund
Class | Name and Address | Percent of Class | ||||
Class I | MassMutual RetireSMARTSM 2030 Fund 1 Iron Street Boston, MA 02210 | 18.06 | % | |||
MassMutual RetireSMARTSM 2040 Fund 1 Iron Street Boston, MA 02210 | 11.36 | % | ||||
MassMutual RetireSMARTSM 2020 Fund 1 Iron Street Boston, MA 02210 | 11.09 | % | ||||
MassMutual RetireSMARTSM Moderate Growth Fund 1 Iron Street Boston, MA 02210 | 8.88 | % | ||||
MassMutual RetireSMARTSM 2025 Fund 1 Iron Street Boston, MA 02210 | 7.31 | % | ||||
MassMutual 100 Bright Meadow Blvd Enfield, CT 06082 | 7.31 | % | ||||
B-88
Class | Name and Address | Percent of Class | ||||
MassMutual RetireSMARTSM 2035 Fund 1 Iron Street Boston, MA 02210 | 7.15 | % | ||||
MassMutual RetireSMARTSM Moderate Fund 1 Iron Street Boston, MA 02210 | 7.11 | % | ||||
MassMutual RetireSMARTSM 2050 Fund 1 Iron Street Boston, MA 02210 | 5.86 | % | ||||
Class R5 | MassMutual 100 Bright Meadow Blvd Enfield, CT 06082 | 100 | % | |||
Service Class | Taynik & Co. c/o State Street Bank One Lincoln Street Boston, MA 02111 | 47.30 | % | |||
SEI Private Trust Company c/o State Street Bank ID 571 FBO A/C 4741397 One Freedom Valley Drive Oaks, PA 19456 | 41.85 | % | ||||
MassMutual 100 Bright Meadow Blvd Enfield, CT 06082 | 10.85 | % | ||||
Administrative Class | MassMutual 100 Bright Meadow Blvd Enfield, CT 06082 | 92.40 | % | |||
Taynik & Co. c/o State Street Bank One Lincoln Street Boston, MA 02111 | 7.60 | % | ||||
Class A | MassMutual 100 Bright Meadow Blvd Enfield, CT 06082 | 53.68 | % | |||
Taynik & Co. c/o State Street Bank One Lincoln Street Boston, MA 02111 | 18.45 | % | ||||
NFS LLC FEBO FBO Paul Cervone FMTC IRA 104 Wilmington Rd Burlington, MA 01803 | 5.52 | % | ||||
B-89
Class | Name and Address | Percent of Class | ||||
Class R4 | MassMutual 100 Bright Meadow Blvd Enfield, CT 06082 | 64.94 | % | |||
Hartford Life Insurance Co. 1 Griffin Rd. North Windsor, CT 06095 | 25.00 | % | ||||
Reliance Trust Company Mutual Omnibus PPL/SMF 1100 Abernathy Road Atlanta, GA. 30328 | 5.51 | % | ||||
Class R3 | MassMutual 100 Bright Meadow Blvd Enfield, CT 06082 | 93.86 | % | |||
Hartford Life Insurance Co. 1 Griffin Rd. North Windsor, CT 06095 | 6.14 | % | ||||
MM MSCI EAFE International Index Fund19
Class | Name and Address | Percent of Class | ||||
Class I | MassMutual 100 Bright Meadow Blvd Enfield, CT 06082 | 85.24 | % | |||
Taynik & Co. c/o State Street Bank One Lincoln Street Boston, MA 02111 | 12.63 | % | ||||
Class R5 | MassMutual 100 Bright Meadow Blvd Enfield, CT 06082 | 79.49 | % | |||
Taynik & Co. c/o State Street Bank One Lincoln Street Boston, MA 02111 | 20.35 | % | ||||
Service Class | Taynik & Co. c/o State Street Bank One Lincoln Street Boston, MA 02111 | 73.05 | % | |||
Hartford Life Insurance Co. 1 Griffin Rd. North Windsor, CT 06095 | 14.26 | % | ||||
MassMutual 100 Bright Meadow Blvd Enfield, CT 06082 | 12.63 | % | ||||
B-90
Class | Name and Address | Percent of Class | ||||
Administrative Class | Taynik & Co. c/o State Street Bank One Lincoln Street Boston, MA 02111 | 60.80 | % | |||
MassMutual 100 Bright Meadow Blvd Enfield, CT 06082 | 39.20 | % | ||||
Class A | Taynik & Co. c/o State Street Bank One Lincoln Street Boston, MA 02111 | 57.71 | % | |||
MassMutual 100 Bright Meadow Blvd Enfield, CT 06082 | 42.28 | % | ||||
Class R4 | MassMutual 100 Bright Meadow Blvd Enfield, CT 06082 | 51.59 | % | |||
Taynik & Co. c/o State Street Bank One Lincoln Street Boston, MA 02111 | 25.02 | % | ||||
Hartford Life Insurance Co. 1 Griffin Rd. North Windsor, CT 06095 | 19.07 | % | ||||
Class R3 | MassMutual 100 Bright Meadow Blvd Enfield, CT 06082 | 78.72 | % | |||
Hartford Life Insurance Co. 1 Griffin Rd. North Windsor, CT 06095 | 17.69 | % | ||||
MassMutual Select Overseas Fund20
Class | Name and Address | Percent of Class | ||||
Class I | MassMutual 100 Bright Meadow Blvd Enfield, CT 06082 | 27.55 | % | |||
Taynik & Co. c/o State Street Bank One Lincoln Street Boston, MA 02111 | 11.49 | % | ||||
MassMutual RetireSMARTSM 2030 Fund 1 Iron Street Boston, MA 02210 | 11.44 | % | ||||
B-91
Class | Name and Address | Percent of Class | ||||
MassMutual RetireSMARTSM 2040 Fund 1 Iron Street Boston, MA 02210 | 7.13 | % | ||||
MassMutual RetireSMARTSM 2020 Fund 1 Iron Street Boston, MA 02210 | 7.09 | % | ||||
MassMutual RetireSMARTSM Moderate Growth Fund 1 Iron Street Boston, MA 02210 | 5.62 | % | ||||
Class R5 | MassMutual 100 Bright Meadow Blvd Enfield, CT 06082 | 87.01 | % | |||
Taynik & Co. c/o State Street Bank One Lincoln Street Boston, MA 02111 | 11.71 | % | ||||
Service Class | MassMutual 100 Bright Meadow Blvd Enfield, CT 06082 | 50.49 | % | |||
Taynik & Co. c/o State Street Bank One Lincoln Street Boston, MA 02111 | 48.70 | % | ||||
Administrative Class | MassMutual 100 Bright Meadow Blvd Enfield, CT 06082 | 68.23 | % | |||
Taynik & Co. c/o State Street Bank One Lincoln Street Boston, MA 02111 | 30.45 | % | ||||
Class A | MassMutual 100 Bright Meadow Blvd Enfield, CT 06082 | 68.03 | % | |||
Taynik & Co. c/o State Street Bank One Lincoln Street Boston, MA 02111 | 25.71 | % | ||||
Class R4 | MassMutual 100 Bright Meadow Blvd Enfield, CT 06082 | 44.67 | % | |||
B-92
Class | Name and Address | Percent of Class | ||||
Taynik & Co. c/o State Street Bank One Lincoln Street Boston, MA 02111 | 32.77 | % | ||||
Hartford Life Insurance Co. 1 Griffin Rd. North Windsor, CT 06095 | 22.56 | % | ||||
Class R3 | MassMutual 100 Bright Meadow Blvd Enfield, CT 06082 | 79.34 | % | |||
Hartford Life Insurance Co. 1 Griffin Rd. North Windsor, CT 06095 | 20.66 | % | ||||
| 1 | As of January 3, 2017, MassMutual, 100 Bright Meadow Blvd, Enfield, CT 06082, and Taynik & Co., One Lincoln Street, Boston, MA 02111, owned 64.85% and 26.74%, respectively, of MassMutual Select Total Return Bond Fund and therefore may be presumed to “control” the Fund, as that term is defined in the 1940 Act. However, such ownership may be beneficially held by individuals or entities other than MassMutual and Taynik & Co. MassMutual and Taynik & Co. are organized under the laws of Massachusetts. |
| 2 | As of January 3, 2017, MassMutual, 100 Bright Meadow Blvd, Enfield, CT 06082, owned 55.94% of MassMutual Select Strategic Bond Fund and therefore may be presumed to “control” the Fund, as that term is defined in the 1940 Act. However, such ownership may be beneficially held by individuals or entities other than MassMutual. MassMutual is organized under the laws of Massachusetts. |
| 3 | As of January 3, 2017, Mac & Co., 525 William Penn Place, Pittsburgh, PA 15230, owned 88.17% of MassMutual Select BlackRock Global Allocation Fund and therefore may be presumed to “control” the Fund, as that term is defined in the 1940 Act. However, such ownership may be beneficially held by individuals or entities other than Mac & Co. Mac & Co. is organized under the laws of Pennsylvania. |
| 4 | As of January 3, 2017, Elevator Constructors Annuity & 401(k) Retirement Plan, 19 Campus Blvd #200, Newton Square, PA 19073, owned 41.71% of MassMutual Select Diversified Value Fund and therefore may be presumed to “control” the Fund, as that term is defined in the 1940 Act. However, such ownership may be beneficially held by individuals or entities other than Elevator Constructors Annuity & 401(k) Retirement Plan. Elevator Constructors Annuity & 401(k) Retirement Plan is organized under the laws of Pennsylvania. |
| 5 | As of January 3, 2017, MassMutual, 100 Bright Meadow Blvd, Enfield, CT 06082, owned 78.85% of MassMutual Select Fundamental Value Fund and therefore may be presumed to “control” the Fund, as that term is defined in the 1940 Act. However, such ownership may be beneficially held by individuals or entities other than MassMutual. MassMutual is organized under the laws of Massachusetts. |
| 6 | As of January 3, 2017, MassMutual, 100 Bright Meadow Blvd, Enfield, CT 06082, owned 67.98% of MassMutual Select Large Cap Value Fund and therefore may be presumed to “control” the Fund, as that term is defined in the 1940 Act. However, such ownership may be beneficially held by individuals or entities other than MassMutual. MassMutual is organized under the laws of Massachusetts. |
| 7 | As of January 3, 2017, MassMutual, 100 Bright Meadow Blvd, Enfield, CT 06082, and Taynik & Co., One Lincoln Street, Boston, MA 02111, owned 62.23% and 33.87%, respectively, of MM S&P 500 Index Fund and therefore may be presumed to “control” the Fund, as that term is defined in the 1940 Act. However, such ownership may be beneficially held by individuals or entities other than MassMutual and Taynik & Co. MassMutual and Taynik & Co. are organized under the laws of Massachusetts. |
| 8 | As of January 3, 2017, MassMutual, 100 Bright Meadow Blvd, Enfield, CT 06082, owned 70.09% of MassMutual Select Focused Value Fund and therefore may be presumed to “control” the Fund, as that term is defined in the 1940 Act. However, such ownership may be beneficially held by individuals or entities other than MassMutual. MassMutual is organized under the laws of Massachusetts. |
B-93
| 9 | As of January 3, 2017, MassMutual, 100 Bright Meadow Blvd, Enfield, CT 06082, owned 44.58% of MassMutual Select Fundamental Growth Fund and therefore may be presumed to “control” the Fund, as that term is defined in the 1940 Act. However, such ownership may be beneficially held by individuals or entities other than MassMutual. MassMutual is organized under the laws of Massachusetts. |
| 10 | As of January 3, 2017, MassMutual, 100 Bright Meadow Blvd, Enfield, CT 06082, owned 57.86% of MassMutual Select Blue Chip Growth Fund and therefore may be presumed to “control” the Fund, as that term is defined in the 1940 Act. However, such ownership may be beneficially held by individuals or entities other than MassMutual. MassMutual is organized under the laws of Massachusetts. |
| 11 | As of January 3, 2017, MassMutual, 100 Bright Meadow Blvd, Enfield, CT 06082, and Taynik & Co., One Lincoln Street, Boston, MA 02111, owned 47.28% and 43.27%, respectively, of MassMutual Select Growth Opportunities Fund and therefore may be presumed to “control” the Fund, as that term is defined in the 1940 Act. However, such ownership may be beneficially held by individuals or entities other than MassMutual and Taynik & Co. MassMutual and Taynik & Co. are organized under the laws of Massachusetts. |
| 12 | As of January 3, 2017, MassMutual, 100 Bright Meadow Blvd, Enfield, CT 06082, owned 25.32% of MassMutual Select Mid-Cap Value Fund and therefore may be presumed to “control” the Fund, as that term is defined in the 1940 Act. However, such ownership may be beneficially held by individuals or entities other than MassMutual. MassMutual is organized under the laws of Massachusetts. |
| 13 | As of January 3, 2017, Elevator Constructors Annuity & 401(k) Retirement Plan, 19 Campus Blvd #200, Newton Square, PA 19073, and MassMutual, 100 Bright Meadow Blvd, Enfield, CT 06082, owned 30.32% and 30.03%, respectively, of MassMutual Select Small Cap Value Equity Fund and therefore may be presumed to “control” the Fund, as that term is defined in the 1940 Act. However, such ownership may be beneficially held by individuals or entities other than Elevator Constructors Annuity & 401(k) Retirement Plan and MassMutual. Elevator Constructors Annuity & 401(k) Retirement Plan is organized under the laws of Pennsylvania and MassMutual is organized under the laws of Massachusetts. |
| 14 | As of January 3, 2017, MassMutual, 100 Bright Meadow Blvd, Enfield, CT 06082, and Taynik & Co., One Lincoln Street, Boston, MA 02111, owned 63.86% and 25.06%, respectively, of MassMutual Select Small Company Value Fund and therefore may be presumed to “control” the Fund, as that term is defined in the 1940 Act. However, such ownership may be beneficially held by individuals or entities other than MassMutual and Taynik & Co. MassMutual and Taynik & Co. are organized under the laws of Massachusetts. |
| 15 | As of January 3, 2017, MassMutual, 100 Bright Meadow Blvd, Enfield, CT 06082, and Taynik & Co., One Lincoln Street, Boston, MA 02111, owned 56.20% and 36.77%, respectively, of MM S&P Mid Cap Index Fund and therefore may be presumed to “control” the Fund, as that term is defined in the 1940 Act. However, such ownership may be beneficially held by individuals or entities other than MassMutual and Taynik & Co. MassMutual and Taynik & Co. are organized under the laws of Massachusetts. |
| 16 | As of January 3, 2017, MassMutual, 100 Bright Meadow Blvd, Enfield, CT 06082, and Taynik & Co., One Lincoln Street, Boston, MA 02111, owned 62.24% and 29.30%, respectively, of MM Russell 2000 Small Cap Index Fund and therefore may be presumed to “control” the Fund, as that term is defined in the 1940 Act. However, such ownership may be beneficially held by individuals or entities other than MassMutual and Taynik & Co. MassMutual and Taynik & Co. are organized under the laws of Massachusetts. |
| 17 | As of January 3, 2017, MassMutual, 100 Bright Meadow Blvd, Enfield, CT 06082, owned 35.52% of MassMutual Select Mid Cap Growth Equity II Fund and therefore may be presumed to “control” the Fund, as that term is defined in the 1940 Act. However, such ownership may be beneficially held by individuals or entities other than MassMutual. MassMutual is organized under the laws of Massachusetts. |
| 18 | As of January 3, 2017, MassMutual, 100 Bright Meadow Blvd, Enfield, CT 06082, owned 77.70% of MassMutual Select Small Cap Growth Equity Fund and therefore may be presumed to “control” the Fund, as that term is defined in the 1940 Act. However, such ownership may be beneficially held by individuals or entities other than MassMutual. MassMutual is organized under the laws of Massachusetts. |
| 19 | As of January 3, 2017, MassMutual, 100 Bright Meadow Blvd, Enfield, CT 06082, and Taynik & Co., One Lincoln Street, Boston, MA 02111, owned 64.89% and 28.20%, respectively, of MM MSCI EAFE International Index Fund and therefore may be presumed to “control” the Fund, as that term is defined in the 1940 Act. However, such ownership may be beneficially held by individuals or entities other than MassMutual and Taynik & Co. MassMutual and Taynik & Co. are organized under the laws of Massachusetts. |
B-94
| 20 | As of January 3, 2017, MassMutual, 100 Bright Meadow Blvd, Enfield, CT 06082, owned 49.45% of MassMutual Select Overseas Fund and therefore may be presumed to “control” the Fund, as that term is defined in the 1940 Act. However, such ownership may be beneficially held by individuals or entities other than MassMutual. MassMutual is organized under the laws of Massachusetts. |
INVESTMENT ADVISORY AND OTHER SERVICE AGREEMENTS
Investment Adviser
MML Advisers, a wholly-owned subsidiary of MassMutual, serves as investment adviser to each Fund pursuant to Investment Management Agreements with the Trust on behalf of the Funds (each, an “Advisory Agreement”). Under each Advisory Agreement, MML Advisers is obligated to provide for the management of each Fund’s portfolio of securities, subject to policies established by the Trustees of the Trust and in accordance with each Fund’s investment objective, policies, and restrictions as set forth herein and in the Prospectus, and has the right to select subadvisers to the Funds pursuant to an investment subadvisory agreement (the “Subadvisory Agreement”). MassMutual served as the Funds’ investment adviser pursuant to the Advisory Agreements prior to April 1, 2014.
The Advisory Agreement with each Fund may be terminated by the Board or by MML Advisers without penalty: (i) at any time for cause or by agreement of the parties or (ii) by either party upon sixty days’ written notice to the other party. In addition, each Advisory Agreement automatically terminates if it is assigned or if its continuance is not specifically approved at least annually (after its initial 2 year period) by the Board or by the holders of a majority of the outstanding voting securities of the applicable Fund, and in either case by a majority of the Trustees who are not parties to the Advisory Agreement or interested persons of any such party. MML Advisers’ liability regarding its investment management obligations and duties is limited to situations involving its willful misfeasance, bad faith, gross negligence, or reckless disregard of such obligations and duties.
MML Advisers also serves as investment adviser to: MassMutual RetireSMARTSM Conservative Fund, MassMutual RetireSMARTSM Moderate Fund, MassMutual RetireSMARTSM Moderate Growth Fund, MassMutual RetireSMARTSM Growth Fund, MassMutual RetireSMARTSM In Retirement Fund, MassMutual RetireSMARTSM 2010 Fund, MassMutual RetireSMARTSM 2015 Fund, MassMutual RetireSMARTSM 2020 Fund, MassMutual RetireSMARTSM 2025 Fund, MassMutual RetireSMARTSM 2030 Fund, MassMutual RetireSMARTSM 2035 Fund, MassMutual RetireSMARTSM 2040 Fund, MassMutual RetireSMARTSM 2045 Fund, MassMutual RetireSMARTSM 2050 Fund, MassMutual RetireSMARTSM 2055 Fund, MassMutual RetireSMARTSM 2060 Fund, MM Select Bond and Income Asset Fund, and MM Select Equity Asset Fund, which are series of the Trust; MassMutual Premier U.S. Government Money Market Fund, MassMutual Premier Short-Duration Bond Fund, MassMutual Premier Inflation-Protected and Income Fund, MassMutual Premier Core Bond Fund, MassMutual Premier Diversified Bond Fund, MassMutual Premier High Yield Fund, MassMutual Premier Balanced Fund, MassMutual Premier Value Fund, MassMutual Premier Disciplined Value Fund, MassMutual Premier Main Street Fund, MassMutual Premier Disciplined Growth Fund, MassMutual Premier Small Cap Opportunities Fund, MassMutual Premier Global Fund, MassMutual Premier International Equity Fund, and MassMutual Premier Strategic Emerging Markets Fund, which are series of MassMutual Premier Funds, an open-end management investment company; MML Aggressive Allocation Fund, MML American Funds Core Allocation Fund, MML American Funds® Growth Fund, MML American Funds® International Fund, MML Balanced Allocation Fund, MML Blue Chip Growth Fund, MML Conservative Allocation Fund, MML Equity Income Fund, MML Equity Index Fund, MML Focused Equity Fund, MML Foreign Fund, MML Fundamental Growth Fund, MML Fundamental Value Fund, MML Global Fund, MML Growth Allocation Fund, MML Growth & Income Fund, MML Income & Growth Fund, MML International Equity Fund, MML Large Cap Growth Fund, MML Managed Volatility Fund, MML Mid Cap Growth Fund, MML Mid Cap Value Fund, MML Moderate Allocation Fund, MML Total Return Bond Fund, MML Small Cap Growth Equity Fund, MML Small Company Value Fund, and MML Small/Mid Cap Value Fund, which are
B-95
series of MML Series Investment Fund, an open-end management investment company; MML Asset Momentum Fund, MML Blend Fund, MML Dynamic Bond Fund, MML Equity Fund, MML Equity Rotation Fund, MML High Yield Fund, MML Inflation- Protected and Income Fund, MML Managed Bond Fund, MML U.S. Government Money Market Fund, MML Short-Duration Bond Fund, MML Small Cap Equity Fund, MML Special Situations Fund, and MML Strategic Emerging Markets Fund, which are series of MML Series Investment Fund II, an open-end management investment company; certain wholly-owned subsidiaries of MassMutual; and various employee benefit plans and separate investment accounts in which employee benefit plans invest.
The Trust, on behalf of each Fund, pays MML Advisers an investment advisory fee monthly, at an annual rate based upon the average daily net assets of that Fund as follows:
Fund | ||
Total Return Bond Fund | 0.30% on the first $2 billion; and 0.27% on any excess over $2 billion | |
Strategic Bond Fund | 0.45% on the first $200 million; and 0.35% on any excess over $200 million | |
BlackRock Global Allocation Fund | 0.78% on the first $750 million; and 0.73% on any excess over $750 million | |
Diversified Value Fund | 0.50% on the first $400 million; and 0.475% on any excess over $400 million | |
Fundamental Value Fund | 0.60% on the first $1.25 billion; 0.575% on the next $250 million; and 0.55% on any excess over $1.5 billion | |
Large Cap Value Fund | 0.60% on the first $750 million; and 0.55% on any excess over $750 million | |
S&P 500 Index Fund | 0.10% on the first $2.5 billion; 0.08% on the next $2.5 billion; and 0.05% on any excess over $5 billion | |
Focused Value Fund | 0.69% on the first $1 billion; and 0.64% on any excess over $1 billion | |
Fundamental Growth Fund | 0.65% on the first $300 million; and 0.60% on any excess over $300 million | |
Blue Chip Growth Fund | 0.65% on the first $750 million; and 0.60% on any excess over $750 million | |
Growth Opportunities Fund | 0.71% on the first $500 million; and 0.68% on any excess over $500 million | |
Mid-Cap Value Fund | 0.70% on the first $300 million; and 0.65% on any excess over $300 million | |
Small Cap Value Equity Fund | 0.75% on the first $300 million; and 0.70% on any excess over $300 million | |
Small Company Value Fund | 0.85% on the first $750 million; and 0.80% on any excess over $750 million | |
S&P Mid Cap Index Fund | 0.10% on the first $500 million; and 0.08% on any excess over $500 million | |
Russell 2000 Small Cap Index Fund | 0.10% on the first $500 million; and 0.08% on any excess over $500 million | |
Mid Cap Growth Equity II Fund | 0.72% on the first $2 billion; and 0.67% on any excess over $2 billion |
B-96
Fund | ||
Small Cap Growth Equity Fund | 0.80% on the first $1 billion; and 0.78% on any excess over $1 billion | |
Diversified International Fund | 0.80% on the first $250 million; and 0.78% on any excess over $250 million | |
MSCI EAFE International Index Fund | 0.10% on the first $1 billion; and 0.09% on any excess over $1 billion | |
Overseas Fund | 0.80% on the first $750 million; 0.775% on the next $500 million; and 0.75% on any excess over $1.25 billion |
Unaffiliated Subadvisers
BlackRock serves as subadviser for the BlackRock Global Allocation Fund. BlackRock also provides subadvisory services for the MML Income & Growth Fund, a series of MML Series Investment Fund, a registered, open-end investment company for which MML Advisers serves as investment adviser.
Brandywine Global and Loomis Sayles both act as subadvisers for the Diversified Value Fund. Brandywine Global is a wholly-owned, independently operated subsidiary of Legg Mason, Inc., and is headquartered in Philadelphia with an office in San Francisco. Brandywine Global also operates two affiliated companies with offices in Singapore and London. Loomis Sayles is an indirect subsidiary of Natixis Global Asset Management, L.P. which owns, in addition to Loomis Sayles, a number of other asset management and distribution and service entities. Natixis Global Asset Management, L.P. is part of Natixis Global Asset Management, an international asset management group based in Paris, France, that is in turn owned by Natixis, a French investment banking and financial services firm. Natixis is principally owned by BPCE, France’s second largest banking group. The group includes two autonomous and complimentary retail banking networks consisting of the Caisse d’Epargne regional savings banks and the Banque Populaire regional cooperative banks. Loomis Sayles also provides subadvisory services for the MML Equity Fund, a series of MML Series Investment Fund II, a registered, open-end investment company for which MML Advisers serves as investment adviser. Loomis Sayles and T. Rowe Price both act as subadvisers for the Blue Chip Growth Fund. T. Rowe Price is a wholly-owned subsidiary of T. Rowe Price Group, Inc., a publicly traded financial services holding company.
J.P. Morgan also serves as a subadviser for the Diversified International Fund.
Western Asset and Western Asset Limited serve as subadvisers for the Strategic Bond Fund. Western Asset and Western Asset Limited are wholly-owned subsidiaries of Legg Mason, Inc.
Wellington Management and Barrow Hanley both act as subadvisers for the Small Cap Value Equity Fund. Barrow Hanley is a subsidiary of OM Management plc, a publicly-held company traded on the NYSE, comprised of approximately eight independent asset management firms.
Wellington Management also serves as subadviser for the Fundamental Value Fund, Fundamental Growth Fund, and Small Cap Growth Equity Fund. Wellington Management also provides subadvisory services for the MML Fundamental Value Fund and MML Fundamental Growth Fund, each of which are series of MML Series Investment Fund, a registered, open-end investment company for which MML Advisers serves as investment adviser.
MetWest serves as subadviser for the Total Return Bond Fund. MetWest, founded in 1996, is a wholly-owned subsidiary of The TCW Group, Inc. MetWest also provides subadvisory services for the MML Total Return Bond Fund, a series of MML Series Investment Fund, a registered, open-end investment company for which MML Advisers serves as investment adviser.
B-97
NTI serves as subadviser for the S&P 500 Index Fund, S&P Mid Cap Index Fund, Russell 2000 Small Cap Index Fund, and MSCI EAFE International Index Fund. NTI, a subsidiary of Northern Trust Corporation, is an Illinois State Banking Corporation and an investment adviser registered under the Investment Advisers Act of 1940, as amended (the “Advisers Act”). It primarily manages assets for institutional and individual separately managed accounts, investment companies, and bank common and collective funds. Northern Trust Corporation is regulated by the Board of Governors of the Federal Reserve System as a financial holding company under the U.S. Bank Holding Company Act of 1956, as amended. NTI also provides subadvisory services for the MM Select Bond and Income Asset Fund and MM Select Equity Asset Fund, which are each a series of the Trust, and for the MML Equity Index Fund, a series of MML Series Investment Fund, a registered, open-end investment company for which MML Advisers serves as investment adviser.
Barrow Hanley and Huber Capital Management both act as subadvisers for the Large Cap Value Fund. Huber Capital Management is a 100% employee owned investment advisory firm.
Harris serves as subadviser for the Focused Value Fund. Harris also provides subadvisory services for the MML Focused Equity Fund, a series of MML Series Investment Fund, a registered, open-end investment company for which MML Advisers serves as investment adviser.
American Century and Systematic both act as subadvisers for the Mid-Cap Value Fund. American Century is wholly-owned by American Century Companies, Inc. (“ACC”). The Stowers Institute for Medical Research (“SIMR”) controls ACC by virtue of its beneficial ownership of more than 25% of the voting securities of ACC. SIMR is a part of a not-for-profit biomedical research organization dedicated to finding the keys to the causes, treatments, and prevention of disease.
Systematic was founded in 1982, as a registered investment adviser with the SEC pursuant to the Advisers Act, specializing in the management of value portfolios. In 1995, a majority stake in the firm was sold to Affiliated Managers Group, Inc. (“AMG”), a publicly traded company that invests in mid-sized asset management firms. The firm was subsequently re-registered with the SEC as Systematic, a Delaware limited partnership, on April 10, 1995. AMG holds a majority interest in Systematic through AMG’s wholly-owned subsidiary, Titan NJLP Holdings LLC, with the remaining equity spread between 11 active senior members of Systematic. Systematic operates independently as a separate, autonomous affiliate of AMG. Systematic’s Managing Partners retain complete control of the investment philosophy and process, as well as comprehensive management of the firm.
Sands Capital and Jackson Square both act as subadvisers for the Growth Opportunities Fund. Jackson Square, a limited liability company organized under the laws of Delaware, is jointly owned by California Street Partners, LLC, which is beneficially owned by its portfolio management team and other employees of Jackson Square, and Delaware Investments Advisers Partner, Inc. (“Delaware”). Delaware is an indirect subsidiary of Macquarie Group Limited (“Macquarie”). Macquarie is traded on the Australian Stock Exchange (ASX: MQG) and regulated by the Australian Prudential Regulation Authority, the Australian banking regulator. Investments in the Growth Opportunities Fund are not and will not be deposits with or liabilities of Macquarie Bank Limited ABN 46 008 583 542 and its holding companies, including their subsidiaries or related companies (the “Macquarie Group”), and will be subject to investment risk, including possible delays in repayment and loss of income and capital invested. No Macquarie Group company, Jackson Square, or Delaware guarantees or will guarantee the performance of the Growth Opportunities Fund, the repayment of capital from the Fund, or any particular rate of return.
Frontier and T. Rowe Price both act as subadvisers for the Mid Cap Growth Equity II Fund.
T. Rowe Price also provides subadvisory services for the MML Equity Income Fund, MML Blue Chip Growth Fund, MML Mid Cap Growth Fund, and MML Small Company Value Fund, each of which are series of MML Series Investment Fund, a registered, open-end investment company for which MML Advisers serves as investment adviser.
B-98
Federated Clover, T. Rowe Price, and Invesco each act as subadvisers for the Small Company Value Fund. Federated Clover is a division of Federated Global Investment Management Corp. Federated Advisory Services Company, an affiliate of Federated Clover, provides research, quantitative analysis, equity trading, and transaction settlement and certain support services to Federated Clover as contemplated in Federated Clover’s Investment Subadvisory Agreement with MML Advisers on behalf of the Fund. The fee for these services is paid by Federated Clover and not by MML Advisers or the Fund. Invesco is an indirect wholly-owned subsidiary of Invesco Ltd., a publicly traded company that, through its subsidiaries, engages in the business of investment management on an international basis.
J.P. Morgan, Harris, and MFS each act as subadvisers for the Overseas Fund. MFS is a subsidiary of Sun Life of Canada (U.S.) Financial Services Holdings, Inc., which in turn is an indirect majority-owned subsidiary of Sun Life Financial Inc. (a diversified financial services company). MFS also provides subadvisory services for the MML Global Fund and MML Growth & Income Fund, each of which are series of MML Series Investment Fund, a registered, open-end investment company for which MML Advisers serves as investment adviser.
Affiliated Subadviser
MML Advisers has entered into a Subadvisory Agreement with OFI Global, a wholly-owned subsidiary of OppenheimerFunds, Inc., a wholly-owned subsidiary of Oppenheimer Acquisition Corp., itself an indirect majority-owned subsidiary of MassMutual Holding LLC, on behalf of the Small Cap Growth Equity Fund. This agreement provides that OFI Global manage the investment and reinvestment of the assets of the Small Cap Growth Equity Fund. OFI Global receives a subadvisory fee from MML Advisers, based upon the Small Cap Growth Equity Fund’s average daily net assets, at the following annual rate:
Small Cap Growth Equity Fund | 0.55% of the first $50 million; | |
| 0.45% of the next $50 million; and | ||
| 0.40% of any excess over $100 million |
The Funds’ subadvisory fees are paid by MML Advisers out of the Advisory Fees previously disclosed above.
Information about each portfolio manager’s compensation, other accounts managed by the portfolio managers, and each portfolio manager’s ownership of securities in the relevant Fund can be found in Appendix C.
Organization and Management of the Select Cayman Fund
The BlackRock Global Allocation Fund may gain exposure to certain commodities-related investments by investing up to 25% of its total assets in the Select Cayman Fund. The Select Cayman Fund expects to invest primarily in commodities-related investments.
The Select Cayman Fund is a company organized under the laws of the Cayman Islands, whose registered office is located in the Cayman Islands. The Select Cayman Fund’s affairs are overseen by its own board of directors. BlackRock serves as investment adviser to the Select Cayman Fund. State Street provides administrative services to the Select Cayman Fund. The Select Cayman Fund has also entered into separate contracts for the provision of custody, transfer agency, and audit services with the same or with affiliates of the same service providers that provide those services to the BlackRock Global Allocation Fund.
Administrator, Sub-Administrators, and Shareholder Servicing Agent
MML Advisers has entered into an administrative and shareholder services agreement (the “Administrative and Shareholder Services Agreement”) with the Trust, on behalf of each Fund, pursuant to which MML Advisers is obligated to provide certain administrative and shareholder services. MML Advisers may, at its expense,
B-99
employ others to supply all or any part of the services to be provided to the Funds pursuant to the Administrative and Shareholder Services Agreement. MML Advisers has entered into sub-administration agreements with both State Street and MassMutual pursuant to which State Street and MassMutual each assist in many aspects of fund administration. Pursuant to a letter agreement between the Trust, MML Advisers, and State Street, the Trust has agreed to pay State Street for the services it provides pursuant to the sub-administration agreement with MML Advisers, although MML Advisers remains ultimately responsible for the payment of any such fees owed to State Street. MassMutual served as the Funds’ administrator pursuant to administrative and shareholder services agreements with each Fund prior to April 1, 2014 and paid State Street for the services it provides from the fees MassMutual received prior to that date. The Trust, on behalf of each Fund, pays MML Advisers an administrative services fee monthly at an annual rate based upon the average daily net assets of the applicable class of shares of each Fund as shown in the table below:
Fund | Class I | Class R5 | Service Class | Administrative Class | Class A | Class R4 | Class R3 | |||||||||||||||||||||
Total Return Bond Fund | None | 0.10 | % | 0.15 | % | 0.15 | % | 0.15 | % | 0.20 | % | 0.20 | % | |||||||||||||||
Strategic Bond Fund | None | 0.10 | % | 0.15 | % | 0.15 | % | 0.15 | % | 0.20 | % | 0.20 | % | |||||||||||||||
BlackRock Global Allocation Fund | None | 0.10 | % | 0.15 | % | 0.15 | % | 0.15 | % | 0.20 | % | 0.20 | % | |||||||||||||||
Diversified Value Fund | None | 0.10 | % | 0.15 | % | 0.15 | % | 0.15 | % | 0.20 | % | 0.20 | % | |||||||||||||||
Fundamental Value Fund | None | 0.10 | % | 0.15 | % | 0.15 | % | 0.15 | % | 0.20 | % | 0.20 | % | |||||||||||||||
Large Cap Value Fund | None | 0.10 | % | 0.15 | % | 0.15 | % | 0.15 | % | 0.20 | % | 0.20 | % | |||||||||||||||
S&P 500 Index Fund | None | 0.10 | % | 0.20 | % | 0.20 | % | 0.20 | % | 0.25 | % | 0.25 | % | |||||||||||||||
Focused Value Fund | None | 0.10 | % | 0.15 | % | 0.15 | % | 0.15 | % | 0.20 | % | 0.20 | % | |||||||||||||||
Fundamental Growth Fund | None | 0.10 | % | 0.15 | % | 0.15 | % | 0.15 | % | 0.20 | % | 0.20 | % | |||||||||||||||
Blue Chip Growth Fund | None | 0.10 | % | 0.15 | % | 0.15 | % | 0.15 | % | 0.20 | % | 0.20 | % | |||||||||||||||
Growth Opportunities Fund | None | 0.10 | % | 0.15 | % | 0.15 | % | 0.15 | % | 0.20 | % | 0.20 | % | |||||||||||||||
Mid-Cap Value Fund | None | 0.10 | % | 0.15 | % | 0.15 | % | 0.15 | % | 0.20 | % | 0.20 | % | |||||||||||||||
Small Cap Value Equity Fund | None | 0.10 | % | 0.15 | % | 0.15 | % | 0.15 | % | 0.20 | % | 0.20 | % | |||||||||||||||
Small Company Value Fund | None | 0.10 | % | 0.15 | % | 0.15 | % | 0.15 | % | 0.20 | % | 0.20 | % | |||||||||||||||
S&P Mid Cap Index Fund | None | 0.10 | % | 0.20 | % | 0.20 | % | 0.20 | % | 0.25 | % | 0.25 | % | |||||||||||||||
Russell 2000 Small Cap Index Fund | None | 0.10 | % | 0.20 | % | 0.20 | % | 0.20 | % | 0.25 | % | 0.25 | % | |||||||||||||||
Mid Cap Growth Equity II Fund | None | 0.10 | % | 0.15 | % | 0.15 | % | 0.15 | % | 0.20 | % | 0.20 | % | |||||||||||||||
Small Cap Growth Equity Fund | None | 0.10 | % | 0.15 | % | 0.15 | % | 0.15 | % | 0.20 | % | 0.20 | % | |||||||||||||||
Diversified International Fund | None | 0.10 | % | 0.15 | % | 0.15 | % | 0.15 | % | 0.20 | % | 0.20 | % | |||||||||||||||
MSCI EAFE International Index Fund | None | 0.10 | % | 0.20 | % | 0.20 | % | 0.20 | % | 0.25 | % | 0.25 | % | |||||||||||||||
Overseas Fund | None | 0.10 | % | 0.15 | % | 0.15 | % | 0.15 | % | 0.20 | % | 0.20 | % | |||||||||||||||
Effective April 1, 2014, the Trust entered into a separate Supplemental Shareholder Services Agreement with MassMutual, on behalf of Service Class shares, Administrative Class shares, and Class A shares of each Fund. Fees payable under the Supplemental Shareholder Services Agreement are intended to compensate MassMutual for its provision of shareholder services to the Funds’ investors and are calculated and paid based on the average daily net assets attributable to the relevant share classes of the Funds separately, at the following annual rates: .05% for Service Class shares, and ..15% for Administrative Class shares and Class A shares. MassMutual may pay these fees to other intermediaries for providing shareholder services to the Funds’ investors.
Pursuant to the Advisory Agreements, Subadvisory Agreements, Administrative and Shareholder Services Agreement, and Supplemental Shareholder Services Agreement described above, for the fiscal years ended September 30, 2016, September 30, 2015, and December 31, 2014, the amount of Advisory fees paid by each Fund, the amount of Subadvisory fees paid by each Fund, the amount of any Advisory fees waived by MML Advisers and/or MassMutual, the amount of Administrative fees paid by each Fund, the amount of any Administrative fees waived by MML Advisers and/or MassMutual, the amount of Shareholder Services fees paid
B-100
by each Fund pursuant to the Supplemental Shareholder Services Agreement, and the amount of any fees reimbursed by MML Advisers and/or MassMutual are as follows:
| Fiscal Year Ended September 30, 2016 | ||||||||||||||||||||||||
| Advisory Fees Paid | Subadvisory Fees Paid | Advisory Fees Waived | Administrative Fees Paid | Shareholder Services Fees Paid | Other Expenses Reimbursed | |||||||||||||||||||
Total Return Bond Fund1 | $ | 4,035,427 | $ | 1,511,053 | $ | (426,507 | ) | $ | 1,299,513 | $ | 236,980 | $ | — | |||||||||||
Strategic Bond Fund2 | 1,237,121 | 566,969 | — | 309,498 | 148,276 | (189,164 | ) | |||||||||||||||||
BlackRock Global Allocation Fund3 | 4,539,941 | 3,277,123 | — | 91,073 | 34,277 | (1,032,002 | ) | |||||||||||||||||
Diversified Value Fund | 1,723,434 | 754,053 | — | 198,742 | 45,152 | — | ||||||||||||||||||
Fundamental Value Fund | 7,700,729 | 3,693,260 | — | 1,028,819 | 477,004 | — | ||||||||||||||||||
Large Cap Value Fund4 | 1,312,013 | 665,399 | — | 177,744 | 68,731 | (155,760 | ) | |||||||||||||||||
S&P 500 Index Fund | 3,387,567 | 289,224 | — | 4,744,307 | 1,074,278 | — | ||||||||||||||||||
Focused Value Fund | 5,533,920 | 3,304,505 | — | 745,882 | 435,967 | — | ||||||||||||||||||
Fundamental Growth Fund5 | 878,126 | 475,076 | — | 75,569 | 45,189 | (162,596 | ) | |||||||||||||||||
Blue Chip Growth Fund | 9,410,741 | 5,041,119 | — | 1,438,320 | 705,171 | — | ||||||||||||||||||
Growth Opportunities Fund | 6,604,638 | 4,248,387 | — | 793,706 | 418,024 | — | ||||||||||||||||||
Mid-Cap Value Fund6 | 767,178 | 444,600 | — | 14,519 | 4,915 | (149,942 | ) | |||||||||||||||||
Small Cap Value Equity Fund6 | 1,366,730 | 870,970 | — | 99,173 | 20,869 | (122,974 | ) | |||||||||||||||||
Small Company Value Fund7 | 2,507,068 | 1,580,881 | (58,990 | ) | 200,734 | 76,256 | — | |||||||||||||||||
S&P Mid Cap Index Fund8 | 321,185 | 113,712 | — | 359,098 | 152,498 | — | ||||||||||||||||||
Russell 2000 Small Cap Index Fund8 | 289,365 | 114,385 | — | 222,385 | 85,888 | (24,991 | ) | |||||||||||||||||
Mid Cap Growth Equity II Fund | 20,646,508 | 13,376,771 | — | 2,172,412 | 1,103,230 | — | ||||||||||||||||||
Small Cap Growth Equity Fund | 4,020,836 | 2,710,353 | 9 | — | 308,245 | 127,573 | — | |||||||||||||||||
Diversified International Fund10 | 583,272 | 299,344 | — | 2,857 | 846 | (216,628 | ) | |||||||||||||||||
MSCI EAFE International Index Fund11 | 427,608 | 272,004 | — | 249,521 | 87,936 | — | ||||||||||||||||||
Overseas Fund | 5,223,224 | 3,042,728 | — | 417,739 | 179,800 | — | ||||||||||||||||||
| 1 | The expenses in the above table reflect a written agreement by MML Advisers to waive 0.05% of the Advisory fees of the Fund through May 31, 2016. |
| 2 | The expenses in the above table reflect a written agreement by MML Advisers to cap the fees and expenses of the Fund (other than extraordinary litigation and legal expenses, Acquired Fund fees and expenses, interest expense, short sale dividend and loan expense, or other non-recurring or unusual expenses such as organizational expenses and shareholder meeting expenses) through September 30, 2016, to the extent that Total Annual Fund Operating Expenses after Expense Reimbursement would otherwise exceed 0.48%, 0.58%, 0.68%, 0.78%, 1.03%, 0.93%, and 1.18% for Classes I, R5, Service, Administrative, A, R4, and R3, respectively. |
| 3 | The expenses in the above table reflect a written agreement by MML Advisers to cap the fees and expenses of the Fund (other than extraordinary litigation and legal expenses, interest expense, short sale dividend and loan expense, Acquired Fund fees and expenses, or other non-recurring or unusual expenses such as organizational expenses and shareholder meeting expenses) through September 30, 2016, to the extent that Total Annual Fund Operating Expenses after Expense Reimbursement would otherwise exceed 0.79%, 0.89%, 0.99%, 1.09%, 1.34%, 1.24%, and 1.49% for Classes I, R5, Service, Administrative, A, R4, and R3, respectively. Advisory fees paid by the fund do not include the $79,551 paid by the Select Cayman Fund to BlackRock for advisory fee services. |
| 4 | The expenses in the above table reflect a written agreement by MML Advisers to cap the fees and expenses of the Fund (other than extraordinary litigation and legal expenses, Acquired Fund fees and expenses, interest expense, short sale dividend and loan expense, or other non-recurring or unusual expenses such as organizational expenses and shareholder meeting expenses) through September 30, 2016, to the extent that |
B-101
| Total Annual Fund Operating Expenses after Expense Reimbursement would otherwise exceed 0.63%, 0.73%, 0.83%, 0.93%, 1.18%, 1.08%, and 1.33% for Classes I, R5, Service, Administrative, A, R4, and R3, respectively. |
| 5 | The expenses in the above table reflect a written agreement by MML Advisers to cap the fees and expenses of the Fund (other than extraordinary litigation and legal expenses, Acquired Fund fees and expenses, interest expense, short sale dividend and loan expense, or other non-recurring or unusual expenses such as organizational expenses and shareholder meeting expenses) through September 30, 2016, to the extent that Total Annual Fund Operating Expenses after Expense Reimbursement would otherwise exceed 0.70%, 0.80%, 0.90%, 1.00%, 1.25%, 1.15%, and 1.40% for Classes I, R5, Service, Administrative, A, R4, and R3, respectively. |
| 6 | The expenses in the above table reflect a written agreement by MML Advisers to cap the fees and expenses of the Fund (other than extraordinary litigation and legal expenses, Acquired Fund fees and expenses, interest expense, short sale dividend and loan expense, or other non-recurring or unusual expenses such as organizational expenses and shareholder meeting expenses) through September 30, 2016, to the extent that Total Annual Fund Operating Expenses after Expense Reimbursement would otherwise exceed 0.80%, 0.90%, 1.00%, 1.10%, 1.35%, 1.25%, and 1.50% for Classes I, R5, Service, Administrative, A, R4, and R3, respectively. |
| 7 | The expenses in the above table reflect a written agreement by MML Advisers to waive 0.02% of the Advisory fees of the Fund. MML Advisers may amend or discontinue this waiver at any time without advance notice |
| 8 | The expenses in the above table reflect a written agreement by MML Advisers to cap the fees and expenses of the Fund (other than extraordinary litigation and legal expenses, Acquired Fund fees and expenses, interest expense, short sale dividend and loan expense, or other non-recurring or unusual expenses such as organizational expenses and shareholder meeting expenses) through September 30, 2016, to the extent that Total Annual Fund Operating Expenses after Expense Reimbursement would otherwise exceed 0.20%, 0.30%, 0.45%, 0.55%, 0.80%, 0.70%, and 0.95% for Classes I, R5, Service, Administrative, A, R4, and R3, respectively. |
| 9 | $839,764 paid to OFI Global and $1,870,589 paid to Wellington Management. |
| 10 | The expenses in the above table reflect a written agreement by MML Advisers to cap the fees and expenses of the Fund (other than extraordinary litigation and legal expenses, Acquired Fund fees and expenses, interest expense, short sale dividend and loan expense, or other non-recurring or unusual expenses such as organizational expenses and shareholder meeting expenses) through September 30, 2016, to the extent that Total Annual Fund Operating Expenses after Expense Reimbursement would otherwise exceed 0.90%, 1.00%, 1.10%, 1.20%, 1.45%, 1.35%, and 1.60% for Classes I, R5, Service, Administrative, A, R4, and R3, respectively. |
| 11 | The expenses in the above table reflect a written agreement by MML Advisers to cap the fees and expenses of the Fund (other than extraordinary litigation and legal expenses, Acquired Fund fees and expenses, interest expense, short sale dividend and loan expense, or other non-recurring or unusual expenses such as organizational expenses and shareholder meeting expenses) through September 30, 2016, to the extent that Total Annual Fund Operating Expenses after Expense Reimbursement would otherwise exceed 0.25%, 0.35%, 0.50%, 0.60%, 0.85%, 0.75%, and 1.00% for Classes I, R5, Service, Administrative, A, R4, and R3, respectively. |
| Fiscal Year Ended September 30, 2015 | ||||||||||||||||||||||||
| Advisory Fees Paid | Subadvisory Fees Paid | Advisory Fees Waived | Administrative Fees Paid | Shareholder Services Fees Paid | Other Expenses Reimbursed | |||||||||||||||||||
Total Return Bond Fund1 | $ | 3,703,402 | $ | 1,292,579 | $ | (529,057 | ) | $ | 1,110,107 | $ | 196,883 | $ | — | |||||||||||
Strategic Bond Fund2 | 815,715 | 379,752 | — | 197,252 | 103,734 | (204,751 | ) | |||||||||||||||||
BlackRock Global Allocation Fund3 | 3,937,811 | 2,743,113 | — | 56,589 | 34,323 | (853,635 | ) | |||||||||||||||||
Diversified Value Fund | 1,404,564 | 613,245 | — | 225,824 | 41,717 | — | ||||||||||||||||||
B-102
| Fiscal Year Ended September 30, 2015 | ||||||||||||||||||||||||
| Advisory Fees Paid | Subadvisory Fees Paid | Advisory Fees Waived | Administrative Fees Paid | Shareholder Services Fees Paid | Other Expenses Reimbursed | |||||||||||||||||||
Fundamental Value Fund | $ | 6,433,016 | $ | 3,067,856 | $ | — | $ | 932,155 | $ | 421,312 | $ | — | ||||||||||||
Large Cap Value Fund4 | 1,647,608 | 814,426 | — | 200,226 | 76,208 | (117,200 | ) | |||||||||||||||||
S&P 500 Index Fund | 2,498,865 | 212,309 | — | 3,716,968 | 892,942 | — | ||||||||||||||||||
Focused Value Fund | 4,928,827 | 2,905,497 | — | 692,733 | 401,287 | — | ||||||||||||||||||
Fundamental Growth Fund5 | 727,780 | 421,852 | — | 59,510 | 38,698 | (122,174 | ) | |||||||||||||||||
Blue Chip Growth Fund | 6,962,700 | 3,749,278 | — | 1,120,629 | 546,183 | — | ||||||||||||||||||
Growth Opportunities Fund | 5,704,269 | 3,670,741 | — | 706,551 | 396,335 | — | ||||||||||||||||||
Mid-Cap Value Fund6 | 895,935 | 522,655 | — | 22,992 | 7,090 | (54,401 | ) | |||||||||||||||||
Small Cap Value Equity Fund6 | 1,018,837 | 651,007 | — | 91,467 | 14,496 | (95,632 | ) | |||||||||||||||||
Small Company Value Fund7 | 2,540,520 | 1,579,373 | (57,162 | ) | 233,479 | 78,956 | — | |||||||||||||||||
S&P Mid Cap Index Fund8 | 205,431 | 74,745 | — | 177,078 | 99,230 | (39,542 | ) | |||||||||||||||||
Russell 2000 Small Cap Index Fund8 | 140,724 | 63,130 | — | 100,258 | 55,245 | (123,728 | ) | |||||||||||||||||
Mid Cap Growth Equity II Fund | 12,100,932 | 7,718,142 | — | 1,598,085 | 895,944 | — | ||||||||||||||||||
Small Cap Growth Equity Fund | 5,361,392 | 3,780,629 | 9 | — | 296,344 | 114,022 | — | |||||||||||||||||
Diversified International Fund10 | 530,023 | 269,926 | — | 14,509 | 755 | (189,789 | ) | |||||||||||||||||
MSCI EAFE International Index Fund11 | 247,278 | 160,147 | — | 105,294 | 54,660 | (91,076 | ) | |||||||||||||||||
Overseas Fund | 4,295,424 | 2,491,731 | — | 346,514 | 146,418 | — | ||||||||||||||||||
| 1 | The expenses in the above table reflect a written agreement by MML Advisers to waive 0.05% of the Advisory fees of the Fund through September 30, 2015. |
| 2 | The expenses in the above table reflect a written agreement by MML Advisers to cap the fees and expenses of the Fund (other than extraordinary litigation and legal expenses, Acquired Fund fees and expenses, interest expense, short sale dividend and loan expense, or other non-recurring or unusual expenses such as organizational expenses and shareholder meeting expenses) through September 30, 2015, to the extent that Total Annual Fund Operating Expenses after Expense Reimbursement would otherwise exceed 0.48%, 0.58%, 0.68%, 0.78%, 1.03%, 0.93%, and 1.18% for Classes I, R5, Service, Administrative, A, R4, and R3, respectively. |
| 3 | The expenses in the above table reflect a written agreement by MML Advisers to cap the fees and expenses of the Fund (other than extraordinary litigation and legal expenses, interest expense, short sale dividend and loan expense, Acquired Fund fees and expenses, or other non-recurring or unusual expenses such as organizational expenses and shareholder meeting expenses) through September 30, 2015, to the extent that Total Annual Fund Operating Expenses after Expense Reimbursement would otherwise exceed 0.79%, 0.89%, 0.99%, 1.09%, 1.34%, 1.24%, and 1.49% for Classes I, R5, Service, Administrative, A, R4, and R3, respectively. Advisory fees paid by the fund do not include the $29,329 paid by the Select Cayman Fund to BlackRock for advisory fee services. |
| 4 | The expenses in the above table reflect a written agreement by MML Advisers to cap the fees and expenses of the Fund (other than extraordinary litigation and legal expenses, Acquired Fund fees and expenses, interest expense, short sale dividend and loan expense, or other non-recurring or unusual expenses such as organizational expenses and shareholder meeting expenses) through September 30, 2015, to the extent that Total Annual Fund Operating Expenses after Expense Reimbursement would otherwise exceed 0.63%, 0.73%, 0.83%, 0.93%, 1.18%, 1.08%, and 1.33% for Classes I, R5, Service, Administrative, A, R4, and R3, respectively. |
| 5 | The expenses in the above table reflect a written agreement by MML Advisers to cap the fees and expenses of the Fund (other than extraordinary litigation and legal expenses, Acquired Fund fees and expenses, interest expense, short sale dividend and loan expense, or other non-recurring or unusual expenses such as organizational expenses and shareholder meeting expenses) through September 30, 2015, to the extent that Total Annual Fund Operating Expenses after Expense Reimbursement would otherwise exceed 0.70%, |
B-103
| 0.80%, 0.90%, 1.00%, 1.25%, 1.15%, and 1.40% for Classes I, R5, Service, Administrative, A, R4, and R3, respectively. |
| 6 | The expenses in the above table reflect a written agreement by MML Advisers to cap the fees and expenses of the Fund (other than extraordinary litigation and legal expenses, Acquired Fund fees and expenses, interest expense, short sale dividend and loan expense, or other non-recurring or unusual expenses such as organizational expenses and shareholder meeting expenses) through September 30, 2015, to the extent that Total Annual Fund Operating Expenses after Expense Reimbursement would otherwise exceed 0.80%, 0.90%, 1.00%, 1.10%, 1.35%, 1.25%, and 1.50% for Classes I, R5, Service, Administrative, A, R4, and R3, respectively. |
| 7 | Effective January 12, 2015, MML Advisers agreed to voluntarily waive 0.02% of the advisory fee for each class of the Fund. MML Advisers may amend or discontinue this waiver at any time without advance notice. |
| 8 | The expenses in the above table reflect a written agreement by MML Advisers to cap the fees and expenses of the Fund (other than extraordinary litigation and legal expenses, Acquired Fund fees and expenses, interest expense, short sale dividend and loan expense, or other non-recurring or unusual expenses such as organizational expenses and shareholder meeting expenses) through September 30, 2015, to the extent that Total Annual Fund Operating Expenses after Expense Reimbursement would otherwise exceed 0.20%, 0.30%, 0.45%, 0.55%, 0.80%, 0.70%, and 0.95% for Classes I, R5, Service, Administrative, A, R4, and R3, respectively. |
| 9 | $216,677 paid to OFI Global, $2,275,819 paid to Wellington Management, $532,630 paid to Montibus Capital Management LLC who was replaced by OFI Global as subadviser on July 7, 2015 and $755,503 to Waddell & Reed Investment Management Company who was removed as subadviser on September 30, 2015. |
| 10 | The expenses in the above table reflect a written agreement by MML Advisers to cap the fees and expenses of the Fund (other than extraordinary litigation and legal expenses, Acquired Fund fees and expenses, interest expense, short sale dividend and loan expense, or other non-recurring or unusual expenses such as organizational expenses and shareholder meeting expenses) through September 30, 2015, to the extent that Total Annual Fund Operating Expenses after Expense Reimbursement would otherwise exceed 0.90%, 1.00%, 1.10%, 1.20%, 1.45%, 1.35%, and 1.60% for Classes I, R5, Service, Administrative, A, R4, and R3, respectively. |
| 11 | The expenses in the above table reflect a written agreement by MML Advisers to cap the fees and expenses of the Fund (other than extraordinary litigation and legal expenses, Acquired Fund fees and expenses, interest expense, short sale dividend and loan expense, or other non-recurring or unusual expenses such as organizational expenses and shareholder meeting expenses) through September 30, 2015, to the extent that Total Annual Fund Operating Expenses after Expense Reimbursement would otherwise exceed 0.25%, 0.35%, 0.50%, 0.60%, 0.85%, 0.75%, and 1.00% for Classes I, R5, Service, Administrative, A, R4, and R3, respectively. |
| Fiscal Year Ended December 31, 2014 | ||||||||||||||||||||||||||||
| Advisory Fees Paid | Subadvisory Fees Paid | Advisory Fees Waived | Administrative Fees Paid | Administrative Fees Waived | Shareholder Services Fees Paid | Other Expenses Reimbursed | ||||||||||||||||||||||
Total Return Bond Fund1 | $ | 5,588,880 | $ | 3,651,986 | $ | (136,013 | ) | $ | 2,244,143 | $ | - | $ | 256,999 | $ | - | |||||||||||||
Strategic Bond Fund2 | 854,163 | 401,267 | - | 251,125 | - | 71,229 | (163,303 | ) | ||||||||||||||||||||
BlackRock Global Allocation Fund3 | 5,246,479 | 3,620,478 | - | 465,160 | - | 36,080 | (990,709 | ) | ||||||||||||||||||||
Diversified Value Fund | 1,864,609 | 804,643 | - | 347,375 | - | 41,938 | - | |||||||||||||||||||||
Fundamental Value Fund4 | 9,120,882 | 4,253,694 | (518,228 | ) | 2,197,490 | - | 509,882 | - | ||||||||||||||||||||
Large Cap Value Fund5 | 2,718,927 | 1,329,783 | (22,762 | ) | 497,584 | - | 105,561 | (49,019 | ) | |||||||||||||||||||
S&P 500 Index Fund6 | 3,115,059 | 262,241 | (383,317 | ) | 5,798,161 | - | 860,365 | (168,728 | ) | |||||||||||||||||||
Focused Value Fund7 | 6,299,199 | 3,727,425 | (215,217 | ) | 1,339,838 | - | 402,990 | - | ||||||||||||||||||||
Fundamental Growth Fund8 | 902,285 | 541,323 | - | 165,890 | (22,559 | ) | 42,335 | (53,173 | ) | |||||||||||||||||||
B-104
| Fiscal Year Ended December 31, 2014 | ||||||||||||||||||||||||||||
| Advisory Fees Paid | Subadvisory Fees Paid | Advisory Fees Waived | Administrative Fees Paid | Administrative Fees Waived | Shareholder Services Fees Paid | Other Expenses Reimbursed | ||||||||||||||||||||||
Blue Chip Growth Fund9 | $ | 8,066,602 | $ | 4,290,255 | $ | - | $ | 1,719,786 | $ | - | $ | 539,659 | $ | (14,582 | ) | |||||||||||||
Growth Opportunities Fund4 | 6,841,782 | 4,360,217 | (338,705 | ) | 1,476,214 | - | 402,726 | - | ||||||||||||||||||||
Mid-Cap Value Fund10 | 1,103,135 | 643,962 | - | 133,370 | (13,273 | ) | 10,112 | (185 | ) | |||||||||||||||||||
Small Cap Value Equity Fund11 | 1,159,542 | 745,934 | - | 145,177 | - | 12,487 | (37,269 | ) | ||||||||||||||||||||
Small Company Value Fund12 | 4,046,459 | 2,719,930 | (99,776 | ) | 645,170 | - | 105,013 | - | ||||||||||||||||||||
S&P Mid Cap Index Fund13 | 185,439 | 73,863 | - | 193,393 | - | 68,172 | (7,981 | ) | ||||||||||||||||||||
Russell 2000 Small Cap Index Fund13 | 129,385 | 67,531 | - | 149,589 | - | 39,987 | (94,627 | ) | ||||||||||||||||||||
Mid Cap Growth Equity II Fund7 | 14,048,259 | 8,818,117 | (469,771 | ) | 2,898,189 | - | 880,643 | - | ||||||||||||||||||||
Small Cap Growth Equity Fund14 | 7,257,358 | 5,146,644 | (171,410 | ) | 921,992 | - | 121,159 | - | ||||||||||||||||||||
Diversified International Fund15 | 1,403,413 | 691,714 | - | 148,070 | - | 757 | (101,088 | ) | ||||||||||||||||||||
MSCI EAFE International Index Fund16 | 230,483 | 156,317 | - | 125,468 | - | 24,161 | (21,774 | ) | ||||||||||||||||||||
Overseas Fund17 | 5,413,603 | 2,990,183 | (473,230 | ) | 777,847 | - | 133,856 | - | ||||||||||||||||||||
| 1 | Effective October 27, 2014, the expenses in the above table reflect a written agreement by MML Advisers to waive 0.05% of the Advisory fees of the Fund through December 31, 2014. |
| 2 | Effective April 1, 2014, the expenses in the above table reflect a written agreement by MML Advisers to cap the fees and expenses of the Fund (other than extraordinary litigation and legal expenses, Acquired Fund fees and expenses, interest expense, short sale dividend and loan expense, or other non-recurring or unusual expenses such as organizational expenses and shareholder meeting expenses) through December 31, 2014, to the extent that Total Annual Fund Operating Expenses after Expense Reimbursement would otherwise exceed 0.48%, 0.58%, 0.68%, 0.78%, 1.03%, 0.93%, and 1.18% for Classes I, R5, Service, Administrative, A, R4, and R3, respectively. |
| 3 | Effective April 1, 2014, the expenses in the above table reflect a written agreement by MML Advisers to cap the fees and expenses of the Fund (other than extraordinary litigation and legal expenses, interest expense, short sale dividend and loan expense, Acquired Fund fees and expenses, or other non-recurring or unusual expenses such as organizational expenses and shareholder meeting expenses) through December 31, 2014, to the extent that Total Annual Fund Operating Expenses after Expense Reimbursement would otherwise exceed 0.79%, 0.89%, 0.99%, 1.09%, 1.34%, 1.24%, and 1.49% for Classes I, R5, Service, Administrative, A, R4, and R3, respectively. MassMutual agreed to cap the fees and expenses of the Fund (other than extraordinary litigation and legal expenses, interest expense, short sale dividend and loan expense, Acquired Fund fees and expenses, or other non-recurring or unusual expenses such as organizational expenses and shareholder meeting expenses) to the extent that Total Annual Fund Operating Expenses after Expense Reimbursement would otherwise exceed 0.86%, 0.96%, 1.11%, and 1.36% for Classes R5, Service, Administrative, and A, respectively through March 31, 2014. Advisory fees paid by the fund do not include the $45,279 paid by the Select Cayman Fund to BlackRock for advisory fee services. The Administrative fees paid by the Fund reflect a reduction of certain asset-based expenses with respect to those assets held by the Select Cayman Fund. |
| 4 | The expenses in the above table reflect a written agreement by MassMutual to waive 0.15% of the Advisory fees of the Fund through March 31, 2014. |
B-105
| 5 | Effective April 1, 2014, the expenses in the above table reflect a written agreement by MML Advisers to cap the fees and expenses of the Fund (other than extraordinary litigation and legal expenses, Acquired Fund fees and expenses, interest expense, short sale dividend and loan expense, or other non-recurring or unusual expenses such as organizational expenses and shareholder meeting expenses) through December 31, 2014, to the extent that Total Annual Fund Operating Expenses after Expense Reimbursement would otherwise exceed 0.63%, 0.73%, 0.83%, 0.93%, 1.18%, 1.08%, and 1.33% for Classes I, R5, Service, Administrative, A, R4, and R3, respectively. The expenses in the above table reflect a written agreement by MassMutual to waive 0.02% of the Advisory fees of the Fund through March 31, 2014. |
| 6 | The expenses in the above table reflect a written agreement by MassMutual to waive 0.05% of the Advisory fees of the Fund through March 31, 2014. The expenses in the above table reflect a written agreement by MassMutual to cap the fees and expenses of the Fund (other than extraordinary litigation and legal expenses, Acquired Fund fees and expenses, interest expense, short sale dividend and loan expense, or other non-recurring or unusual expenses such as organizational expenses and shareholder meeting expenses) to the extent that Total Annual Fund Operating Expenses after Expense Reimbursement would otherwise exceed 0.08%, 0.65%, and 0.95% for Classes I, R4, and R3, respectively through March 31, 2014. |
| 7 | The expenses in the above table reflect a written agreement by MassMutual to waive 0.10% of the Advisory fees of the Fund through March 31, 2014. |
| 8 | Effective April 1, 2014, the expenses in the above table reflect a written agreement by MML Advisers to cap the fees and expenses of the Fund (other than extraordinary litigation and legal expenses, Acquired Fund fees and expenses, interest expense, short sale dividend and loan expense, or other non-recurring or unusual expenses such as organizational expenses and shareholder meeting expenses) through December 31, 2014, to the extent that Total Annual Fund Operating Expenses after Expense Reimbursement would otherwise exceed 0.70%, 0.80%, 0.90%, 1.00%, 1.25%, 1.15%, and 1.40% for Classes I, R5, Service, Administrative, A, R4, and R3, respectively. The expenses in the above table reflect a written agreement by MassMutual to waive 0.09% of the Administrative fee for Class R5, and 0.03% of the Administrative fees for Classes Service, Administrative, A, and R3 through March 31, 2014. |
| 9 | The expenses in the above table reflect a written agreement by MassMutual to cap the fees and expenses of the Fund (other than extraordinary litigation and legal expenses, Acquired Fund fees and expenses, interest expense, short sale dividend and loan expense, or other non-recurring or unusual expenses such as organizational expenses and shareholder meeting expenses) to the extent that Total Annual Fund Operating Expenses after Expense Reimbursement would otherwise exceed 0.76%, 0.82%, 0.98%, 1.19%, and 1.51% for Classes R5, Service, Administrative, A, and R3, respectively through March 31, 2014. |
| 10 | Effective April 1, 2014, the expenses in the above table reflect a written agreement by MML Advisers to cap the fees and expenses of the Fund (other than extraordinary litigation and legal expenses, Acquired Fund fees and expenses, interest expense, short sale dividend and loan expense, or other non-recurring or unusual expenses such as organizational expenses and shareholder meeting expenses) through December 31, 2014, to the extent that Total Annual Fund Operating Expenses after Expense Reimbursement would otherwise exceed 0.80%, 0.90%, 1.00%, 1.10%, 1.35%, 1.25%, and 1.50% for Classes I, R5, Service, Administrative, A, R4, and R3, respectively. The expenses in the above table reflect a written agreement by MassMutual to: (i) waive 0.08% of the Administrative fee for Class I through March 31, 2014 and (ii) cap the fees and expenses of the Fund (other than extraordinary litigation and legal expenses, Acquired Fund fees and expenses, interest expense, short sale dividend and loan expense, or other non-recurring or unusual expenses such as organizational expenses and shareholder meeting expenses) through March 31, 2014, to the extent that Total Annual Fund Operating Expenses after Expense Reimbursement would otherwise exceed 0.85%, 0.95%, 1.10%, 1.35%, and 1.65% for Classes R5, Service, Administrative, A, and R3, respectively. |
| 11 | Effective April 1, 2014, the expenses in the above table reflect a written agreement by MML Advisers to cap the fees and expenses of the Fund (other than extraordinary litigation and legal expenses, Acquired Fund fees and expenses, interest expense, short sale dividend and loan expense, or other non-recurring or unusual expenses such as organizational expenses and shareholder meeting expenses) through December 31, 2014, to the extent that Total Annual Fund Operating Expenses after Expense |
B-106
| Reimbursement would otherwise exceed 0.80%, 0.90%, 1.00%, 1.10%, 1.35%, 1.25%, and 1.50% for Classes I, R5, Service, Administrative, A, R4, and R3, respectively. |
| 12 | The expenses in the above table reflect a written agreement by MassMutual to waive 0.08% of the Advisory fees of the Fund through March 31, 2014. |
| 13 | Effective April 1, 2014, the expenses in the above table reflect a written agreement by MML Advisers to cap the fees and expenses of the Fund (other than extraordinary litigation and legal expenses, Acquired Fund fees and expenses, interest expense, short sale dividend and loan expense, or other non-recurring or unusual expenses such as organizational expenses and shareholder meeting expenses) through December 31, 2014, to the extent that Total Annual Fund Operating Expenses after Expense Reimbursement would otherwise exceed 0.20%, 0.30%, 0.45%, 0.55%, 0.80%, 0.70%, and 0.95% for Classes I, R5, Service, Administrative, A, R4, and R3, respectively. MassMutual agreed to cap the fees and expenses of the Fund (other than extraordinary litigation and legal expenses, Acquired Fund fees and expenses, interest expense, short sale dividend and loan expense, or other non-recurring or unusual expenses such as organizational expenses and shareholder meeting expenses) to the extent that Total Annual Fund Operating Expenses after Expense Reimbursement would otherwise exceed 0.19%, 0.29%, 0.44%, 0.54%, and 0.84% for Classes I, R5, Service, Administrative, and A, respectively through March 31, 2014. |
| 14 | The expenses in the above table reflect a written agreement by MassMutual to waive 0.07% of the Advisory fees of the Fund through March 31, 2014. |
| 15 | Effective April 1, 2014, the expenses in the above table reflect a written agreement by MML Advisers to cap the fees and expenses of the Fund (other than extraordinary litigation and legal expenses, Acquired Fund fees and expenses, interest expense, short sale dividend and loan expense, or other non-recurring or unusual expenses such as organizational expenses and shareholder meeting expenses) through December 31, 2014, to the extent that Total Annual Fund Operating Expenses after Expense Reimbursement would otherwise exceed 0.90%, 1.00%, 1.10%, 1.20%, 1.45%, 1.35%, and 1.60% for Classes I, R5, Service, Administrative, A, R4, and R3, respectively. MassMutual agreed to cap the fees and expenses of the Fund (other than extraordinary litigation and legal expenses, Acquired Fund fees and expenses, interest expense, short sale dividend and loan expense, or other non-recurring or unusual expenses such as organizational expenses and shareholder meeting expenses) to the extent that Total Annual Fund Operating Expenses after Expense Reimbursement would otherwise exceed 0.99%, 1.09%, 1.17%, and 1.42% for Classes R5, Service, Administrative, and A, respectively through March 31, 2014. |
| 16 | Effective April 1, 2014, the expenses in the above table reflect a written agreement by MML Advisers to cap the fees and expenses of the Fund (other than extraordinary litigation and legal expenses, Acquired Fund fees and expenses, interest expense, short sale dividend and loan expense, or other non-recurring or unusual expenses such as organizational expenses and shareholder meeting expenses) through December 31, 2014, to the extent that Total Annual Fund Operating Expenses after Expense Reimbursement would otherwise exceed 0.25%, 0.35%, 0.50%, 0.60%, 0.85%, 0.75%, and 1.00% for Classes I, R5, Service, Administrative, A, R4, and R3, respectively. The expenses in the above table reflect a written agreement by MassMutual to cap the fees and expenses of the Fund (other than extraordinary litigation and legal expenses, Acquired Fund fees and expenses, interest expense, short sale dividend and loan expense, or other non-recurring or unusual expenses such as organizational expenses and shareholder meeting expenses) to the extent that Total Annual Fund Operating Expenses after Expense Reimbursement would otherwise exceed 0.23%, 0.33%, 0.48%, 0.58%, and 0.88% for Classes I, R5, Service, Administrative, and A, respectively through March 31, 2014. |
| 17 | The expenses in the above table reflect a written agreement by MassMutual to waive 0.31% of the Advisory fees of the Fund through March 31, 2014. |
B-107
The Funds’ shares are continuously distributed by MML Distributors, LLC (the “Distributor”), located at 100 Bright Meadow Blvd., Enfield, Connecticut 06082-1981, pursuant to a Principal Underwriter Agreement with the Trust dated as of February 6, 2006, as amended (the “Distribution Agreement”). The Distributor pays commissions to its selling dealers as well as the costs of printing and mailing prospectuses to potential investors and of any advertising incurred by it in connection with distribution of shares of the Funds. The Distributor is a wholly-owned subsidiary of MassMutual.
The Distributor has agreed to use reasonable efforts to sell shares of the Funds but has not agreed to sell any specific number of shares of the Funds. The Distributor’s compensation for serving as such is the amounts received by it from time to time under the Funds’ Amended and Restated Rule 12b-1 plan. In addition, the Distributor receives any front-end sales charges imposed on the sales of Class A shares of the Funds. There were no sales loads paid to the Distributor in respect of all of the Funds during the fiscal year ended September 30, 2016.
Shares of each Fund may be purchased through agents of the Distributor who are registered representatives and licensed by the Distributor to sell Fund shares, and through registered representatives of selected broker-dealers which are members of Financial Industry Regulatory Authority and which have entered into selling agreements with the Distributor. The Distributor may reallow up to 100% of any sales load on shares sold by dealers with whom it has sales agreements. Broker-dealers with which the Distributor has entered into selling agreements may charge their customers a processing or service fee in connection with the purchase or redemption of Fund shares. The amount and applicability of such a fee is determined and disclosed to such customers by each individual broker-dealer.
The Distribution Agreement continued in effect for an initial two-year period, and thereafter continues in effect so long as such continuance is approved at least annually (i) by the vote of a majority of the Trustees or by a vote of a majority of the shares of the Trust; and (ii) by a majority of the Trustees who are not parties to the Distribution Agreement or interested persons (as defined in the 1940 Act) of any such person, cast in person at a meeting called for the purpose of voting on such approval.
CLASS A, CLASS R4, AND CLASS R3 DISTRIBUTION AND SERVICE PLAN
The Trust has adopted, with respect to the Class A, Class R4, and Class R3 shares of each Fund, an Amended and Restated Rule 12b-1 Plan (the “Plan”) pursuant to Rule 12b-1 under the 1940 Act. The Trustees of the Trust, including a majority of the Trustees who are not interested persons of the Trust and who have no direct or indirect financial interest in the operation of the Plan, by vote cast in person at a meeting called for the purpose of voting on the Plan, approved the Plan on February 13, 2014 for each Fund and share class.
Continuance of the Plan is subject to annual approval by a vote of the Trustees, including a majority of the Independent Trustees, cast in person at a meeting called for that purpose. All material amendments to the Plan must be likewise approved by the Trustees and the Independent Trustees. The Plan may not be amended in order to increase materially the costs which a Fund may bear for distribution pursuant to the Plan without also being approved by a majority of the outstanding voting securities of the relevant class of the Fund. The Plan terminates automatically in the event of its assignment and may be terminated without penalty, at any time, by a vote of a majority of the Independent Trustees or by a vote of a majority of the outstanding voting securities of the relevant class of the Fund. The Plan provides that the Distributor shall provide to the Trustees, and the Board shall review at least quarterly, a written report of the amounts expended and the purposes for which such expenditures were made.
The Plan is a compensation plan, authorizing payments to the Distributor up to the following annual rates: Class A and Class R4 shares – 0.25% of the average daily net assets of the class; Class R3 shares – 0.50% of the average daily net assets of the class. A Fund may make payments under the Plan to compensate the Distributor for services provided and expenses incurred by it for purposes of promoting the sale of the relevant class of shares, reducing redemptions of shares, or maintaining or improving services provided to shareholders.
B-108
The following table discloses the 12b-1 fees paid in the fiscal year ending September 30, 2016 by the Trust under its 12b-1 plan for Class A, Class R4, and Class R3 shares of the Funds:
| Class A 12b-1 Servicing Fees | Class R4 12b-1 Servicing Fees | Class R3 12b-1 Servicing Fees | Class R3 12b-1 Distribution Fees | |||||||||||||
Total Return Bond Fund | $ | 5,701 | $ | 788,101 | $ | 116,674 | $ | 116,674 | ||||||||
Strategic Bond Fund | 107,094 | 52,145 | 12,754 | 12,754 | ||||||||||||
BlackRock Global Allocation Fund | 15,868 | 27,874 | 16,462 | 16,462 | ||||||||||||
Diversified Value Fund | 49,585 | 1,090 | 2,789 | 2,789 | ||||||||||||
Fundamental Value Fund | 424,603 | 6,708 | 3,206 | 3,206 | ||||||||||||
Large Cap Value Fund | 74,901 | 219 | 173 | 173 | ||||||||||||
S&P 500 Index Fund | 48,508 | 1,478,764 | 153,929 | 153,929 | ||||||||||||
Focused Value Fund | 427,429 | 9,812 | 7,918 | 7,918 | ||||||||||||
Fundamental Growth Fund | 43,649 | 1,125 | 2,047 | 2,047 | ||||||||||||
Blue Chip Growth Fund | 395,057 | 74,134 | 31,099 | 31,099 | ||||||||||||
Growth Opportunities Fund | 316,987 | 15,739 | 2,023 | 2,023 | ||||||||||||
Mid-Cap Value Fund | 5,149 | 222 | 235 | 235 | ||||||||||||
Small Cap Value Equity Fund | 17,796 | 2,787 | 677 | 677 | ||||||||||||
Small Company Value Fund | 72,379 | 302 | 176 | 176 | ||||||||||||
S&P Mid Cap Index Fund | 99,199 | 62,474 | 51,359 | 51,359 | ||||||||||||
Russell 2000 Small Cap Index Fund | 41,271 | 48,740 | 33,964 | 33,964 | ||||||||||||
Mid Cap Growth Equity II Fund | 754,872 | 78,239 | 25,344 | 25,344 | ||||||||||||
Small Cap Growth Equity Fund | 105,222 | 2,766 | 1,446 | 1,446 | ||||||||||||
Diversified International Fund | 1,021 | 1,863 | 437 | 437 | ||||||||||||
MSCI EAFE International Index Fund | 32,694 | 42,938 | 38,439 | 38,439 | ||||||||||||
Overseas Fund | 147,446 | 12,303 | 4,016 | 4,016 | ||||||||||||
|
|
|
|
|
|
|
| |||||||||
| $ | 3,186,431 | $ | 2,708,345 | $ | 505,167 | $ | 505,167 | |||||||||
|
|
|
|
|
|
|
| |||||||||
For the fiscal year ending September 30, 2016, the Distributor paid to MassMutual the 12b-1 fees and MassMutual retained at least approximately 95% of the 12b-1 fees it received as compensation for recordkeeping services provided by MassMutual to retirement and other employee benefit plans, as agreed between MassMutual and those plans. MassMutual paid the remainder, as agent of the Distributor, to various unaffiliated financial intermediaries as compensation for distribution services and/or shareholder services provided by them.
PAYMENTS TO FINANCIAL INTERMEDIARIES
The Distributor and MassMutual may pay ongoing compensation to financial intermediaries for distribution services and/or shareholder account services they provide. The compensation paid by the Distributor to a financial intermediary may be paid continually over time, during the period when the intermediary’s clients hold investments in the Funds. Shareholder account services provided by a financial intermediary may include, for example, acting, directly or through an agent, as the shareholder and nominee for the intermediary’s clients or employee benefit plan participants; maintaining account records for each client or plan participant that beneficially owns the applicable class of shares; processing orders to purchase, redeem and exchange the applicable class of shares on behalf of clients or plan participants, and handling the transmission of funds representing the purchase price or redemption proceeds; and addressing client or plan participant questions regarding their accounts and the Funds.
The amount of continuing compensation paid to different financial intermediaries varies. In most cases, compensation for distribution services is paid at an annual rate from .25% to .50% of the value of the financial
B-109
intermediary’s clients’ investments in the Funds; compensation for shareholder account services is paid at an annual rate from .10% to .35% of the value of the financial intermediary’s clients’ investment in the Funds. Variations in the amounts paid may, but will not necessarily, reflect enhanced or additional services provided by the intermediary. All or a portion of the Distributor’s payments to financial intermediaries will be made out of amounts received by the Distributor under the Funds’ 12b-1 Plan; payments for distribution services will be paid only out of amounts paid by a Fund under a Rule 12b-1 Plan.
Shares may be purchased by retirement plans and other employee benefit plans to which MassMutual provides recordkeeping and related services. MassMutual, out of its own assets, may make payments to broker-dealers and other financial intermediaries that provide marketing support and other services relating to the insurance or retirement products through which such plans may invest in the Funds.
MML Advisers, or an affiliate, may make payments, out of its own assets, to securities dealers and other firms that enter into agreements providing the Distributor with access to representatives of those firms for the sale of shares of the Funds or with other marketing or administrative services with respect to the Funds. These payments may be a specific dollar amount, may be based on the number of customer accounts maintained by a firm, or may be based on a percentage of the value of shares of the Funds sold to, or held by, customers of the firm. As of September 30, 2016, the following member firms of the Financial Industry Regulatory Authority (FINRA) have arrangements in effect with the Distributor pursuant to which the firms are entitled to a revenue sharing payment.
Ameriprise Financial Services, Inc.
Commonwealth Equity Services, Inc.
LPL Financial LLC
Merrill Lynch Life Agency Inc.
Merrill Lynch, Pierce, Fenner & Smith Inc.
Morgan Stanley Smith Barney LLC
NFP Advisor Services, LLC
NFP Insurance Services, Inc.
CUSTODIANS, DIVIDEND DISBURSING AGENT, AND TRANSFER AGENT
State Street, located at 1 Iron Street, Boston, Massachusetts 02210, is the custodian of each Fund’s investments, other than the BlackRock Global Allocation Fund, and Brown Brothers Harriman & Co. (“BBH”), located at 40 Water Street, Boston, Massachusetts 02109, is the custodian of the BlackRock Global Allocation Fund’s investments (together, the “Custodians”). State Street is the Funds’ transfer agent and dividend disbursing agent (the “Transfer Agent”). As custodian, each of State Street and BBH has custody of the Funds’ securities and maintains certain financial and accounting books and records. The Custodians and the Transfer Agent do not assist in, and are not responsible for, the investment decisions and policies of the Funds.
INDEPENDENT REGISTERED PUBLIC ACCOUNTING FIRM
Deloitte & Touche LLP, located at 200 Berkeley Street, Boston, Massachusetts 02116, is the Trust’s independent registered public accounting firm.
The Trust, MML Advisers, the Distributor, American Century, Barrow Hanley, BlackRock, Brandywine Global, Federated Clover, Frontier, Harris, Huber Capital Management, Invesco, J.P. Morgan, Jackson Square, Loomis Sayles, MFS, MetWest, NTI, OFI Global, Sands Capital, Systematic, T. Rowe Price, Wellington
B-110
Management, Western Asset, and Western Asset Limited have each adopted a code of ethics (the “Codes of Ethics”) pursuant to Rule 17j-1 under the 1940 Act and Rule 204A-1 under the Advisers Act. The Codes of Ethics permit Fund personnel to invest in securities, including securities that may be purchased or held by a Fund, for their own accounts, but require compliance with various pre-clearance requirements (with certain exceptions). The Codes of Ethics are on public file with, and are available from, the SEC.
PORTFOLIO TRANSACTIONS AND BROKERAGE
Transactions on stock exchanges, commodities markets and futures markets and other agency transactions involve the payment by the Funds of negotiated brokerage commissions. Such commissions may vary among different brokers. A particular broker may charge different commissions according to such factors as execution venue and exchange. Although the Funds do not typically pay commissions for principal transactions in the OTC markets, such as the markets for most fixed income securities and certain derivatives, an undisclosed amount of profit or “mark-up” is included in the price a Fund pays. In underwritten offerings, the price paid by a Fund includes a disclosed, fixed commission or discount retained by the underwriter or dealer.
The primary consideration in placing portfolio security transactions with broker-dealers for execution is to obtain and maintain the availability of execution at the most favorable prices and in the most effective manner possible. Each Fund’s investment adviser or subadviser attempts to achieve this result by selecting broker-dealers to execute portfolio transactions on the basis of their professional capability, the value and quality of their brokerage services, including anonymity and trade confidentiality, and the level of their brokerage commissions.
Under each Advisory or Subadvisory Agreement and as permitted by Section 28(e) of the Exchange Act, an investment adviser or subadviser may cause a Fund to pay a broker-dealer that provides brokerage and research services to the investment adviser or subadviser an amount of commission for effecting a securities transaction for a Fund in excess of the amount other broker-dealers would have charged for the transaction if the investment adviser or subadviser determines in good faith that the greater commission is reasonable in relation to the value of the brokerage and research services provided by the executing broker-dealer viewed in terms of either a particular transaction or the investment adviser’s or subadviser’s overall responsibilities to the Trust and to its other clients. The term “brokerage and research services” includes: providing advice as to the value of securities, the advisability of investing in, purchasing, or selling securities, and the availability of securities or of purchasers or sellers of securities; furnishing analyses and reports concerning issuers, industries, securities, economic factors and trends, portfolio strategy, and the performance of accounts; and effecting securities transactions and performing functions incidental thereto such as clearance and settlement.
Certain investment advisers or subadvisers may obtain third-party research from broker-dealers or non-broker-dealers by entering into commission sharing arrangements (“CSAs”). Under a CSA, the executing broker-dealer agrees that part of the commissions it earns on certain equity trades will be allocated to one or more research providers as payment for research. CSAs allow an investment adviser or subadviser to direct broker-dealers to pool commissions that are generated from orders executed at that broker-dealer, and then periodically direct the broker-dealer to pay third party research providers for research.
Brokerage and research services provided by brokers is used for the benefit of all of the investment adviser’s or subadviser’s clients and not solely or necessarily for the benefit of the Trust. The investment advisers or subadvisers attempt to evaluate the quality of brokerage and research services provided by brokers. Results of this effort are sometimes used by the investment advisers or subadvisers as a consideration in the selection of brokers to execute portfolio transactions.
The investment advisory fee that the Trust pays on behalf of each Fund to MML Advisers will not be reduced as a consequence of an investment adviser’s or subadviser’s receipt of brokerage and research services. To the extent the Trust’s portfolio transactions are used to obtain such services, the brokerage commissions paid by the Trust will exceed those that might otherwise be paid, provided that the investment adviser or subadviser
B-111
determines in good faith that such excess amounts are reasonable in relation to the services provided. Such services would be useful and of value to an investment adviser or subadviser in serving both the Trust and other clients and, conversely, such services obtained by the placement of brokerage business of other clients would be useful to an investment adviser or subadviser in carrying out its obligations to the Trust.
Subject to the overriding objective of obtaining the best execution of orders, the Funds may use broker-dealer affiliates of their respective investment advisers or subadvisers to effect portfolio brokerage transactions under procedures adopted by the Trustees. Pursuant to these procedures, the commission rates and other remuneration paid to the affiliated broker-dealer must be fair and reasonable in comparison to those of other broker-dealers for comparable transactions involving similar securities being purchased or sold during a comparable time period. This standard would allow the affiliated broker or dealer to receive no more than the remuneration which would be expected to be received by an unaffiliated broker.
The Funds may allocate brokerage transactions to broker-dealers (including affiliates of their respective investment advisers or subadvisers) who have entered into arrangements with the Trust under which the broker-dealer allocates a portion of the commissions paid back to the Fund. The transaction quality must, however, be comparable to that of other qualified broker-dealers.
The Select Cayman Fund follows the same brokerage practices as does the BlackRock Global Allocation Fund.
The following table discloses the brokerage commissions paid by the following Funds for the fiscal years ended September 30, 2016, September 30, 2015, and December 31, 2014:
| Fiscal Year ended September 30, 2016 | Fiscal Year ended September 30, 2015 | Fiscal Year ended December 31, 2014 | ||||||||||
Total Return Bond Fund | $ | 11,815 | $ | 4,645 | $ | 58,747 | ||||||
Strategic Bond Fund | $ | 125,483 | $ | 66,179 | $ | 39,892 | ||||||
BlackRock Global Allocation Fund1 | $ | 318,451 | $ | 211,554 | $ | 422,744 | ||||||
Diversified Value Fund | $ | 120,337 | $ | 89,022 | $ | 167,927 | ||||||
Fundamental Value Fund | $ | 329,019 | $ | 288,940 | $ | 291,720 | ||||||
Large Cap Value Fund | $ | 40,811 | $ | 51,450 | $ | 180,922 | ||||||
S&P 500 Index Fund | $ | 77,483 | $ | 44,331 | $ | 57,819 | ||||||
Focused Value Fund | $ | 283,012 | $ | 123,944 | $ | 238,407 | ||||||
Fundamental Growth Fund | $ | 20,257 | $ | 19,175 | $ | 30,805 | ||||||
Blue Chip Growth Fund | $ | 261,294 | $ | 267,285 | $ | 256,718 | ||||||
Growth Opportunities Fund | $ | 234,903 | $ | 257,446 | $ | 249,451 | ||||||
Mid-Cap Value Fund | $ | 120,277 | $ | 150,640 | $ | 222,745 | ||||||
Small Cap Value Equity Fund | $ | 85,784 | $ | 65,270 | $ | 64,607 | ||||||
Small Company Value Fund | $ | 879,893 | $ | 992,546 | $ | 629,798 | ||||||
S&P Mid Cap Index Fund | $ | 45,123 | $ | 19,466 | $ | 21,998 | ||||||
Russell 2000 Small Cap Index Fund | $ | 62,323 | $ | 65,637 | $ | 36,270 | ||||||
Mid Cap Growth Equity II Fund | $ | 969,085 | $ | 578,317 | $ | 702,268 | ||||||
Small Cap Growth Equity Fund | $ | 621,498 | $ | 939,901 | $ | 1,421,825 | ||||||
Diversified International Fund | $ | 81,666 | $ | 108,375 | $ | 151,788 | ||||||
MSCI EAFE International Index Fund | $ | 84,175 | $ | 46,625 | $ | 39,296 | ||||||
Overseas Fund | $ | 349,896 | $ | 381,466 | $ | 391,766 | ||||||
| 1 | The amounts disclosed include $20,413, $3,862, and $2,145 in commissions paid by the Select Cayman Fund for the fiscal years ended September 30, 2016, September 30, 2015, and December 31, 2014, respectively. |
The following table discloses, for those Funds that paid brokerage commissions to an affiliate of its investment adviser or subadviser, the total amount of brokerage commissions paid by each such Fund to affiliates for the past three fiscal years and, for the fiscal year ended 2016, the percentage of the Fund’s aggregate brokerage commissions paid to affiliates and the percentage of the Fund’s aggregate dollar amount of transactions involving the payment of commissions effected through affiliates.
B-112
| Fiscal Year ended September 30, 2016 | Fiscal Year ended September 30, 2015 | Fiscal Year ended December 31, 2014 | ||||||||||||||||||
Affiliated Broker/Dealer | Aggregate Commissions Paid | Percentage Paid to Affiliates | Percentage of Dollar Amount of Transactions Involving Payment of Commissions to Affiliates | Aggregate Commissions Paid | ||||||||||||||||
Jefferies and Company | ||||||||||||||||||||
BlackRock Global Allocation Fund1 | $ | 226 | 0.07 | % | 0.14 | % | $ | 404 | $ | 439 | ||||||||||
Diversified Value Fund1 | $ | 26 | 0.02 | % | 0.01 | % | $ | 329 | $ | 1,347 | ||||||||||
Large Cap Value Fund1 | — | — | — | $ | 238 | — | ||||||||||||||
Blue Chip Growth Fund1 | $ | 3,608 | 1.38 | % | 1.90 | % | $ | 2,301 | $ | 2,575 | ||||||||||
Mid-Cap Value Fund1 | — | — | — | $ | 2,966 | $ | 3,312 | |||||||||||||
Small Company Value Fund1 | $ | 54,198 | 6.16 | % | 8.13 | % | $ | 45,495 | $ | 72,752 | ||||||||||
Mid Cap Growth Equity II Fund1 | $ | 10,823 | 1.12 | % | 1.38 | % | $ | 2,377 | $ | 3,027 | ||||||||||
Small Cap Growth Equity Fund1 | $ | 1,463 | 0.24 | % | 0.21 | % | $ | 3,293 | $ | 5,553 | ||||||||||
JPMorgan Chase & Company | ||||||||||||||||||||
Diversified International Fund2 | $ | 100 | 0.12 | % | 0.10 | % | $ | 404 | $ | 1,203 | ||||||||||
Overseas Fund2 | $ | 212 | 0.06 | % | 0.08 | % | $ | 465 | $ | 1,061 | ||||||||||
| 1 | Includes affiliated trading platforms of Jefferies and Company. |
| 2 | Includes affiliated trading platforms of JPMorgan Chase & Company. |
The following table discloses, for those Funds that had trades directed to a broker or dealer during the fiscal year ended September 30, 2016 because of research services provided, the dollar value of transactions placed by each such Fund with such brokers and dealers during the fiscal year ended September 30, 2016 to recognize “brokerage and research” services, and commissions paid for such transactions:
| Dollar Value of Those Transactions | Amount of Commissions | |||||||
BlackRock Global Allocation Fund | $ | 515,181,710 | $ | 268,695 | ||||
Diversified Value Fund | $ | 96,167,534 | $ | 53,935 | ||||
Fundamental Value Fund | $ | 429,833,003 | $ | 269,258 | ||||
Large Cap Value Fund | $ | 76,798,749 | $ | 21,273 | ||||
Focused Value Fund | $ | 689,040,393 | $ | 279,191 | ||||
Fundamental Growth Fund | $ | 144,610,002 | $ | 18,618 | ||||
Blue Chip Growth Fund | $ | 869,997,250 | $ | 242,326 | ||||
Growth Opportunities Fund | $ | 393,015,998 | $ | 170,756 | ||||
Mid-Cap Value Fund | $ | 226,500,383 | $ | 66,969 | ||||
Small Cap Value Equity Fund | $ | 61,800,064 | $ | 61,297 | ||||
Small Company Value Fund | $ | 213,922,580 | $ | 339,876 | ||||
Mid Cap Growth Equity II Fund | $ | 1,897,575,617 | $ | 837,423 | ||||
Small Cap Growth Equity Fund | $ | 691,277,118 | $ | 468,637 | ||||
Diversified International Fund | $ | 124,964,484 | $ | 75,387 | ||||
Overseas Fund | $ | 459,864,215 | $ | 329,831 | ||||
B-113
The following table discloses, for those Funds that held securities issued by one or more of its “regular brokers or dealers” (as defined in the 1940 Act), or their parent companies, the aggregate value of the securities held by each such Fund as of the fiscal year ended September 30, 2016.
Regular Broker or Dealer | | Aggregate Value of Securities Held | | |||
Total Return Bond Fund | JPMorgan Chase & Co. | $ | 34,968,956 | |||
Bank of America Corp. | 22,431,034 | |||||
Morgan Stanley | 22,403,856 | |||||
Citigroup, Inc. | 7,571,795 | |||||
The Goldman Sachs Group, Inc. | 3,465,508 | |||||
Credit Suisse Group | 2,115,541 | |||||
UBS AG | 2,000,578 | |||||
Barclays Bank PLC | 905,371 | |||||
|
| |||||
| $ | 95,862,639 | |||||
|
| |||||
Strategic Bond Fund | JPMorgan Chase & Co. | $ | 6,778,643 | |||
Citigroup, Inc. | 6,234,978 | |||||
The Goldman Sachs Group, Inc. | 5,173,223 | |||||
Bank of America Corp. | 4,735,358 | |||||
Credit Suisse Group | 4,164,702 | |||||
Morgan Stanley | 3,861,247 | |||||
Barclays Bank PLC | 1,054,999 | |||||
Nomura Holdings, Inc. | 959,694 | |||||
UBS AG | 555,434 | |||||
State Street Corp. | 292,314 | |||||
|
| |||||
| $ | 33,810,592 | |||||
|
| |||||
BlackRock Global Allocation Fund | JPMorgan Chase & Co. | $ | 5,680,151 | |||
Bank of America Corp. | 3,733,052 | |||||
Citigroup, Inc. | 3,588,650 | |||||
The Goldman Sachs Group, Inc. | 2,196,054 | |||||
UBS AG | 1,429,319 | |||||
Deutsche Bank | 1,293,394 | |||||
Morgan Stanley | 398,550 | |||||
|
| |||||
| $ | 18,319,170 | |||||
|
| |||||
Diversified Value Fund | JPMorgan Chase & Co. | $ | 10,604,657 | |||
Bank of America Corp. | 6,829,050 | |||||
Citigroup, Inc. | 5,548,486 | |||||
State Street Corp. | 1,971,991 | |||||
The Goldman Sachs Group, Inc. | 1,773,970 | |||||
Morgan Stanley | 1,516,438 | |||||
|
| |||||
| $ | 28,244,592 | |||||
|
| |||||
Fundamental Value Fund | JPMorgan Chase & Co. | $ | 47,809,356 | |||
Citigroup, Inc. | 26,448,800 | |||||
The Goldman Sachs Group, Inc. | 11,998,488 | |||||
|
| |||||
| $ | 86,256,644 | |||||
|
| |||||
B-114
Regular Broker or Dealer | | Aggregate Value of Securities Held | | |||
Mid-Cap Value Fund | State Street Corp. | $ | 595,963 | |||
|
| |||||
| $ | 595,963 | |||||
|
| |||||
Large Cap Value Fund | Bank of America Corp. | $ | 6,720,047 | |||
JPMorgan Chase & Co. | 6,036,916 | |||||
Citigroup, Inc. | 4,237,759 | |||||
State Street Corp. | 1,329,446 | |||||
|
| |||||
| $ | 18,324,168 | |||||
|
| |||||
S&P 500 Index Fund | JPMorgan Chase & Co. | $ | 46,266,932 | |||
Bank of America Corp. | 30,698,258 | |||||
Citigroup, Inc. | 26,399,114 | |||||
The Goldman Sachs Group, Inc. | 11,675,464 | |||||
Morgan Stanley | 9,062,945 | |||||
State Street Corp. | 4,908,149 | |||||
|
| |||||
| $ | 129,010,862 | |||||
|
| |||||
Focused Value Fund | JPMorgan Chase & Co. | $ | 41,951,700 | |||
The Goldman Sachs Group, Inc. | 34,189,240 | |||||
|
| |||||
| $ | 76,140,940 | |||||
|
| |||||
Fundamental Growth Fund | JPMorgan Chase & Co. | $ | 317,701 | |||
Bank of America Corp. | 293,860 | |||||
|
| |||||
| $ | 611,561 | |||||
|
| |||||
Blue Chip Growth Fund | Morgan Stanley | $ | 16,869,972 | |||
State Street Corp. | 8,118,858 | |||||
JPMorgan Chase & Co. | 3,296,205 | |||||
Citigroup, Inc. | 1,676,665 | |||||
|
| |||||
| $ | 29,961,700 | |||||
|
| |||||
MSCI EAFE International Index Fund | Deutsche Bank | $ | 2,877,097 | |||
UBS AG | 977,786 | |||||
Barclays Bank PLC | 726,778 | |||||
Nomura Holdings, Inc. | 570,847 | |||||
Credit Suisse Group | 481,175 | |||||
|
| |||||
| $ | 5,633,683 | |||||
|
| |||||
Overseas Fund | Credit Suisse Group | $ | 8,732,077 | |||
UBS AG | 6,492,244 | |||||
Barclays Bank PLC | 2,323,412 | |||||
|
| |||||
| $ | 17,547,733 | |||||
|
| |||||
B-115
The Trust, an open-end, management investment company, is organized as a Massachusetts business trust under the laws of Massachusetts by an Agreement and Declaration of Trust dated May 28, 1993 which was amended and restated as of November 21, 2011. A copy of the Declaration of Trust is on file with the Secretary of The Commonwealth of Massachusetts. The fiscal year for each Fund ends on September 30.
The Declaration of Trust permits the Trustees, without shareholder approval, to issue an unlimited number of shares and divide those shares into an unlimited number of series of shares, representing separate investment portfolios with rights determined by the Trustees. Shares of the Funds are transferable and have no preemptive, subscription, or conversion rights. Shares of the Funds are entitled to dividends as declared by the Trustees. In the event of liquidation of a Fund, the Trustees would distribute, after paying or otherwise providing for all charges, taxes, expenses, and liabilities belonging to the Fund, the remaining assets belonging to the Fund among the holders of outstanding shares of the Fund. The Trustees have currently authorized the issuance of an unlimited number of full and fractional shares of 39 series, 21 of which are described in this SAI.
The Trustees may divide the shares of any series into two or more classes having such preferences or special or relative rights and privileges as the Trustees may determine, without obtaining shareholder approval. The Trustees have currently authorized the establishment and designation of up to 7 classes of shares for each series of the Trust: Class I Shares, Class R5 Shares, Service Class Shares, Administrative Class Shares, Class A Shares, Class R4 Shares, and Class R3 Shares. Currently only Class I Shares are offered by the MM Select Bond and Income Asset Fund and the MM Select Equity Asset Fund. All shares of a particular class of each series represent an equal proportionate interest in the assets and liabilities belonging to that series allocable to that class.
The Trustees may also, without shareholder approval, combine two or more existing series (or classes) into a single series (or class).
The Declaration of Trust provides for the perpetual existence of the Trust. The Declaration of Trust, however, provides that the Trust may be terminated at any time by vote of at least 50% of the shares of each series entitled to vote and voting separately by series or by the Trustees by written notice to the shareholders. Any series of the Trust may be terminated by vote of at least 50% of shareholders of that series or by the Trustees by written notice to the shareholders of that series.
Shares of the Funds entitle their holders to one vote per share, with fractional shares voting proportionally, in the election of Trustees and on other matters submitted to the vote of shareholders. On any matter submitted to a vote of shareholders, all shares of the Trust then entitled to vote shall, except as otherwise provided in the Declaration of Trust or the Bylaws, be voted in the aggregate as a single class without regard to series or class, except that: (i) when required by the 1940 Act or when the Trustees shall have determined that the matter affects one or more series or classes materially differently, shares will be voted by individual series or class; and (ii) when the Trustees have determined that the matter affects only the interests of one or more series or classes, then only shareholders of such series or classes shall be entitled to vote thereon. A separate vote will be taken by the applicable Fund on matters affecting the particular Fund, as determined by the Trustees. For example, a change in a fundamental investment policy for a particular Fund would be voted upon only by shareholders of that Fund. In addition, a separate vote will be taken by the applicable class of a Fund on matters affecting the particular class, as determined by the Trustees. For example, the adoption of a distribution plan relating to a particular class and requiring shareholder approval would be voted upon only by shareholders of that class. Shares of each Fund have noncumulative voting rights with respect to the election of trustees.
The Trust is not required to hold annual meetings of its shareholders. However, special meetings of the shareholders may be called for the purpose of electing Trustees and for such other purposes as may be prescribed by law, by the Declaration of Trust, or by the Bylaws. There will normally be no meetings of shareholders for the purpose of electing Trustees except that the Trust will hold a shareholders’ meeting as required by applicable law or regulation.
B-116
The Declaration of Trust may be amended by the Trustees without a shareholder vote, except to the extent a shareholder vote is required by applicable law, the Declaration of Trust or the Bylaws, or as the Trustees may otherwise determine.
Under Massachusetts law, shareholders of a Massachusetts business trust could, under certain circumstances, be held personally liable for the obligations of the Trust. However, the Declaration of Trust disclaims liability of the shareholders, Trustees, or officers for acts or obligations of the Trust, which are binding only on the assets and property of the Trust, and require that notice of such disclaimer be given in each note, bond, contract, instrument, certificate, or undertaking made or issued on behalf of the Trust by the Trustees or officers. In addition, the Declaration of Trust provides that shareholders of a Fund are entitled to indemnification out of the assets of their Fund to the extent that they are held personally liable for the obligations of their Fund solely by reason of being or having been a shareholder. Thus, the risk of a shareholder of a Fund incurring financial loss on account of shareholder liability is considered remote since it is limited to circumstances in which the disclaimer is inoperative and his or her Fund is unable to meet its obligations.
The Declaration of Trust also permits the Trustees to charge shareholders directly for custodial, transfer agency, and servicing expenses, but the Trustees have no present intention to charge shareholders directly for such expenses.
The Declaration of Trust further provides that a Trustee will not be personally liable for errors of judgment or mistakes of fact or law. However, nothing in the Declaration of Trust protects a Trustee against any liability to which the Trustee would otherwise be subject by reason of his or her own willful misfeasance, bad faith, gross negligence, or reckless disregard of the duties involved in the conduct of his or her office. The Declaration of Trust also provides for indemnification of each of its Trustees and officers, except that such Trustees and officers may not be indemnified against any liability to the Trust or its shareholders to which he or she would otherwise be subject by reason of willful misfeasance, bad faith, gross negligence, or reckless disregard of the duties involved in the conduct of his or her office.
With respect to each Fund, the Trustees may suspend the right of redemption, postpone the date of payment, or suspend the determination of NAV: (a) for any period during which the NYSE is closed (other than for customary weekend and holiday closing); (b) for any period during which trading in the markets the Fund normally uses is, as determined by the SEC, restricted; (c) when an emergency exists as determined by the SEC so that disposal of the Fund’s investments or a determination of its NAV is not reasonably practicable; or (d) for such other periods as the SEC by order may permit for the protection of the Trust’s shareholders. While the Trust’s Declaration of Trust would permit it to redeem shares in cash or other assets of the Fund or both, the Trust has filed an irrevocable election with the SEC to pay in cash all requests for redemption received from any shareholder if the aggregate amount of such requests in any 90-day period does not exceed the lesser of $250,000 or 1% of a Fund’s net assets.
VALUATION OF PORTFOLIO SECURITIES
The NAV of each Fund’s shares is determined once daily as of the close of regular trading on the NYSE, on each day the NYSE is open for trading (a “business day”). The NYSE normally closes at 4:00 p.m. Eastern Time, but may close earlier on some days. The NYSE currently is not open for trading on New Year’s Day, Martin Luther King, Jr. Day, President’s Day, Good Friday, Memorial Day, Independence Day, Labor Day, Thanksgiving Day, and Christmas Day. Each Fund calculates the NAV of each of its classes of shares by dividing the total value of the assets attributable to that class, less the liabilities attributable to that class, by the number of shares of that class that are outstanding.
B-117
Equity securities and derivative contracts that are actively traded on a national securities exchange or contract market are valued on the basis of information furnished by a pricing service, which provides the last reported sale price, or, in the case of futures contracts, the settlement price, for securities or derivatives listed on the exchange or contract market or the official closing price on the NASDAQ National Market System, or in the case of OTC securities for which an official closing price is unavailable or not reported on the NASDAQ System, the last reported bid price. Portfolio securities traded on more than one national securities exchange are valued at the last price at the close of the exchange representing the principal market for such securities. Debt securities are valued on the basis of valuations furnished by a pricing service, which generally determines valuations taking into account factors such as institutional-size trading in similar securities, yield, quality, coupon rate, maturity, type of issue, trading characteristics, and other market data. Shares of other open-end mutual funds are valued at their closing NAVs as reported on each business day.
Investments for which market quotations are readily available are marked to market daily based on those quotations. Market quotations may be provided by third-party vendors or market makers, and may be determined on the basis of a variety of factors, such as broker quotations, financial modeling, and other market data, such as market indexes and yield curves, counterparty information, and foreign exchange rates. U.S. Government and agency securities may be valued on the basis of market quotations or using a model that may incorporate market observable data such as reported sales of similar securities, broker quotes, yields, bids, offers, quoted market prices, and reference data. The fair values of OTC derivative contracts, including forward, swap, and option contracts related to interest rates, foreign currencies, credit standing of reference entities, equity prices, or commodity prices, may be based on market quotations or may be modeled using a series of techniques, including simulation models, depending on the contract and the terms of the transaction. The fair values of asset-backed securities and mortgage-backed securities are estimated based on models that consider the estimated cash flows of each debt tranche of the issuer, establish a benchmark yield, and develop an estimated tranche-specific spread to the benchmark yield based on the unique attributes of the tranche including, but not limited to, prepayment speed assumptions and attributes of the collateral. Restricted securities are generally valued at a discount to similar publicly traded securities.
Investments for which market quotations are not available or for which a pricing service or vendor does not provide a value, or for which such market quotations or values are considered by the investment adviser or subadviser to be unreliable (including, for example, certain foreign securities, thinly-traded securities, certain restricted securities, certain initial public offerings, or securities whose values may have been affected by a significant event) are stated at fair valuations determined in good faith by the Funds’ Valuation Committee1 in accordance with procedures approved annually by the Board, and under the general oversight of the Board. The Funds’ Valuation Committee employs various methods to determine fair valuations including a regular review of key inputs and assumptions and review of any related market activity. The Funds’ Valuation Committee reports to the Board at its regularly scheduled meetings. It is possible that fair value prices will be used by the Funds to a significant extent. The value determined for an investment using the Funds’ fair value procedures may differ from recent market prices for the investment and may be significantly different from the value realized upon the sale of such investment.
The Funds may invest in securities that are traded principally in foreign markets and that trade on weekends and other days when the Funds do not price their shares. As a result, the values of the Funds’ portfolio securities may change on days when the prices of the Funds’ shares are not calculated. The prices of the Funds’ shares will reflect any such changes when the prices of the Funds’ shares are next calculated, which is the next business day. The Funds may use fair value pricing more frequently for securities primarily traded in foreign markets because, among other things, most foreign markets close well before the Funds value their securities. The earlier close of these foreign markets gives rise to the possibility that significant events, including broad market moves, may have occurred in the interim. The Funds’ investments may be priced based on fair values provided by a third-party
| 1 | The Valuation Committee consists of the President, Treasurer, Assistant Treasurers, Vice Presidents (except for the CCO), Assistant Vice Presidents, Secretary, and Assistant Secretaries of the Trust, as well as such alternate members as the Board may from time to time designate. The Valuation Committee reviews and determines the fair valuation of portfolio securities and the Funds’ pricing procedures in general. |
B-118
vendor, based on certain factors and methodologies applied by such vendor, in the event that there is movement in the U.S. market, between the close of the foreign market and the time the Funds calculate their NAVs.
The prices of foreign securities are quoted in foreign currencies. All assets and liabilities expressed in foreign currencies are converted into U.S. dollars at the mean between the buying and selling rates of such currencies against the U.S. dollar at the end of each business day. Changes in the exchange rate, therefore, if applicable, will affect the NAV of shares of a Fund even when there has been no change in the values of the foreign securities measured in terms of the currency in which they are denominated.
The proceeds received by each Fund for each issue or sale of its shares, all net investment income, and realized and unrealized gain will be specifically allocated to such Fund and constitute the underlying assets of that Fund. The underlying assets of each Fund will be segregated on the Trust’s books of account, and will be charged with the liabilities in respect of such Fund and with a share of the general liabilities of the Trust. Expenses with respect to any two or more Funds are to be allocated in proportion to the NAVs of the respective Funds except where allocations of direct expenses can otherwise be fairly made. Each class of shares of a Fund will be charged with liabilities directly attributable to such class, and other Fund expenses will be allocated in proportion to the NAVs of the respective classes.
The Select Cayman Fund is subject to the same valuation policies as the BlackRock Global Allocation Fund. The BlackRock Global Allocation Fund’s investment in the Select Cayman Fund is valued based on the value of the Select Cayman Fund’s portfolio investments.
Taxation of the Funds: In General
Each Fund has elected and intends to qualify each year to be taxed as a regulated investment company under Subchapter M of the Code. In order to qualify as a “regulated investment company,” a Fund must, among other things:
| (a) | derive at least 90% of its gross income for each taxable year from |
| (i) | dividends, interest, payments with respect to securities loans, gains from the sale or other disposition of stock, securities, or foreign currencies, and other income (including, but not limited to, gains from options, futures, or forward contracts) derived with respect to its business of investing in such stock, securities, or currencies and |
| (ii) | net income derived from interests in “qualified publicly traded partnerships” (as defined below); |
| (b) | distribute with respect to each taxable year at least 90% of the sum of its investment company taxable income (generally taxable ordinary income and the excess, if any, of net short-term capital gains over net long-term capital losses) and its net tax-exempt income, if any, for such year in a manner qualifying for the dividends-paid deduction; and |
| (c) | diversify its holdings so that, at the close of each quarter of its taxable year, |
| (i) | at least 50% of the value of its total assets consists of cash, cash items, U.S. Government securities, securities of other regulated investment companies, and other securities limited generally with respect to any one issuer to not more than 5% of the total assets of the Fund and not more than 10% of the outstanding voting securities of such issuer, and |
| (ii) | not more than 25% of the value of its total assets is invested, including through corporations in which the Fund owns a 20% or more voting stock interest, (x) in the securities of any one issuer or two or more issuers which the Fund controls and that are engaged in the same, similar, or related trades or businesses (other than U.S. Government securities), or (y) in the securities of one or more qualified publicly traded partnerships (as defined below). |
B-119
For purposes of the 90% gross income requirement described in (a) above, income derived from a partnership will be treated as qualifying income only to the extent such income is attributable to items of income of the partnership which would be qualifying income if realized directly by the regulated investment company. However, 100% of the net income derived from an interest in a “qualified publicly traded partnership” will be treated as qualifying income. A “qualified publicly traded partnership” is a partnership (x) the interests in which are traded on an established securities market or are readily tradable on a secondary market or the substantial equivalent thereof, and (y) that derives less than 90% of its income from the qualifying income described in paragraph (a)(i). In general, such entities will be treated as partnerships for federal income tax purposes because they meet the passive income requirement under Code section 7704(c)(2). Certain of a Fund’s investments in MLPs and ETFs, if any, may qualify as interests in qualified publicly traded partnerships, as described further below. In addition, although in general the passive loss rules of the Code do not apply to regulated investment companies, such rules do apply to a regulated investment company with respect to items attributable to an interest in a qualified publicly traded partnership.
For purposes of the diversification test in (c) above, the term “outstanding voting securities of such issuer” will include the equity securities of a qualified publicly traded partnership. Also for purposes of the diversification test in (c) above, the identification of the issuer (or, in some cases, issuers) of a particular Fund investment can depend on the terms and conditions of that investment. In some cases, identification of the issuer (or issuers) is uncertain under current law, and an adverse determination or future guidance by the IRS with respect to identification of the issuer for a particular type of investment may adversely affect the Fund’s ability to meet the diversification test in (c) above.
The 90% gross income requirement described in (a) above and the diversification test described in (c) above may limit the extent to which a Fund can engage in certain derivative transactions, as well as the extent to which it can invest in commodities, commodities-related investments, and MLPs.
In general, if a Fund qualifies as a regulated investment company that is accorded special tax treatment, that Fund will not be subject to federal income tax on income or gains paid in a timely manner to its shareholders in the form of dividends (including capital gain dividends). As long as a Fund qualifies as a regulated investment company, the Fund under present law will not be subject to any excise or income taxes imposed by Massachusetts.
If a Fund were to fail to meet the income, diversification or distribution test described above, the Fund could in some cases cure such failure, including by paying a Fund-level tax, paying interest, making additional distributions, or disposing of certain assets. If a Fund were ineligible to or otherwise did not cure such failure for any year, or if a Fund were otherwise to fail to qualify as a regulated investment company in any taxable year, that Fund would be subject to tax on its taxable income at corporate rates. In addition, all distributions from earnings and profits, including any distributions of net tax-exempt income and net long-term capital gains, would be taxable to shareholders as dividend income. Some portions of such distributions may be eligible for the dividends received deduction in the case of corporate shareholders or possibly to be treated as qualified dividend income to individual shareholders. Finally, the Fund could be required to recognize unrealized gains, pay substantial taxes and interest, and make substantial distributions before requalifying as a regulated investment company.
Each Fund intends to distribute at least annually to its shareholders all or substantially all of its investment company taxable income (computed without regard to the dividends-paid deduction), its net tax-exempt income (if any), and net capital gain (that is, the excess of net long-term capital gain over net short-term capital loss, in each case determined with reference to any loss carryforwards). Investment company taxable income or net capital gain that is retained by a Fund will be subject to tax at regular corporate rates. However, a Fund may designate any retained net capital gain amount as undistributed capital gains in a timely notice to its shareholders who (i) will be required to include in income for federal income tax purposes, as long-term capital gain, their shares of such undistributed amount, and (ii) will be entitled to credit their proportionate shares of the tax paid by the Fund on such undistributed amount against their federal income tax liabilities, if any, and to claim refunds to
B-120
the extent the credit exceeds such liabilities. If a Fund makes this designation, the tax basis of shares owned by a shareholder of a Fund will, for Federal income tax purposes, be increased by an amount equal to the difference between the amount of undistributed capital gains included in the shareholder’s gross income under clause (i) of the preceding sentence and the tax deemed paid by the shareholder under clause (ii) of the preceding sentence. A Fund is not required to, and there can be no assurance the Fund will, make this designation if it retains all or a portion of its net capital gain in a taxable year.
In determining its net capital gain, including in connection with determining the amount available to support a capital gain dividend, its taxable income, and its earnings and profits, a regulated investment company may elect to treat any post-October capital loss (defined as any net capital loss attributable to the portion of the taxable year after October 31 or, if there is no such loss, the net long-term capital loss or net short-term capital loss attributable to such portion of the taxable year) and certain late-year ordinary losses (generally, the sum of its (i) net ordinary losses from the sale, exchange or other taxable disposition of property, attributable to the portion of the taxable year after October 31, and its (ii) other net ordinary losses attributable to the portion of the taxable year after December 31) as if incurred in the succeeding taxable year.
Capital losses in excess of capital gains (“net capital losses”) are not permitted to be deducted against a Fund’s net investment income. If a Fund has a net capital loss for any year, the amount thereof may be carried forward to offset capital gains in future years, thereby reducing the amount the Fund would otherwise be required to distribute in such future years to qualify for the special tax treatment accorded regulated investment companies and avoid a Fund-level tax. If a Fund incurs or has incurred net capital losses in taxable years beginning after December 22, 2010 (“post-2010 losses”), those losses will be carried forward to one or more subsequent taxable years without expiration; any such carryforward losses will retain their character as short-term or long-term. If a Fund incurred net capital losses in a taxable year beginning on or before December 22, 2010 (“pre-2011 losses”), the Fund is permitted to carry such losses forward for eight taxable years; in the year to which they are carried forward, such losses are treated as short-term capital losses that first offset any short-term capital gains, and then offset any long-term capital gains. A Fund must use any post-2010 losses, which will not expire, before it uses any pre-2011 losses. This may increase the likelihood that pre-2011 losses, if any, will expire unused. See the most recent annual shareholder report for each Fund’s capital loss carryforwards as of the end of its most recently ended fiscal year.
A nondeductible excise tax at the rate of 4% will be imposed on the excess, if any, of each Fund’s “required distribution” over its actual distributions in any calendar year. The “required distribution” is 98% of the Fund’s ordinary income for the calendar year plus 98.2% of its capital gain net income recognized during the one-year period ending on October 31 plus undistributed amounts from prior years. For these purposes, ordinary gains and losses from the sale, exchange or other taxable disposition of property that would be properly taken into account after October 31 are treated as arising on January 1 of the following calendar year. Each Fund intends to make distributions sufficient to avoid imposition of the excise tax, although there can be no assurance that it will be able to do so. Distributions declared by a Fund during October, November, or December to shareholders of record on a date in any such month and paid by the Fund during the following January will be treated for federal tax purposes as paid by the Fund and received by shareholders on December 31 of the year in which declared.
Under current law, a Fund may treat the portion of redemption proceeds paid to redeeming shareholders that represents the redeeming shareholders’ portion of the undistributed investment company taxable income and net capital gain of the Fund as a distribution of investment company taxable income and net capital gain on the Fund’s tax return. This practice, which involves the use of tax equalization, will have the effect of reducing the amount of income and gains that a Fund is required to distribute as dividends to shareholders in order for the Fund to avoid federal income tax and excise tax. This practice may also reduce the amount of the distributions required to be made to non-redeeming shareholders. The amount of any undistributed income will be reflected in the value of the shares of the Fund, and thus the total return on a shareholder’s investment will not be reduced as a result of the distribution policy.
B-121
Fund Distributions
Except in the case of certain shareholders eligible for preferential tax treatment, e.g., qualified retirement or pension trusts, shareholders of each Fund generally will be subject to federal income taxes on Fund distributions as described herein. Distributions are taxable whether shareholders receive them in cash or reinvest them in additional shares through a dividend reinvestment plan. A shareholder whose distributions are reinvested in shares will be treated as having received a dividend equal to the fair market value of the new shares issued to the shareholder.
Distributions are taxable to shareholders even if they are paid from income or gains earned by a Fund before a shareholder’s investment (and thus were included in the price the shareholder paid for his or her shares), even though such dividends and distributions may economically represent a return of a particular shareholder’s investment. Such distributions are likely to occur in respect of shares purchased at a time when a Fund’s NAV reflects gains that are unrealized, or income or gains that are realized but not distributed. Such realized income or gains may be required to be distributed even when the Fund’s NAV also reflects unrealized losses.
Distributions by each Fund of investment income generally will be taxable to shareholders as ordinary income. Taxes on distributions of capital gains are determined by how long the Fund owned (or is deemed to have owned) the investments that generated them, rather than by how long a shareholder has owned (or is deemed to have owned) his or her shares. Distributions of gains from the sale of investments that the Fund owned for one year or less will be taxable as ordinary income. Properly reported distributions of long-term capital gains, if any, are taxable in the hands of an investor as long-term gain includible in net capital gain and taxed to individuals at reduced rates. Tax rules can alter a Fund’s holding period in investments and thereby affect the tax treatment of gain or loss on such investments. The Strategic Bond Fund and Total Return Bond Fund generally do not expect a significant portion of their distributions to be taxable as long-term gains.
Distributions of investment income reported by a Fund as derived from “qualified dividend income” will be taxed in the hands of individuals at the rates applicable to long-term capital gains, provided that both the shareholder and the Fund meet certain holding period and other requirements. In order for some portion of the dividends received by a Fund shareholder to be “qualified dividend income,” the Fund must meet certain holding period and other requirements with respect to some portion of the dividend-paying stocks in its portfolio and the shareholder must meet certain holding period and other requirements with respect to the Fund’s shares. A dividend will not be treated as qualified dividend income (at either the Fund or shareholder level) (1) if the dividend is received with respect to any share of stock held for fewer than 61 days during the 121-day period beginning on the date which is 60 days before the date on which such share becomes ex-dividend with respect to such dividend (or, in the case of certain preferred stock, 91 days during the 181-day period beginning 90 days before such date), (2) to the extent that the recipient is under an obligation (whether pursuant to a short sale or otherwise) to make related payments with respect to positions in substantially similar or related property, (3) if the recipient elects to have the dividend income treated as investment income for purposes of the limitation on deductibility of investment interest, or (4) if the dividend is received from a foreign corporation that is (a) not eligible for the benefits of a comprehensive income tax treaty with the United States (with the exception of dividends paid on stock of such a foreign corporation that is readily tradable on an established securities market in the United States) or (b) treated as a passive foreign investment company.
In general, distributions of investment income reported by each Fund as derived from qualified dividend income will be treated as qualified dividend income by a shareholder taxed as an individual, provided the shareholder meets the holding period and other requirements described above with respect to the Fund’s shares. If the aggregate qualified dividends received by a Fund during any taxable year are 95% or more of its gross income (excluding net long-term capital gain over net short-term capital loss), then 100% of the Fund’s dividends (other than dividends properly reported as capital gain dividends) will be eligible to be treated as qualified dividend income. The Strategic Bond Fund and the Total Return Bond Fund generally do not expect a significant portion of their distributions to be derived from qualified dividend income.
B-122
Dividends of net investment income received by corporate shareholders of each Fund will qualify for the 70% dividends received deduction generally available to corporations to the extent those dividends are reported as being attributable to qualifying dividends received by the Fund from domestic corporations for the taxable year. In general, a dividend received by a Fund will not be treated as a dividend eligible for the dividends-received deduction (1) if it has been received with respect to any share of stock that the Fund has held for less than 46 days (91 days in the case of certain preferred stock) during the 91-day period beginning on the date which is 45 days before the date on which such share becomes ex-dividend with respect to such dividend (during the 181-day period beginning 90 days before such date in the case of certain preferred stock) or (2) to the extent that the Fund is under an obligation (pursuant to a short sale or otherwise) to make related payments with respect to positions in substantially similar or related property. Moreover, the dividends received deduction may otherwise be disallowed or reduced (1) if the corporate shareholder fails to satisfy the foregoing requirements with respect to its shares of the Fund or (2) by application of various provisions of the Code (for instance, the dividends-received deduction is reduced in the case of a dividend received on debt-financed portfolio stock (generally, stock acquired with borrowed funds)). The Strategic Bond Fund and the Total Return Bond Fund generally do not expect a significant portion of their distributions to qualify for the dividends received deduction.
A portion of the interest paid or accrued on certain high yield discount obligations owned by a Fund may be treated as a dividend for purposes of the corporate dividends received deduction. In such cases, if the issuer of the high yield discount obligations is a domestic corporation, dividend payments by a Fund may be eligible for the dividends received deduction to the extent of the deemed dividend portion of such accrued interest.
Any distribution of income that is attributable to (i) income received by a Fund in lieu of dividends with respect to securities on loan pursuant to a securities lending transaction, or (ii) dividend income received by the Fund on securities it temporarily purchased from a counterparty pursuant to a repurchase agreement that is treated for U.S. federal income tax purposes as a loan by the Fund, will not constitute qualified dividend income to individual shareholders and will not be eligible for the dividends-received deduction for corporate shareholders.
Section 1411 of the Code generally imposes a 3.8% Medicare contribution tax on the net investment income of certain individuals, trusts, and estates to the extent their income exceeds certain threshold amounts. For these purposes, “net investment income” generally includes, among other things, (i) distributions paid by a Fund of net investment income and capital gains as described above, and (ii) any net gain from the sale, redemption, exchange, or other taxable disposition of Fund shares. Shareholders are advised to consult their tax advisers regarding the possible implications of this additional tax on their investment in the Fund.
If a Fund makes a distribution to a shareholder in excess of its current and accumulated “earnings and profits” in and with respect to any taxable year, the excess distribution will be treated as a return of capital to the extent of the shareholder’s tax basis in his or her shares, and thereafter as capital gain. A return of capital is not taxable, but it reduces a shareholder’s tax basis in his or her shares, thus reducing any loss or increasing any gain on the shareholder’s subsequent taxable disposition of his or her shares.
Sales, Redemptions, and Exchanges
Sales, redemptions, and exchanges of each Fund’s shares are taxable events and, accordingly, shareholders subject to federal income taxes may realize gains and losses on these transactions. If shares have been held for more than one year, gain or loss realized generally will be long-term capital gain or loss, provided the shareholder holds the shares as a capital asset. Otherwise, the gain or loss on a taxable disposition of Fund shares will be treated as short-term capital gain or loss. However, a loss on a sale of Fund shares held by a shareholder for six months or less will be treated as a long-term capital loss to the extent of any long-term capital gain dividend paid to the shareholder with respect to such shares. Further, no loss will be allowed on a sale of Fund shares to the extent the shareholder acquires identical shares of the same Fund within 30 days before or after the disposition. In such case, the basis of the newly purchased shares will be adjusted to reflect the disallowed loss. In the case of individuals holding shares in a Fund directly, upon the sale, redemption or exchange of Fund shares, the Fund or, in the case of shares purchased through a financial intermediary, the financial intermediary
B-123
may be required to provide the shareholder and the IRS with cost basis and certain other related tax information about the Fund shares sold, redeemed, or exchanged. See the Funds’ Prospectus for more information.
Under Treasury regulations, if a shareholder recognizes a loss with respect to Fund shares of $2 million or more for an individual shareholder or $10 million or more for a corporate shareholder, the shareholder must file with the IRS a disclosure statement on IRS Form 8886. Direct shareholders of portfolio securities are in many cases excepted from this reporting requirement, but under current guidance, shareholders of a regulated investment company are not excepted. Future guidance may extend the current exception from this reporting requirement to shareholders of most or all regulated investment companies. The fact that a loss is reportable under these regulations does not affect the legal determination of whether the taxpayer’s treatment of the loss is proper. Shareholders should consult their tax advisers to determine the applicability of these regulations in light of their individual circumstances.
Certain Investments in Debt Obligations
Some debt obligations with a fixed maturity date of more than one year from the date of issuance (and all zero-coupon debt obligations with a fixed maturity date of more than one year from the date of issuance) that are acquired by a Fund will be treated as being issued with original issue discount (“OID”). Generally, the amount of the OID is treated as interest income and is included in taxable income (and required to be distributed) over the term of the debt security, even though payment of that amount is not received until a later time, usually when the debt security matures. Payment-in-kind securities will also give rise to income which is required to be distributed even though a Fund holding the security receives no interest payment in cash on the security during the year.
Some debt obligations with a fixed maturity date of more than one year from the date of issuance that are acquired by a Fund in the secondary market may be treated as having market discount. Generally, any gain recognized on the disposition of, and any partial payment of principal on, a debt security having market discount is treated as ordinary income to the extent the gain, or principal payment, does not exceed the “accrued market discount” on such debt security. Alternatively, the Fund may elect to accrue market discount currently, in which case the Fund will be required to include the accrued market discount in the Fund’s income (as ordinary income) and thus distribute it over the term of the debt security, even though payment of that amount is not received until a later time, upon partial or full repayment or disposition of the debt security. The rate at which the market discount accrues, and thus is included in the Fund’s income, will depend upon which of the permitted accrual methods the Fund elects.
Some debt obligations with a fixed maturity date of one year or less from the date of issuance that are acquired by a Fund may be treated as having OID, or acquisition discount in the case of certain types of debt obligations. Generally, the Fund will be required to include the OID, or acquisition discount, as ordinary income over the term of the debt security, even though payment of that amount is not received until a later time, usually when the debt security matures. A Fund may make one or more of the elections applicable to debt obligations having acquisition discount, or OID, which could affect the character and timing of recognition of income by the Fund.
As indicated above, a Fund that invests in certain debt instruments may be required to pay out as an income distribution each year an amount which is greater than the total amount of cash interest the Fund actually received. Such distributions may be made from the cash assets of the Fund or by liquidation of portfolio securities, if necessary. The Fund may realize gains or losses from such liquidations. In the event a Fund realizes net capital gains from such transactions, its shareholders may receive a larger capital gain distribution than they would in the absence of such transactions.
Investments in debt obligations that are at risk of or in default present special tax issues for a Fund. Tax rules are not entirely clear about issues such as when a Fund may cease to accrue interest, OID, or market discount, whether and to what extent a Fund should recognize market discount on such a debt obligation, when and to what extent a Fund may take deductions for bad debts or worthless securities, and how a Fund should
B-124
allocate payments received on obligations in default between principal and interest. These and other related issues will be addressed by each Fund when, and if, it invests in such securities, in order to seek to ensure that it distributes sufficient income to preserve its status as a regulated investment company and does not become subject to U.S. federal income or excise tax.
Derivative Transactions
If a Fund engages in derivative transactions, including transactions in options, futures contracts, forward contracts, swap agreements, foreign currencies, and straddles, or other similar transactions, including for hedging purposes, it will be subject to special tax rules (including constructive sale, mark-to-market, straddle, wash sale, and short sale rules), the effect of which may be to accelerate income to the Fund, defer losses to the Fund, cause adjustments in the holding periods of the Fund’s securities, convert long-term capital gains into short-term capital gains, or convert short-term capital losses into long-term capital losses. These rules could therefore affect the amount, timing, and character of distributions to shareholders.
A Fund’s transactions in foreign currency-denominated debt instruments and certain of its derivative activities may produce a difference between its book income and its taxable income. If a Fund’s book income exceeds its taxable income, the distribution (if any) of such excess generally will be treated as (i) a dividend to the extent of the Fund’s remaining earnings and profits (including earnings and profits arising from tax-exempt income), (ii) thereafter, as a return of capital to the extent of the recipient’s basis in its shares, and (iii) thereafter, as gain from the sale or exchange of a capital asset. If a Fund’s book income is less than taxable income, the Fund could be required to make distributions exceeding book income to qualify as a regulated investment company and to eliminate fund-level income tax.
Investments in Regulated Investment Companies and Other Investment Funds
To the extent a Fund invests its assets in shares of ETFs or other investment companies that are regulated investment companies (“underlying funds”), its distributable income and gains will normally consist of distributions from such underlying funds and gains and losses on the disposition of shares of such underlying funds. To the extent that such an underlying fund realizes net losses on its investments for a given taxable year, the Fund will not be able to recognize its share of those losses to offset capital gains the Fund realized from other sources until and only to the extent that it disposes of shares of the underlying fund in a transaction qualifying for sale or exchange treatment (although such losses of an underlying fund may reduce distributions to the Fund from that underlying fund in future taxable years). Moreover, even when a Fund does make a disposition of shares of an underlying fund, a portion of its loss may be recognized as a long-term capital loss, which the Fund will not be able to offset against its ordinary income (including distributions of any net short-term capital gains realized by the underlying fund).
As a result of the foregoing rules, and certain other special rules, the amounts of net investment income and net capital gains that a Fund will be required to distribute to shareholders may be greater than such amounts would have been had the Fund invested directly in the securities held by the underlying funds. For similar reasons, the character of distributions from the Fund will not necessarily be the same as it would have been had the Fund invested directly in the securities held by the underlying funds. Investing through underlying funds can therefore affect the amount, timing and character of distributions to shareholders, and may increase the amount of taxes payable by shareholders.
If at the close of each quarter of a Fund’s taxable year, at least 50% of its total assets consists of interests in other regulated investment companies, the Fund will be a “qualified fund of funds.” In that case, the Fund is permitted to elect to pass through to its shareholders foreign income and other similar taxes paid by the Fund in respect of foreign securities held directly by the Fund or by a regulated investment company in which its invests that itself elected to pass such taxes through to its shareholders, so that shareholders of the Fund will be eligible to claim a tax credit or deduction for such taxes. However, even if a Fund qualifies to make such election for any year, it may determine not to do so. See “Foreign Taxes and Investments” below.
B-125
The foregoing is only a general description of certain federal tax consequences of investing in ETFs and other underlying funds.
Funds with Multiple Subadvisers
Certain of the Funds employ a multi-manager approach in which the Fund’s investment adviser and one or more subadvisers each provide day-to-day portfolio management for a portion (or “sleeve”) of the Fund’s assets. Due to this multi-manager approach, certain of these Funds’ investments may be more likely to be subject to one or more special tax rules (including, but not limited to, wash sale, constructive sale, short sale, and straddle rules) that may affect the timing, character, and/or amount of a Fund’s distributions to shareholders.
Foreign Taxes and Investments
Income proceeds and gains received by a Fund from sources outside the United States might be subject to foreign taxes that are withheld at the source or other foreign taxes. The effective rate of these foreign taxes cannot be determined in advance because it depends on the specific countries in which a Fund’s assets will be invested, the amount of the assets invested in each such country and the possibility of treaty relief.
Each of the BlackRock Global Allocation Fund, Diversified International Fund, MSCI EAFE International Index Fund, and Overseas Fund may be eligible to make an election under Section 853 of the Code so that any of its shareholders subject to federal income taxes will be able to claim a credit or deduction on their income tax returns for, and will be required to treat as part of the amounts distributed to them, their pro rata portion of qualified taxes paid by the Fund to foreign countries. If such an election is made, the ability of shareholders of the Fund to claim a foreign tax credit will be subject to limitations imposed by the Code, which in general limits the amount of foreign tax that may be used to reduce a shareholder’s U.S. tax liability to that amount of U.S. tax which would be imposed on the amount and type of income in respect of which the foreign tax was paid. In addition, the ability of shareholders to claim a foreign tax credit is subject to a holding period requirement. A shareholder who for U.S. income tax purposes claims a foreign tax credit in respect of Fund distributions may not claim a deduction for foreign taxes paid by the Fund, regardless of whether the shareholder itemizes deductions. Also, no deduction for foreign taxes may be claimed by shareholders who do not itemize deductions on their federal income tax returns. It should also be noted that a tax-exempt shareholder, like other shareholders, will be required to treat as part of the amounts distributed to it a pro rata portion of the income taxes paid by the Fund to foreign countries. However, that income will generally be exempt from U.S. taxation by virtue of such shareholder’s tax-exempt status and such a shareholder will not be entitled to either a tax credit or a deduction with respect to such income. The BlackRock Global Allocation Fund, Diversified International Fund, MSCI EAFE International Index Fund, and Overseas Fund will notify their shareholders each year of the amount of dividends and distributions and the shareholders’ pro rata shares of qualified taxes paid by the Fund to foreign countries.
A Fund may invest in one or more “passive foreign investment companies” (“PFICs”). A PFIC is generally any foreign corporation: (i) 75 percent or more of the income of which for a taxable year in the Fund’s holding period is passive income, or (ii) the average percentage of the assets of which (generally by value, but by adjusted tax basis in certain cases) that produce or are held for the production of passive income is at least 50 percent. Generally, passive income for this purpose means dividends, interest (including income equivalent to interest), royalties, rents, annuities, the excess of gain over losses from certain property transactions and commodities transactions, and foreign currency gains.
Investment by a Fund in PFICs could subject the Fund to a U.S. federal income tax or other charge on distributions received from PFICs or on the proceeds from the sale of its investments in the PFICs. This tax cannot be eliminated by making distributions to Fund shareholders. However, a Fund may be able to make an election that would avoid the imposition of that tax. For example, a Fund may in certain cases elect to treat a PFIC as a “qualified electing fund” (a “QEF election”), in which case the Fund will be required to include in its income its share of the company’s income and net capital gains annually, regardless of whether it receives any
B-126
distribution from the company. A Fund also may make an election to mark the gains (and to a limited extent losses) in a PFIC “to the market” as though it had sold and repurchased its holdings in the PFIC on the last day of the Fund’s taxable year. Such gains and losses are generally treated as ordinary income and loss. The QEF and mark-to-market elections may accelerate the recognition of income by the Fund (without the receipt of cash) and increase the amount required to be distributed by a Fund to avoid taxation. Making either of these elections therefore may require a Fund to liquidate other investments (including when it is not advantageous to do so) to meet its distribution requirement, which also may accelerate the recognition of gain and affect a Fund’s total return. Dividends paid by PFICs will not be eligible to be treated as “qualified dividend income.” Because it is not always possible to identify a foreign corporation as a PFIC, a Fund may incur the tax and other charges described above in some instances.
Finally, a Fund’s transactions in foreign currencies, foreign currency-denominated debt obligations, and certain foreign currency options, futures contracts, and forward contracts (and similar instruments) may give rise to ordinary income or loss to the extent such income or loss results from fluctuations in the value of the foreign currency concerned. Such ordinary income treatment may increase the distributions taxed to shareholders as ordinary income. Any net ordinary losses resulting from such transactions cannot be carried forward by a Fund to offset income or gains earned in subsequent taxable years.
Certain Investments in Real Estate Investment Trusts
If a Fund invests in equity securities of REITs, such investments may result in the fund’s receipt of cash in excess of the REIT’s earnings. If a Fund distributes such amounts, such distribution could constitute a return of capital to the Fund’s shareholders for federal income tax purposes. Dividends received by a Fund from a REIT will not qualify for the corporate dividend-received deduction and generally will not constitute qualified dividend income.
Certain Investments in Mortgage-Related Securities
A Fund may invest directly or indirectly in residual interests in real estate mortgage investment conduits (“REMICs”) (including by investing in residual interests in CMOs with respect to which an election to be treated as a REMIC is in effect) or equity interests in taxable mortgage pools (“TMPs”). Under a notice issued by the IRS and Treasury regulations that have not yet been issued, but may apply retroactively, a portion of a Fund’s income from a REIT that is attributable to the REIT’s residual interest in a REMIC or an equity interest in a TMP (referred to in the Code as an “excess inclusion”) will be subject to federal income tax in all events. This notice also provides, and the regulations are expected to provide, that excess inclusion income of a regulated investment company, such as the Funds, will be allocated to shareholders of the regulated investment company in proportion to the dividends received by such shareholders, with the same consequences as if the shareholders held the related REMIC or TMP interest directly.
In general, excess inclusion income allocated to shareholders (i) cannot be offset by net operating losses (subject to a limited exception for certain thrift institutions), (ii) will constitute unrelated business taxable income (“UBTI”) to entities (including a qualified pension plan, an individual retirement account, a 401(k) plan, a Keogh plan, or other tax-exempt entity) subject to tax on UBTI, thereby potentially requiring such an entity that is allocated excess inclusion income, and otherwise might not be required to file a tax return, to file a tax return and pay tax on such income, and (iii) in the case of a non-U.S. shareholder, will not qualify for any reduction in U.S. federal withholding tax. A shareholder will be subject to U.S. federal income tax on such inclusions notwithstanding any exemption from such income tax otherwise available under the Code.
Unrelated Business Taxable Income
Income of a regulated investment company that would be UBTI if earned directly by a tax-exempt entity generally will not constitute UBTI when distributed to a tax-exempt shareholder of the regulated investment company. Notwithstanding this “blocking” effect, a tax-exempt shareholder of a Fund could realize UBTI by
B-127
virtue of its investment in a Fund if shares in that Fund constitute debt-financed property in the hands of the tax-exempt shareholder within the meaning of Code Section 514(b). A tax-exempt shareholder may also recognize UBTI if a Fund recognizes “excess inclusion income” derived from direct or indirect investments in residual interests in REMICs or equity interests in TMPs as described above.
Special tax consequences also apply to charitable remainder trusts (“CRTs”) that invest in regulated investment companies that invest directly or indirectly in residual interests in REMICs or equity interests in TMPs. Under legislation enacted in December 2006, a CRT, as defined in section 664 of the Code, that realizes UBTI for a taxable year must pay an excise tax annually of an amount equal to such UBTI. Under IRS guidance issued in October 2006, a CRT will not recognize UBTI solely as a result of investing in a Fund that recognizes “excess inclusion income” (which is described earlier). Rather, if at any time during any taxable year a CRT or one of certain other tax-exempt shareholders that is treated as a “disqualified organization” under the Code (such as the United States, a state or political subdivision, or an agency or instrumentality thereof, and certain energy cooperatives) is a record holder of a share in a Fund that recognizes “excess inclusion income,” then such Fund will be subject to a tax on that portion of its “excess inclusion income” for the taxable year that is allocable to such shareholders at the highest federal corporate income tax rate. The extent to which the IRS guidance in respect of CRTs remains applicable in light of the December 2006 CRT legislation is unclear. To the extent permitted under the 1940 Act, the Funds may elect to allocate any such tax specially to the applicable CRT, or other shareholder, and thus reduce such shareholder’s distributions for the year by the amount of the tax that relates to such shareholder’s interest in the Funds. CRTs and other tax-exempt investors are urged to consult their tax advisers concerning the consequences of investing in the Funds.
Commodity-Linked Investments and the Select Cayman Fund
A Fund’s use of commodity-linked instruments can be limited by the Fund’s intention to qualify as a regulated investment company and can limit the Fund’s ability to so qualify. Income and gains from direct investments in commodities and certain commodity-linked instruments does not constitute qualifying income to a regulated investment company for purposes of the 90% gross income test described above. The tax treatment of certain other commodity-linked instruments in which a Fund might invest is not certain, in particular with respect to whether income or gains from such instruments constitute qualifying income to a regulated investment company. If a Fund were to treat income or gain from a particular instrument as qualifying income and the income or gain were later determined not to constitute qualifying income and, together with any other nonqualifying income, caused the Fund’s nonqualifying income to exceed 10% of its gross income in any taxable year, the Fund would fail to qualify as a regulated investment company unless it is eligible to and does pay a tax at the Fund level.
The BlackRock Global Allocation Fund intends to gain exposure to the commodities markets indirectly through its investments in the Select Cayman Fund, which, in turn, may invest in such commodities-related investments. The IRS has issued a private letter ruling to the BlackRock Global Allocation Fund to the effect that income derived from the BlackRock Global Allocation Fund’s investment in the Select Cayman Fund will constitute qualifying income to the BlackRock Global Allocation Fund. The IRS has recently issued proposed regulations providing that subpart F income included in a regulated investment company’s gross income constitutes “qualifying income” (as further described below) only to the extent such income is timely and currently repatriated to the regulated investment company. If the regulations are finalized in their current form, the BlackRock Global Allocation Fund will no longer be able to rely on its previously issued private letter ruling, and subpart F income, if any, realized by the Select Cayman Fund and included in the income of the BlackRock Global Allocation Fund will constitute “qualifying income” only to the extent it is timely and currently repatriated to the BlackRock Global Allocation Fund.
As described above, another requirement for qualifying for the special tax treatment accorded regulated investment companies and their shareholders is that a Fund must satisfy several diversification requirements, including the requirement that not more than 25% of the value of its total assets may be invested in the securities
B-128
(other than those of the U.S. Government or other regulated investment companies) of any one issuer or of two or more issuers which the fund controls and which are engaged in the same, similar, or related trades or businesses. Therefore, the BlackRock Global Allocation Fund generally may not invest more than 25% of the value of its assets in the Select Cayman Fund.
It is expected that the Select Cayman Fund generally will not be subject to U.S. federal income tax. However, the Select Cayman Fund is a controlled foreign corporation under the Code. As a “U.S. Shareholder” of the Select Cayman Fund (a U.S. person who owns (directly or indirectly) 10% or more of the total combined voting power of all classes of stock), the BlackRock Global Allocation Fund is required to include in gross income for U.S. federal income tax purposes for each taxable year of the BlackRock Global Allocation Fund its pro rata share of the Select Cayman Fund’s “subpart F income” for the Select Cayman Fund’s taxable year ending with or within the BlackRock Global Allocation Fund’s taxable year, whether or not such income is actually distributed by the Select Cayman Fund to the BlackRock Global Allocation Fund. Subpart F income generally includes interest, OID (defined above), dividends, net gains from the disposition of stocks or securities, net gains from transactions (including futures, forward, and similar transactions) in commodities, receipts with respect to securities loans, and net payments received with respect to equity swaps and similar derivatives. Subpart F income is treated as ordinary income, regardless of the character of the Select Cayman Fund’s underlying income. Net losses incurred by the Select Cayman Fund during a tax year do not flow through to the BlackRock Global Allocation Fund and thus will not be available to offset income or capital gain generated from the Fund’s other investments. In addition, net losses incurred by the Select Cayman Fund during a tax year generally cannot be carried forward by the Select Cayman Fund to offset gains realized by it in subsequent taxable years.
Investments in MLPs
Some amounts received by a Fund from its investments in MLPs will likely be treated as returns of capital because of accelerated deductions available with respect to the activities of MLPs. On the disposition of an investment in such an MLP, the Fund will likely realize taxable income in excess of economic gain from that asset (or, in later periods, if a Fund does not dispose of the MLP, the Fund will likely realize taxable income in excess of cash flow received by the Fund from the MLP), and the Fund must take such income into account in determining whether the Fund has satisfied its regulated investment company distribution requirements. The Fund may have to borrow or liquidate securities to satisfy its distribution requirements and meet its redemption requests, even though investment considerations might otherwise make it undesirable for the Fund to borrow money or sell securities at the time. In addition, distributions attributable to gain from the sale of MLPs that are characterized as ordinary income under the Code’s recapture provisions will be taxable to Fund shareholders, when distributed to them, as ordinary income.
As noted above, certain of the MLPs in which a Fund may invest qualify as qualified publicly traded partnerships. In such cases, the net income derived from such investments will constitute qualifying income for purposes of the 90% gross income requirement described earlier for qualification as a regulated investment company. If, however, such a vehicle were to fail to qualify as a qualified publicly traded partnership in a particular year, a portion of the gross income derived from it in such year could constitute non-qualifying income to a Fund for purposes of the 90% gross income requirement and thus could adversely affect the Fund’s ability to qualify as a regulated investment company for a particular year. In addition, as described above, the diversification requirement for regulated investment company qualification will limit a Fund’s investments in one or more vehicles that are qualified publicly traded partnerships to 25% of the Fund’s total assets as of the end of each quarter of the Fund’s taxable year.
Backup Withholding
Each Fund generally is required to withhold and remit to the U.S. Treasury a percentage of the taxable dividends and other distributions paid to and proceeds of share sales, exchanges, or redemptions made by any
B-129
individual shareholder who fails to furnish the Fund with a correct taxpayer identification number (TIN), who has under-reported dividend or interest income, or who fails to certify to the Fund that he or she is not subject to such withholding. The backup withholding tax rate is 28%.
Non U.S. Shareholders
Distributions by a Fund to shareholders that are not “U.S. persons” within the meaning of the Code (“foreign shareholders”) properly reported by the Fund as (1) capital gain dividends, (2) short-term capital gain dividends, and (3) interest-related dividends, each as defined and subject to certain conditions described below, generally are not subject to withholding of U.S. federal income tax.
In general, the Code defines (1) “short-term capital gain dividends” as distributions of net short-term capital gains in excess of net long-term capital losses and (2) “interest-related dividends” as distributions from U.S. source interest income of types similar to those not subject to U.S. federal income tax if earned directly by an individual foreign shareholder, in each case to the extent such distributions are properly reported as such by a Fund in a written notice to shareholders.
The exceptions to withholding for short-term capital gain dividends and capital gain dividends do not apply to (A) distributions to an individual foreign shareholder who is present in the United States for a period or periods aggregating 183 days or more during the year of the distribution and (B) distributions attributable to gain that is effectively connected with the conduct by the foreign shareholder of a trade or business within the United States under special rules regarding the disposition of U.S. real property interests.
The exception to withholding for “interest-related dividends” does not apply to distributions to a foreign shareholder (A) that has not provided a satisfactory statement that the beneficial owner is not a U.S. person, (B) to the extent that the dividend is attributable to certain interest on an obligation if the foreign shareholder is the issuer or is a 10% shareholder of the issuer, (C) that is within certain foreign countries that have inadequate information exchange with the United States, or (D) to the extent the dividend is attributable to interest paid by a person that is a related person of the foreign shareholder and the foreign shareholder is a controlled foreign corporation.
If a Fund invests in a regulated investment company that pays capital gain dividends, short-term capital gain dividends, or interest-related dividends to the Fund, such distributions retain their character as not subject to withholding if properly reported when paid by the Fund to foreign shareholders.
A Fund is permitted to report such part of its dividends as interest-related and/or short-term capital gain dividends as are eligible, but is not required to do so. In the case of shares held through an intermediary, the intermediary may withhold even if a Fund reports all or a portion of a payment as an interest-related or short-term capital gain dividend to shareholders. Foreign shareholders should contact their intermediaries regarding the application of these rules to their accounts.
Distributions by a Fund to foreign shareholders other than capital gain dividends, short-term capital gain dividends, and interest-related dividends (e.g., dividends attributable to dividend and foreign-source interest income or to short-term capital gains or U.S. source interest income to which the exception from withholding described above does not apply) are generally subject to withholding of U.S. federal income tax at a rate of 30% (or lower applicable treaty rate).
Under U.S. federal income tax law, a beneficial holder of shares who or which is a foreign person is not, in general, subject to U.S. federal income tax on gains (and is not allowed a deduction for losses) realized on the sale of shares of a Fund unless (i) such gain is effectively connected with the conduct of a trade or business carried on by such holder within the United States, (ii) in the case of an individual holder, the holder is present in the United States for a period or periods aggregating one hundred eighty-three (183) days or more during the year
B-130
of the sale and certain other conditions are met, or (iii) the special rules relating to gain attributable to the sale or exchange of “U.S. real property interests” (“USRPIs”) apply to the foreign shareholder’s sale of shares of the Fund (as described below).
Beneficial holders that are foreign persons with respect to whom income from a Fund is effectively connected with a trade or business conducted by the foreign shareholder within the United States will in general be subject to U.S. federal income tax on the income derived from the Fund at the graduated rates applicable to U.S. citizens, residents, or domestic corporations, whether such income is received in cash or reinvested in shares of the Fund and, in the case of a foreign corporation, may also be subject to a branch profits tax. If a foreign shareholder is eligible for the benefits of a tax treaty, any effectively connected income or gain will generally be subject to U.S. federal income tax on a net basis only if it is also attributable to a permanent establishment maintained by the shareholder in the United States. More generally, foreign shareholders who are residents in a country with an income tax treaty with the United States may obtain different tax results than those described herein, and are urged to consult their tax advisers.
Special rules would apply if a Fund were a qualified investment entity (“QIE”) because it is either a “U.S. real property holding corporation” (“USRPHC”) or would be a USRPHC but for the operation of certain exceptions to the definition of USRPIs described below. Very generally, a USRPHC is a domestic corporation that holds USRPIs the fair market value of which equals or exceeds 50% of the sum of the fair market values of the corporation’s USRPIs, interests in real property located outside the United States, and other trade or business assets. USRPIs generally are defined as any interest in U.S. real property and any interest (other than solely as a creditor) in a USRPHC or, very generally, an entity that has been a USRPHC in the last five years. A Fund that holds, directly or indirectly, significant interests in REITs may be a USRPHC. Interests in domestically controlled QIEs, including REITs and RICs that are QIEs, not-greater-than-10% interests in publicly traded classes of stock in REITs and not-greater-than-5% interests in publicly traded classes of stock in RICs generally are not USRPIs, but these exceptions do not apply for purposes of determining whether a Fund is a QIE.
If an interest in a Fund were a USRPI, the Fund would be required to withhold U.S. tax on the proceeds of a share redemption by a greater-than-5% foreign shareholder, in which case such foreign shareholder generally would also be required to file U.S. tax returns and pay any additional taxes due in connection with the redemption.
If a Fund were a QIE, under a special “look-through” rule, any distributions by the Fund to a foreign person (including, in certain cases, distributions made by the Fund in redemption of its shares) attributable directly or indirectly to (i) distributions received by the Fund from a lower-tier RIC or REIT that the Fund is required to treat as USRPI gain in its hands and (ii) gains realized on the disposition of USRPIs by the Fund would retain their character as gains realized from USRPIs in the hands of the Fund’s foreign shareholders and would be subject to U.S. tax withholding. In addition, such distributions could result in the foreign shareholder being required to file a U.S. tax return and pay tax on the distributions at regular U.S. federal income tax rates. The consequences to a foreign shareholder, including the rate of such withholding and character of such distributions (e.g., as ordinary income or USRPI gain), would vary depending upon the extent of the foreign shareholder’s current and past ownership of the Fund.
Foreign shareholders of a Fund also may be subject to “wash sale” rules to prevent the avoidance of the tax-filing and payment obligations discussed above through the sale and repurchase of Fund shares.
Beneficial holders that are foreign persons should consult their tax advisers and, if holding shares through intermediaries, their intermediaries, concerning the application of these rules to their investment in the Fund.
Other Reporting and Withholding Requirements
Sections 1471-1474 of the Code and the U.S. Treasury and IRS guidance issued thereunder (collectively, “FATCA”) generally require a Fund to obtain information sufficient to identify the status of each of its
B-131
shareholders under FATCA or under an applicable intergovernmental agreement (an “IGA”) between the United States and a foreign government. If a shareholder fails to provide the requested information or otherwise fails to comply with FATCA or an IGA, the Fund may be required to withhold under FATCA at a rate of 30% with respect to that shareholder on ordinary dividends it pays and 30% of the gross proceeds of share redemptions or exchanges and certain capital gain dividends it pays on or after January 1, 2019. If a payment by a Fund is subject to FATCA withholding, the Fund is required to withhold even if such payment would otherwise be exempt from withholding under the rules applicable to foreign shareholders described above (e.g., capital gain dividends, short-term capital gain dividends, and interest-related dividends).
Each prospective investor is urged to consult its tax adviser regarding the applicability of FATCA and any other reporting requirements with respect to the prospective investor’s own situation, including investments through an intermediary.
General Considerations
Special tax rules apply to investments though defined contribution plans and other tax-qualified plans or tax-advantaged arrangements. Shareholders should consult their tax adviser to determine the suitability of shares of a Fund as an investment through such plans and arrangements and the precise effect of an investment on their particular tax situation.
The foregoing discussion of the U.S. federal income tax consequences of investment in the Funds is a general and abbreviated summary based on the applicable provisions of the Code, U.S. Treasury regulations, and other applicable authority currently in effect. For the complete provisions, reference should be made to the pertinent Code sections and regulations. The Code and regulations are subject to change by legislative or administrative action, possibly with retroactive effect. This discussion of the federal income tax treatment of the Funds and their shareholders does not describe in any respect the tax treatment of any particular arrangement, e.g., tax-exempt trusts or insurance products, pursuant to which or by which investments in the Funds may be made. Shareholders should consult their tax advisers as to their own tax situation, including possible foreign, state, and local taxes.
Ropes & Gray LLP, The Prudential Tower, 800 Boylston Street, Boston, Massachusetts 02199-3600 serves as counsel to the Trust.
The audited financial statements of the Funds are set forth in the Trust’s Annual Reports as of September 30, 2016, and are incorporated herein by reference in reliance upon the reports of Deloitte & Touche LLP, independent registered public accounting firm, given on the authority of that firm as experts in accounting and auditing. Copies of the Trust’s Annual Reports as of September 30, 2016 are available, without charge, upon request by calling 1-888-309-3539.
Duration: indicates how interest rate changes will affect a debt instrument’s price. As a measure of a fixed income security’s cash flow, duration is an alternative to the concept of “term to maturity” in assessing the price volatility associated with changes in interest rates. Generally, the longer the duration, the more volatility an investor should expect. For example, the market price of a bond with a duration of two years would be expected to decline 2% if interest rates rose 1%. Conversely, the market price of the same bond would be expected to increase 2% if interest rates fell 1%. The market price of a bond with a duration of four years would be expected to increase or decline twice as much as the market price of a bond with a two-year duration. Duration measures a security’s maturity in terms of the average time required to receive the present value of all interest and principal
B-132
payments as opposed to its term to maturity. The maturity of a security measures only the time until final payment is due; it does not take account of the pattern of a security’s cash flow over time, which would include how cash flow is affected by prepayments and by changes in interest rates. Incorporating a security’s yield, coupon interest payments, final maturity, and option features into one measure, duration is computed by determining the weighted average maturity of a bond’s cash flows, where the present values of the cash flows serve as weights. Determining duration may involve a Fund’s investment adviser’s or subadviser’s estimates of future economic parameters, which may vary from actual future values.
NRSRO: means a nationally recognized statistical rating organization. For a description of the ratings of three NRSROs, S&P, Moody’s, and Fitch, see the Appendix to the SAI. For example, the four investment grade ratings in descending order for debt securities as rated by Moody’s are Aaa, Aa, A, and Baa- including Baa3. The four investment grade ratings for debt securities as rated by S&P are AAA, AA, A, and BBB- including BBB-. For commercial paper, Moody’s two highest ratings are P-1 and P-2 and S&P’s two highest ratings are A-1 and A-2.
U.S. Government Securities: include obligations issued, sponsored, assumed, and guaranteed as to principal and interest by the Government of the United States, its agencies and instrumentalities, and securities backed by such obligations, including FHA/VA guaranteed mortgages.
The name MassMutual Select Funds is the designation of the Trustees under a Declaration of Trust dated May 28, 1993, as amended and restated as of November 21, 2011, as it may be further amended from time to time. The obligations of such Trust are not personally binding upon, nor shall resort be had to the property of any of the Trustees, shareholders, officers, employees, or agents of such Trust, but only the property of the relevant series of the Trust shall be bound.
B-133
APPENDIX A—DESCRIPTION OF SECURITIES RATINGS
Although the ratings of fixed income securities by S&P, Moody’s, and Fitch are a generally accepted measurement of credit risk, they are subject to certain limitations. For example, ratings are based primarily upon historical events and do not necessarily reflect the future. Furthermore, there is a period of time between the issuance of a rating and the update of the rating, during which time a published rating may be inaccurate.
The descriptions of the S&P, Moody’s, and Fitch’s commercial paper and bond ratings are set forth below.
Commercial Paper Ratings:
S&P commercial paper ratings are graded into four categories, ranging from A for the highest quality obligations to D for the lowest. Issues assigned the highest rating of A are regarded as having the greatest capacity for timely payment. Issues in this category are further refined with the designations 1, 2, and 3 to indicate the relative degree of safety. The A-1 and A-2 categories are described as follows:
| A-1 | This designation indicates that the degree of safety regarding timely payment is strong. Those issues determined to possess extremely strong safety characteristics will be noted with a plus (+) sign designation. |
| A-2 | Capacity for timely payment on issues with this designation is satisfactory. However, the relative degree of safety is not as high as for issues designated A-1. |
Moody’s employs three designations, all judged to be investment grade, to indicate the relative repayment ability of rated issuers. The two highest designations are as follows:
Issuers (or supporting institutions) rated Prime-1 (or P-1) have a superior ability for repayment of senior short-term debt obligations. Prime-1 (or P-1) repayment ability will normally be evidenced by many of the following characteristics:
| · | Leading market positions in well-established industries. |
| · | High rates of return on funds employed. |
| · | Conservative capitalization structure with moderate reliance on debt and ample asset protection. |
| · | Broad margins in earnings coverage of fixed financial charges and high internal cash generation. |
| · | Well-established access to a range of financial markets and assured sources of alternate liquidity. |
Issuers (or supporting institutions) rated Prime-2 (or P-2) have a strong ability for repayment of senior short-term debt obligations. This will normally be evidenced by many of the characteristics cited above but to a lesser degree. Earnings trends and coverage ratios, while sound, may be more subject to variation. Capitalization characteristics, while still appropriate, may be more affected by external conditions. Ample alternate liquidity is maintained.
Fitch’s Short-Term Credit Ratings are graded into six categories, ranging from ‘F-1’ for the highest quality obligations to ‘D’ for the lowest. The F-1 and F-2 categories are described as follows:
“F-1”: Indicates the strongest capacity for timely payment of financial commitments; may have an added “+” to denote any exceptionally strong credit feature.
“F-2”: A satisfactory capacity for timely payment of financial commitments, but the margin of safety is not as great as in the case of the higher ratings.
B-134
Bond Ratings:
S&P describes its four highest ratings for corporate debt as follows:
AAA Debt rated AAA has the highest rating assigned by S&P. Capacity to pay interest and repay principal is extremely strong.
AA Debt rated AA has a very strong capacity to pay interest and repay principal and differs from the higher rated issues only in a small degree.
A Debt rated A has a strong capacity to pay interest and repay principal although it is somewhat more susceptible to the adverse effects of changes in circumstances and economic conditions than debt in higher rated categories.
BBB Debt rated BBB is regarded as having an adequate capacity to pay interest and repay principal. Whereas such debt normally exhibits adequate protection parameters, adverse economic conditions or changing circumstances are more likely to lead to a weakened capacity to pay interest and repay principal for debt in this category than in higher rated categories.
The ratings from AA to CCC may be modified by the addition of a plus or minus sign to show relative standing within the major rating categories.
Moody’s describes its four highest corporate bond ratings as follows:
Aaa Bonds which are rated Aaa are judged to be of the best quality. They carry the smallest degree of investment risk and are generally referred to as “gilt-edged.” Interest payments are protected by a large or by an exceptionally stable margin and principal is secure. While the various protective elements are likely to change, such changes as can be visualized are most unlikely to impair the fundamentally strong position of such issues.
Aa Bonds which are rated Aa are judged to be of high quality by all standards. Together with the Aaa group they compose what are generally known as high grade bonds. They are rated lower than the best bonds because margins of protection may not be as large as in Aaa securities or fluctuation of protective elements may be of greater amplitude or there may be other elements present which make the long-term risks appear somewhat larger than in Aaa securities.
A Bonds which are rated A possess many favorable investment attributes and may be considered as upper medium grade obligations. Factors giving security to principal and interest are considered adequate but elements may be present which suggest a susceptibility to impairment in the future.
Baa Bonds which are rated Baa are considered as medium grade obligations, i.e., they are neither highly protected nor poorly secured. Interest payments and principal security appear adequate for the present but certain protective elements may be lacking or may be characteristically unreliable over any great length of time. Such bonds lack outstanding investment characteristics and in fact have speculative characteristics as well.
Moody’s applies numerical modifiers 1, 2, and 3 in each generic rating classification from Aa through Caa in its corporate bond rating system. The modifier 1 indicates that the security ranks in the higher end of its generic rating category; the modifier 2 indicates a mid-range ranking; and the modifier 3 indicates that the issue ranks in the lower end of its generic rating category.
Fitch describes its four highest long-term credit ratings as follows:
AAA—“AAA” ratings denote the lowest expectation of credit risk. They are assigned only in case of exceptionally strong capacity for timely payment of financial commitments. This capacity is highly unlikely to be adversely affected by foreseeable events.
B-135
AA—“AA” ratings denote a very low expectation of credit risk. They indicate very strong capacity for timely payment of financial commitments. This capacity is not significantly vulnerable to foreseeable events.
A—“A” ratings denote a low expectation of credit risk. The capacity for timely payment of financial commitments is considered strong. This capacity may, nevertheless, be more vulnerable to changes in circumstances or in economic conditions than is the case for higher ratings.
BBB—“BBB” ratings indicate that there is currently a low expectation of credit risk. The capacity for timely payment of financial commitments is considered adequate, but adverse changes in circumstances and in economic conditions are more likely to impair this capacity. This is the lowest investment grade category.
A “+” or “–” may be appended to a rating to denote relative status within major rating categories. Such suffixes are not added to the “AAA” category or to categories below “CCC.”
S&P describes its below investment grade ratings for corporate debt as follows:
BB, B, CCC, CC, C—Debt rated “BB,” “B,” “CCC,” “CC,” and “C” is regarded, on balance, as predominantly speculative with respect to capacity to pay interest and repay principal in accordance with the terms of the obligation, “BB” indicates the lowest degree of speculation, and “C” the highest degree of speculation. While such debt will likely have some quality and protective characteristics, these are outweighed by large uncertainties or major risk exposures to adverse conditions.
BB—Debt rated “BB” has less near-term vulnerability to default than other speculative issues. However, it faces major ongoing uncertainties or exposure to adverse business, financial, or economic conditions which could lead to inadequate capacity to meet timely interest and principal payments. The “BB” rating category is also used for debt subordinated to senior debt that is assigned an actual or implied “BBB–” rating.
B—Debt rated “B” has a greater vulnerability to default but currently has the capacity to meet interest payments and principal repayments. Adverse business, financial, or economic conditions will likely impair capacity or willingness to pay interest and repay principal. The “B” rating category is also used for debt subordinated to senior debt that is assigned an actual or implied “BB” or “BB–” rating.
CCC—Debt rated “CCC” has a currently identifiable vulnerability to default, and is dependent upon favorable business, financial, and economic conditions to meet timely payment of interest and repayment of principal. In the event of adverse business, financial, or economic conditions, it is not likely to have the capacity to pay interest and repay principal. The “CCC” rating category is also used for debt subordinated to senior debt that is assigned an actual or implied “B” or “B–” rating.
CC—The rating “CC” is typically applied to debt subordinated to senior debt that is assigned an actual or implied “CCC” rating.
C—The rating “C” is typically applied to debt subordinated to senior debt which is assigned an actual or implied “CCC–” debt rating. The “C” rating may be used to cover a situation where a bankruptcy petition has been filed, but debt service payments are continued.
D—Debt rated “D” is in payment default. The “D” rating category is used when interest payments or principal payments are not made on the date due even if the applicable grace period has not expired, unless S&P believes that such payments will be made during such grace period. The “D” rating also will be used upon the filing of a bankruptcy petition if debt service payments are jeopardized.
Moody’s describes its below investment grade corporate bond ratings as follows:
Ba—Bonds which are rated Ba are judged to have speculative elements; their future cannot be considered as well assured. Often the protection of interest and principal payments may be very moderate and thereby not well safeguarded during other good and bad times over the future. Uncertainty of position characterizes bonds in this class.
B-136
B—Bonds which are rated B generally lack characteristics of the desirable investment. Assurance of interest and principal payments or of maintenance of other terms of the contract over any long period of time may be small.
Caa—Bonds which are rated Caa are of poor standing. Such issues may be in default or there may be present elements of danger with respect to principal or interest.
Ca—Bonds which are rated Ca represent obligations which are speculative in a high degree. Such issues are often in default or have other marked shortcomings.
C—Bonds which are rated C are the lowest rated class of bonds and issues so rated can be regarded as having extremely poor prospects of ever attaining any real investment standing.
Fitch describes its below investment grade long-term credit ratings as follows:
BB—“BB” ratings indicate that there is a possibility of credit risk developing, particularly as the result of adverse economic change over time; however, business or financial alternatives may be available to allow financial commitments to be met. Securities rated in this category are not investment grade.
B—“B” ratings indicate that significant credit risk is present, but a limited margin of safety remains. Financial commitments are currently being met; however, capacity for continued payment is contingent upon a sustained, favorable business and economic environment.
CCC, CC, C—Default is a real possibility. Capacity for meeting financial commitments is solely reliant upon sustained, favorable business or economic developments. A “CC” rating indicates that default of some kind appears probable. “C” ratings signal imminent default.
DDD, DD, D—The ratings of obligations in this category are based on their prospects for achieving partial or full recovery in a reorganization or liquidation of the obligor. While expected recovery values are highly speculative and cannot be estimated with any precision, the following serve as general guidelines. “DDD” obligations have the highest potential for recovery, around 90%-100% of outstanding amounts and accrued interest. “DD” indicates potential recoveries in the range of 50%-90% and “D” the lowest recovery potential, i.e., below 50%.
Entities rated in this category have defaulted on some or all of their obligations. Entities rated “DDD” have the highest prospect for resumption of performance or continued operation with or without a formal reorganization process. Entities rated “DD” and “D” are generally undergoing a formal reorganization or liquidation process; those rated “DD” are likely to satisfy a higher portion of their outstanding obligations, while entities rated “D” have a poor prospect of repaying all obligations.
B-137
APPENDIX B—PROXY VOTING POLICIES
The following represents the proxy voting policies (the “Policies”) of the MassMutual Select Funds (the “Funds”) with respect to the voting of proxies on behalf of each series of the Funds (the “Series”). It is the policy of the Funds and MML Investment Advisers, LLC (the “Adviser”), as investment manager to the Series, to delegate (with the exception of any “Fund of Funds,” “Feeder Funds,” or “Special Situations” where the Adviser is in the best position to vote the proxy) voting responsibilities and duties with respect to all proxies to the subadvisers (the “Subadvisers”) of the Series.
I. GENERAL PRINCIPLES
In voting proxies, the Subadvisers will be guided by general fiduciary principles and their respective written proxy voting policies. The Subadvisers will act prudently and solely in the best interest of the beneficial owners of the accounts they respectively manage, and for the exclusive purpose of providing benefit to such persons.
II. SUBADVISERS
1. The Subadvisers each have the duty to provide a copy of their written proxy voting policies to the Adviser and Funds annually. The Subadvisers’ written proxy voting policies will maintain procedures that address potential conflicts of interest.
2. The Subadvisers will each maintain a record of all proxy votes exercised on behalf of each series of the Funds for which they act as subadviser and will furnish such records to the Adviser and Funds annually.
3. The Subadvisers will report proxy votes that deviated from their normal proxy voting policies and any exceptions to their proxy voting policies to the Adviser quarterly.
4. The Subadvisers will provide the Adviser and Funds with all such information and documents relating to the Subadvisers’ proxy voting in a timely manner, as necessary for the Adviser and Funds to comply with applicable laws and regulations.
III. THE FUNDS AND ADVISER
1. The Chief Compliance Officer of the Funds will annually update the Trustees after a review of proxy voting records.
2. The Trustees of the Funds will not vote proxies on behalf of the Funds or the Series.
3. The Adviser will not vote proxies on behalf of the Funds or the Series, except that the Adviser will vote proxies on behalf of any Funds of Funds for which it serves as investment adviser or in Special Situations.
4. Whenever a Feeder Fund, as an interest holder of a Master Fund, is requested to vote on any matter submitted to interest holders of the Master Fund, the Feeder Fund will either hold a meeting of its shareholders to consider such matters, and the Adviser, on behalf of the Feeder Fund, will cast its votes in proportion to the votes received from the Feeder Fund’s shareholders (shares for which a Feeder Fund receives no voting instructions will be voted in the same proportion as the votes received from the other Feeder Fund shareholders), or the Adviser, on behalf of the Feeder Fund, will cast its votes, as an interest holder of the Master Fund, in proportion to the votes received by the Master Fund from all other interest holders of the Master Fund.
Information regarding how the Funds voted proxies relating to portfolio securities during the most recent 12-month period ended June 30 is available, without charge, upon request, on the MassMutual website at http://www.massmutual.com/funds and on the Securities and Exchange Commission’s website at http://www.sec.gov.
B-138
AMERICAN CENTURY INVESTMENT MANAGEMENT, INC.
PROXY VOTING POLICIES
American Century Investment Management, Inc. (“American Century”) is the investment manager for a variety of advisory clients, including the American Century family of mutual funds. In such capacity, American Century has been delegated the authority to vote proxies with respect to investments held in the accounts it manages. The following is a statement of the proxy voting policies that have been adopted by American Century. In the exercise of proxy voting authority which has been delegated to it by particular clients, American Century will apply the following policies in accordance with, and subject to, any specific policies that have been adopted by the client and communicated to and accepted by American Century in writing.
A. General Principles
In providing the service of voting client proxies, American Century is guided by general fiduciary principles, must act prudently, solely in the interest of its clients, and must not subordinate client interests to unrelated objectives. Except as otherwise indicated in these Policies, American Century will vote all proxies with respect to investments held in the client accounts it manages. American Century will attempt to consider all factors of its vote that could affect the value of the investment. Although in most instances American Century will vote proxies consistently across all client accounts, the votes will be based on the best interests of each client. As a result, accounts managed by American Century may at times vote differently on the same proposals. Examples of when an account’s vote might differ from other accounts managed by American Century include, but are not limited to, proxy contests and proposed mergers. In short, American Century will vote proxies in the manner that it believes will do the most to maximize shareholder value.
B. Specific Proxy Matters
| 1. | Routine Matters |
| a. | Election of Directors |
| (1) | Generally. American Century will generally support the election of directors that result in a board made up of a majority of independent directors. In general, American Century will vote in favor of management’s director nominees if they are running unopposed. American Century believes that management is in the best possible position to evaluate the qualifications of directors and the needs and dynamics of a particular board. American Century of course maintains the ability to vote against any candidate whom it feels is not qualified or if there are specific concerns about the individual, such as allegations of criminal wrongdoing or breach of fiduciary responsibilities. Additional information American Century may consider concerning director nominees include, but is not limited to, whether (1) there is an adequate explanation for repeated absences at board meetings, (2) the nominee receives non-board fee compensation, or (3) there is a family relationship between the nominee and the company’s chief executive officer or controlling shareholder. When management’s nominees are opposed in a proxy contest, American Century will evaluate which nominees’ publicly-announced management policies and goals are most likely to maximize shareholder value, as well as the past performance of the incumbents. |
| (2) | Committee Service. American Century will withhold votes for non-independent directors who serve on the audit, compensation, and/or nominating committees of the board. |
| (3) | Classification of Boards. American Century will support proposals that seek to declassify boards. Conversely, American Century will oppose efforts to adopt classified board structures. |
| (4) | Majority Independent Board. American Century will support proposals calling for a majority of independent directors on a board. American Century believes that a majority of independent directors can help to facilitate objective decision making and enhances accountability to shareholders. |
B-139
| (5) | Majority Vote Standard for Director Elections. American Century will vote in favor of proposals calling for directors to be elected by an affirmative majority of the votes cast in a board election, provided that the proposal allows for a plurality voting standard in the case of contested elections. American Century may consider voting against such shareholder proposals where a company’s board has adopted an alternative measure, such as a director resignation policy, that provides a meaningful alternative to the majority voting standard and appropriately addresses situations where an incumbent director fails to receive the support of the majority of the votes cast in an uncontested election. |
| (6) | Withholding Campaigns. American Century will support proposals calling for shareholders to withhold votes for directors where such actions will advance the principles set forth in paragraphs (1) through (5) above. |
| b. | Ratification of Selection of Auditors |
American Century will generally rely on the judgment of the issuer’s audit committee in selecting the independent auditors who will provide the best service to the company. American Century believes that independence of the auditors is paramount and will vote against auditors whose independence appears to be impaired. American Century will vote against proposed auditors in those circumstances where (1) an auditor has a financial interest in or association with the company, and is therefore not independent; (2) non-audit fees comprise more than 50% of the total fees paid by the company to the audit firm; or (3) there is reason to believe that the independent auditor has previously rendered an opinion to the issuer that is either inaccurate or not indicative of the company’s financial position.
| 2. | Compensation Matters |
| a. | Executive Compensation |
| (1) | Advisory Vote on Compensation. American Century believes there are more effective ways to convey concerns about compensation than through an advisory vote on compensation (such as voting against specific excessive incentive plans or withholding votes from compensation committee members). American Century will consider and vote on a case-by-case basis on say-on-pay proposals and will generally support management proposals unless specific concerns exist, including if American Century concludes that executive compensation is (i) misaligned with shareholder interests, (ii) unreasonable in amount, or (iii) not in the aggregate meaningfully tied to the company’s performance. |
| (2) | Frequency of Advisory Votes on Compensation. American Century generally supports the triennial option for the frequency of say-on-pay proposals, but will consider management recommendations for an alternative approach. |
| b. | Equity Based Compensation Plans |
American Century believes that equity-based incentive plans are economically significant issues upon which shareholders are entitled to vote. American Century recognizes that equity-based compensation plans can be useful in attracting and maintaining desirable employees. The cost associated with such plans must be measured if plans are to be used appropriately to maximize shareholder value. American Century will conduct a case-by-case analysis of each stock option, stock bonus or similar plan or amendment, and generally approve management’s recommendations with respect to adoption of or amendments to a company’s equity-based compensation plans, provided that the total number of shares reserved under all of a company’s plans is reasonable and not excessively dilutive.
American Century will review equity-based compensation plans or amendments thereto on a case-by-case basis. Factors that will be considered in the determination include the company’s overall
B-140
capitalization, the performance of the company relative to its peers, and the maturity of the company and its industry; for example, technology companies often use options broadly throughout its employee base which may justify somewhat greater dilution.
Amendments which are proposed in order to bring a company’s plan within applicable legal requirements will be reviewed by American Century’s legal counsel; amendments to executive bonus plans to comply with IRS Section 162(m) disclosure requirements, for example, are generally approved.
American Century will generally vote against the adoption of plans or plan amendments that:
| • | Provide for immediate vesting of all stock options in the event of a change of control of the company without reasonable safeguards against abuse (see “Anti-Takeover Proposals” below); |
| • | Reset outstanding stock options at a lower strike price unless accompanied by a corresponding and proportionate reduction in the number of shares designated. American Century will generally oppose adoption of stock option plans that explicitly or historically permit repricing of stock options, regardless of the number of shares reserved for issuance, since their effect is impossible to evaluate; |
| • | Establish restriction periods shorter than three years for restricted stock grants; |
| • | Do not reasonably associate awards to performance of the company; or |
| • | Are excessively dilutive to the company. |
| 3. | Anti-Takeover Proposals |
In general, American Century will vote against any proposal, whether made by management or shareholders, which American Century believes would materially discourage a potential acquisition or takeover. In most cases an acquisition or takeover of a particular company will increase share value. The adoption of anti-takeover measures may prevent or frustrate a bid from being made, may prevent consummation of the acquisition, and may have a negative effect on share price when no acquisition proposal is pending. The items below discuss specific anti-takeover proposals.
| a. | Cumulative Voting |
American Century will vote in favor of any proposal to adopt cumulative voting and will vote against any proposal to eliminate cumulative voting that is already in place, except in cases where a company has a staggered board. Cumulative voting gives minority shareholders a stronger voice in the company and a greater chance for representation on the board. American Century believes that the elimination of cumulative voting constitutes an anti-takeover measure.
| b. | Staggered Board |
If a company has a “staggered board,” its directors are elected for terms of more than one year and only a segment of the board stands for election in any year. Therefore, a potential acquiror cannot replace the entire board in one year even if it controls a majority of the votes. Although staggered boards may provide some degree of continuity and stability of leadership and direction to the board of directors, American Century believes that staggered boards are primarily an anti-takeover device and will vote against establishing them and for eliminating them. However, American Century does not necessarily vote against the re-election of directors serving on staggered boards.
B-141
| c. | “Blank Check” Preferred Stock |
Blank check preferred stock gives the board of directors the ability to issue preferred stock, without further shareholder approval, with such rights, preferences, privileges and restrictions as may be set by the board. In response to a hostile takeover attempt, the board could issue such stock to a friendly party or “white knight” or could establish conversion or other rights in the preferred stock which would dilute the common stock and make an acquisition impossible or less attractive. The argument in favor of blank check preferred stock is that it gives the board flexibility in pursuing financing, acquisitions or other proper corporate purposes without incurring the time or expense of a shareholder vote. Generally, American Century will vote against blank check preferred stock. However, American Century may vote in favor of blank check preferred if the proxy statement discloses that such stock is limited to use for a specific, proper corporate objective as a financing instrument.
| d. | Elimination of Preemptive Rights |
When a company grants preemptive rights, existing shareholders are given an opportunity to maintain their proportional ownership when new shares are issued. A proposal to eliminate preemptive rights is a request from management to revoke that right.
While preemptive rights will protect the shareholder from having its equity diluted, it may also decrease a company’s ability to raise capital through stock offerings or use stock for acquisitions or other proper corporate purposes. Preemptive rights may therefore result in a lower market value for the company’s stock. In the long term, shareholders could be adversely affected by preemptive rights. American Century generally votes against proposals to grant preemptive rights, and for proposals to eliminate preemptive rights.
| e. | Non-targeted Share Repurchase |
A non-targeted share repurchase is generally used by company management to prevent the value of stock held by existing shareholders from deteriorating. A non-targeted share repurchase may reflect management’s belief in the favorable business prospects of the company. American Century finds no disadvantageous effects of a non-targeted share repurchase and will generally vote for the approval of a non-targeted share repurchase subject to analysis of the company’s financial condition.
| f. | Increase in Authorized Common Stock |
The issuance of new common stock can also be viewed as an anti-takeover measure, although its effect on shareholder value would appear to be less significant than the adoption of blank check preferred. American Century will evaluate the amount of the proposed increase and the purpose or purposes for which the increase is sought. If the increase is not excessive and is sought for proper corporate purposes, the increase will be approved. Proper corporate purposes might include, for example, the creation of additional stock to accommodate a stock split or stock dividend, additional stock required for a proposed acquisition, or additional stock required to be reserved upon exercise of employee stock option plans or employee stock purchase plans. Generally, American Century will vote in favor of an increase in authorized common stock of up to 100%; increases in excess of 100% are evaluated on a case-by-case basis, and will be voted affirmatively if management has provided sound justification for the increase.
| g. | “Supermajority” Voting Provisions or Super Voting Share Classes |
A “supermajority” voting provision is a provision placed in a company’s charter documents which would require a “supermajority” (ranging from 66 to 90%) of shareholders and shareholder votes to approve any type of acquisition of the company. A super voting share class grants one class of
B-142
shareholders a greater per-share vote than those of shareholders of other voting classes. American Century believes that these are standard anti-takeover measures and will generally vote against them. The supermajority provision makes an acquisition more time-consuming and expensive for the acquiror. A super voting share class favors one group of shareholders disproportionately to economic interest. Both are often proposed in conjunction with other anti-takeover measures.
| h. | “Fair Price” Amendments |
This is another type of charter amendment that would require an offeror to pay a “fair” and uniform price to all shareholders in an acquisition. In general, fair price amendments are designed to protect shareholders from coercive, two-tier tender offers in which some shareholders may be merged out on disadvantageous terms. Fair price amendments also have an anti-takeover impact, although their adoption is generally believed to have less of a negative effect on stock price than other anti-takeover measures. American Century will carefully examine all fair price proposals. In general, American Century will vote against fair price proposals unless American Century concludes that it is likely that the share price will not be negatively affected and the proposal will not have the effect of discouraging acquisition proposals.
| i. | Limiting the Right to Call Special Shareholder Meetings. |
The corporation statutes of many states allow minority shareholders at a certain threshold level of ownership (frequently 10%) to call a special meeting of shareholders. This right can be eliminated (or the threshold increased) by amendment to the company’s charter documents. American Century believes that the right to call a special shareholder meeting is significant for minority shareholders; the elimination of such right will be viewed as an anti-takeover measure and American Century will generally vote against proposals attempting to eliminate this right and for proposals attempting to restore it.
| j. | Poison Pills or Shareholder Rights Plans |
Many companies have now adopted some version of a poison pill plan (also known as a shareholder rights plan). Poison pill plans generally provide for the issuance of additional equity securities or rights to purchase equity securities upon the occurrence of certain hostile events, such as the acquisition of a large block of stock.
The basic argument against poison pills is that they depress share value, discourage offers for the company and serve to “entrench” management. The basic argument in favor of poison pills is that they give management more time and leverage to deal with a takeover bid and, as a result, shareholders may receive a better price. American Century believes that the potential benefits of a poison pill plan are outweighed by the potential detriments. American Century will generally vote against all forms of poison pills.
American Century will, however, consider on a case-by-case basis poison pills that are very limited in time and preclusive effect. American Century will generally vote in favor of such a poison pill if it is linked to a business strategy that will – in our view – likely result in greater value for shareholders, if the term is less than three years, and if shareholder approval is required to reinstate the expired plan or adopt a new plan at the end of this term.
| k. | Golden Parachutes |
Golden parachute arrangements provide substantial compensation to executives who are terminated as a result of a takeover or change in control of their company. The existence of such plans in reasonable amounts probably has only a slight anti-takeover effect. In voting, American Century will evaluate the specifics of the plan presented.
B-143
| l. | Reincorporation |
Reincorporation in a new state is often proposed as one part of a package of anti-takeover measures. Several states (such as Pennsylvania, Ohio and Indiana) now provide some type of legislation that greatly discourages takeovers. Management believes that Delaware in particular is beneficial as a corporate domicile because of the well-developed body of statutes and case law dealing with corporate acquisitions.
American Century will examine reincorporation proposals on a case-by-case basis. Generally, if American Century believes that the reincorporation will result in greater protection from takeovers, the reincorporation proposal will be opposed. American Century will also oppose reincorporation proposals involving jurisdictions that specify that directors can recognize non-shareholder interests over those of shareholders. When reincorporation is proposed for a legitimate business purpose and without the negative effects identified above, American Century will generally vote affirmatively.
| m. | Confidential Voting |
Companies that have not previously adopted a “confidential voting” policy allow management to view the results of shareholder votes. This gives management the opportunity to contact those shareholders voting against management in an effort to change their votes.
Proponents of secret ballots argue that confidential voting enables shareholders to vote on all issues on the basis of merit without pressure from management to influence their decision. Opponents argue that confidential voting is more expensive and unnecessary; also, holding shares in a nominee name maintains shareholders’ confidentiality. American Century believes that the only way to insure anonymity of votes is through confidential voting, and that the benefits of confidential voting outweigh the incremental additional cost of administering a confidential voting system. Therefore, American Century will generally vote in favor of any proposal to adopt confidential voting.
| n. | Opting In or Out of State Takeover Laws |
State takeover laws typically are designed to make it more difficult to acquire a corporation organized in that state. American Century believes that the decision of whether or not to accept or reject offers of merger or acquisition should be made by the shareholders, without unreasonably restrictive state laws that may impose ownership thresholds or waiting periods on potential acquirors. Therefore, American Century will generally vote in favor of opting out of restrictive state takeover laws.
| 4. | Transaction Related Proposals |
American Century will review transaction related proposals, such as mergers, acquisitions, and corporate reorganizations, on a case-by-case basis, taking into consideration the impact of the transaction on each client account. In some instances, such as the approval of a proposed merger, a transaction may have a differential impact on client accounts depending on the securities held in each account. For example, whether a merger is in the best interest of a client account may be influenced by whether an account holds, and in what proportion, the stock of both the acquirer and the acquiror. In these circumstances, American Century may determine that it is in the best interests of the accounts to vote the accounts’ shares differently on proposals related to the same transaction.
| 5. | Other Matters |
| a. | Shareholder Proposals Involving Social, Moral or Ethical Matters |
American Century will generally vote in accordance with management’s recommendation on issues that primarily involve social, moral or ethical matters, such as the MacBride Principles pertaining to
B-144
operations in Northern Ireland. While the resolution of such issues may have an effect on shareholder value, the precise economic effect of such proposals, and individual shareholder’s preferences regarding such issues, is often unclear. Where this is the case, American Century believes it is generally impossible to know how to vote in a manner that would accurately reflect the views of American Century’s clients, and therefore will review management’s assessment of the economic effect of such proposals and rely upon it if American Century believes its assessment is not unreasonable.
Shareholders may also introduce social, moral or ethical proposals which are the subject of existing law or regulation. Examples of such proposals would include a proposal to require disclosure of a company’s contributions to political action committees or a proposal to require a company to adopt a non-smoking workplace policy. American Century believes that such proposals are better addressed outside the corporate arena, and will generally vote with management’s recommendation; in addition, American Century will generally vote against any proposal which would require a company to adopt practices or procedures which go beyond the requirements of existing, directly applicable law.
| b. | Anti-Greenmail Proposals |
“Anti-greenmail” proposals generally limit the right of a corporation, without a shareholder vote, to pay a premium or buy out a 5% or greater shareholder. Management often argues that they should not be restricted from negotiating a deal to buy out a significant shareholder at a premium if they believe it is in the best interest of the company. Institutional shareholders generally believe that all shareholders should be able to vote on such a significant use of corporate assets. American Century believes that any repurchase by the company at a premium price of a large block of stock should be subject to a shareholder vote. Accordingly, it will generally vote in favor of anti-greenmail proposals.
| c. | Indemnification |
American Century will generally vote in favor of a corporation’s proposal to indemnify its officers and directors in accordance with applicable state law. Indemnification arrangements are often necessary in order to attract and retain qualified directors. The adoption of such proposals appears to have little effect on share value.
| d. | Non-Stock Incentive Plans |
Management may propose a variety of cash-based incentive or bonus plans to stimulate employee performance. In general, the cash or other corporate assets required for most incentive plans is not material, and American Century will vote in favor of such proposals, particularly when the proposal is recommended in order to comply with IRC Section 162(m) regarding salary disclosure requirements. Case-by-case determinations will be made of the appropriateness of the amount of shareholder value transferred by proposed plans.
| e. | Director Tenure |
These proposals ask that age and term restrictions be placed on the board of directors. American Century believes that these types of blanket restrictions are not necessarily in the best interests of shareholders and therefore will vote against such proposals, unless they have been recommended by management.
B-145
| f. | Directors’ Stock Options Plans |
American Century believes that stock options are an appropriate form of compensation for directors, and American Century will generally vote for director stock option plans which are reasonable and do not result in excessive shareholder dilution. Analysis of such proposals will be made on a case-by-case basis, and will take into account total board compensation and the company’s total exposure to stock option plan dilution.
| g. | Director Share Ownership |
American Century will generally vote against shareholder proposals which would require directors to hold a minimum number of the company’s shares to serve on the Board of Directors, in the belief that such ownership should be at the discretion of Board members.
| h. | Non-U.S. Proxies |
American Century will generally evaluate non-U.S. proxies in the context of the voting policies expressed herein but will also, where feasible, take into consideration differing laws, regulations, and practices in the relevant foreign market in determining if and how to vote. There may also be circumstances when practicalities and costs involved with non-U.S. investing make it disadvantageous to vote shares. For instance, American Century generally does not vote proxies in circumstances where share blocking restrictions apply, when meeting attendance is required in person, or when current share ownership disclosure is required.
C. Use of Proxy Advisory Services
American Century takes into account information from many different sources, including independent proxy advisory services. However, the decision on how to vote proxies will be made by American Century in accordance with these policies and will not be delegated to a proxy advisory service.
D. Monitoring Potential Conflicts of Interest
Corporate management has a strong interest in the outcome of proposals submitted to shareholders. As a consequence, management often seeks to influence large shareholders to vote with their recommendations on particularly controversial matters. In the vast majority of cases, these communications with large shareholders amount to little more than advocacy for management’s positions and give American Century’s staff the opportunity to ask additional questions about the matter being presented. Companies with which American Century has direct business relationships could theoretically use these relationships to attempt to unduly influence the manner in which American Century votes on matters for its clients. To ensure that such a conflict of interest does not affect proxy votes cast for American Century’s clients, our proxy voting personnel regularly catalog companies with whom American Century has significant business relationships; all discretionary (including case-by-case) voting for these companies will be voted by the client or an appropriate fiduciary responsible for the client (e.g., a committee of the independent directors of a fund or the trustee of a retirement plan).
In addition, to avoid any potential conflict of interest that may arise when one American Century mutual fund owns shares of another American Century mutual fund, American Century will “echo vote” such shares, if possible. Echo voting means American Century will vote the shares in the same proportion as the vote of all of the other holders of the fund’s shares. So, for example, if shareholders of a fund cast 80% of their votes in favor of a proposal and 20% against the proposal, any American Century fund that owns shares of such fund will cast 80% of its shares in favor of the proposal and 20% against. When this is not possible (as in the case of the “NT” funds, where the One Choice Target Date funds are the sole shareholder), the shares of the underlying fund (e.g. the
B-146
“NT” fund) will be voted in the same proportion as the vote of the shareholders of the corresponding American Century policy portfolio for proposals common to both funds. For example, NT Growth Fund shares will be echo voted in accordance with the votes of the Growth Fund shareholders. In the case where the policy portfolio does not have a common proposal, shares will be voted in consultation with a committee of the independent directors.
************************************************************
The voting policies expressed above are of course subject to modification in certain circumstances and will be reexamined from time to time. With respect to matters that do not fit in the categories stated above, American Century will exercise its best judgment as a fiduciary to vote in the manner which will most enhance shareholder value.
Case-by-case determinations will be made by American Century’s staff, which is overseen by the General Counsel of American Century, in consultation with equity managers. Electronic records will be kept of all votes made.
B-147
BARROW, HANLEY, MEWHINNEY & STRAUSS, LLC
Proxy Voting
Barrow, Hanley, Mewhinney & Strauss (“BHMS”) has the responsibility to vote proxies for equity securities for its clients who have delegated this responsibility to us. BHMS’ fiduciary duty requires us to vote the proxies in the best economic interests of our clients, the beneficial owners of the securities. BHMS has adopted this Proxy Voting Policy and maintains written procedures for the handling, research, voting, and reporting of the proxy votes and makes appropriate disclosures about proxy voting on behalf of our clients. Disclosure information about the Firm’s Proxy Voting is included in BHMS’ Form ADV Part 2.
To assist in the proxy voting process, BHMS retains the services of Glass Lewis & Co. Glass Lewis provides:
| • | Research on corporate governance, financial statements, business, legal and accounting risks; |
| • | Proxy voting recommendations, including ESG (Environmental, Social and Governance) voting guidelines; |
| • | Portfolio accounting and reconciliation of shareholdings for voting purposes; |
| • | Proxy voting execution, record keeping, and reporting services. |
Proxy Oversight Committee, Proxy Coordinators, and Proxy Voting Committee
| • | BHMS’ Proxy Oversight Committee is responsible for implementing and monitoring BHMS’ proxy voting policy, procedures, disclosures and recordkeeping, including outlining our voting guidelines in our procedures. The Proxy Oversight Committee conducts periodic reviews to monitor and ensure that the Firm’s policy is observed, implemented properly, and amended or updated, as appropriate. The Proxy Oversight Committee is made up of the CCO/CRO, the Responsible Investing Committee lead, the director of equity operations, the ESG research coordinator, and an at-large portfolio manager. |
| • | BHMS’ proxy coordinators review and organize the data and recommendations provided by the proxy service. The proxy coordinators are responsible for ensuring that the proxy ballots are routed to the appropriate research analyst based on industry sector coverage. Proxy coordinators are assigned from the equity operations department. |
| • | BHMS research analysts review and evaluate proxy proposals and make written recommendations to the Proxy Voting Committee to ensure that votes are consistent with the Firm’s analysis and are in the best interest of the shareholders, our clients. |
| • | BHMS equity portfolio managers are members of the Proxy Voting Committee. Equity portfolio managers vote proxy proposals based on share ownership after giving consideration to BHMS’ Proxy Voting Guidelines, internal research recommendations, and the opinion of Glass Lewis. Proxy votes must be approved by the Proxy Voting Committee before submitting to the proxy service provider. |
| • | Voting proxies for the Diversified Small Cap Value and Diversified Small/Mid Cap Value accounts is done in accordance with the proxy service provider’s recommendations for the following reasons: |
| Ø | Investments are based on a quantitative model. Fundamental research is not performed for the holdings. |
| Ø | The holding period is too short to justify the time for analysis to vote. |
Conflicts of Interest
| • | Potential conflicts may arise when BHMS invests in equity securities of corporations who are also clients of the Firm. BHMS seeks to mitigate potential conflicts by: |
| Ø | Making voting decisions for the benefit of the shareholder(s), our clients; |
B-148
| Ø | Uniformly voting every proxy based on BHMS’ internal research and consideration of Glass Lewis’ recommendations; and |
| Ø | Documenting the votes of companies who are also clients of the Firm. |
| • | If a material conflict of interest exists, members from the Proxy Voting and Oversight Committees will determine if the clients should have an opportunity to vote their proxies themselves, or to address the voting issue through other objective means, such as voting in a manner consistent with a predetermined voting policy or accepting the voting recommendation of Glass Lewis. |
Other Policies and Procedures
| • | BHMS sends a daily electronic transfer of equity positions to the proxy service provider. |
| • | The proxy service provider identifies accounts eligible to vote for each security and posts the proposals and research on its secure, proprietary online system. |
| • | BHMS sends a proxy report to clients at least annually (or as requested by client), listing the number of shares voted and disclosing how proxies were voted. |
| • | Voting records are retained on the network, which is backed up daily. The proxy service provider retains records for seven years. |
| • | BHMS’ Proxy Voting Guidelines are available upon request by calling: (214) 665-1900, or by e-mailing: clientservices@barrowhanley.com. |
| • | The proxy coordinators retain the following proxy records for at least seven years: |
| Ø | These policies and procedures and any amendments; |
| Ø | Proxy statements received regarding our clients’ securities; |
| Ø | A record of each proxy we voted; |
| Ø | Proxy voting reports that are sent to clients annually; |
| Ø | Any document BHMS created that was material to making a decision on how to vote proxies, or that memorializes that decision; and |
| Ø | Records of any client’s request for proxy voting information. |
Revised December 31, 2016
B-149
BLACKROCK INVESTMENT MANAGEMENT, LLC
Procedures Governing Delegation of Proxy Voting to Fund Adviser
July 1, 2011
Revised May 9, 2014
I. INTRODUCTION
The Trustees/Directors (“Directors”) of the BlackRock-Advised Funds other than the iShares Funds1 (the “Funds”) have the responsibility for voting proxies relating to portfolio securities of the Funds, and have determined that it is in the best interests of the Funds and their shareholders to delegate that responsibility to BlackRock Advisors, LLC and its affiliated U.S. registered investment advisers (“BlackRock”), the investment adviser to the Funds, as part of BlackRock’s authority to manage, acquire and dispose of account assets. The Directors hereby direct BlackRock to vote such proxies in accordance with this Policy, and any proxy voting guidelines that the Adviser determines are appropriate and in the best interests of the Funds’ shareholders and which are consistent with the principles outlined in this Policy. Individual series of the Funds may be specifically excluded from this Policy by the Directors by virtue of the adoption of alternative proxy voting policy for such series. The Directors have authorized BlackRock to utilize unaffiliated third-parties as its agents to vote portfolio proxies in accordance with this Policy and to maintain records of such portfolio proxy voting.
Rule 206(4)-6 under the Investment Advisers Act of 1940 requires, among other things, that an investment adviser that exercises voting authority over clients’ proxy voting adopt policies and procedures reasonably designed to ensure that the adviser votes proxies in the best interests of clients, discloses to its clients information about those policies and procedures and also discloses to clients how they may obtain information on how the adviser has voted their proxies.
BlackRock has adopted guidelines and procedures that are consistent with the principles of this Policy. BlackRock’s corporate governance committee structure (the “Committee”), oversees the proxy voting function on behalf of BlackRock and its clients, including the Funds. The Committee is comprised of senior members of BlackRock’s Portfolio Management and Administration Groups and is advised by BlackRock’s Legal and Compliance Department.
BlackRock votes (or refrains from voting) proxies for each Fund in a manner that BlackRock, in the exercise of its independent business judgment, concludes is in the best economic interests of such Fund. In some cases, BlackRock may determine that it is in the best economic interests of a Fund to refrain from exercising the Fund’s proxy voting rights (such as, for example, proxies on certain non-U.S. securities that might impose costly or time-consuming in-person voting requirements). With regard to the relationship between securities lending and proxy voting, BlackRock’s approach is also driven by our clients’ economic interests. The evaluation of the economic desirability of recalling loans involves balancing the revenue producing value of loans against the likely economic value of casting votes. Based on our evaluation of this relationship, BlackRock believes that the likely economic value of casting a vote generally is less than the securities lending income, either because the votes will not have significant economic consequences or because the outcome of the vote would not be affected by BlackRock recalling loaned securities in order to ensure they are voted. Periodically, BlackRock analyzes the process and benefits of voting proxies for securities on loan, and will consider whether any modification of its proxy voting policies or procedures are necessary in light of any regulatory changes.
BlackRock will normally vote on specific proxy issues in accordance with BlackRock’s proxy voting guidelines. BlackRock’s proxy voting guidelines provide detailed guidance as to how to vote proxies on certain important or commonly raised issues. BlackRock may, in the exercise of its business judgment, conclude that the proxy voting guidelines do not cover the specific matter upon which a proxy vote is requested, or that an
1 The US iShares Funds have adopted a separate Proxy Voting Policy.
B-150
exception to the proxy voting guidelines would be in the best economic interests of a Fund. BlackRock votes (or refrains from voting) proxies without regard to the relationship of the issuer of the proxy (or any shareholder of such issuer) to the Fund, the Fund’s affiliates (if any), BlackRock or BlackRock’s affiliates. When voting proxies, BlackRock attempts to encourage companies to follow practices that enhance shareholder value and increase transparency and allow the market to place a proper value on their assets.
II. PROXY VOTING POLICIES
A. Boards of Directors
The Funds generally support the board’s nominees in the election of directors and generally support proposals that strengthen the independence of boards of directors. As a general matter, the Funds believe that a company’s board of directors (rather than shareholders) is most likely to have access to important, nonpublic information regarding a company’s business and prospects, and is therefore best-positioned to set corporate policy and oversee management. The Funds therefore believe that the foundation of good corporate governance is the election of responsible, qualified, independent corporate directors who are likely to diligently represent the interests of shareholders and oversee management of the corporation in a manner that will seek to maximize shareholder value over time. In individual cases, consideration may be given to a director nominee’s history of representing shareholder interests as a director of the company issuing the proxy or other companies, or other factors to the extent deemed relevant by the Committee.
B. Auditors
These proposals concern those issues submitted to shareholders related to the selection of auditors. As a general matter, the Funds believe that corporate auditors have a responsibility to represent the interests of shareholders and provide an independent view on the propriety of financial reporting decisions of corporate management. While the Funds anticipate that BlackRock will generally defer to a corporation’s choice of auditor, in individual cases, consideration may be given to an auditors’ history of representing shareholder interests as auditor of the company issuing the proxy or other companies, to the extent deemed relevant.
C. Compensation and Benefits
These proposals concern those issues submitted to shareholders related to management compensation and employee benefits. As a general matter, the Funds favor disclosure of a company’s compensation and benefit policies and oppose excessive compensation, but believe that compensation matters are normally best determined by a corporation’s board of directors, rather than shareholders. Proposals to “micro-manage” a company’s compensation practices or to set arbitrary restrictions on compensation or benefits should therefore generally not be supported.
D. Capital Structure
These proposals relate to various requests, principally from management, for approval of amendments that would alter the capital structure of a company, such as an increase in authorized shares. As a general matter, the Funds expect that BlackRock will support requests that it believes enhance the rights of common shareholders and oppose requests that appear to be unreasonably dilutive.
E. Corporate Charter and By-Laws
These proposals relate to various requests for approval of amendments to a corporation’s charter or by-laws. As a general matter, the Funds generally vote against anti-takeover proposals and proposals that would create additional barriers or costs to corporate transactions that are likely to deliver a premium to shareholders.
B-151
F. Environmental and Social Issues
These are shareholder proposals addressing either corporate social and environmental policies or requesting specific reporting on these issues. The Funds generally do not support proposals on social issues that lack a demonstrable economic benefit to the issuer and the Fund investing in such issuer. BlackRock seeks to make proxy voting decisions in the manner most likely to protect and promote the long-term economic value of the securities held in client accounts. We intend to support economically advantageous corporate practices while leaving direct oversight of company management and strategy to boards of directors. We seek to avoid micromanagement of companies, as we believe that a company’s board of directors is best positioned to represent shareholders and oversee management on shareholders behalf. Issues of corporate social and environmental responsibility are evaluated on a case-by-case basis within this framework.
| III. | CONFLICTS MANAGEMENT |
BlackRock maintains policies and procedures that are designed to prevent any relationship between the issuer of the proxy (or any shareholder of the issuer) and a Fund, a Fund’s affiliates (if any), BlackRock or BlackRock’s affiliates, from having undue influence on BlackRock’s proxy voting activity. In certain instances, BlackRock may determine to engage an independent fiduciary to vote proxies as a further safeguard against potential conflicts of interest or as otherwise required by applicable law. The independent fiduciary may either vote such proxies or provide BlackRock with instructions as to how to vote such proxies. In the latter case, BlackRock votes the proxy in accordance with the independent fiduciary’s determination.
| IV. | REPORTS TO THE BOARD |
BlackRock will report to the Directors on proxy votes it has made on behalf of the Funds at least annually.
B-152
BRANDYWINE GLOBAL INVESTMENT MANAGEMENT, LLC
Proxy Voting
| I. | Client Accounts for which Brandywine Global Votes Proxies |
Brandywine Global shall vote proxies for each client account for which the client:
| (i) | has specifically authorized Brandywine Global to vote proxies in the applicable investment management agreement or other written instrument; or |
| (ii) | without specifically authorizing Brandywine Global to vote proxies, has granted general investment discretion to Brandywine Global in the applicable investment management agreement. |
Also, Brandywine Global shall vote proxies for any employee benefit plan client subject to the Employee Retirement Income Security Act of 1974, as amended (“ERISA”), unless the investment management agreement specifically reserves the responsibility for voting proxies to the plan trustees or other named fiduciary.
At or prior to inception of each client account, Brandywine Global shall determine whether it has proxy voting authority over such account.
| II. | General Principles |
In exercising discretion to vote proxies for securities held in client accounts, Brandywine Global is guided by general fiduciary principles. Brandywine Global’s goal in voting proxies is to act prudently and solely in the best economic interest of its clients for which it is voting proxies. In furtherance of such goal, Brandywine Global will vote proxies in a manner that Brandywine Global believes will be consistent with efforts to maximize shareholder values. Brandywine Global does not exercise its proxy voting discretion to further policy, political or other issues that have no connection to enhancing the economic value of the client’s investment.
| III. | How Brandywine Global Votes Proxies |
Appendix A sets forth general guidelines considered by Brandywine Global and its portfolio management teams in voting common proxy items.
In the case of a proxy issue for which there is a stated position set forth in Appendix A, Brandywine Global generally votes in accordance with the stated position. In the case of a proxy issue for which there is a list of factors set forth in Appendix A that Brandywine Global considers in voting on such issue, Brandywine Global considers those factors and votes on a case-by-case basis in accordance with the general principles described in Section II. In the case of a proxy issue for which there is no stated position or list of factors set forth in Appendix A that Brandywine Global considers in voting on such issue, Brandywine Global votes on a case-by-case basis in accordance with the general principles described in Section II.
The general guidelines set forth in Appendix A are not binding on Brandywine Global and its portfolio management teams, but rather are intended to provide an analytical framework for the review and assessment of common proxy issues. Such guidelines can always be superseded by a portfolio management team based on the team’s assessment of the proxy issue and determination that a vote that is contrary to such general guidelines is in the best economic interests of the client accounts for which the team is responsible. Different portfolio management teams may vote differently on the same issue based on their respective assessments of the proxy issue and determinations as to what is in the best economic interests of client accounts for which they are responsible. In addition, a team may adopt proxy voting policies that supplement these policies and procedures.
In the case of Taft-Hartley clients, Brandywine Global will comply with a client direction to vote proxies in accordance with Glass Lewis & Co. PVS Proxy Voting Guidelines, which Glass Lewis & Co. represents to be fully consistent with AFL-CIO guidelines.
B-153
| IV. | Use of an Independent Proxy Service Firm |
Brandywine Global may contract with an independent proxy service firm to provide Brandywine Global with information and/or recommendations with regard to proxy votes. Any such information and/or recommendations will be made available to Brandywine Global’s portfolio management teams, but Brandywine Global and its portfolio management teams are not required to follow any recommendation furnished by such service provider. The use of an independent proxy service firm to provide proxy voting information and/or recommendations does not relieve Brandywine Global of its responsibility for any proxy votes.
With respect to any independent proxy service firm engaged by Brandywine Global to provide Brandywine Global with information and/or recommendations with regard to proxy votes, Brandywine Global’s Proxy Administrator shall periodically review and assess such firm’s policies, procedures and practices with respect to the disclosure and handling of conflicts of interest as well as obtain an annual certificate from the firm that its conflict procedures have been implemented.
| V. | Conflict of Interest Procedures |
In furtherance of Brandywine Global’s goal to vote proxies in the best interests of clients, Brandywine Global follows procedures designed to identify and address material conflicts that may arise between the interests of Brandywine Global and its employees and those of its clients before voting proxies on behalf of such clients. Conflicts of interest may arise both at the firm level and as a result of an employee’s personal relationships or circumstances.
| (1) | Procedures for Identifying Conflicts of Interest |
Brandywine Global relies on the procedures set forth below to seek to identify conflicts of interest with respect to proxy voting.
| A. | Brandywine Global’s Compliance Department annually requires each Brandywine Global employee, including those involved in proxy voting decisions (“Voting Persons”), to complete a questionnaire designed to elicit information that may reveal potential conflicts between the employee’s interests and those of Brandywine Global clients. |
| B. | Brandywine Global treats significant client relationships as creating a conflict of interest for Brandywine Global in voting proxies with respect to securities issued by such client or its known affiliates. |
| C. | As a general matter, Brandywine Global takes the position that relationships between a non-Brandywine Global Legg Mason business unit and an issuer (e.g., investment management relationship between an issuer and a non-Brandywine Global Legg Mason investment adviser affiliate) do not present a conflict of interest for Brandywine Global in voting proxies with respect to such issuer because Brandywine Global operates as an independent business unit from other Legg Mason business units and because of the existence of informational barriers between Brandywine Global and certain other Legg Mason business units. |
| (2) | Procedures for Assessing Materiality of Conflicts of Interest |
| A. | All potential conflicts of interest identified pursuant to the procedures outlined in Section V.(1)A. must be brought to the attention of the Investment Committee for resolution. |
| B. | The Investment Committee shall determine whether a conflict of interest is material. A conflict of interest shall be considered material to the extent that it is determined that such conflict is likely to influence, or appear to influence, Brandywine Global’s decision-making in voting the proxy. All materiality determinations will be based on an assessment of the particular facts and circumstances. A written record of all materiality determinations made by the Investment Committee shall be maintained. |
B-154
| C. | If it is determined by the Investment Committee that a conflict of interest is not material, Brandywine Global may vote proxies following normal processes notwithstanding the existence of the conflict. |
| (3) | Procedures for Addressing Material Conflicts of Interest |
| A. | If it is determined by the Investment Committee that a conflict of interest is material, the Investment Committee shall determine an appropriate method or combination methods to resolve such conflict of interest before the proxy affected by the conflict of interest is voted by Brandywine Global. Such determination shall be based on the particular facts and circumstances, including the importance of the proxy issue, the nature of the conflict of interest, etc. Such methods may include: |
| (i) | confirming that the proxy will be voted in accordance with a stated position or positions set forth in Appendix A; |
| (ii) | confirming that the proxy will be voted in accordance with the recommendations of an independent proxy service firm retained by Brandywine Global; |
| (iii) | in the case of a conflict of interest resulting from a particular employee’s personal relationships or circumstances, removing such employee from the decision-making process with respect to such proxy vote; |
| (iv) | disclosing the conflict to clients and obtaining their consent before voting; |
| (v) | suggesting to clients that they engage another party to vote the proxy on their behalf; or |
| (vi) | such other method as is deemed appropriate given the particular facts and circumstances, including the importance of the proxy issue, the nature of the conflict of interest, etc. |
| B. | A written record of the method used to resolve a material conflict of interest shall be maintained. |
| VI. | Other Considerations |
In certain situations, Brandywine Global may decide not to vote proxies on behalf of a client account for which it has discretionary voting authority because Brandywine Global believes that the expected benefit to the client account of voting shares is outweighed by countervailing considerations (excluding the existence of a potential conflict of interest). Examples of situations in which Brandywine Global may determine not to vote proxies are set forth below.
| (1) | Share Blocking |
Proxy voting in certain countries requires “share blocking.” This means that shareholders wishing to vote their proxies must deposit their shares shortly before the date of the meeting (e.g. one week) with a designated depositary. During the blocking period, shares that will be voted at the meeting cannot be sold until the meeting has taken place and the shares have been returned to client accounts by the designated depositary. In deciding whether to vote shares subject to share blocking, Brandywine Global will consider and weigh, based on the particular facts and circumstances, the expected benefit to client accounts of voting in relation to the potential detriment to clients of not being able to sell such shares during the applicable period.
| (2) | Securities on Loan |
Certain clients of Brandywine Global, such as an institutional client or a registered investment company for which Brandywine Global acts as a sub-adviser, may engage in securities lending with respect to the securities in their accounts. Brandywine Global typically does not direct or oversee such securities lending activities. To the extent feasible and practical under the circumstances, Brandywine Global may request that the client recall shares that are on loan so that such shares can be voted if
B-155
Brandywine Global believes that the expected benefit to the client of voting such shares outweighs the detriment to the client of recalling such shares (e.g., foregone income). The ability to timely recall shares for proxy voting purposes typically is not entirely within the control of Brandywine Global and requires the cooperation of the client and its other service providers. Under certain circumstances, the recall of shares in time for such shares to be voted may not be possible due to applicable proxy voting record dates and administrative considerations.
| VII. | Proxy Voting-Related Disclosures |
| (1) | Proxy Voting Independence and Intent |
Brandywine Global exercises its proxy voting authority independently of other Legg Mason affiliated investment advisers. Brandywine Global and its employees shall not consult with or enter into any formal or informal agreements with Brandywine Global’s parent, Legg Mason, Inc., any other Legg Mason business unit, or any of their respective officers, directors or employees, regarding the voting of any securities by Brandywine Global on behalf of its clients.
Brandywine Global and its employees must not disclose to any person outside of Brandywine Global, including without limitation another investment management firm (affiliated or unaffiliated) or the issuer of securities that are the subject of the proxy vote, how Brandywine Global intends to vote a proxy without prior approval from Brandywine Global’s Chief Compliance Officer.
If a Brandywine Global employee receives a request to disclose Brandywine Global’s proxy voting intentions to, or is otherwise contacted by, another person outside of Brandywine Global (including an employee of another Legg Mason business unit) in connection with an upcoming proxy voting matter, the employee should immediately notify Brandywine Global’s Chief Compliance Officer.
If a Brandywine Global portfolio manager wants to take a public stance with regards to a proxy, the portfolio manager must consult with and obtain the approval of Brandywine Global’s Chief Compliance Officer before making or issuing a public statement.
| (2) | Disclosure of Proxy Votes and Policy and Procedures |
Upon Brandywine Global’s receipt of any oral or written client request for information on how Brandywine Global voted proxies for that client’s account, Brandywine Global must promptly provide the client with such requested information in writing.
Brandywine Global must deliver to each client, for which it has proxy voting authority, no later than the time it accepts such authority, a written summary of this Proxy Voting policy and procedures. This summary must include information on how clients may obtain information about how Brandywine Global has voted proxies for their accounts and must also state that a copy of Brandywine Global’s Proxy Voting policy and procedures is available upon request.
Brandywine Global must create and maintain a record of each written client request for proxy voting information. Such record must be created promptly after receipt of the request and must include the date the request was received, the content of the request, and the date of Brandywine Global’s response. Brandywine Global must also maintain copies of written client requests and copies of all responses to such requests.
| VIII. | Shareholder Activism and Certain Non-Proxy Voting Matters |
In no event shall Brandywine Global’s possession of proxy voting authority obligate it to undertake any shareholder activism on behalf of a client. Brandywine Global may undertake such activism in connection with a proxy or otherwise if and to the extent that Brandywine Global determines that doing so is consistent with applicable general fiduciary principles, provided Brandywine Global has first obtained its Chief Compliance Officer’s approval of the proposed activism.
B-156
Absent a specific contrary written agreement with a client, Brandywine Global does not (1) render any advice to, or take any action on behalf of, clients with respect to any legal proceedings, including bankruptcies and shareholder litigation, to which any securities or other investments held in client account, or the issuers thereof, become subject, or (2) initiate or pursue legal proceedings, including without limitation shareholder litigation, on behalf of clients with respect to transactions or securities or other investments held in client accounts, or the issuers thereof. Except as otherwise agreed to in writing with a particular client, the right to take any action with respect to any legal proceeding, including without limitation bankruptcies and shareholder litigation, and the right to initiate or pursue any legal proceedings, including without limitation shareholder litigation, with respect to transactions or securities or other investments held in a client account is expressly reserved to the client.
| IX. | Recordkeeping |
In addition to all other records required by this Policy and Procedures, Brandywine Global shall maintain the following records relating to proxy voting:
| – | a copy of this Policy and Procedures, including any and all amendments that may be adopted; |
| – | a copy of each proxy statement that Brandywine Global receives regarding client securities; |
| – | a record of each vote cast by Brandywine Global on behalf of a client; |
| – | documentation relating to the identification and resolution of conflicts of interest; |
| – | any documents created by Brandywine Global that were material to a proxy voting decision or that memorialized the basis for that decision; |
| – | a copy of each written client request for information on how Brandywine Global voted proxies on behalf of the client, and a copy of any written response by Brandywine Global to any (written or oral) client request for information on how Brandywine Global voted proxies on behalf of the requesting client; and |
| – | records showing whether or not Brandywine Global has proxy voting authority for each client account. |
All required records shall be maintained and preserved in an easily accessible place for a period of not less than six years from the end of the fiscal year during which the last entry was made on such record, the first two years in an appropriate office of Brandywine Global. Brandywine Global also shall maintain a copy of any proxy voting policies and procedures that were in effect at any time within the last five years.
To the extent that Brandywine Global is authorized to vote proxies for a United States registered investment company, Brandywine Global shall maintain such records as are necessary to allow such fund to comply with its recordkeeping, reporting and disclosure obligations under applicable laws, rules and regulations.
In lieu of keeping copies of proxy statements, Brandywine Global may rely on proxy statements filed on the EDGAR system as well as on third party records of proxy statements if the third party provides an undertaking to provide copies of such proxy statements promptly upon request. Brandywine Global may rely on a third party to make and retain, on Brandywine Global’s behalf, records of votes cast by Brandywine Global on behalf of clients if the third party provides an undertaking to provide a copy of such records promptly upon request.
B-157
Appendix A
Proxy Voting Guidelines
Brandywine Global Diversified Portfolio Management Team
Proxy Voting Guidelines
Below are proxy voting guidelines that Brandywine Global’s Diversified Portfolio Management Team generally follows when voting proxies for securities held in client accounts. The Team may decide to deviate from these guidelines with respect to any one or more particular proxy votes, subject in all cases to the Team’s duty to act solely in the best interest of their client accounts holding the applicable security.
| I. | Compensation |
| A. | We vote for non-employee director stock options, unless we consider the number of shares available for issue excessive. We may consider current and past stock option grants in determining whether the cumulative dilution is excessive. |
| B. | We vote for employee stock purchase programs. Normally, these programs allow all employees to purchase company stock at a price equal to 85% of current market price. Usually, we will still vote for these employee programs even if we vote against a non-employee or executive-only stock purchase program because of excessive dilution. |
| C. | We vote for compensation plans that are tied to the company achieving set profitability hurdles. Plans are structured this way to comply with IRS laws allowing for deductibility of management compensation exceeding $1 million. |
| D. | We vote against attempts to re-price options. Also, we vote against the re-election of incumbent Directors in the event of such a re-pricing proposal. |
| E. | We vote against attempts to increase incentive stock options available for issuance when the shares underlying such options would exceed 10% of the company’s outstanding shares. |
| F. | We vote against stock option plans allowing for stock options with exercise prices less than 100% of the stock’s price at the time of the option grant. |
| G. | We vote against stock option plans allowing for very large allocations to a single individual because we generally believe that stock option plans should provide for widespread employee participation. |
| H. | We vote against proposals to authorize or approve loans to company executives or Board members for personal reasons or for the purpose of enabling such persons to purchase company shares. |
| II. | Governance |
| A. | We vote for proposals to separate the Chief Executive Officer and Chairman of the Board positions. |
| B. | We vote against “catch-all” authorizations permitting proxy holders to conduct unspecified business that arises during shareholder meetings. |
| III. | Anti-Takeover |
We vote against anti-takeover measures, including without limitation:
| A. | Staggered Boards of Directors (for example, where 1⁄3 of a company’s Board is elected each year rather than the entire Board each year). |
| B. | Super-Majority Voting Measures (for example, requiring a greater than 50% vote to approve takeovers or make certain changes). |
B-158
| C. | Poison Pills, which are special stock rights that go into effect upon a takeover offer or an outsider acquiring more than a specified percentage of a company’s outstanding shares. |
| IV. | Capital Structure |
We vote against attempts to increase authorized shares by more than twice the number of outstanding shares unless there is a specific purpose for such increase given, such as a pending stock split or a corporate purchase using shares, and we determine that increasing authorized shares for such purpose is appropriate. Generally, we believe it is better to use shares to pay for acquisitions when they are trading at higher values than when they are trading at or near historical lows. The dilution effect is less.
| V. | Business Management |
We generally vote against shareholder resolutions focused on strategy or policy issues (for example, a proposal that a company adopt the internationally recognized standards on emissions from …). We generally prefer not to dictate to companies on matters of business strategy. As long as the company is operating responsibly, we believe management’s role is to make these decisions.
Corporate Actions:
The purpose of this informational is to allow Corporate Action personnel, along with members of Brandywine, to better understand the functions of the Corporate Actions area. In addition, this guide will aid in understanding the responsibilities and procedures, coupled with the theory behind the most common corporate action types.
Critical Success Factors
Provide exceptional quality service to our internal and external clients.
| 1. | Process Corporate Actions in a timely manner with 100% accuracy. |
| 2. | Follow quality control procedures to ensure proper assessment for unprocessed actions. |
| 3. | Educate clients on the theory behind Corporate Actions including the process. |
| 4. | Continuously evaluate our procedures and implement improvements as necessary. |
| 5. | Solicit from PM’s/Analyst’s voluntary elections and respond to the custodian banks by the specified deadline. |
| 6. | Leverage existing and future technology resources to increase efficiency, productivity and accuracy. |
| 7. | Strive to continually enhance the lines of communication with all clients. |
| 8. | Always think outside the box, when performing the daily process. |
| 9. | Display professionalism through all levels of the company. |
What is a Corporate Action?
| · | A change in the traded security of a company, which materially affects how a security trades and becomes valued. |
| · | News of a corporate action has the impact to move the market. |
| · | In addition, a corporate action can have an immense impact to the holders of a security. There are many reasons why a company elects to undergo a corporate action. |
| · | You will learn about the various types of actions seen in the market, stemming from the most commonly seen actions, and moving on to complex actions, more prevalently seen in the international arena. |
Goal:
To process all actions on effective date with 100% accuracy.
B-159
C/A Classification
Mandatory Actions
| · | A mandatory action has a set date, called the effective date, to which it will occur in the market. In a mandatory action, there is no type of election to be made. This type of action will go through unless circumstances arise hindering the completion. |
| · | Stock splits, Stock dividends, Cash dividends, Bonus issues, Rights issues, Name changes, Mergers, and Spin-offs. |
Voluntary Actions
| · | This type of action calls for an option to be made by the holder of the security. Shareholders are required to make an election of either taking up certain options, or if applicable, taking no action. |
| · | Tender offers, Dissenters Rights, Odd lot offers, elections on rights, and cash/stock options. |
Basic Premise
Market Value Test (MVT)
| · | The market value test is a valuation test comparing the close price the day prior and the open price of a security on its effective date, while incorporating the terms. |
| · | The most important idea to gather from performing the market value test is when a corporate action occurs on its ex-date, there should not be any change in the market value from the day before to the day of an action. |
Typically, you should not see a variance of more than positive or negative 10% when completing the market value test. In other words, the market value of the shares you held the night before the effective date should not increase or decrease by 10% based on how the security opens in trading. A number outside the variance may be due to an additional asset not incorporated into the calculation, or possibly the numbers computed may be incorrect. If all the terms have been accounted for, but the variance is outside the 10% range, the next step to do is a MVT based off of the closing prices. It is possible the open may have not properly reflected the action, and could have adjusted itself by the close price.
The idea of having no real movement in market value in the market value test is one of the most difficult to understand yet one of the most important ideas to grasp. You can use this check when looking at the terms of the most complicated spin-offs or mergers. Essentially if you have a drop in a security, you need to see some sort of additional asset making up for the loss in market value. An easy way of understanding the MVT is to remember that you are taking what you had, against what you are keeping, and what you are getting. This three-step mindset will always help in identifying the assets involved in an action.
Types of Corporate Actions (The following is a list of the most common corporate actions seen in the market place.)
| 1. | Stock split |
| 2. | Stock dividend |
| 3. | Cash dividend |
| 4. | Bonus issue |
| 5. | Rights issue |
| 6. | Mergers |
B-160
| 7. | Spin-off |
| 8. | Name Change |
| 9. | Ticker/Identifier Change |
Explanation
An explanation of the listed corporate actions are detailed on the following pages. You will find an example of how the valuation is performed in association with the action type. In addition, there will be screen prints courtesy of Bloomberg© as to what to expect when researching actions. It is imperative when learning about the various actions, that one references the notes regarding the MVT for a more in-depth valuation understanding.
Stock split
An increase in the number of shares outstanding for a given corporation, without any change to the market value of the security. When the stock split becomes effective, the share position held increases based on the terms of the action. Consequentially the price of the security per share will decrease.
Reasoning Typically, the reasoning behind a company conducting a stock split is mainly to attract more small investors. This allows small investors to purchase shares of the company at a more affordable price per share.
Important ideas
When a stock split occurs, the shareholder will only be affected by the number of shares held. Neither the cost basis nor the market value is affected by the action. Essentially, the price of the stock will reflect the occurrence of the action, by a dropping in price.
Reverse Stock split
A reverse stock split acts in the opposite manner, as does a regular stock split. The difference lies in the shares outstanding decreasing instead of increasing. Given the total number of shares outstanding decreasing, the result is a price per share increasing.
Reasoning
From a companies perspective, a reverse stock split is done if the per share value becomes too low, and it is the opinion of the company to raise the stock price in order to attract new investors.
Cash Dividend
A payment of cash resulting from the cash flow of operations in the form of a dividend. This cash payment is paid to shareholders at the companies’ discretion.
Reasoning
The dividend is given in the form of a rate per share. Typically, companies in the mature stage of their lifecycle pay opt to pay dividends.
Stock dividend
A stock dividend is a dividend payment in the form of additional shares, rather than cash. Typically you will notice a stock dividend paying out a ratio of less than 5%.
B-161
Reasoning
The distribution of additional stock rather than cash becomes more attractive since it allows the company to conserve its cash for business operations.
Bonus issue
A bonus issue is identical to a stock dividend but is more prevalent when dealing with international securities. Moreover, it occurs when the payout is greater than 5%.
Important Points
When a stock split, stock dividend, or bonus issue occurs, the market reflects the action by way of a change in the traded price. This important point reiterates the idea that the market value before and after the effective date should not change. The shareholder is only seeing an adjustment to the number of shares held, not the cost basis or market value.
Merger
A merger is two or more companies coming together to form one new entity. Typically the acquirer looks to take control by purchasing a majority of the shares outstanding in the target company. An offer is usually given to shareholders in excess of the current MV of the shares. This is done by offering shares either of the acquiring company, a cash rate, or a combination of both.
Spin-Off
A company elects to sell a portion of their business or subsidiary from its company, by issuing shares of the new entity. Shareholders in the parent company receive shares in the new company by way of a given share ratio.
Rights issue
When a rights issue occurs, shareholders initially receive an asset, rights, which entitle the holder to purchase additional shares typically of the parent company. The rate to which the additional shares are purchased is based on a discounted subscription price, along with a share ratio.
Options given to Right holders
Exercise – Right holders elect to receive the resultant asset based on a given set of subscription terms.
– In order to exercise, the Analyst/PM looks to see what the valuation difference between exercising and selling the rights.
Sell
| · | If the rights are traded in the market, the holder can elect to have the rights sold. |
| · | The cash received results from the proceeds of the sale of rights. |
Lapse
| · | If there is no value found for the rights, whether traded or intrinsic, the rights may automatically be written off the books. |
| · | This is a simple accounting method of writing off worthless assets. |
B-162
Redemption Rights issue
The same basis found in a regular rights issue can be used in this case. The difference lies in the right holder given the option to have their existing position in the parent sold, rather than the option of subscribing to receive additional shares. The price to sell the security is typically higher than the traded market value.
Options to Right Holders
The same options suffice:
| · | Exercise Shares held in the issuing security are purchased from the shareholder at a rate typically higher than the market traded price. |
| · | Sell Rights can be sold in the market with the proceeds being cash |
| · | Lapse if no value is found, the rights can be written off. |
Name Change
A name change occurs at the discretion of the company with shareholder approval. This is most common if the company is involved in a pending merger.
Ticker Change
Tickers or Symbols are an alphabetic denominated identifier attached to each security. Companies have the option to change their market ticker.
Identifier Change
Securities have a total of three different numeric identifiers to which segregate each other. – CUSIP (Identifies US traded securities) – Sedol (Identifies Foreign traded securities) – ISIN (Identifies all global traded securities)
Process
Daily Work Flow Chart
Pending Corporate Actions
| · | Bank Notices-Sort all bank notices. |
| · | Pending List-Update spreadsheet with all upcoming actions. |
Mandatory Actions
| · | Research C/A notifications |
| · | Processing of Corporate Action |
| · | Process C/A on ex date if applicable. |
| · | Verification w/Bloomberg Systems |
| · | Notify Eagle of actions processed. |
B-163
Voluntary Actions
| · | Send Voluntary Actions to PM/Analyst |
| · | Restrict any Vol. Actions tendered. |
| · | Monitor Voluntary Actions |
Detailed Daily Work Flow
| 1. | aNotices |
| · | Corporate action notifications are facilitated from our custodian banks’ to Brandywine by way of fax, email or through corporate action websites. These notifications must be reviewed immediately once received. |
| · | It becomes imperative for the associate to address any actions with near term deadlines or effective dates, placed on the highest priority. |
| 2. | Pending List |
| · | The purpose of this list is to keep track of the upcoming corporate actions, and is divided by classification of actions. It is sorted by either the effective date for Mandatory actions, or the response deadline for Voluntary actions. |
| · | Electronic folders are used to create files for new corporate actions. Each folder should contain all bank notifications for all accounts affected, including an Eagle screen print of all the holders of the affected security. |
| · | Any repeated bank notice should also be filed. |
| 3. | Bamware |
| · | New corporate actions falling in the realm of mergers, tender offers, or spin-offs, and in the small cap arena, should be updated on Bamware under the Mergers and Acquisitions screen. The procedures are as follows: |
| · | Logon to Bamware |
| · | Click on transactions Ë Mergers & Acquisitions Ë type ticker. |
| · | The next step is to fill in information relative to the action. You will only need to fill in as much information as is given. When asked a “yes” or “no” question, you should type: 0=no-1=yes |
| 4. | File |
| 5. | Once the bank notices have been placed on the pending list, and organized in each respective electronic folder, the actions are filed alphabetically according to type – mandatory or voluntary. Processing of Corporate Actions (Mandatory Actions) |
| · | As a guard against missing corporate actions on their effective date, it is necessary to view the Pending list on a daily basis. Reference the tabs marked Mandatory and Voluntary. |
| · | Stock splits, stock dividends, CUSIP changes, and Name changes are the only action types, automatically processed on the system. |
| · | Even if the action is automatically processed on the system, every action needs to be verified with the market place for accuracy. When an action gets processed, the file requires the following information: |
B-164
| · | Bank notice |
| · | Bloomberg screen prints (DES, CACS, CN, GPO) c) Market Value tested) |
| · | When an action is completed, it must be placed on the Month End C/A, for the month it is processed. This spreadsheet lists and separates all actions processed for each month by the fund affected. There are separate instructions on how to utilize the spreadsheet |
| · | Finally, the file should be checked, and placed in the file cabinet labeled “Completed C/A.” |
| · | Additionally, all Analysts and PM’s need to be notified via email of the actions processed. |
Procedures for Voluntary Actions
All information must be presented to the portfolio manager/analyst including all relevant materials such as outside sources and valuation spreadsheets. Possible research sources that should be utilized include Bloomberg, in order to gather news stories and action information, bank notices, company website info, and a list of all the accounts affected. It is imperative to send all information to the PM at least 3 days prior to the banks’ response deadline. This will allow the PM adequate time to research any additional information needed for his investment decision. Once the PM returns his election, it must immediately be forwarded to the respective custodian banks, by way of the proper facilities measures already set in place. The bank notifications typically should have attached a sheet detailing how many shares we hold in each account (must verify if correct), in addition to giving the election option to either tender shares, or take no action. You need to reference the bank contact list to verify which fax number, email or website to send the response to. If the PM elects to take no action,you need not go any further. The decision sheet is kept in the electronic file. If they elect to take up the offer, you must make restrictions on the traders selling the small or large cap security on both Charles River and Eagle, respectively.
The corporate action file should include printed copies of the information sent to the PM, along with his response, including all valuation spreadsheets presented. At this point, it is the responsibility of corporate actions to monitor the action on a daily basis for any indication of the completion of the offer. Voluntary actions require the following conditions for approval:
| i. | shareholder approval |
| ii. | regulatory/court approval |
In addition, voluntary actions may be placed on certain restrictions whereby it may require a certain percentage of shareholders to accept the offer in order for completion. Typically the terminology to look for, when researching news stories, especially with foreign securities is unconditional or wholly unconditional. One rule of thumb to note, if we are guaranteed to get our resulting asset, be it cash or stock, the action is most likely complete or very near to being complete. Once the market has announced the completion of the action, the terms can then be reflected and processed onto the system.
Cost Allocation
Provides a method of allocating cost when a new asset is received in the case of a spin-off or rights issue. A new asset received must have cost allocated from the parent security. This calculation can only be performed on the effective date of the action, when the market has closed trading. The cost allocation is done in order to give cost to the resulting asset. If this is not done, the resulting asset will have an unrealized gain of 100%. This is not proper accounting.
On the flip side, if no cost is allocated, the unrealized gain on the parent security will be at a negative with the drop in market value.
B-165
FEDERATED CLOVER INVESTMENT ADVISORS
VOTING PROXIES ON FUND PORTFOLIO SECURITIES
Proxy Voting Policies
The general policy of Federated Clover Investment Advisors (the “Subadviser”) with respect to proxy voting is to cast proxy votes in favor of proposals that the Subadviser anticipates will enhance the long-term value of the securities being voted. Generally, this will mean voting for proposals that the Subadviser believes will: improve the management of a company; increase the rights or preferences of the voted securities; and/or increase the chance that a premium offer would be made for the company or for the voted securities.
The following examples illustrate how these general policies may apply to proposals submitted by a company’s board of directors for approval or ratification by holders of the company’s voting securities. However, whether the Subadviser supports or opposes a proposal will always depend on the specific circumstances described in the proxy statement and other available information.
On matters of corporate governance, generally the Subadviser will vote for the full slate of directors nominated in an uncontested election, but against any director who: (a) had not attended at least 75% of the board meetings during the previous year; (b) serves as the company’s chief financial officer; (c) has committed himself or herself to service on a large number of boards, such that we deem it unlikely that the director would be able to commit sufficient focus and time to a particular company; (d) is the chair of the nominating committee when the roles of chairman of the board and CEO are combined, and there is no lead independent director; and/or (e) served on the compensation committee during a period in which compensation appears excessive relative to performance and peers. In addition, the Subadviser will vote for proposals to: require a company’s audit committee to be comprised entirely of independent directors; declassify the board of directors; require a majority voting standard in the election of directors; eliminate supermajority requirements in a company’s bylaws; grant shareholders the right to call a special meeting if owners of at least 25% of the outstanding stock agree; require independent tabulation of proxies and/or confidential voting by shareholders; ratify the board’s selection of auditors (unless compensation for non-audit services exceeded 50% of the total compensation received from the company, or the previous auditor was dismissed because of a disagreement with the company); and repeal a shareholder rights plan (also known as a “poison pill”). The Subadviser will generally vote against the adoption of such a plan (unless the plan is designed to facilitate, rather than prevent, unsolicited offers for the company).
On matters of capital structure, generally the Subadviser will vote: against proposals to authorize or issue shares that are senior in priority or voting rights to the securities being voted; and for proposals to: reduce the amount of shares authorized for issuance; authorize a stock repurchase program; and grant preemptive rights to the securities being voted. The Subadviser will generally vote against proposals to eliminate such preemptive rights.
On matters relating to management compensation, generally the Subadviser will vote: for stock incentive plans that align the recipients’ interests with the interests of shareholders without creating undue dilution; against proposals that would permit the amendment or replacement of outstanding stock incentives with new stock incentives having more favorable terms; and against executive compensation plans that do not disclose the maximum amounts of compensation that may be awarded or the criteria for determining awards.
On matters relating to corporate transactions, the Subadviser will vote proxies relating to proposed mergers, capital reorganizations, and similar transactions in accordance with the general policy, based upon its analysis of the terms, conditions and anticipated results of the proposed transaction. The Subadviser will vote proxies in contested elections of directors based upon its analysis of the opposing slates and their respective proposed business strategies. When the company’s board, or another party involved in a proposed transaction or change in the board, submits proposals for the purpose of facilitating or impeding such transaction or change, the Subadviser will cast its proxies based on its evaluation of the proposed transaction or change to the board. In
B-166
these circumstances, the Subadviser may vote in a manner contrary to its general practice for similar proposals made outside the context of such a proposed transaction or change in the board. For example, if the Subadviser decides to vote against a proposed transaction, it may vote in favor of anti-takeover measures reasonably designed to prevent the transaction.
The Subadviser generally votes proxies against proposals submitted by shareholders without the favorable recommendation of a company’s board. The Subadviser believes that a company’s board should manage its business and policies, and that shareholders who seek specific changes should strive to convince the board of their merits or seek direct representation on the board. However, the Subadviser would vote for shareholder proposals not supported by the company’s board that the Subadviser regards as: (a) likely to result in an immediate and favorable improvement in the total return of the voted security; and (b) unlikely to be adopted by the company’s board in the absence of shareholder direction.
In addition, the Subadviser will not vote any proxy if it determines that the consequences or costs of voting outweigh the potential benefit of voting. For example, if a foreign market requires shareholders voting proxies to retain the voted shares until the meeting date (thereby rendering the shares “illiquid” for some period of time), the Subadviser will not vote proxies for such shares. In addition, the Subadviser is not obligated to incur any expense to send a representative to a shareholder meeting or to translate proxy materials into English.
Proxy Voting Procedures
The Subadviser has established the Proxy Voting Committee (“Proxy Committee”), to exercise all voting discretion granted to the Subadviser by the Board in accordance with the proxy voting policies. The Subadviser has hired a proxy voting service to obtain, vote and record proxies in accordance with the directions of the Proxy Committee. The Proxy Committee has supplied the proxy voting service with general instructions (the “Standard Voting Instructions”) that represent decisions made by the Proxy Committee in order to vote common proxy proposals. As the Proxy Committee believes that a shareholder vote is equivalent to an investment decision, the Proxy Committee retains the right to modify the Standard Voting Instructions at any time or to vote contrary to them at any time in order to cast proxy votes in a manner that the Proxy Committee believes is: (a) in the best interests of the Subadviser’s clients (including shareholders of the funds advised by the Subadviser); and (b) will enhance the long-term value of the securities being voted. The proxy voting service may vote any proxy as directed in the Standard Voting Instructions without further direction from the Proxy Committee. However, if the Standard Voting Instructions require case-by-case direction for a proposal, the proxy voting service shall provide the Proxy Committee with all information that it has obtained regarding the proposal and the Proxy Committee will provide specific direction to the proxy voting service.
The Proxy Committee has created the Proxy Voting Management Group (PVMG) to assist it in carrying out the day-to-day operations related to proxy voting. The day-to-day operations related to proxy voting are carried out by the Proxy Voting Operations Team (PVOT) and overseen by the PVMG. This work includes, but is not limited to: interacting with the proxy voting service on the Proxy Committee’s behalf; soliciting voting recommendations from the Subadviser’s investment professionals, as necessary, on case-by-case items referred to the Proxy Committee by the proxy voting service; bringing requests to the Proxy Committee from the Subadviser’s investment professionals for voting contrary to the Standard Voting Instructions; filing any required proxy voting reports; providing proxy voting reports to clients and investment companies as they are requested from time to time; keeping the Proxy Committee informed of any issues related to proxy voting; and voting client shares as directed by the Proxy Committee.
Conflicts of Interest
The Subadviser has adopted procedures to address situations where a matter on which a proxy is sought may present a potential conflict between the interests of the Fund (and its shareholders) and those of the Subadviser or Distributor. This may occur where a significant business relationship exists between the Subadviser (or its
B-167
affiliates) and a company involved with a proxy vote. A company that is a proponent, opponent, or the subject of a proxy vote, and which to the knowledge of the Proxy Committee has this type of significant business relationship with the Subadviser, is referred to below as an “Interested Company.”
The Subadviser has implemented the following procedures in order to avoid concerns that the conflicting interests of the Subadviser have influenced proxy voting. Any employee of the Subadviser who is contacted by an Interested Company regarding proxies to be voted by the Subadviser must refer the Interested Company to a member of the Proxy Committee, and must inform the Interested Company that the Proxy Committee has exclusive authority to determine how the Subadviser will exercise its voting discretion. Any Proxy Committee member contacted by an Interested Company must report it to the full Proxy Committee and provide a written summary of the communication. Under no circumstances will the Proxy Committee or any member of the Proxy Committee make a commitment to an Interested Company regarding the voting of proxies or disclose to an Interested Company how the Proxy Committee has directed such proxies to be voted. If the Standard Voting Instructions already provide specific direction on the proposal in question, the Proxy Committee shall not alter or amend such directions. If the Standard Voting Instructions require the Proxy Committee to provide further direction, the Proxy Committee shall do so in accordance with the proxy voting policies, without regard for the interests of the Subadviser with respect to the Interested Company. If the Proxy Committee provides any direction as to the voting of proxies relating to a proposal affecting an Interested Company, it must disclose annually to the Fund’s Board information regarding: the significant business relationship; any material communication with the Interested Company; the matter(s) voted on; and how, and why, the Subadviser voted as it did. Alternatively, the Proxy Committee may seek direction from the Fund’s Board on how a proposal concerning an Interested Company shall be voted, and shall follow any such direction provided by the Board. In seeking such direction, the Proxy Committee will disclose the reason such company is considered an Interested Company and may provide a recommendation on how such proposal should be voted and the basis for such recommendation.
If the Subadviser’s client owns shares of an investment company for which the Subadviser (or an affiliate) is the investment adviser, the Proxy Committee will vote the client’s proxies for that investment company in the same proportion as the votes cast by shareholders who are not clients of the Subadviser, unless otherwise directed by the client (or in the case of an investment company, its board of directors or trustees).
Downstream Affiliates
If the Proxy Committee gives further direction, or seeks to vote contrary to the Standard Voting Instructions, for a proxy relating to a portfolio company in which an investment company client owns more than 10% of the portfolio company’s outstanding voting securities at the time of the vote (“Downstream Affiliate”), the Proxy Committee must first receive guidance from counsel to the Proxy Committee as to whether any relationship between the Subadviser and the portfolio company, other than such ownership of the portfolio company’s securities, gives rise to an actual conflict of interest. If counsel determines that an actual conflict exists, the Proxy Committee must address any such conflict with the executive committee of the board of directors or trustees of any investment company client prior to taking any action on the proxy at issue.
Proxy Voting Report
A report on Form “N-PX” of how the Fund voted any proxies during the most recent 12-month period ended June 30 is available via the SEC’s website at www.sec.gov.
B-168
FRONTIER CAPITAL MANAGEMENT COMPANY, LLC
PROXY VOTING STATEMENT AND GUIDELINES
As an investment adviser and fiduciary of client assets, Frontier Capital Management Company, LLC (“Frontier”) utilizes proxy voting policies and procedures intended to pursue its clients’ best interest by protecting the value of clients’ investments. Frontier recognizes that proxies have an economic value. In voting proxies, we seek to both maximize the long-term value of our clients’ assets and to cast votes that we believe to be fair and in the best interest of the affected client(s). Proxies are considered client assets and are managed with the same care, skill and diligence as all other client assets. These written proxy policies and procedures are designed to reasonably ensure that Frontier votes proxies in the best interest of clients for whom Frontier has voting authority.
Arrangements with Outside Firms
Frontier has contracted with a third party vendor (the “proxy vendor”) to provide vote recommendations according to a set of pre-determined proxy voting policy guidelines. Frontier has also contracted with the proxy vendor to act as agent for the proxy voting process and to maintain records on proxy voting for our clients. The vendor has represented to Frontier that it uses its best efforts to ensure that its proxy voting recommendations are in accordance with these policies as well as relevant requirements of the ERISA and the U.S. Department of Labor’s interpretations thereof.
There may be occasional circumstances in which Frontier exercises its voting discretion. Frontier’s action in these cases is described in the Conflicts of Interest section of these policies and procedures.
Proxy Voting Committee
Frontier has a Proxy Voting Committee that is responsible for deciding what is in the best interest of clients when determining how proxies are voted. The Committee meets at least annually to review and re-approve the vendor’s proxy voting policies as well as Frontier’s own policies if it determines that they continue to be reasonably designed to be in the best interest of Frontier’s clients. Any changes to the vendor’s voting guidelines must be reviewed, approved and adopted by the Committee before they will become effective for Frontier.
Account Set-Up
Except where the contract is silent, each client will designate in its investment management contract whether it would like to retain proxy voting authority or delegate that authority to Frontier. If a client contract is silent on whether the client delegates proxy voting authority to Frontier, Frontier will be implied to have proxy voting authority.
Account Update
On a periodic basis, the agent for the proxy voting process will provide Frontier with a list of Frontier clients for which the agent is voting. This is designed to ensure that the agent is voting for all clients for whom Frontier retains voting authority. In that regard, Frontier will conduct a periodic reconciliation between its and the agent’s records.
Conflicts of Interest
As noted, Frontier has adopted the proxy vendor’s proxy voting guidelines. The adoption of these proxy voting guidelines provides pre-determined policies for voting proxies and is thus designed to remove conflicts of interest. Examples of such conflicts are when we vote a proxy solicited by an issuer who is a client of ours or
B-169
with whom we have another business or personal relationship that may affect how we vote on the issuer’s proxy. The intent of this policy is to remove any discretion that Frontier may have to interpret how to vote proxies in cases where Frontier has a material conflict of interest or the appearance of a material conflict of interest.
Although under normal circumstances Frontier is not expected to exercise its voting discretion or to override the vendor, the Proxy Voting Committee will monitor any situation where Frontier wishes to exercise its discretion. In these situations, the Proxy Voting Committee, or an employee delegated by the Committee, will consider whether Frontier has a material conflict of interest. If the Committee determines that a material conflict exists, Frontier will vote the proxy using either of the following two methods: (a) we will follow the recommendations of the proxy vendor; or (b) we will not take into consideration the relationship that gave rise to the conflict and will vote the proxy in the best interest of our clients. If the Committee determines that a material conflict does not exist, then we may vote the proxy in our discretion. Frontier’s General Counsel must approve any decision made on such a vote prior to the vote being cast.
Oversight
Proxy Vendor
On a periodic basis, Frontier will verify with the proxy vendor that it has provided Frontier with any changes in proxy voting guidelines.
Proxy Agent
On a periodic basis, Frontier will verify with the proxy agent that it has voted proxies for accounts for which Frontier delegated voting to the proxy agent.
Votes Cast Other than According to the Proxy Vendor’s Pre-Determined Policies
Frontier’s CCO, who is also the General Counsel will periodically confirm that all documentation regarding any decisions to vote other than according to the proxy vendor’s pre-determined policies are accurate and complete.
Client Disclosure
Clients may obtain information about how Frontier voted proxies for securities held in their account(s) by contacting Frontier at (617) 261-0777.
Upon a client’s request, the proxy agent will provide Frontier with the following information:
| 1. | The name of the issuer of the portfolio security |
| 2. | The ticker symbol of the security |
| 3. | The CUSIP of the security |
| 4. | The shareholder meeting date |
| 5. | A description of the matter voted on |
| 6. | Whether the matter was proposed by the issuer or by a security holder |
| 7. | Whether the account voted on the matter |
| 8. | How each proxy proposal was voted (e.g., for or against the proposal, abstain; for or withhold authority regarding election of directors) |
| 9. | Whether the vote that was cast was for or against management’s recommendation |
B-170
Recordkeeping
Frontier will maintain in an easily accessible place for a period of six years, the first two years in an appropriate Frontier office, the following documents (except documents maintained on Frontier’s behalf by the proxy agent as specifically noted below):
| 1. | Frontier’s proxy voting policies and procedures and the proxy voting guidelines. |
| 2. | Proxy statements received regarding client securities. Frontier may satisfy this requirement by relying on the proxy agent, on Frontier��s behalf, to retain a copy of each proxy statement. |
| 3. | Records of votes cast on behalf of its clients. Frontier may satisfy this requirement by relying on the proxy agent to retain, on Frontier’s behalf, a record of the vote cast. |
| 4. | A copy of any document created by Frontier personnel that was material to making a decision on how to vote proxies on behalf of a client or that memorialized the basis for that decision. |
| 5. | A copy of each written client request for information on how Frontier voted proxies on behalf of the client, and a copy of any written response by Frontier to any written or oral client request for information on how Frontier voted proxies on behalf of the requesting client. |
October 2016
B-171
HARRIS ASSOCIATES L.P.
PROXY VOTING POLICIES, GUIDELINES, AND PROCEDURES
| I. | PROXY VOTING POLICY |
Harris Associates L.P. (“Harris”, “the Firm” or “we”) believes that proxy voting rights are valuable portfolio assets and an important part of our investment process, and we exercise our voting responsibilities as a fiduciary solely with the goal of serving the best interests of our clients in their capacity as shareholders of a company. As an investment manager, Harris is primarily concerned with maximizing the value of its clients’ investment portfolios. Harris has long been active in voting proxies on behalf of shareholders in the belief that the proxy voting process is a significant means of addressing crucial corporate governance issues and encouraging corporate actions that are believed to enhance shareholder value. We have a Proxy Voting Committee comprised of investment professionals that reviews and recommends policies and procedures regarding our proxy voting and ensures compliance with those policies.
The proxy voting guidelines below summarize Harris’ position on various issues of concern to investors and give a general indication of how proxies on portfolio securities will be voted on proposals dealing with particular issues. We will generally vote proxies in accordance with these guidelines, except as otherwise determined by the Proxy Voting Committee, unless the client has specifically instructed us to vote otherwise. These guidelines are not exhaustive and do not include all potential voting issues. Because proxy issues and the circumstances of individual companies vary, there may be instances when Harris may not vote in strict adherence to these guidelines. Our investment professionals, as part of their ongoing review and analysis of all portfolio holdings, are responsible for monitoring significant corporate developments, including proxy proposals submitted to shareholders, and notifying the Proxy Voting Committee if they believe the economic interests of shareholders may warrant a vote contrary to these guidelines. In such cases, the Proxy Voting Committee will determine how the proxies will be voted.
In determining the vote on any proposal, the Proxy Voting Committee will consider the proposal’s expected impact on shareholder value and will not consider any benefit to Harris, its employees, its affiliates or any other person, other than benefits to the owners of the securities to be voted, as shareholders.
Harris considers the reputation, experience and competence of a company’s management when it evaluates the merits of investing in a particular company, and we invest in companies in which we believe management goals and shareholder goals are aligned. When this happens, by definition, voting with management is generally the same as voting to maximize the expected value of our investment. Accordingly, on most issues, our votes are cast in accordance with management’s recommendations. This does not mean that we do not care about corporate governance. Rather, it is confirmation that our process of investing with shareholder aligned management is working. Proxy voting is not always black and white, however, and reasonable people can disagree over some matters of business judgment. When we believe management’s position on a particular issue is not in the best interests of our clients, we will vote contrary to management’s recommendation.
| II. | VOTING GUIDELINES |
The following guidelines are grouped according to the types of proposals generally presented to shareholders.
Board of Directors Issues
Harris believes that boards should have a majority of independent directors and that audit, compensation and nominating committees should generally consist solely of independent directors.
B-172
1. Harris will normally vote in favor of the directors recommended by the issuer’s board provided that a majority of the board would be independent. If the board does not have a majority of independent directors, Harris will normally vote in favor of the independent directors and against the non-independent directors.
2. Harris will normally vote in favor of proposals to require a majority of directors to be independent.
3. Harris will normally vote against proposals that mandate an independent board chairman.1
4. Harris will normally vote in favor of proposals that audit, compensation and nominating committees consist solely of independent directors, and will vote against the election of non-independent directors who serve on those committees.
5. Harris will normally vote in favor of proposals regarding director indemnification arrangements.
6. Harris will normally vote against proposals advocating classified or staggered boards of directors.
7. Harris will normally vote in favor of proposals requiring a majority vote for directors.
8. Harris will normally vote in favor of proposals requiring the separation of the Chairman and Chief Executive Officer positions.
Auditors
Harris believes that the relationship between an issuer and its auditors should be limited primarily to the audit engagement, although it may include certain closely related activities such as financial statement preparation and tax-related services that do not raise any appearance of impaired independence.
1. Harris will normally vote in favor of ratification of auditors selected by the board or audit committee, subject to the above.
2. Harris will normally vote against proposals to prohibit or limit fees paid to auditors for all non-audit services, subject to the above.
3. Harris will normally vote in favor of proposals to prohibit or limit fees paid to auditors for general management consulting services other than auditing, financial statement preparation and controls, and tax-related services.
Equity Based Compensation Plans
Harris believes that appropriately designed equity-based compensation plans approved by shareholders can be an effective way to align the interests of long-term shareholders and the interests of management, employees and directors. However, we are opposed to plans that substantially dilute our ownership interest in the company, provide participants with excessive awards or have inherently objectionable structural features.
1. Harris will normally vote against such plans where total potential dilution (including all equity-based plans) exceeds 15% of shares outstanding.
2. Harris will normally vote in favor of plans where total potential dilution (including all equity-based plans) does not exceed 15% of shares outstanding.
3. Harris will normally vote in favor of proposals for an annual shareholder advisory vote on executive compensation.
4. Harris will normally vote in favor of advisory votes to ratify named executive officer compensation.
| 1 | Harris has an existing guideline that states that we will normally vote in favor of proposals requiring the separation of the Chairman and Chief Executive Officer positions. This supplemental guideline is not intended to change the existing guideline, but recognizes that a Chairman may be separate but not deemed independent (for example, a former executive of the company). |
B-173
5. Harris will normally vote in favor of proposals to require expensing of options.
6. Harris will normally vote against proposals to permit repricing of underwater options.
7. Harris will normally vote against shareholder proposals that seek to limit directors’ compensation to common stock.
8. Harris will normally vote in favor of proposals for employee stock purchase plans, so long as shares purchased through such plans are sold at no less than 85% of current market value.
9. Harris will normally vote against proposals that prohibit the automatic vesting of equity awards upon a change of control.
Corporate Structure and Shareholder Rights
Harris generally believes that all shareholders should have an equal voice and that barriers which limit the ability of shareholders to effect change and to realize full value are not desirable.
1. Harris will normally vote in favor of proposals to authorize the repurchase of shares.
2. Harris will normally vote against proposals creating or expanding supermajority voting rights.
3. Harris will normally vote against the adoption of anti-takeover measures.
4. Harris will normally vote in favor of proposals for stock splits and reverse stock splits.
5. Harris will normally vote against proposals to authorize different classes of stock with different voting rights.
6. Harris will normally vote against proposals to increase authorized shares with preemptive rights if the increase is greater than 100% of currently issued shares.
7. Harris will normally vote for proposals to increase authorized shares with preemptive rights if the increase is less than 100% of currently issued shares.
8. Harris will normally vote against proposals to increase authorized shares without preemptive rights if the increase is greater than 20% of currently issued shares.
9. Harris will normally vote for proposals to increase authorized shares without preemptive rights if the increase is less than 20% of currently issued shares.
Routine Corporate Matters
Harris will generally vote in favor of routine business matters such as approving a motion to adjourn the meeting, declaring final payment of dividends, approving a change in the annual meeting date and location, approving the minutes of a previously held meeting, receiving consolidated financial statements, change of corporate name and similar matters. However, to the extent that the voting recommendation of Institutional Shareholder Services (“ISS”) opposes the issuer’s management on the routine matter, the proposal will be submitted to the Proxy Voting Committee for determination.
Social Responsibility Issues
Harris believes that matters related to a company’s day-to-day business operations are primarily the responsibility of management and should be reviewed and supervised solely by the company’s board of directors. Harris is focused on maximizing long-term shareholder value and will typically vote against shareholder proposals requesting that a company disclose or amend certain business practices unless we believe a proposal would have a substantial positive economic impact on the company.
B-174
Certain Other Issues
Harris may also maintain Supplemental Proxy Voting Guidelines to address certain proposals that are not as enduring as those listed above, but yet may be presented repeatedly by issuers during a given proxy season. For example, companies in a particular industry or country may be affected by a change in the law that requires them to submit a one-time proxy proposal during the proxy season. The Proxy Voting Committee will determine which proposals will be included on the list of Supplemental Proxy Voting Guidelines, and will update the list as needed. The Proxy Voting Committee will provide the list to research analysts and the Proxy Administrator.
| III. | VOTING SHARES OF FOREIGN ISSUERS |
Because foreign issuers are incorporated under the laws of countries outside the United States, protection for and disclosures to shareholders may vary significantly from jurisdiction to jurisdiction. Laws governing foreign issuers may, in some cases, provide substantially less protection for shareholders. As a result, the foregoing guidelines, which are premised on the existence of a sound corporate governance and disclosure framework, may not be appropriate under some circumstances for foreign issuers. Harris will generally vote proxies of foreign issuers in accordance with the foregoing guidelines where appropriate. On occasion, the proxy statements of foreign issuers may lack disclosure or transparency with respect to a significant element(s) for consideration (e.g., names of directors, targets for incentive plans, etc.), which may be a sufficient basis for voting contrary to the foregoing guidelines. If an analyst decides to vote contrary to guidelines solely due to the lack of disclosure or transparency, then the matter need not be submitted to the Proxy Voting Committee for approval. The basis for such a decision to vote contrary to a guideline pursuant to the aforementioned reason(s) shall be appropriately documented.
In some non-U.S. jurisdictions, sales of securities voted may be prohibited for some period of time, usually between the record and meeting dates (“share blocking”). Since these time periods are usually relatively short in light of our long-term investment strategy, in most cases, share blocking will not impact our voting decisions. However, there may be occasions where the loss of investment flexibility resulting from share blocking will outweigh the benefit to be gained by voting.
| IV. | CONFLICTS OF INTEREST |
The Proxy Voting Committee, in consultation with the Legal and Compliance Departments, is responsible for monitoring and resolving possible material conflicts of interest with respect to proxy voting. A conflict of interest may exist, for example, when: (i) proxy votes regarding non-routine matters are solicited by an issuer who has an institutional separate account relationship with Harris or Harris is actively soliciting business from the issuer; (ii) when we are aware that a proponent of a proxy proposal has a business relationship with Harris or Harris is actively soliciting such business (e.g., an employee group for which Harris manages money); (iii) when we are aware that Harris has business relationships with participants in proxy contests, corporate directors or director candidates; or (iv) when we are aware that a Harris employee has a personal interest in the outcome of a particular matter before shareholders (e.g., a Harris executive has an immediate family member who serves as a director of a company). Any employee with knowledge of any conflict of interest relating to a particular proxy vote shall disclose that conflict to the Proxy Voting Committee. In addition, if any member of the Proxy Voting Committee has a conflict of interest, he or she will recuse himself or herself from any consideration of the matter, and an alternate member of the committee will act in his or her place.
Harris is committed to resolving any such conflicts in its clients’ collective best interest, and accordingly, we will vote pursuant to the Guidelines set forth in this Proxy Voting Policy when conflicts of interest arise. However, if we believe that voting in accordance with a Guideline is not in the best interest of our clients under the particular facts and circumstances presented, or if the proposal is not addressed by the Guidelines, then we will vote in accordance with the guidance of ISS. If ISS has not provided guidance with respect to the proposal or if we believe the recommendation of ISS is not in the best interests of our clients, then the Proxy Voting
B-175
Committee will refer the matter to (1) the Executive Committee of the Board of Trustees of Harris Associates Investment Trust for a determination of how shares held in The Oakmark Funds will be voted, and (2) the Proxy Voting Conflicts Committee consisting of Harris’ General Counsel, Chief Compliance Officer (“CCO”) and Chief Financial Officer for a determination of how shares held in all other client accounts will be voted. Each of those committees will keep a written record of the basis for its decision.
| V. | VOTING PROCEDURES |
The following procedures have been established with respect to the voting of proxies on behalf of all clients, including mutual funds advised by Harris, for which Harris has voting responsibility.
Proxy Voting Committee. The Proxy Voting Committee (the “Committee”) is responsible for recommending proxy voting guidelines, establishing and maintaining policies and procedures for proxy voting, and ensuring compliance with these policies and procedures. At least annually, the Committee will review the adequacy of these policies, guidelines and procedures to help ensure they are implemented effectively and reasonably designed so that proxies are voted in the best interest of Harris’ clients. The review will be documented in the minutes of the Committee’s meetings.
The Committee consists of three investment professionals: two domestic research analysts and one international research analyst. Committee members serve for three years with members replaced on a rotating basis. New Committee members are nominated by the Committee and are normally approved by the Committee members at the annual Committee meeting. The Committee also has two alternate members (one domestic analyst and one international analyst) either of who may serve in the absence of a regular member of the Committee.
Proxy Administrator. The Proxy Administrator is an employee of Harris reporting to the Manager of Account Services and is responsible for ensuring that all votes are placed with the proxy voting service provider and that all necessary records, as appropriate, are maintained reflecting such voting.
Proxy Voting Service Provider. Harris has engaged ISS, an independent proxy voting service provider, to assist in voting proxies. ISS provides the Firm with information concerning shareholder meetings, electronic voting, recordkeeping and reporting services, research with respect to companies, and proxy voting guidance and recommendations.
In order to remain confident that ISS continues to have the capacity and competency to adequately analyze proxy issues, the Proxy Administrator will annually obtain from ISS its SSAE 16, or similar attestation report, and current Form ADV and forward them for review to the Manager of Account Services. In addition, the Proxy Administrator shall periodically review ISS’ disclosures regarding its conflict of interests and forward any conflict that relates to issuers whose proxies Harris is currently reviewing to the General Counsel, or her designee, for review.
To the extent the Manager of Account Services or the General Counsel, or her designee, determine that a control deficiency, conflict of interest or other disclosure matter may materially impact the capacity or competency of ISS, he/she shall promptly report such determination to the Committee for review and further action, if any.
In the event an analyst, during the course of the analyst’s review of ISS’ proxy recommendation, uncovers a material factual error that causes the analyst to question ISS’ process for developing its recommendation, the analyst shall report the error to the Manager of Account Services. The Manager of Account Services, or his/her designee, will review the error and contact ISS to seek to reduce similar errors in the future. For purposes of this section, a material factual error means an error of fact that the analyst believes that if corrected would cause ISS to change its recommendation.
B-176
Voting Decisions. As described in the Proxy Voting Policy above, the Firm has established proxy voting guidelines, including supplemental proxy voting guidelines, on various issues. We will generally vote proxies in accordance with these guidelines except as otherwise determined by the Proxy Voting Committee. The Proxy Administrator, or designated back-up, is responsible for alerting the Firm’s research analyst who follows the company about the proxy proposals. If the analyst believes the proxy should be voted in accordance with the Guidelines, he or she will vote the proposal accordingly and indicate his or her initials in the appropriate location of the electronic ballot and submit the vote for further processing by the Proxy Administrator. If the analyst believes the proxy should be voted contrary to the Guidelines, he or she will submit the proposal, along with his or her recommended vote and ISS’s recommended vote, if any, to the Proxy Voting Committee, which reviews the proposal and the analyst’s recommendation and makes a voting decision by majority vote. If a proposal is not explicitly addressed by the Guidelines but the analyst agrees with the voting recommendation of ISS regarding that proposal, he or she will vote the proxy in accordance with such recommendation and indicate his or her initials in the appropriate location of the electronic ballot and submit the vote for further processing by the Proxy Administrator. If a proposal is not explicitly addressed by the Guidelines and the analyst believes the proxy should be voted contrary to the ISS recommendation, he or she will submit the proposal, along with his or her recommended vote and ISS’s recommended vote to the Proxy Voting Committee, which reviews the proposal and the analyst’s recommendation and makes a voting decision by majority vote. If neither the Guidelines nor ISS address the proxy proposal, the analyst will submit the proposal and his or her recommended vote to the Proxy Voting Committee, which makes a voting decision by majority vote. That Proxy Voting Committee decision is reflected in the electronic ballot.
In the case where securities that are not on the Firm’s Approved Lists of domestic, international or small cap securities are held in managed accounts, the Proxy Administrator, or designated back-up, will vote all shares in accordance with the Firm’s guidelines or, if the guidelines do not address the particular issue, in accordance with the guidance of ISS.
In the case of a conflict of interest, the Proxy Administrator will vote in accordance with the procedures set forth in the Conflicts of Interest provisions described above.
Voting Ballots. For shares held in The Oakmark Funds and other client accounts, the IT Department sends a daily holdings file to ISS detailing the holdings in the Funds and other client accounts. ISS is responsible for reconciling this information with the information it receives from the custodians and escalating any discrepancies to the attention of the Proxy Administrator. The Proxy Administrator works with ISS and custodians to resolve any discrepancies to ensure that all shares entitled to vote are voted.
Recordkeeping and Reporting. Much of Harris’ recordkeeping and reporting is maintained electronically on ISS’s systems. In the event that records are not held electronically within ISS’s system, Harris will maintain records of proxy voting proposals received, records of votes cast on behalf of clients, and any documentation material to a proxy voting decision as required by law. Upon request, or on an annual basis for ERISA accounts, Harris will provide clients with the proxy voting record for that client’s account. In addition, annually, Harris will file with the U.S. Securities and Exchange Commission and make available on the Oakmark Funds’ website the voting record for the Oakmark Funds for the previous one-year period ended June 30th.
Compliance Testing. The Compliance Department will conduct testing of these procedures periodically, based upon the outcome of the annual Compliance Risk Assessment Methodology for this area.
Approved by the Proxy Voting Committee on February 22, 2016
Amended 2/1/15, 2/22/16
B-177
HARRIS ASSOCIATES L.P.
SUPPLEMENTAL PROXY VOTING GUIDELINES
Effective February 2016
1. Harris will normally vote in accordance with the recommendations of Institutional Shareholder Services (“ISS”) with respect to the election of directors for Japanese companies.
2. For European companies, Harris will normally vote in favor of proposals for employee stock purchase plans, so long as shares purchased through such plans are sold at no less than 80% of current market value
3. Harris will normally vote in favor of the election of non-independent directors who serve on audit, compensation and nominating committees in cases where the director is deemed non-independent solely because of his or her tenure as a director or status as an employee or shareholder representative where such representatives are required by law to serve on such committees.1
4. Harris will vote in favor of proxy access proposals if either (a) management recommends voting in favor of the proposal or (b) the proposal meets all of the following criteria:
| • | The shareholders making the proposal have an ownership threshold of 5% of the voting power |
| • | The shareholders making the proposal each have 3 years of continuous ownership |
| • | The proposal does not exceed a cap on shareholder nominees of 25% of the board |
| • | The proposal does not exceed a limit of 20 on the number of shareholders permitted to form a nominating group |
| 1 | Harris has an existing guideline that states that we will normally vote against the election of non-independent directors who serve on audit, compensation and nominating committees. We do not have a specific guideline that defines “independence”, and ISS defines independence differently depending on the market. For example, for many international markets (primarily in Europe), ISS considers a director to be non-independent after 12 years of service on a board. Additionally, a number of countries mandate by law that shareholder and employee representatives sit on the board and on special committees, and ISS deems these representatives to be non-independent. We believe that, in most cases, it is in the best interests of shareholders to have such individuals serve on these committees and that they should not be deemed non-independent under Harris’ guideline solely for these reasons. |
B-178
INVESCO ADVISERS, INC.
PROXY VOTING GUIDELINES
Applicable to | All Advisory Clients, including the Invesco Funds | |
Risk Addressed by the Guidelines | Breach of fiduciary duty to client under Investment Advisers Act of 1940 by placing Invesco’s interests ahead of client’s best interests in voting proxies | |
Relevant Law and Other Sources | U.S. Investment Advisers Act of 1940, as amended | |
Last
☒ Reviewed ☒ Revised
by Compliance for Accuracy | April 19, 2016 | |
Guideline Owner | U.S. Compliance and Legal | |
Policy Approver | Invesco Advisers, Inc., Invesco Funds Board | |
Approved/Adopted Date | May 3-4, 2016 |
The following guidelines apply to all institutional and retail funds and accounts that have explicitly authorized Invesco Advisers, Inc. (“Invesco”) to vote proxies associated with securities held on their behalf (collectively, “Clients”).
A. INTRODUCTION
Invesco Ltd. (“IVZ”), the ultimate parent company of Invesco, has adopted a global policy statement on corporate governance and proxy voting (the “Invesco Global Proxy Policy”). The policy describes IVZ’s views on governance matters and the proxy administration and governance approach. Invesco votes proxies by using the framework and procedures set forth in the Invesco Global Proxy Policy, while maintaining the Invesco-specific guidelines described below.
B. PROXY VOTING OVERSIGHT: THE MUTUAL FUNDS’ BOARD OF TRUSTEES
In addition to the Global Invesco Proxy Advisory Committee, the Invesco mutual funds’ board of trustees provides oversight of the proxy process through quarterly reporting and an annual in-person presentation by Invesco’s Global Head of Proxy Governance and Responsible Investment.
C. USE OF THIRD PARTY PROXY ADVISORY SERVICES
Invesco has direct access to third-party proxy advisory analyses and recommendations (currently provided by Glass Lewis (“GL”) and Institutional Shareholder Services, Inc. (“ISS”)), among other research tools, and uses the information gleaned from those sources to make independent voting decisions.
Invesco’s proxy administration team performs extensive initial and ongoing due diligence on the proxy advisory firms that it engages. When deemed appropriate, representatives from the proxy advisory firms are asked to deliver updates directly to the mutual funds’ board of trustees. Invesco conducts semi-annual, in-person policy
B-179
roundtables with key heads of research from ISS and GL to ensure transparency, dialogue and engagement with the firms. These meetings provide Invesco with an opportunity to assess the firms’ capabilities, conflicts of interest and service levels, as well as provide investment professionals with direct insight into the advisory firms’ stances on key governance and proxy topics and their policy framework/methodologies. Invesco’s proxy administration team also reviews the annual SSAE 16 reports for, and the periodic proxy guideline updates published by, each proxy advisory firm to ensure that their guidelines remain consistent with Invesco’s policies and procedures. Furthermore, each proxy advisory firm completes an annual due diligence questionnaire submitted by Invesco, and Invesco conducts on-site due diligence at each firm, in part to discuss their responses to the questionnaire.
If Invesco becomes aware of any material inaccuracies in the information provided by ISS or GL, Invesco’s proxy administration team will investigate the matter to determine the cause, evaluate the adequacy of the proxy advisory firm’s control structure and assess the efficacy of the measures instituted to prevent further errors.
ISS and GL provide updates to previously issued proxy reports when necessary to incorporate newly available information or to correct factual errors. ISS also has a Feedback Review Board, which provides a mechanism for stakeholders to communicate with ISS about issues related to proxy voting and policy formulation, research, and the accuracy of data contained in ISS reports.
D. PROXY VOTING GUIDELINES
The following guidelines describe Invesco’s general positions on various common proxy issues. The guidelines are not intended to be exhaustive or prescriptive. Invesco’s proxy process is investor-driven, and each portfolio manager retains ultimate discretion to vote proxies in the manner that he or she deems to be the most appropriate, consistent with the proxy voting principles and philosophy discussed in the Invesco Global Proxy Policy. Individual proxy votes therefore will differ from these guidelines from time to time.
I. Corporate Governance
Management teams of companies are accountable to the boards of directors and directors of publicly held companies are accountable to shareholders. Invesco endeavors to vote the proxies of companies in a manner that will reinforce the notion of a board’s accountability. Consequently, Invesco generally votes against any actions that would impair the rights of shareholders or would reduce shareholders’ influence over the board.
The following are specific voting issues that illustrate how Invesco applies this principle of accountability.
Elections of directors
In uncontested director elections for companies that do not have a controlling shareholder, Invesco generally votes in favor of slates if they are comprised of at least a majority of independent directors and if the boards’ key committees are fully independent. Key committees include the audit, compensation and governance or nominating Committees. Invesco’s standard of independence excludes directors who, in addition to the directorship, have any material business or family relationships with the companies they serve. Contested director elections are evaluated on a case-by-case basis.
Director performance
Invesco generally withholds votes from directors who exhibit a lack of accountability to shareholders, either through their level of attendance at meetings or by adopting or approving egregious corporate-governance or other policies. In cases of material financial restatements, accounting fraud, habitually late filings, adopting shareholder rights plan (“poison pills”) without shareholder approval, or other areas of poor performance, Invesco may withhold votes from some or all of a company’s directors. In situations where directors’ performance is a concern, Invesco may also support shareholder proposals to take corrective actions, such as so-called “clawback” provisions.
B-180
Auditors and Audit Committee members
Invesco believes a company’s audit committee has a high degree of responsibility to shareholders in matters of financial disclosure, integrity of the financial statements and effectiveness of a company’s internal controls. Independence, experience and financial expertise are critical elements of a well-functioning audit committee. When electing directors who are members of a company’s audit committee, or when ratifying a company’s auditors, Invesco considers the past performance of the committee and holds its members accountable for the quality of the company’s financial statements and reports.
Majority standard in director elections
The right to elect directors is the single most important mechanism shareholders have to promote accountability. Invesco supports the nascent effort to reform the U.S. convention of electing directors, and generally votes in favor of proposals to elect directors by a majority vote.
Staggered Boards/Annual Election of Directors
Invesco generally supports proposals to elect each director annually rather than electing directors to staggered multi-year terms because annual elections increase a board’s level of accountability to its shareholders.
Supermajority voting requirements
Unless required by law in the state of incorporation, Invesco generally votes against actions that would impose any supermajority voting requirement, and generally supports actions to dismantle existing supermajority requirements.
Responsiveness of Directors
Invesco generally withholds votes for directors who do not adequately respond to shareholder proposals that were approved by a majority of votes cast the prior year.
Cumulative voting
The practice of cumulative voting can enable minority shareholders to have representation on a company’s board. Invesco generally supports proposals to institute the practice of cumulative voting at companies whose overall corporate-governance standards indicate a particular need to protect the interests of minority shareholders.
Proxy access
Invesco generally supports shareholders’ nominations of directors in the proxy statement and ballot because it increases the accountability of the board to shareholders. Invesco will generally consider the proposed minimum period of ownership (e.g., three years), minimum ownership percentage (e.g., three percent), limitations on a proponent’s ability to aggregate holdings with other shareholders and the maximum percentage of directors who can be nominated when determining how to vote on proxy access proposals.
Shareholder access
On business matters with potential financial consequences, Invesco generally votes in favor of proposals that would increase shareholders’ opportunities to express their views to boards of directors, proposals that would lower barriers to shareholder action and proposals to promote the adoption of generally accepted best practices in corporate governance. Furthermore, Invesco generally votes for shareholder proposals that are designed to protect shareholder rights if a company’s corporate governance standards indicate that such additional protections are warranted.
Exclusive Forum
Invesco generally supports proposals that would designate a specific jurisdiction in company bylaws as the exclusive venue for certain types of shareholder lawsuits in order to reduce costs arising out of multijurisdictional litigation.
B-181
II. Compensation and Incentives
Invesco believes properly constructed compensation plans that include equity ownership are effective in creating incentives that induce management and employees of companies to create greater shareholder wealth. Invesco generally supports equity compensation plans that promote the proper alignment of incentives with shareholders’ long-term interests, and generally votes against plans that are overly dilutive to existing shareholders, plans that contain objectionable structural features, and plans that appear likely to reduce the value of the Client’s investment.
Following are specific voting issues that illustrate how Invesco evaluates incentive plans.
Executive compensation
Invesco evaluates executive compensation plans within the context of the company’s performance under the executives’ tenure. Invesco believes independent compensation committees are best positioned to craft executive-compensation plans that are suitable for their company-specific circumstances. Invesco views the election of independent compensation committee members as the appropriate mechanism for shareholders to express their approval or disapproval of a company’s compensation practices. Therefore, Invesco generally does not support shareholder proposals to limit or eliminate certain forms of executive compensation. In the interest of reinforcing the notion of a compensation committee’s accountability to shareholders, Invesco generally supports proposals requesting that companies subject each year’s compensation record to an advisory shareholder vote, or so-called “say on pay” proposals.
Equity-based compensation plans
Invesco generally votes against plans that contain structural features that would impair the alignment of incentives between shareholders and management. Such features include the ability to reprice or reload options without shareholder approval, the ability to issue options below the stock’s current market price, or the ability automatically to replenish shares without shareholder approval.
Employee stock-purchase plans
Invesco generally supports employee stock-purchase plans that are reasonably designed to provide proper incentives to a broad base of employees, provided that the price at which employees may acquire stock is at most a 15 percent discount from the market price.
Severance agreements
Invesco generally votes in favor of proposals requiring advisory shareholder ratification of executives’ severance agreements. However, Invesco generally opposes proposals requiring such agreements to be ratified by shareholders in advance of their adoption. Given the vast differences that may occur in these agreements, some severance agreements are evaluated on an individual basis.
III. Capitalization
Examples of management proposals related to a company’s capital structure include authorizing or issuing additional equity capital, repurchasing outstanding stock, or enacting a stock split or reverse stock split. On requests for additional capital stock, Invesco analyzes the company’s stated reasons for the request. Except where the request could adversely affect the Client’s ownership stake or voting rights, Invesco generally supports a board’s decisions on its needs for additional capital stock. Some capitalization proposals require a case-by-case analysis. Examples of such proposals include authorizing common or preferred stock with special voting rights, or issuing additional stock in connection with an acquisition.
IV. Mergers, Acquisitions and Other Corporate Actions
Issuers occasionally require shareholder approval to engage in certain corporate actions such as mergers, acquisitions, name changes, dissolutions, reorganizations, divestitures and reincorporations and the votes for these types of corporate actions are generally determined on a case-by-case basis.
B-182
V. Anti-Takeover Measures
Practices designed to protect a company from unsolicited bids can adversely affect shareholder value and voting rights, and they potentially create conflicts of interests among directors, management and shareholders. Except under special issuer-specific circumstances, Invesco generally votes to reduce or eliminate such measures. These measures include adopting or renewing “poison pills”, requiring supermajority voting on certain corporate actions, classifying the election of directors instead of electing each director to an annual term, or creating separate classes of common or preferred stock with special voting rights. Invesco generally votes against management proposals to impose these types of measures, and generally votes for shareholder proposals designed to reduce such measures. Invesco generally supports shareholder proposals directing companies to subject their anti-takeover provisions to a shareholder vote.
VI. Environmental, Social and Corporate Responsibility Issues
Invesco believes that a company’s response to environmental, social and corporate responsibility issues and the risks attendant to them can have a significant effect on its long-term shareholder value. Invesco recognizes that to manage a corporation effectively, directors and management must consider not only the interest of shareholders, but also the interests of employees, customers, suppliers and creditors, among others. While Invesco generally affords management discretion with respect to the operation of a company’s business, Invesco will evaluate such proposals on a case-by-case basis and will vote proposals relating to these issues in a manner intended to maximize long-term shareholder value.
VII. Routine Business Matters
Routine business matters rarely have the potential to have a material effect on the economic prospects of Clients’ holdings, so Invesco generally supports a board’s discretion on these items. However, Invesco generally votes against proposals where there is insufficient information to make a decision about the nature of the proposal. Similarly, Invesco generally votes against proposals to conduct other unidentified business at shareholder meetings.
D. EXCEPTIONS
Client Maintains Right to Vote Proxies
In the case of institutional or sub-advised Clients, Invesco will vote the proxies in accordance with these guidelines and the Invesco Global Proxy Policy, unless the Client retains in writing the right to vote or the named fiduciary of a Client (e.g., the plan sponsor of an ERISA Client) retains in writing the right to direct the plan trustee or a third party to vote proxies.
Voting for Certain Investment Strategies
For cash sweep investment vehicles selected by a Client but for which Invesco has proxy voting authority over the account and where no other Client holds the same securities, Invesco will vote proxies based on ISS recommendations.
Funds of Funds
Some Invesco Funds offering diversified asset allocation within one investment vehicle own shares in other Invesco Funds. A potential conflict of interest could arise if an underlying Invesco Fund has a shareholder meeting with any proxy issues to be voted on, because Invesco’s asset-allocation funds or target-maturity funds may be large shareholders of the underlying fund. In order to avoid any potential for a conflict, the asset-allocation funds and target maturity funds vote their shares in the same proportion as the votes of the external shareholders of the underlying fund.
B-183
F. POLICIES AND VOTE DISCLOSURE
A copy of these guidelines, the Invesco Global Proxy Policy and the voting record of each Invesco Retail Fund are available on Invesco’s web site, www.invesco.com. In accordance with Securities and Exchange Commission regulations, all Invesco Funds file a record of all proxy-voting activity for the prior 12 months ending June 30th. That filing is made on or before August 31st of each year. In the case of institutional and sub-advised Clients, Clients may contact their client service representative to request information about how Invesco voted proxies on their behalf. Absent specific contractual guidelines, such requests may be made on a semi-annual basis.
Invesco’s Policy Statement on Global Corporate Governance and Proxy Voting
I. Guiding Principles and Philosophy
Public companies hold shareholder meetings, attended by the company’s executives, directors, and shareholders, during which important issues, such as appointments to the company’s board of directors, executive compensation, and auditors, are addressed and where applicable, voted on. Proxy voting gives shareholders the opportunity to vote on issues that impact the company’s operations and policies without being present at the meetings.
Invesco views proxy voting as an integral part of its investment management responsibilities and believes that the right to vote proxies should be managed with the same high standards of care and fiduciary duty to its clients as all other elements of the investment process. Invesco’s proxy voting philosophy, governance structure and process are designed to ensure that proxy votes are cast in accordance with clients’ best interests, which Invesco interprets to mean clients’ best economic interests, this Policy and the operating guidelines and procedures of Invesco’s regional investment centers.
Invesco investment teams vote proxies on behalf of Invesco-sponsored funds and non-fund advisory clients that have explicitly granted Invesco authority in writing to vote proxies on their behalf.
The proxy voting process at Invesco, which is driven by investment professionals, focuses on maximizing long-term value for our clients, protecting clients’ rights and promoting governance structures and practices that reinforce the accountability of corporate management and boards of directors to shareholders. Invesco takes a nuanced approach to voting and, therefore, many matters to be voted upon are reviewed on a case by case basis.
Votes in favor of board or management proposals should not be interpreted as an indication of insufficient consideration by Invesco fund managers. Such votes may reflect the outcome of past or ongoing engagement and active ownership by Invesco with representatives of the companies in which we invest.
II. Applicability of this Policy
This Policy sets forth the framework of Invesco’s corporate governance approach, broad philosophy and guiding principles that inform the proxy voting practices of Invesco’s investment teams around the world. Given the different nature of these teams and their respective investment processes, as well as the significant differences in regulatory regimes and market practices across jurisdictions, not all aspects of this Policy may apply to all Invesco investment teams at all times. In the case of a conflict between this Policy and the operating guidelines and procedures of a regional investment center the latter will control.
III. Proxy Voting for Certain Fixed Income, Money Market Accounts and Index
For proxies held by certain client accounts managed in accordance with fixed income, money market and index strategies (including exchange traded funds), Invesco will typically vote in line with the majority holder of the
B-184
active-equity shares held by Invesco outside of those strategies (“Majority Voting”). In this manner Invesco seeks to leverage the active-equity expertise and comprehensive proxy voting reviews conducted by teams employing active-equity strategies, which typically incorporate analysis of proxy issues as a core component of the investment process. Portfolio managers for accounts employing Majority Voting still retain full discretion to override Majority Voting and to vote the shares as they determine to be in the best interest of those accounts, absent certain types of conflicts of interest, which are discussed elsewhere in this Policy.
IV. Conflicts of Interest
There may be occasions where voting proxies may present a real or perceived conflict of interest between Invesco, as investment manager, and one or more of Invesco’s clients or vendors. Under Invesco’s Code of Conduct, Invesco entities and individuals are strictly prohibited from putting personal benefit, whether tangible or intangible, before the interests of clients. “Personal benefit” includes any intended benefit for Invesco, oneself or any other individual, company, group or organization of any kind whatsoever, except a benefit for the relevant Invesco client.
Firm-level Conflicts of Interest
A conflict of interest may exist if Invesco has a material business relationship with, or is actively soliciting business from, either the company soliciting a proxy or a third party that has a material interest in the outcome of a proxy vote or that is actively lobbying for a particular outcome of a proxy vote (e.g., issuers that are distributors of Invesco’s products, or issuers that employ Invesco to manage portions of their retirement plans or treasury accounts). Invesco’s proxy governance team maintains a list of all such issuers for which a conflict of interest exists.
If the proposal that gives rise to the potential conflict is specifically addressed by this Policy or the operating guidelines and procedures of the relevant regional investment center, Invesco generally will vote the proxy in accordance therewith. Otherwise, based on a majority vote of its members, the Global IPAC (as described below) will vote the proxy.
Because this Policy and the operating guidelines and procedures of each regional investment center are pre-determined and crafted to be in the best economic interest of clients, applying them to vote client proxies should, in most instances, adequately resolve any potential conflict of interest. As an additional safeguard, persons from Invesco’s marketing, distribution and other customer-facing functions may not serve on the Global IPAC. For the avoidance of doubt, Invesco may not consider Invesco Ltd.’s pecuniary interest when voting proxies on behalf of clients.
Personal Conflicts of Interest
A conflict also may exist where an Invesco employee has a known personal relationship with other proponents of proxy proposals, participants in proxy contests, corporate directors, or candidates for directorships.
All Invesco personnel with proxy voting responsibilities are required to report any known personal conflicts of interest regarding proxy issues with which they are involved. In such instances, the individual(s) with the conflict will be excluded from the decision-making process relating to such issues.
Other Conflicts of Interest
In order to avoid any appearance of a conflict of interest, Invesco will not vote proxies issued by, or related to matters involving, Invesco Ltd. that may be held in client accounts from time to time.1 Shares of an Invesco-sponsored fund held by other Invesco funds will be voted in the same proportion as the votes of external shareholders of the underlying fund.
| 1 | Generally speaking, Invesco does not invest for its clients in the shares of Invesco Ltd., however, limited exceptions apply in the case of funds or accounts designed to track an index that includes Invesco Ltd. as a component. |
B-185
V. Use of Third-Party Proxy Advisory Services
Invesco may supplement its internal research with information from third-parties, such as proxy advisory firms. However, Invesco generally retains full and independent discretion with respect to proxy voting decisions.
As part of its fiduciary obligation to clients, Invesco performs extensive initial and ongoing due diligence on the proxy advisory firms it engages. This includes reviews of information regarding the capabilities of their research staffs and internal controls, policies and procedures, including those relating to possible conflicts of interest. In addition, Invesco regularly monitors and communicates with these firms and monitors their compliance with Invesco’s performance and policy standards.
VI. Global Proxy Voting Platform and Administration
Guided by its philosophy that investment teams should manage proxy voting, Invesco has created the Global Invesco Proxy Advisory Committee (“Global IPAC”). The Global IPAC is a global investments-driven committee comprised of representatives from various investment management teams and Invesco’s Global Head of Proxy Governance and Responsible Investment (“Head of Proxy Governance”). The Global IPAC provides a forum for investment teams to monitor, understand and discuss key proxy issues and voting trends within the Invesco complex. Absent a conflict of interest, the Global IPAC representatives, in consultation with the respective investment team, are responsible for voting proxies for the securities the team manages (unless such responsibility is explicitly delegated to the portfolio managers of the securities in question) In addition to the Global IPAC, for some clients, third parties (e.g., U.S. mutual fund boards) provide oversight of the proxy process. The Global IPAC and Invesco’s proxy administration and governance team, compliance and legal teams regularly communicate and review this Policy and the operating guidelines and procedures of each regional investment center to ensure that they remain consistent with clients’ best interests, regulatory requirements, governance trends and industry best practices.
Invesco maintains a proprietary global proxy administration platform, known as the “fund manager portal” and supported by the Head of Proxy Governance and a dedicated team of internal proxy specialists. The platform streamlines the proxy voting and ballot reconciliation processes, as well as related functions, such as share blocking and managing conflicts of interest issuers. Managing these processes internally, as opposed to relying on third parties, gives Invesco greater quality control, oversight and independence in the proxy administration process.
The platform also includes advanced global reporting and record-keeping capabilities regarding proxy matters that enable Invesco to satisfy client, regulatory and management requirements. Historical proxy voting information, including commentary by investment professionals regarding the votes they cast, where applicable, is stored to build institutional knowledge across the Invesco complex with respect to individual companies and proxy issues. Certain investment teams also use the platform to access third-party proxy research.
VII. Non-Votes
In the great majority of instances, Invesco is able to vote proxies successfully. However, in certain circumstances Invesco may refrain from voting where the economic or other opportunity costs of voting exceeds any anticipated benefits of that proxy proposal. In addition, there may be instances in which Invesco is unable to vote all of its clients’ proxies despite using commercially reasonable efforts to do so. For example:
| · | Invesco may not receive proxy materials from the relevant fund or client custodian with sufficient time and information to make an informed independent voting decision. In such cases, Invesco may choose not to vote, to abstain from voting, to vote in line with management or to vote in accordance with proxy advisor recommendations. These matters are left to the discretion of the fund manager. |
B-186
| · | If the security in question is on loan as part of a securities lending program, Invesco may determine that the benefit to the client of voting a particular proxy is outweighed by the revenue that would be lost by terminating the loan and recalling the securities. |
| · | In some countries the exercise of voting rights imposes temporary transfer restrictions on the related securities (“share blocking”). Invesco generally refrains from voting proxies in share-blocking countries unless Invesco determines that the benefit to the client(s) of voting a specific proxy outweighs the client’s temporary inability to sell the security. |
| · | Some companies require a representative to attend meetings in person in order to vote a proxy. In such cases, Invesco may determine that the costs of sending a representative or signing a power-of-attorney outweigh the benefit of voting a particular proxy. |
VIII. Proxy Voting Guidelines
The following guidelines describe Invesco’s general positions on various common proxy voting issues. This list is not intended to be exhaustive or prescriptive. As noted above, Invesco’s proxy process is investor-driven, and each fund manager retains ultimate discretion to vote proxies in the manner they deem most appropriate, consistent with Invesco’s proxy voting principles and philosophy discussed in Sections I through IV. Individual proxy votes therefore will differ from these guidelines from time to time.
A. Shareholder Access and Treatment of Shareholder Proposals
Invesco reviews on a case by case basis but generally votes in favor of proposals that would increase shareholders’ opportunities to express their views to boards of directors, proposals that would lower barriers to shareholder action, and proposals to promote the adoption of generally accepted best practices in corporate governance, provided that such proposals would not require a disproportionate amount of management attention or corporate resources or otherwise that may inappropriately disrupt the company’s business and main purpose, usually set out in their reporting disclosures and business model. Likewise, Invesco reviews on a case by case basis but generally votes for shareholder proposals that are designed to protect shareholder rights if a company’s corporate governance standards indicate that such additional protections are warranted (for example, where minority shareholders’ rights are not adequately protected).
B. Environmental, Social and Corporate Responsibility Issues
Invesco believes that a company’s long-term response to environmental, social and corporate responsibility issues can significantly affect its long-term shareholder value. We recognize that to manage a corporation effectively, directors and management may consider not only the interests of shareholders, but also the interests of employees, customers, suppliers, creditors and the local community, among others. While Invesco generally affords management discretion with respect to the operation of a company’s business, Invesco will evaluate such proposals on a case by case basis and will vote proposals relating to these issues in a manner intended to maximize long-term shareholder value.
C. Capitalization Structure Issues
i. Stock Issuances
Invesco generally supports a board’s decisions about the need for additional capital stock to meet ongoing corporate needs, except where the request could adversely affect Invesco clients’ ownership stakes or voting rights. Some capitalization proposals, such as those to authorize common or preferred stock with special voting rights or to issue additional stock in connection with an acquisition, may require additional analysis. Invesco generally opposes proposals to authorize classes of preferred stock with unspecified voting, conversion, dividend or other rights (“blank check” stock) when they appear to be intended as an anti-takeover mechanism; such issuances may be supported when used for general financing purposes.
B-187
ii. Stock Splits
Invesco generally supports a board’s proposal to increase common share authorization for a stock split, provided that the increase in authorized shares would not result in excessive dilution given the company’s industry and performance in terms of shareholder returns.
iii. Share Repurchases
Invesco generally supports a board’s proposal to institute open-market share repurchase plans only if all shareholders participate on an equal basis.
D. Corporate Governance Issues
i. Board of Directors
| 1. | Director Nominees in Uncontested Elections |
Subject to the other considerations described below, in an uncontested director election for a company without a controlling shareholder, Invesco generally votes in favor of the director slate if it is comprised of at least a majority of independent directors and if the board’s key committees are fully independent, effective and balanced. Key committees include the audit, compensation/remuneration and governance/nominating committees. Invesco’s standard of independence excludes directors who, in addition to the directorship, have any material business or family relationships with the companies they serve.
| 2. | Director Nominees in Contested Elections |
Invesco recognizes that short-term investment sentiments influence the corporate governance landscape and may influence companies in Invesco clients’ portfolios and more broadly across the market. Invesco recognizes that short-term investment sentiment may conflict with long- term value creation and as such looks at each proxy contest matter on a case by case basis, considering factors such as:
| · | Long-term financial performance of the company relative to its industry, |
| · | Management’s track record, |
| · | Background to the proxy contest, |
| · | Qualifications of director nominees (both slates), |
| · | Evaluation of what each side is offering shareholders as well as the likelihood that the proposed objectives and goals can be met, and |
| · | Stock ownership positions in the company. |
| 3. | Director Accountability |
Invesco generally withholds votes from directors who exhibit a lack of accountability to shareholders. Examples include, without limitation, poor attendance (less than 75%, absent extenuating circumstances) at meetings, failing to implement shareholder proposals that have received a majority of votes and/or by adopting or approving egregious corporate-governance or other policies. In cases of material financial restatements, accounting fraud, habitually late filings, adopting shareholder rights plan (“poison pills”) without shareholder approval, or other areas of poor performance, Invesco may withhold votes from some or all of a company’s directors. In situations where directors’ performance is a concern, Invesco may also support shareholder proposals to take corrective actions such as so-called “clawback” provisions.
B-188
| 4. | Director Independence |
Invesco generally supports proposals to require a majority of directors to be independent unless particular circumstances make this not feasible or in the best interests of shareholders. We generally vote for proposals that would require the board’s audit, compensation/remuneration, and/or governance/nominating committees to be composed exclusively of independent directors since this minimizes the potential for conflicts of interest.
| 5. | Director Indemnification |
Invesco recognizes that individuals may be reluctant to serve as corporate directors if they are personally liable for all related lawsuits and legal costs. As a result, reasonable limitations on directors’ liability can benefit a company and its shareholders by helping to attract and retain qualified directors while preserving recourse for shareholders in the event of misconduct by directors. Invesco, therefore, generally supports proposals to limit directors’ liability and provide indemnification and/or exculpation, provided that the arrangements are limited to the director acting honestly and in good faith with a view to the best interests of the company and, in criminal matters, are limited to the director having reasonable grounds for believing the conduct was lawful.
| 6. | Separate Chairperson and CEO |
Invesco evaluates these proposals on a case by case basis, recognizing that good governance requires either an independent chair or a qualified, proactive, and lead independent director.
Voting decisions may take into account, among other factors, the presence or absence of:
| · | a designated lead director, appointed from the ranks of the independent board members, with an established term of office and clearly delineated powers and duties; |
| · | a majority of independent directors; |
| · | completely independent key committees; |
| · | committee chairpersons nominated by the independent directors; |
| · | CEO performance reviewed annually by a committee of independent directors; and |
| · | established governance guidelines. |
| 7. | Majority/Supermajority/Cumulative Voting for Directors |
The right to elect directors is the single most important mechanism shareholders have to promote accountability. Invesco generally votes in favor of proposals to elect directors by a majority vote. Except in cases where required by law in the jurisdiction of incorporation or when a company has adopted formal governance principles that present a meaningful alternative to the majority voting standard, Invesco generally votes against actions that would impose any supermajority voting requirement, and generally supports actions to dismantle existing supermajority requirements.
The practice of cumulative voting can enable minority shareholders to have representation on a company’s board. Invesco generally opposes such proposals as unnecessary where the company has adopted a majority voting standard. However, Invesco generally supports proposals to institute the practice of cumulative voting at companies whose overall corporate-governance standards indicate a particular need to protect the interests of minority shareholders.
| 8. | Staggered Boards/Annual Election of Directors |
Invesco generally supports proposals to elect each director annually rather than electing directors to staggered multi-year terms because annual elections increase a board’s level of accountability to its shareholders.
B-189
| 9. | Board Size |
Invesco believes that the number of directors is an important factor to consider when evaluating the board’s ability to maximize long-term shareholder value. Invesco approaches proxies relating to board size on a case by case basis but generally will defer to the board with respect to determining the optimal number of board members, provided that the proposed board size is sufficiently large to represent shareholder interests and sufficiently limited to remain effective.
| 10. | Term Limits for Directors |
Invesco believes it is important for a board of directors to examine its membership regularly with a view to ensuring that the company continues to benefit from a diversity of director viewpoints and experience. We generally believe that an individual board’s nominating committee is best positioned to determine whether director term limits would be an appropriate measure to help achieve these goals and, if so, the nature of such limits.
ii. Audit Committees and Auditors
| 1. | Qualifications of Audit Committee and Auditors |
Invesco believes a company’s Audit Committee has a high degree of responsibility to shareholders in matters of financial disclosure, integrity of the financial statements and effectiveness of a company’s internal controls. Independence, experience and financial expertise are critical elements of a well-functioning Audit Committee. When electing directors who are members of a company’s Audit Committee, or when ratifying a company’s auditors, Invesco considers the past performance of the Audit Committee and holds its members accountable for the quality of the company’s financial statements and reports.
| 2. | Auditor Indemnifications |
A company’s independent auditors play a critical role in ensuring and attesting to the integrity of the company’s financial statements. It is therefore essential that they perform their work in accordance with the highest standards. Invesco generally opposes proposals that would limit the liability of or indemnify auditors because doing so could serve to undermine this obligation.
| 3. | Adequate Disclosure of Auditor Fees |
Understanding the fees earned by the auditors is important for assessing auditor independence. Invesco’s support for the re-appointment of the auditors will take into consideration the availability of adequate disclosure concerning the amount and nature of audit versus non-audit fees. Invesco generally will support proposals that call for this disclosure if it is not already being made.
E. Remuneration and Incentives
Invesco believes properly constructed compensation plans that include equity ownership are effective in creating incentives that induce management and employees of portfolio companies to create greater shareholder wealth. Invesco generally supports equity compensation plans that promote the proper alignment of incentives with shareholders’ long-term interests, and generally votes against plans that are overly dilutive to existing shareholders, plans that contain objectionable structural features, and plans that appear likely to reduce the value of the client’s investment.
i. Independent Compensation/Remuneration Committee
Invesco believes that an independent, experienced and well-informed compensation/remuneration committee is critical to ensuring that a company’s remuneration practices align with shareholders’ interests and, therefore, generally supports proposals calling for a compensation/remuneration committee to be comprised solely of independent directors.
B-190
ii. Advisory Votes on Executive Compensation
Invesco believes that an independent compensation/remuneration committee of the board, with input from management, is generally best positioned to determine the appropriate components and levels of executive compensation, as well as the appropriate frequency of related shareholder advisory votes. This is particularly the case where shareholders have the ability to express their views on remuneration matters through annual votes for or against the election of the individual directors who comprise the compensation/remuneration committee. Invesco, therefore, generally will support management’s recommendations with regard to the components and levels of executive compensation and the frequency of shareholder advisory votes on executive compensation. However, Invesco will vote against such recommendations where Invesco determines that a company’s executive remuneration policies are not properly aligned with shareholder interests or may create inappropriate incentives for management.
iii. Equity Based Compensation Plans
Invesco generally votes against plans that contain structural features that would impair the alignment of incentives between shareholders and management. Such features include, without limitation, the ability to reprice or reload options without shareholder approval, the ability to issue options below the stock’s current market price, or the ability to replenish shares automatically without shareholder approval.
iv. Severance Arrangements
Invesco considers proposed severance arrangements (sometimes known as “golden parachute” arrangements) on a case-by-case basis due to the wide variety among their terms. Invesco acknowledges that in some cases such arrangements, if reasonable, may be in shareholders’ best interests as a method of attracting and retaining high quality executive talent. Invesco generally votes in favor of proposals requiring advisory shareholder ratification of senior executives’ severance agreements while generally opposing proposals that require such agreements to be ratified by shareholders in advance of their adoption.
v. “Claw Back” Provisions
Invesco generally supports so called “claw back” policies intended to recoup remuneration paid to senior executives based upon materially inaccurate financial reporting (as evidenced by later restatements) or fraudulent accounting or business practices.
vi. Employee Stock Purchase Plans
Invesco generally supports employee stock purchase plans that are reasonably designed to provide proper incentives to a broad base of employees, provided that the price at which employees may acquire stock represents a reasonable discount from the market price.
F. Anti-Takeover Defenses; Reincorporation
Measures designed to protect a company from unsolicited bids can adversely affect shareholder value and voting rights, and they have the potential to create conflicts of interests among directors, management and shareholders. Such measures include adopting or renewing shareholder rights plans (“poison pills”), requiring supermajority voting on certain corporate actions, classifying the election of directors instead of electing each director to an annual term, or creating separate classes of common or preferred stock with special voting rights. In determining whether to support a proposal to add, eliminate or restrict anti-takeover measures, Invesco will examine the particular elements of the proposal to assess the degree to which it would adversely affect shareholder rights of adopted. Invesco generally supports shareholder proposals directing companies to subject their anti-takeover provisions to a shareholder vote. Invesco generally opposes payments by companies to minority shareholders intended to dissuade such shareholders from pursuing a takeover or other changes (sometimes known as “greenmail”) because these payments result in preferential treatment of some shareholders over others.
B-191
Reincorporation involves re-establishing the company in a different legal jurisdiction. Invesco generally will vote for proposals to reincorporate a company provided that the board and management have demonstrated sound financial or business reasons for the move. Invesco generally will oppose proposals to reincorporate if they are solely part of an anti-takeover defense or intended to limit directors’ liability.
B-192
J.P. MORGAN INVESTMENT MANAGEMENT, INC.
Proxy Voting Guidelines. The Board of Trustees has delegated to J.P. Morgan Investment Management, Inc. (“JPMIM”) and its affiliated advisers, proxy voting authority with respect to the fund’s portfolio securities. To ensure that the proxies of portfolio companies are voted in the best interests of the fund, the fund’s Board of Trustees has adopted JPMIM’s detailed proxy voting procedures (the “Procedures”) that incorporate guidelines (“Guidelines”) for voting proxies on specific types of issues.
JPMIM and its affiliated advisers are part of a global asset management organization with the capability to invest in securities of issuers located around the globe. Because the regulatory framework and the business cultures and practices vary from region to region, the Guidelines are customized for each region to take into account such variations. Separate Guidelines cover the regions of (1) North America, (2) Europe, Middle East, Africa, Central America and South America, (3) Asia (ex-Japan) and (4) Japan, respectively.
Notwithstanding the variations among the Guidelines, all of the Guidelines have been designed with the uniform objective of encouraging corporate action that enhances shareholder value. As a general rule, in voting proxies of a particular security, JPMIM and its affiliated advisers will apply the Guidelines of the region in which the issuer of such security is organized. Except as noted below, proxy voting decisions will be made in accordance with the Guidelines covering a multitude of both routine and non-routine matters that JPMIM and its affiliated adviser have encountered globally, based on many years of collective investment management experience.
To oversee and monitor the proxy-voting process, JPMIM has established a proxy committee and appointed a proxy administrator in each global location where proxies are voted. The primary function of each proxy committee is to review periodically general proxy-voting matters, review and approve the Guidelines annually, and provide advice and recommendations on general proxy-voting matters as well as on specific voting issues. The procedures permit an independent voting service, to perform certain services otherwise carried out or coordinated by the proxy administrator.
Although for many matters the Guidelines specify the votes to be cast, for many others, the Guidelines contemplate case-by-case determinations. In addition, there will undoubtedly be proxy matters that are not contemplated by the Guidelines. For both of these categories of matters and to override the Guidelines, the Procedures require a certification and review process to be completed before the vote is cast. That process is designed to identify actual or potential material conflicts of interest (between the fund on the one hand, and JPMIM and its affiliates on the other hand) and ensure that the proxy vote is cast in the best interests of the fund. A conflict is deemed to exist when the proxy is for JPMorgan Chase & Co. stock or for J.P. Morgan Funds, or when the proxy administrator has actual knowledge indicating that a JPMorgan affiliate is an investment banker or rendered a fairness opinion with respect to the matter that is the subject of the proxy vote. When such conflicts are identified, the proxy will be voted by an independent third party either in accordance with JPMorgan proxy voting guidelines or by the third party using its own guidelines.
When other types of potential material conflicts of interest are identified, the proxy administrator and, as necessary, JPMorgan Asset Management’s Chief Fiduciary Officer will evaluate the potential conflict of interest and determine whether such conflict actually exists, and if so, will recommend how JPMIM will vote the proxy. In addressing any material conflict, JPMIM may take one or more of the following measures (or other appropriate action): removing or “walling off” from the proxy voting process certain JPMIM personnel with knowledge of the conflict, voting in accordance with any applicable Guideline if the application of the Guideline would objectively result in the casting of a proxy vote in a predetermined manner, or deferring the vote to or obtaining a recommendation from a third independent party, in which case the proxy will be voted by, or in accordance with the recommendation of, the independent third party.
B-193
The following summarizes some of the more noteworthy types of proxy voting policies of the non-U.S. Guidelines:
| · | Corporate governance procedures differ among the countries. Because of time constraints and local customs, it is not always possible for JPMIM to receive and review all proxy materials in connection with each item submitted for a vote. Many proxy statements are in foreign languages. Proxy materials are generally mailed by the issuer to the sub-custodian which holds the securities for the client in the country where the portfolio company is organized, and there may not be sufficient time for such materials to be transmitted to JPMIM in time for a vote to be cast. In some countries, proxy statements are not mailed at all, and in some locations, the deadline for voting is two to four days after the initial announcement that a vote is to be solicited and it may not always be possible to obtain sufficient information to make an informed decision in good time to vote. |
| · | Certain markets require that shares being tendered for voting purposes are temporarily immobilized from trading until after the shareholder meeting has taken place. Elsewhere, notably emerging markets, it may not always be possible to obtain sufficient information to make an informed decision in good time to vote. Some markets require a local representative to be hired in order to attend the meeting and vote in person on our behalf, which can result in considerable cost. JPMIM also considers the cost of voting in light of the expected benefit of the vote. In certain instances, it may sometimes be in the Fund’s best interests to intentionally refrain from voting in certain overseas markets from time to time. |
| · | Where proxy issues concern corporate governance, takeover defense measures, compensation plans, capital structure changes and so forth, JPMIM pays particular attention to management’s arguments for promoting the prospective change JPMIM’s sole criterion in determining its voting stance is whether such changes will be to the economic benefit of the beneficial owners of the shares. |
| · | JPMIM is in favor of a unitary board structure of the type found in the United Kingdom as opposed to tiered board structures. Thus, JPMIM will generally vote to encourage the gradual phasing out of tiered board structures, in favor of unitary boards. However, since tiered boards are still very prevalent in markets outside of the United Kingdom, local market practice will always be taken into account. |
| · | JPMIM will use its voting powers to encourage appropriate levels of board independence, taking into account local market practice. |
| · | JPMIM will usually vote against discharging the board from responsibility in cases of pending litigation, or if there is evidence of wrongdoing for which the board must be held accountable. |
| · | JPMIM will vote in favor of increases in capital which enhance a company’s long-term prospects. JPMIM will also vote in favor of the partial suspension of preemptive rights if they are for purely technical reasons (e.g., rights offers which may not be legally offered to shareholders in certain jurisdictions). However, JPMIM will vote against increases in capital which would allow the company to adopt “poison pill” takeover defense tactics, or where the increase in authorized capital would dilute shareholder value in the long term. |
| · | JPMIM will vote in favor of proposals which will enhance a company’s long-term prospects. JPMIM will vote against an increase in bank borrowing powers which would result in the company reaching an unacceptable level of financial leverage, where such borrowing is expressly intended as part of a takeover defense, or where there is a material reduction in shareholder value. |
| · | JPMIM will generally vote against anti-takeover devices. |
| · | Where social or environmental issues are the subject of a proxy vote, JPMIM will consider the issue on a case-by-case basis, keeping in mind at all times the best economic interests of its clients. |
B-194
The following summarizes some of the more noteworthy types of proxy voting policies of the U.S. Guidelines:
| · | JPMIM considers votes on director nominees on a case-by-case basis. Votes generally will be withheld from directors who: (a) attend less than 75% of board and committee meetings without a valid excuse; (b) implement or renew a dead-hand poison pill; (c) are affiliated directors who serve on audit, compensation or nominating committees or are affiliated directors and the full board serves on such committees or the company does not have such committees; (d) ignore a shareholder proposal that is approved by a majority of either the shares outstanding or the votes cast based on a review over a consecutive two year time frame; (e) unilaterally adopt a litigation fee-shifting by-law without shareholder approval; (f) are insiders and affiliated outsiders on boards that are not at least majority independent; or (g) are CEOs of publically-traded companies who serve on more than three public boards or serve on more than four public company boards. In addition, votes are generally withheld for directors who serve on committees in certain cases. For example, the Adviser generally withholds votes from audit committee members in circumstances in which there is evidence that there exists material weaknesses in the company’s internal controls. |
| · | JPMIM considers vote proposals with respect to compensation plans on a case-by-case basis. The analysis of compensation plans focuses primarily on the transfer of shareholder wealth (the dollar cost of pay plans to shareholders) and includes an analysis of the structure of the plan and pay practices of other companies in the relevant industry and peer companies. Other matters included in the analysis are the amount of the company’s outstanding stock to be reserved for the award of stock options, whether the exercise price of an option is less than the stock’s fair market value at the date of the grant of the options, and whether the plan provides for the exchange of outstanding options for new ones at lower exercise prices. |
| · | JPMIM votes proposals to classify boards on a case-by-case basis, but normally will vote in favor of such proposal if the issuer’s governing documents contain each of eight enumerated safeguards (for example, a majority of the board is composed of independent directors and the nominating committee is composed solely of such directors). |
| · | JPMIM also considers management poison pill proposals on a case-by-case basis, looking for shareholder-friendly provisions before voting in favor. |
| · | JPMIM votes against proposals for a super-majority vote to approve a merger. |
| · | JPMIM considers proposals to increase common and/or preferred shares and to issue shares as part of a debt restructuring plan on a case-by-case basis, taking into account such factors as the extent of dilution and whether the transaction will result in a change in control. |
| · | JPMIM also considers on a case-by-case basis proposals to change an issuer’s state of incorporation, mergers and acquisitions and other corporate restructuring proposals and certain social issue proposals. |
| · | JPMIM generally votes for management proposals which seek shareholder approval to make the state of incorporation the exclusive forum for disputes if the company is a Delaware corporation; otherwise, JPMIM votes on a case by case basis. |
| · | JPMIM generally supports management disclosure practices for environmental issues except for those companies that have been involved in significant controversies, fines or litigation related to environmental issues. |
| · | JPMIM reviews Say on Pay proposals on a case by case basis with additional review of proposals where the issuer’s previous year’s proposal received a low level of support. |
B-195
JACKSON SQUARE PARTNERS, LLC
Summary of Proxy Voting Policies and Procedures
July 2016
Jackson Square Partners, LLC (“JSP”) has adopted written proxy voting policies and procedures (the “Procedures”) that govern the voting of client securities. The Procedures have been designed to ensure that JSP votes proxies or gives proxy voting advice that is in the best interests of its clients. JSP generally votes proxies with the goal of promoting high levels of corporate governance and adequate disclosure of company policies and practices.
The Procedures include specific proxy voting guidelines that set forth the general principles JSP uses to determine how to vote in client accounts for which it has proxy voting responsibility. The Proxy Committee, which includes the Chief Compliance Officer, reviews the Procedures to help ensure that they are designed to allow JSP to vote proxies in a manner consistent with the best interests of its clients.
JSP generally expects that its clients will authorize it to vote all proxies relating to shares held in an account over which it has investment discretion. At times, however, certain clients may direct JSP how to vote on a particular proxy for a security held in the client’s account. Where a client has reserved the right to vote proxies, JSP will not participate in voting of proxies.
JSP reserves the right, on occasion, to abstain from voting a proxy or a specific proxy item when it concludes that the cost of voting outweighs the potential benefit or when JSP otherwise believes that voting does not serve its clients’ best interests. Clients should also be aware that voting proxies of issuers in non-U.S. markets may give rise to a number of administrative issues that may prevent JSP from voting proxies for certain companies in these jurisdictions. For example, JSP may receive shareholder meeting notices without enough time to fully consider the proxy or after the cut-off date for voting. Other markets may require JSP to provide local agents with power of attorney prior to implementing its voting instructions.
In order to facilitate the process of voting proxies, JSP has contracted with Institutional Shareholder Services (“ISS”). Most proxies that JSP receives on behalf of clients are voted by ISS in accordance with the proxy voting guidelines established by ISS. In these circumstances, ISS will review the relevant facts and circumstances and research the issue to determine how the proxy should be voted. The Proxy Committee and portfolio managers will also review such proxies and assess whether to override the ISS vote recommendations. Although JSP generally votes proxies in accordance with the ISS vote recommendations, JSP reserves the right to vote certain issues counter the ISS guidelines if, after a review of the matter, JSP determines that such a vote would better serve the client’s best interests.
Because the majority of proxies are voted by ISS pursuant to the pre-determined guidelines, it normally is not be necessary for JSP to make an actual determination of how to vote a particular proxy, thereby reducing conflicts of interest for JSP during the proxy voting process. Nevertheless, the Procedures include a section to address the possibility of conflicts of interest between JSP and its clients. In the instances where JSP may consider voting a proxy contrary to the ISS recommendation, the Proxy Committee will first take steps to identify any possible conflict of interest. If there is no perceived conflict of interest, the Committee will vote the proxy according to its internal procedures. If the members of the Proxy Committee have actual knowledge of a conflict of interest, the Committee will normally use another independent third party to do additional research on the particular proxy issue in order to make a recommendation on how to vote the proxy in the best interest of the client. The Proxy Committee will then review the proxy voting materials and recommendation provided by ISS and the independent third party to determine how to vote the issue in a manner that the Proxy Committee believes is consistent with the Procedures and in the best interests of the client.
After a proxy has been voted for a client, ISS will create a record of the vote. The Proxy Committee is responsible for overseeing ISS’s proxy voting activities.
B-196
LOOMIS, SAYLES & COMPANY, L.P.

Proxy Voting Policies and Procedures
June 30, 2004
AMENDED
March 31, 2005
May 16, 2005
March 31, 2007
August 30, 2007
March 31, 2008
June 25, 2008
September 22, 2009
April 1, 2010
February 15, 2011
April 25, 2011
March 5, 2012
May 10, 2012
February 11, 2013
February 7, 2014
September 8, 2014
June 8, 2015
September 1, 2015
April 8, 2016
B-197
B-198
B-199
Loomis, Sayles & Company, L.P. (“Loomis Sayles”) will vote proxies on behalf of a client if, in its investment management agreement (“IMA”) with Loomis Sayles, the client has delegated to Loomis Sayles the authority to vote proxies on its behalf. With respect to IMAs executed with clients prior to June 30, 2004, Loomis Sayles assumes that the proxy voting authority assigned by Loomis Sayles at account setup is accurate unless the client or their representative has instructed Loomis Sayles otherwise. Loomis Sayles has adopted and implemented these policies and procedures (“Proxy Voting Procedures”) to ensure that, where it has voting authority, proxy matters are handled in the best interest of clients, in accordance with Loomis Sayles’ fiduciary duties, SEC rule 206(4)-6 under the Investment Advisers Act of 1940 and Staff Legal Bulletin No. 20 (June 30, 2014). In addition to SEC requirements governing advisers, its Proxy Voting Procedures reflect the long-standing fiduciary standards and responsibilities for ERISA accounts set out in Department of Labor Bulletin 08-2, 29 C.F.R. 2509.08-2 (October 17, 2008).
Loomis Sayles uses the services of third parties (“Proxy Voting Service(s)”), to research and administer the vote on proxies for those accounts and funds for which Loomis Sayles has voting authority. Loomis Sayles will generally follow its express policy with input from the Proxy Voting Services unless the Proxy Committee determines that the client’s best interests are served by voting otherwise.
The following guidelines will apply when voting proxies on behalf of accounts for which Loomis Sayles has voting authority.
| 1. | Client’s Best Interest. Loomis Sayles’ Proxy Voting Procedures are designed and implemented in a way that is reasonably expected to ensure that proxy matters are conducted in the best interest of clients. When considering the best interest of clients, Loomis Sayles has determined that this means the best investment interest of its clients as shareholders of the issuer. Loomis Sayles has established its Proxy Voting Procedures to assist it in making its proxy voting decisions with a view to enhancing the value of its clients’ interests in an issuer over the period during which it expects its clients to hold their investments. Loomis Sayles will vote against proposals that it believes could adversely impact the current or potential market value of the issuer’s securities during the expected holding period. |
| 2. | Client Proxy Voting Policies. Rather than delegating proxy voting authority to Loomis Sayles, a client may (1) retain the authority to vote proxies on securities in its account, (2) delegate voting authority to another party or (3) instruct Loomis Sayles to vote proxies according to a policy that differs from that of Loomis Sayles. Loomis Sayles will honor any of these instructions if the client includes the instruction in writing in its IMA or in a written instruction from a person authorized under the IMA to give such instructions. If Loomis incurs additional costs or expenses in following any such instruction, Loomis may request payment of such additional costs or expenses from the client. |
| 3. | Stated Policies. These policies identify issues where Loomis Sayles will (1) generally vote in favor of a proposal, (2) generally vote against a proposal, (3) generally vote as recommended by the proxy voting service and (4) specifically consider its vote for or against a proposal. However, these policies are guidelines and each vote may be cast differently than the stated policy, taking into consideration all relevant facts and circumstances at the time of the vote. |
| 4. | Abstain from Voting. Our policy is to vote rather than abstain from voting on issues presented unless the client’s best interest requires abstention. Loomis Sayles will abstain in cases where the impact of the expected costs involved in voting exceeds the expected benefits of the vote such as where foreign |
B-200
| corporations follow share-blocking practices or where proxy material is not available in English. Loomis Sayles will vote against ballot issues where the issuer does not provide sufficient information to make an informed decision. In addition, there may be instances where Loomis Sayles is not able to vote proxies on a client’s behalf, such as when ballot delivery instructions have not been processed by a client’s custodian, the Proxy Voting Service has not received a ballot for a client’s account or under other circumstances beyond Loomis Sayles’ control. |
| 5. | Oversight. All issues presented for shareholder vote will be considered under the oversight of the Proxy Committee. All non-routine issues will be directly considered by the Proxy Committee and, when necessary, the equity analyst following the company and/or the portfolio manager of an account holding the security, and will be voted in the best investment interests of the client. All routine for and against issues will be voted according to Loomis Sayles’ policy approved by the Proxy Committee unless special factors require that they be considered by the Proxy Committee and, when necessary, the equity analyst following the company and/or the portfolio manager of an account holding the security. Loomis Sayles’ Proxy Committee has established these routine policies in what it believes are the client’s best interests. |
| 6. | Availability of Procedures. Upon request, Loomis Sayles provides clients with a copy of its Proxy Voting Procedures, as updated from time to time. In addition, Loomis Sayles includes its Proxy Voting Procedures and/or a description of its Proxy Voting Procedures on its public website, www.loomissayles.com, and in its Form ADV, Part II. |
| 7. | Disclosure of Vote. Upon request, a client can obtain information from Loomis Sayles on how its proxies were voted. Any client interested in obtaining this information should contact its Loomis Sayles representatives. |
| 8. | Disclosure to Third Parties. Loomis Sayles’ general policy is not to disclose to third parties how it (or its voting delegate) voted a client’s proxy except that for registered investment companies, Loomis Sayles makes disclosures as required by Rule 30(b)(1)-(4) under the Investment Company Act of 1940 and, from time to time at the request of client groups, Loomis may make general disclosures (not specific as to client) of its voting instructions. |
| 1. | Proxy Committee. Loomis Sayles has established a Proxy Committee. The Proxy Committee is composed of representatives of the Equity Research department and the Legal & Compliance department and other employees of Loomis Sayles as needed. In the event that any member is unable to participate in a meeting of the Proxy Committee, his or her designee acts on his or her behalf. A vacancy in the Proxy Committee is filled by the prior member’s successor in position at Loomis Sayles or a person of equivalent experience. Each portfolio manager of an account that holds voting securities of an issuer or analyst covering the issuer or its securities may be an ad hoc member of the Proxy Committee in connection with the vote of proxies. |
| 2. | Duties. The specific responsibilities of the Proxy Committee include, |
| a. | to develop, authorize, implement and update these Proxy Voting Procedures, including: |
| (i) | annual review of these Proxy Voting Procedures to ensure consistency with internal policies and regulatory agency policies, |
| (ii) | annual review of existing voting guidelines and development of additional voting guidelines to assist in the review of proxy proposals, and |
| (iii) | annual review of the proxy voting process and any general issues that relate to proxy voting; |
B-201
| b. | to oversee the proxy voting process, including: |
| (i) | overseeing the vote on proposals according to the predetermined policies in the voting guidelines, |
| (ii) | directing the vote on proposals where there is reason not to vote according to the predetermined policies in the voting guidelines or where proposals require special consideration, |
| (iii) | consulting with the portfolio managers and analysts for the accounts holding the security when necessary or appropriate, and |
| (iv) | periodically sampling or engaging an outside party to sample proxy votes to ensure they comply with the Proxy Voting Procedures and are cast in accordance with the clients’ best interests; |
| c. | to engage and oversee third-party vendors, such as Proxy Voting Services, including: |
| (i) | determining whether a Proxy Voting Service has the capacity and competency to adequately analyze proxy issues by considering: |
| (a) | the adequacy and quality of the Proxy Voting Service’s staffing and personnel, and |
| (b) | the robustness of the Proxy Voting Service’s policies and procedures regarding its ability to ensure that its recommendations are based on current and accurate information and to identify and address any relevant conflicts of interest, |
| (ii) | providing ongoing oversight of Proxy Voting Services to ensure that proxies continue to be voted in the best interests of clients, |
| (iii) | receiving and reviewing updates from Proxy Voting Services regarding relevant business changes or changes to Proxy Voting Services’ conflict policies and procedures, and |
| (iv) | in the event that the Proxy Committee becomes aware that a Proxy Voting Service’s recommendation was based on a material factual error, investigating the error, considering the nature of the error and the related recommendation, and determining whether the Proxy Voting Service has taken reasonable steps to reduce the likelihood of similar errors in the future; and |
| d. | to develop and/or modify these Proxy Voting Procedures as appropriate or necessary. |
| 3. | Standards. |
| a. | When determining the vote of any proposal for which it has responsibility, the Proxy Committee shall vote in the client’s best interest as described in section 1(B)(1) above. In the event a client believes that its other interests require a different vote, Loomis Sayles shall vote as the client instructs if the instructions are provided as required in section 1(B)(2) above. |
| b. | When determining the vote on any proposal, the Proxy Committee shall not consider any benefit to Loomis Sayles, any of its affiliates, any of its or their clients or service providers, other than benefits to the owner of the securities to be voted. |
| 4. | Charter. The Proxy Committee may adopt a Charter, which shall be consistent with these Proxy Voting Procedures. Any Charter shall set forth the Committee’s purpose, membership and operation and shall include procedures prohibiting a member from voting on a matter for which he or she has a conflict of interest by reason of a direct relationship with the issuer or other party affected by a given proposal (e.g., he or she is a portfolio manager for an account of the issuer). |
B-202
Loomis Sayles has established several policies to ensure that proxy votes are voted in its clients’ best interest and are not affected by any possible conflicts of interest. First, except in certain limited instances, Loomis Sayles votes in accordance with its pre-determined policies set forth in these Proxy Voting Procedures. Second, where these Proxy Voting Procedures allow for discretion, Loomis Sayles will generally consider the recommendations of the Proxy Voting Services in making its voting decisions. However, if the Proxy Committee determines that the Proxy Voting Services’ recommendation is not in the best interest of its clients, then the Proxy Committee may use its discretion to vote against the Proxy Voting Services’ recommendation, but only after taking the following steps: (1) conducting a review for any material conflict of interest Loomis Sayles may have and, (2) if any material conflict is found to exist, excluding anyone at Loomis Sayles who is subject to that conflict of interest from participating in the voting decision in any way. However, if deemed necessary or appropriate by the Proxy Committee after full prior disclosure of any conflict, that person may provide information, opinions or recommendations on any proposal to the Proxy Committee. In such event the Proxy Committee will make reasonable efforts to obtain and consider, prior to directing any vote information, opinions or recommendations from or about the opposing position on any proposal.
E. Recordkeeping and Disclosure.
Loomis Sayles or its Proxy Voting Service will maintain records of proxies voted pursuant to Section 204-2 of the Advisers Act. The records include: (1) a copy of its Proxy Voting Procedures and its charter; (2) proxy statements received regarding client securities; (3) a record of each vote cast; (4) a copy of any document created by Loomis Sayles that is material to making a decision how to vote proxies on behalf of a client or that memorializes the basis for that decision; and (5) each written client request for proxy voting records and Loomis Sayles’ written response to any (written or oral) client request for such records.
Proxy voting books and records are maintained in an easily accessible place for a period of five years, the first two in an appropriate office of Loomis Sayles.
Loomis Sayles will provide disclosure of its Proxy Voting Procedures as well as its voting record as required under applicable SEC rules.
2. PROPOSALS USUALLY VOTED FOR
Proxies involving the issues set forth below generally will be voted FOR.
Adjustments to Par Value of Common Stock: Vote for management proposals to reduce the par value of common stock.
Annual Election of Directors: Vote for proposals to repeal classified boards and to elect all directors annually.
Appraisal Rights: Vote for proposals to restore, or provide shareholders with, rights of appraisal.
Authority to Issue Shares (for certain foreign issuers): Vote for proposals by boards of non-US issuers where: (1) the board’s authority to issue shares with preemptive rights is limited to no more than 66% of the issuer’s issued ordinary share capital; or (2) the board’s authority to issue shares without preemptive rights is limited to no more than 5% of the issuer’s issued ordinary share capital, to the extent such limits continue to be consistent with the guidelines issued by the Association of British Insurers and other UK investor bodies; and the recommendations of the issuer’s board and the Proxy Voting Service are in agreement. Review on a case-by-case basis proposals that do not meet the above criteria.
B-203
Blank Check Preferred Authorization:
| A. | Vote for proposals to create blank check preferred stock in cases when the company expressly states that the stock will not be used as a takeover defense or carry superior voting rights, and expressly states conversion, dividend, distribution and other rights. |
| B. | Vote for shareholder proposals to have blank check preferred stock placements, other than those shares issued for the purpose of raising capital or making acquisitions in the normal course of business, submitted for shareholder ratification. |
| C. | Review on a case-by-case basis proposals to increase the number of authorized blank check preferred shares. |
Chairman and CEO are the Same Person: Vote for proposals that would require the positions of chairman and CEO to be held by different persons.
Changing Corporate Name: Vote for changing the corporate name.
Confidential Voting: Vote for shareholder proposals that request corporations to adopt confidential voting, use independent tabulators and use independent inspectors of election as long as the proposals include clauses for proxy contests as follows: In the case of a contested election, management should be permitted to request that the dissident group honor its confidential voting policy. If the dissidents agree, the policy remains in place. If the dissidents do not agree, the confidential voting policy is waived. Vote for management proposals to adopt confidential voting.
Cumulative Voting: Vote for proposals to permit cumulative voting, except where the issuer already has in place a policy of majority voting.
Delivery of Electronic Proxy Materials: Vote for proposals to allow electronic delivery of proxy materials to shareholders.
Director Nominees in Uncontested Elections:
| A. | Vote for proposals involving routine matters such as election of directors, provided that two-thirds of the directors would be independent and affiliated or inside nominees do not serve on any board committee. |
| B. | Vote against nominees that are CFOs and, generally, against nominees that the Proxy Voting Service has identified as not acting in the best interest of shareholders. Vote against nominees that have attended less than 75% of board and committee meetings, unless a reasonable cause (e.g., health or family emergency) for the absence is noted and accepted by the Proxy Voting Service and the board. Vote against affiliated or inside nominees who serve on a board committee or if two thirds of the board would not be independent. Vote against governance or nominating committee members if there is no independent lead or presiding director and if the CEO and chairman are the same person. Generally, vote against audit committee members if auditor ratification is not proposed, except in cases involving mutual fund board members, who are not required to submit auditor ratification for shareholder approval pursuant to Investment Company Act of 1940 rules. Vote against compensation committee members when the Proxy Voting Service recommends a vote against the issuer’s “say on pay” advisory vote. A recommendation of the Proxy Voting Service will generally be followed when electing directors of foreign companies. |
| C. | Generally, vote against all members of a board committee and not just the chairman or a representative thereof in situations where the Proxy Voting Service finds that the board committee has not acted in the best interest of shareholders. |
B-204
| D. | Vote as recommended by the Proxy Voting Service when directors are being elected as a slate and not individually. |
Director Related Compensation: Vote for proposals that are required by and comply with the applicable statutory or listing requirements governing the issuer. Review on a case-by-case basis all other proposals.
Election of CEO Director Nominees: Vote for a CEO director nominee that sits on less than four U.S.-domiciled company boards and committees. Vote against a CEO director nominee that sits on four or more U.S.-domiciled boards and committees. Vote for a CEO director nominee of non-U.S.-domiciled companies that sits on more than 4 non-U.S.-domiciled company boards and committees.
Election of Mutual Fund Trustees: Vote for nominees who oversee less than 60 mutual fund portfolios. Vote against nominees who oversee 60 or more mutual fund portfolios that invest in substantially different asset classes (e.g., if the applicable portfolios include both fixed income funds and equity funds). Vote on a case-by-case basis for or against nominees who oversee 60 or more mutual fund portfolios that invest in substantially similar asset classes (e.g., if the applicable portfolios include only fixed income funds or only equity funds).
Equal Access: Vote for shareholder proposals that would allow significant company shareholders equal access to management’s proxy material in order to evaluate and propose voting recommendations on proxy proposals and director nominees, and in order to nominate their own candidates to the board.
| A. | Vote for fair price proposals, as long as the shareholder vote requirement embedded in the provision is no more than a majority of disinterested shares. |
| B. | Vote for shareholder proposals to lower the shareholder vote requirement in existing fair price provisions. |
| A. | Vote for shareholder proposals to have golden (top management) and tin (all employees) parachutes submitted for shareholder ratification. |
| B. | Review on a case-by-case basis all proposals to ratify or cancel golden or tin parachutes. |
Greenshoe Options (French issuers only): Vote for proposals by boards of French issuers in favor of greenshoe options that grant the issuer the flexibility to increase an over-subscribed securities issuance by up to 15% so long as such increase takes place on the same terms and within thirty days of the initial issuance, provided that the recommendation of the issuer’s board and the Proxy Voting Service are in agreement. Review on a case-by-case basis proposals that do not meet the above criteria.
Independent Audit, Compensation and Nominating Committees: Vote for proposals requesting that the board audit, compensation and/or nominating committees include independent directors exclusively.
| A. | Vote for shareholder proposals that generally request the board to adopt a policy requiring its chairman to be “independent,” as defined by a relevant exchange or market with respect to any issuer whose enterprise value is, according to the Proxy Voting Service, greater than or equal to $10 billion. |
| B. | Vote such proposals on a case-by-case basis when, according to the Proxy Voting Service, the issuer’s enterprise value is less than $10 billion. |
B-205
Majority Voting: Vote for proposals to permit majority rather than plurality or cumulative voting for the election of directors/trustees.
OBRA (Omnibus Budget Reconciliation Act)-Related Compensation Proposals:
| A. | Vote for plans that simply amend shareholder-approved plans to include administrative features or place a cap on the annual grants any one participant may receive to comply with the provisions of Section 162(m) of OBRA. |
| B. | Vote for amendments to add performance goals to existing compensation plans to comply with the provisions of Section 162(m) of OBRA. |
| C. | Vote for cash or cash-and-stock bonus plans to exempt the compensation from taxes under the provisions of Section 162(m) of OBRA. |
| D. | Votes on amendments to existing plans to increase shares reserved and to qualify the plan for favorable tax treatment under the provisions of Section 162(m) should be evaluated on a case-by-case basis. |
| A. | Generally vote for proposals to ratify auditors. |
| B. | Vote against ratification of auditors where an auditor has a financial interest in or association with the company, and is therefore not independent; or there is reason to believe that the independent auditor has rendered an opinion which is neither accurate nor indicative of the company’s financial position. In general, if non-audit fees amount to 35% or more of total fees paid to a company’s auditor we will vote against ratification and against the members of the audit committee. |
| C. | Vote against ratification of auditors and vote against members of the audit committee where it is known that an auditor has negotiated an alternative dispute resolution procedure. |
Reverse Stock Splits: Vote for management proposals to reduce the number of outstanding shares available through a reverse stock split.
Right to Adjourn: Vote for the right to adjourn in conjunction with a vote for a merger or acquisition or other proposal, and vote against the right to adjourn in conjunction with a vote against a merger or acquisition or other proposal.
Right to Call a Special Meeting: Vote for proposals that set a threshold of 10% of the outstanding voting stock as a minimum percentage allowable to call a special meeting of shareholders. Vote against proposals that increase or decrease the threshold from 10%.
Share Cancellation Programs: Vote for management proposals to reduce share capital by means of cancelling outstanding shares held in the issuer’s treasury.
Shareholder Ability to Alter the Size of the Board:
| A. | Vote for proposals that seek to fix the size of the board. |
| B. | Vote against proposals that give management the ability to alter the size of the board without shareholder approval. |
B-206
Shareholder Ability to Remove Directors: Vote for proposals to restore shareholder ability to remove directors with or without cause and proposals that permit shareholders to elect directors to fill board vacancies.
Share Repurchase Programs: Vote for management proposals to institute open-market share repurchase plans in which all shareholders may participate on equal terms.
Stock Distributions: Splits and Dividends: Generally vote for management proposals to increase common share authorization, provided that the increase in authorized shares following the split or dividend is not greater than 100 percent of existing authorized shares.
White Squire Placements: Vote for shareholder proposals to require shareholder approval of blank check preferred stock issues.
Written Consent: Vote for proposals regarding the right to act by written consent when the Proxy Voting Service recommends a vote for the proposal. Proposals regarding the right to act by written consent where the Proxy Voting Service recommends a vote against will be sent to the Proxy Committee for determination.
3. PROPOSALS USUALLY VOTED AGAINST
Proxies involving the issues set forth below generally will be voted AGAINST.
Common Stock Authorization: Vote against proposed common stock authorizations that increase the existing authorization by more than 100 percent unless a clear need for the excess shares is presented by the company. A recommendation of the Proxy Voting Service will generally be followed.
Director and Officer Indemnification and Liability Protection:
| A. | Proposals concerning director and officer indemnification and liability protection that limit or eliminate entirely director and officer liability for monetary damages for violating the duty of care, or that would expand coverage beyond just legal expenses to acts, such as gross negligence, that are more serious violations of fiduciary obligations than mere carelessness. |
| B. | Vote for only those proposals that provide such expanded coverage in cases when a director’s or officer’s legal defense was unsuccessful if (i) the director was found to have acted in good faith and in a manner that he reasonably believed was in the best interests of the company, and (ii) only if the director’s legal expenses would be covered. |
Shareholder Ability to Act by Written Consent: Vote against proposals to restrict or prohibit shareholder ability to take action by written consent.
Shareholder Ability to Call Special Meetings: Vote against proposals to restrict or prohibit shareholder ability to call special meetings.
Shareholder Ability to Remove Directors:
| A. | Vote against proposals that provide that directors may be removed only for cause. |
| B. | Vote against proposals that provide that only continuing directors may elect replacements to fill board vacancies. |
Share Retention by Executives: Generally vote against shareholder proposals requiring executives to retain shares of the issuer for fixed periods unless the board and the Proxy Voting Service recommend voting in favor of the proposal.
B-207
Staggered Director Elections: Vote against proposals to classify or stagger the board.
Stock Ownership Requirements: Generally vote against shareholder proposals requiring directors to own a minimum amount of company stock in order to qualify as a director, or to remain on the board.
Supermajority Shareholder Vote Requirements: Vote against management proposals to require a supermajority shareholder vote to approve charter and bylaw amendments.
Term of Office: Vote against shareholder proposals to limit the tenure of outside directors.
| A. | Vote against dual class exchange offers and dual class recapitalizations. |
| B. | Vote, on a case-by-case basis, proposals to eliminate an existing dual class voting structure. |
4. PROPOSALS USUALLY VOTED AS RECOMMENDED BY THE PROXY VOTING SERVICE
Proxies involving compensation issues, not limited to those set forth below, generally will be voted as recommended by the Proxy Voting Service but may, in the consideration of the Proxy Committee, be reviewed on a case-by-case basis.
401(k) Employee Benefit Plans: Vote for proposals to implement a 401(k) savings plan for employees.
Compensation Plans: Votes with respect to compensation plans generally will be voted as recommended by the Proxy Voting Service.
Employee Stock Ownership Plans (“ESOPs”): Vote for proposals that request shareholder approval in order to implement an ESOP or to increase authorized shares for existing ESOPs, except in cases when the number of shares allocated to the ESOP is “excessive” (i.e., generally greater than five percent of outstanding shares). A recommendation of the Proxy Voting Service will generally be followed.
Executive Compensation Advisory Resolutions (“Say-on-Pay”): A recommendation of the Proxy Voting Service will generally be followed using the following as a guide:
| A. | Vote for shareholder proposals to permit non-binding advisory votes on executive compensation. |
| B. | Non-binding advisory votes on executive compensation will be voted as recommended by the Proxy Voting Service. |
| C. | Vote for a 3 year review of executive compensation when a recommendation of the Proxy Voting Service is for the approval of the executive compensation proposal, and vote for an annual review of executive compensation when the Proxy Voting Service is against the approval of the executive compensation proposal. |
Non-Material Miscellaneous Bookkeeping Proposals: A recommendation of the Proxy Voting Service will generally be followed regarding miscellaneous bookkeeping proposals of a non-material nature.
Preemptive Rights: Votes with respect to preemptive rights generally will be voted as recommended by the Proxy Voting Service subject to Common Stock Authorization requirements above.
Proxy Access: A recommendation of the Proxy Voting Service will generally be followed with regard to proposals intended to grant shareholders the right to place nominees for director on the issuer’s proxy ballot
B-208
(“Proxy Access”). The nominating shareholder(s) should hold, in aggregate, at least 3% of the voting shares of the issuer for at least three years, and be allowed to nominate up to 25% of the nominees. All other proposals relating to Proxy Access will be reviewed on a case-by-case basis.
Stock Option Plans: A recommendation of the Proxy Voting Service will generally be followed using the following as a guide:
| A. | Vote against plans which expressly permit repricing of underwater options. |
| B. | Vote against proposals to make all stock options performance based. |
| C. | Vote against stock option plans that could result in an earnings dilution above the company specific cap considered by the Proxy Voting Service. |
| D. | Vote for proposals that request expensing of stock options. |
Technical Amendments to By-Laws: A recommendation of the Proxy Voting Service will generally be followed regarding technical or housekeeping amendments to by-laws or articles designed to bring the by-laws or articles into line with current regulations and/or laws.
5. PROPOSALS REQUIRING SPECIAL CONSIDERATION
The Proxy Committee will vote proxies involving the issues set forth below generally on a case-by-case basis after review. Proposals on many of these types of matters will typically be reviewed with the analyst following the company before any vote is cast.
Asset Sales: Votes on asset sales should be made on a case-by-case basis after considering the impact on the balance sheet/working capital, value received for the asset, and potential elimination of diseconomies.
Bundled Proposals: Review on a case-by-case basis bundled or “conditioned” proxy proposals. In the case of items that are conditioned upon each other, examine the benefits and costs of the packaged items. In instances when the joint effect of the conditioned items is not in shareholders’ best interests, vote against the proposals. If the combined effect is positive, support such proposals.
Charitable and Political Contributions and Lobbying Expenditures: Votes on proposals regarding charitable contributions, political contributions, and lobbying expenditures, should be considered on a case-by-case basis. Votes for UK issuers concerning political contributions will be voted for if the issuer states that (a) it does not intend to make any political donations or incur any expenditures in respect to any political party in the EU; and (b) the proposal is submitted to ensure that the issuer does not inadvertently breach the Political Parties, Elections and Referendums Act 2000 and sections 366 and 367 of the Companies Act 2006.
Compensation in the Event of a Change in Control: Votes on proposals regarding executive compensation in the event of a change in control of the issuer should be considered on a case-by-case basis.
Conversion of Debt Instruments: Votes on the conversion of debt instruments should be considered on a case-by-case basis after the recommendation of the relevant Loomis Sayles equity or fixed income analyst is obtained.
Corporate Restructuring: Votes on corporate restructuring proposals, including minority squeezeouts, leveraged buyouts, spin-offs, liquidations, and asset sales should be considered on a case-by-case basis.
Counting Abstentions: Votes on proposals regarding counting abstentions when calculating vote proposal outcomes should be considered on a case-by-case basis.
B-209
Debt Restructurings: Review on a case-by-case basis proposals to increase common and/or preferred shares and to issue shares as part of a debt-restructuring plan. Consider the following issues: Dilution—How much will ownership interest of existing shareholders be reduced, and how extreme will dilution to any future earnings be? Change in Control—Will the transaction result in a change in control of the company? Bankruptcy—Loomis Sayles’ Corporate Actions Department is responsible for consents related to bankruptcies and debt holder consents related to restructurings.
Delisting a Security: Review on a case-by-case basis all proposals to delist a security from an exchange.
Director Nominees in Contested Elections: Votes in a contested election of directors or vote no campaign must be evaluated on a case-by-case basis, considering the following factors: long-term financial performance of the target company relative to its industry; management’s track record; background to the proxy contest; qualifications of director nominees (both slates); evaluation of what each side is offering shareholders as well as the likelihood that the proposed objectives and goals can be met; and stock ownership positions.
Disclosure of Prior Government Service: Review on a case-by-case basis all proposals to disclose a list of employees previously employed in a governmental capacity.
Environmental and Social Issues: Proxies involving social and environmental issues, not limited to those set forth below, frequently will be voted as recommended by the Proxy Voting Service but may, in the consideration of the Proxy Committee, be reviewed on a case-by-case basis if the Proxy Committee believes that a particular proposal (i) could have a significant impact on an industry or issuer (ii) is appropriate for the issuer and the cost to implement would not be excessive, (iii) is appropriate for the issuer in light of various factors such as reputational damage or litigation risk or (iv) is otherwise appropriate for the issuer.
Animal Rights: Proposals that deal with animal rights.
Energy and Environment: Proposals that request companies to file the CERES Principles.
Equal Employment Opportunity and Discrimination: Proposals regarding equal employment opportunities and discrimination.
Human Resources Issues: Proposals regarding human resources issues.
Maquiladora Standards and International Operations Policies: Proposals relating to the Maquiladora Standards and international operating policies.
Military Business: Proposals on defense issues.
Northern Ireland: Proposals pertaining to the MacBride Principles.
Product Integrity and Marketing: Proposals that ask companies to end their production of legal, but socially questionable, products.
Third World Debt Crisis: Proposals dealing with third world debt.
Golden Coffins: Review on a case-by-case basis all proposals relating to the obligation of an issuer to provide remuneration or awards to survivors of executives payable upon such executive’s death.
| A. | Vote for proposals to adopt anti-greenmail charter of bylaw amendments or otherwise restrict a company’s ability to make greenmail payments. |
B-210
| B. | Review on a case-by-case basis anti-greenmail proposals when they are bundled with other charter or bylaw amendments. |
Liquidations: Votes on liquidations should be made on a case-by-case basis after reviewing management’s efforts to pursue other alternatives, appraisal value of assets, and the compensation plan for executives managing the liquidation.
Mergers and Acquisitions: Votes on mergers and acquisitions should be considered on a case-by-case basis, taking into account at least the following: anticipated financial and operating benefits; offer price (cost vs. premium); prospects of the combined companies; how the deal was negotiated; and changes in corporate governance and their impact on shareholder rights.
Mutual Fund Distribution Agreements: Votes on mutual fund distribution agreements should be evaluated on a case-by-case basis.
Mutual Fund Fundamental Investment Restrictions: Votes on amendments to a mutual fund’s fundamental investment restrictions should be evaluated on a case-by-case basis.
Mutual Fund Investment Advisory Agreement: Votes on mutual fund investment advisory agreements should be evaluated on a case-by-case basis.
| A. | Vote for shareholder proposals that ask a company to submit its poison pill for shareholder ratification. |
| B. | Review on a case-by-case basis shareholder proposals to redeem a company’s poison pill. |
| C. | Review on a case-by-case basis management proposals to ratify a poison pill. |
Proxy Access: Proposals to allow shareholders to nominate their own candidates for seats on a board should be evaluated on a case-by-case basis.
Proxy Contest Defenses: Generally, proposals concerning all proxy contest defenses should be evaluated on a case-by-case basis.
Reimburse Proxy Solicitation Expenses: Decisions to provide full reimbursement for dissidents waging a proxy contest should be made on a case-by-case basis.
Reincorporation Proposals: Proposals to change a company’s domicile should be examined on a case-by-case basis.
Shareholder Advisory Committees: Review on a case-by-case basis proposals to establish a shareholder advisory committee.
Shareholder Proposals to Limit Executive and Director Pay:
| A. | Generally, vote for shareholder proposals that seek additional disclosure of executive and director pay information. |
| B. | Review on a case-by-case basis (i) all shareholder proposals that seek to limit executive and director pay and (ii) all advisory resolutions on executive pay other than shareholder resolutions to permit such advisory resolutions. Vote against proposals to link all executive or director variable compensation to performance goals. |
B-211
Spin-offs: Votes on spin-offs should be considered on a case-by-case basis depending on the tax and regulatory advantages, planned use of sale proceeds, market focus, and managerial incentives.
State Takeover Statutes: Review on a case-by-case basis proposals to opt in or out of state takeover statutes (including control share acquisition statutes, control share cash-out statutes, freezeout provisions, fair price provisions, stakeholder laws, poison pill endorsements, severance pay and labor contract provisions, antigreenmail provisions, and disgorgement provisions).
Tender Offer Defenses: Generally, proposals concerning tender offer defenses should be evaluated on a case-by-case basis.
Transition Manager Ballots: Any ballot received by Loomis Sayles for a security that was held for a client by a Transition Manager prior to Loomis Sayles’ management of the client’s holdings will be considered on a case-by case basis by the Proxy Committee (without the input of any Loomis Sayles analyst or portfolio manager) if such security is no longer held in the client’s account with Loomis Sayles.
B-212
MASSACHUSETTS FINANCIAL SERVICES COMPANY
PROXY VOTING POLICIES AND PROCEDURES
February 1, 2017
Massachusetts Financial Services Company, MFS Institutional Advisors, Inc., MFS International (UK) Limited, MFS Heritage Trust Company, MFS Investment Management (Canada) Limited, MFS Investment Management Company (Lux) S.à r.l., MFS International Singapore Pte. Ltd., MFS Investment Management K.K., MFS International Australia Pty. Ltd.; and MFS’ other subsidiaries that perform discretionary investment management activities (collectively, “MFS”) have adopted proxy voting policies and procedures, as set forth below (“MFS Proxy Voting Policies and Procedures”), with respect to securities owned by the clients for which MFS serves as investment adviser and has the power to vote proxies, including the pooled investment vehicles sponsored by MFS (the “MFS Funds”). References to “clients” in these policies and procedures include the MFS Funds and other clients of MFS, such as funds organized offshore, sub-advised funds and separate account clients, to the extent these clients have delegated to MFS the responsibility to vote proxies on their behalf under the MFS Proxy Voting Policies and Procedures.
The MFS Proxy Voting Policies and Procedures include:
| A. | Voting Guidelines; |
| B. | Administrative Procedures; |
| C | Records Retention; and |
| D. | Reports. |
| A. | VOTING GUIDELINES |
1. General Policy; Potential Conflicts of Interest
MFS’ policy is that proxy voting decisions are made in what MFS believes to be the best long-term economic interests of MFS’ clients, and not in the interests of any other party or in MFS’ corporate interests, including interests such as the distribution of MFS Fund shares and institutional client relationships.
MFS reviews corporate governance issues and proxy voting matters that are presented for shareholder vote by either management or shareholders of public companies. Based on the overall principle that all votes cast by MFS on behalf of its clients must be in what MFS believes to be the best long-term economic interests of such clients, MFS has adopted proxy voting guidelines, set forth below, that govern how MFS generally will vote on specific matters presented for shareholder vote.
As a general matter, MFS votes consistently on similar proxy proposals across all shareholder meetings. However, some proxy proposals, such as certain excessive executive compensation, environmental, social and governance matters, are analyzed on a case-by-case basis in light of all the relevant facts and circumstances of the proposal. Therefore, MFS may vote similar proposals differently at different shareholder meetings based on the specific facts and circumstances of the issuer or the terms of the proposal. In addition, MFS also reserves the right to override the guidelines with respect to a particular proxy proposal when such an override is, in MFS’ best judgment, consistent with the overall principle of voting proxies in the best long-term economic interests of MFS’ clients.
MFS also generally votes consistently on the same matter when securities of an issuer are held by multiple client accounts, unless MFS has received explicit voting instructions to vote differently from a client for its own account. From time to time, MFS may also receive comments on the MFS Proxy Voting Policies and Procedures from its clients. These comments are carefully considered by MFS when it reviews these guidelines and revises them as appropriate.
B-213
These policies and procedures are intended to address any potential material conflicts of interest on the part of MFS or its subsidiaries that are likely to arise in connection with the voting of proxies on behalf of MFS’ clients. If such potential material conflicts of interest do arise, MFS will analyze, document and report on such potential material conflicts of interest (see Sections B.2 and D below), and shall ultimately vote the relevant proxies in what MFS believes to be the best long-term economic interests of its clients. The MFS Proxy Voting Committee is responsible for monitoring and reporting with respect to such potential material conflicts of interest.
MFS is also a signatory to the United Nations Principles for Responsible Investment. In developing these guidelines, MFS considered environmental, social and corporate governance issues in light of MFS’ fiduciary obligation to vote proxies in the best long-term economic interest of its clients.
2. MFS’ Policy on Specific Issues
Election of Directors
MFS believes that good governance should be based on a board with at least a simple majority of directors who are “independent” of management, and whose key committees (e.g., compensation, nominating, and audit committees) consist entirely of “independent” directors. While MFS generally supports the board’s nominees in uncontested or non-contentious elections, we will not support a nominee to a board of a U.S. issuer (or issuer listed on a U.S. exchange) if, as a result of such nominee being elected to the board, the board would consist of a simple majority of members who are not “independent” or, alternatively, the compensation, nominating (including instances in which the full board serves as the compensation or nominating committee) or audit committees would include members who are not “independent.”
MFS will also not support a nominee to a board if we can determine that he or she attended less than 75% of the board and/or relevant committee meetings in the previous year without a valid reason stated in the proxy materials or other company communications. In addition, MFS may not support some or all nominees standing for re-election to a board if we can determine: (1) the board or its compensation committee has re-priced or exchanged underwater stock options since the last annual meeting of shareholders and without shareholder approval; (2) the board or relevant committee has not taken adequately responsive action to an issue that received majority support or opposition from shareholders; (3) the board has implemented a poison pill without shareholder approval since the last annual meeting and such poison pill is not on the subsequent shareholder meeting’s agenda, (including those related to net-operating loss carry-forwards); (4) the board or relevant committee has failed to adequately oversee risk by allowing the hedging and/or significant pledging of company shares by executives; or (5) there are governance concerns with a director or issuer.
For directors who are not a CEO of a public company, MFS will vote against a nominee who serves on more than five (5) public company boards in total. MFS may consider exceptions to this policy if (i) the director is either retired or listed as “professional director” in the proxy statement; (ii) the company has disclosed the director’s plans to step down from the number of public company boards exceeding five (5) within a reasonable time; or (iii) the director exceeds the permitted number of public company board seats solely due to either his/her board service on an affiliated company (e.g., a subsidiary), or service on more than one investment company within the same investment company complex.
For directors who are also a CEO of a public company, MFS will vote against a nominee who serves on more than three (3) public-company boards in total. However, we will support his or her re-election to the board of the company for which he or she serves as CEO).
MFS may not support certain board nominees of U.S. issuers under certain circumstances where MFS deems compensation to be egregious due to pay-for-performance issues and/or poor pay practices. Please see the section below titled “MFS’ Policy on Specific Issues—Advisory Votes on Executive Compensation” for further details.
B-214
MFS evaluates a contested or contentious election of directors on a case-by-case basis considering the long-term financial performance of the company relative to its industry, management’s track record, the qualifications of all nominees, and an evaluation of what each side is offering shareholders.
Majority Voting and Director Elections
MFS votes for reasonably crafted proposals calling for directors to be elected with an affirmative majority of votes cast and/or the elimination of the plurality standard for electing directors (including binding resolutions requesting that the board amend the company’s bylaws), provided the proposal includes a carve-out for a plurality voting standard when there are more director nominees than board seats (e.g., contested elections) (“Majority Vote Proposals”).
Classified Boards
MFS generally supports proposals to declassify a board (i.e.; a board in which only one-third of board members is elected each year) for all issuers other than for certain closed-end investment companies. MFS generally opposes proposals to classify a board for issuers other than for certain closed-end investment companies.
Proxy Access
MFS believes that the ability of qualifying shareholders to nominate a certain number of directors on the company’s proxy statement (“Proxy Access”) may have corporate governance benefits. However, such potential benefits must be balanced by its potential misuse by shareholders. Therefore, we support Proxy Access proposals at U.S. issuers that establish an ownership criteria of 3% of the company held continuously for a period of 3 years. In our view, such qualifying shareholders should have the ability to nominate at least 2 directors. Companies should be mindful of imposing any undue impediments within its bylaws that may render Proxy Access impractical, including re-submission thresholds for director nominees via Proxy Access.
MFS analyzes all other proposals seeking Proxy Access on a case-by-case basis. In its analysis, MFS will consider the proposed ownership criteria for qualifying shareholders (such as ownership threshold and holding period) as well as the proponent’s rationale for seeking Proxy Access.
Stock Plans
MFS opposes stock option programs and restricted stock plans that provide unduly generous compensation for officers, directors or employees, or that could result in excessive dilution to other shareholders. As a general guideline, MFS votes against restricted stock, stock option, non-employee director, omnibus stock plans and any other stock plan if all such plans for a particular company involve potential dilution, in the aggregate, of more than 15%. However, MFS will also vote against stock plans that involve potential dilution, in aggregate, of more than 10% at U.S. issuers that are listed in the Standard and Poor’s 100 index as of December 31 of the previous year. In the cases where a stock plan amendment is seeking qualitative changes and not additional shares, MFS will vote its shares on a case-by-case basis.
MFS also opposes stock option programs that allow the board or the compensation committee to re-price underwater options or to automatically replenish shares without shareholder approval. MFS also votes against stock option programs for officers, employees or non-employee directors that do not require an investment by the optionee, that give “free rides” on the stock price, or that permit grants of stock options with an exercise price below fair market value on the date the options are granted. MFS will consider proposals to exchange existing options for newly issued options, restricted stock or cash on a case-by-case basis, taking into account certain factors, including, but not limited to, whether there is a reasonable value-for-value exchange and whether senior executives are excluded from participating in the exchange.
B-215
MFS supports the use of a broad-based employee stock purchase plans to increase company stock ownership by employees, provided that shares purchased under the plan are acquired for no less than 85% of their market value and do not result in excessive dilution.
Shareholder Proposals on Executive Compensation
MFS believes that competitive compensation packages are necessary to attract, motivate and retain executives. However, MFS also recognizes that certain executive compensation practices can be “excessive” and not in the best, long-term economic interest of a company’s shareholders. We believe that the election of an issuer’s board of directors (as outlined above), votes on stock plans (as outlined above) and advisory votes on pay (as outlined below) are typically the most effective mechanisms to express our view on a company’s compensation practices.
MFS generally opposes shareholder proposals that seek to set rigid restrictions on executive compensation as MFS believes that compensation committees should retain some flexibility to determine the appropriate pay package for executives. Although we support linking executive stock option grants to a company’s performance, MFS also opposes shareholder proposals that mandate a link of performance-based pay to a specific metric. MFS generally supports reasonably crafted shareholder proposals that (i) require the issuer to adopt a policy to recover the portion of performance-based bonuses and awards paid to senior executives that were not earned based upon a significant negative restatement of earnings unless the company already has adopted a satisfactory policy on the matter, (ii) expressly prohibit the backdating of stock options, and (iii) prohibit the acceleration of vesting of equity awards upon a broad definition of a “change-in-control” (e.g.; single or modified single-trigger).
Advisory Votes on Executive Compensation
MFS will analyze advisory votes on executive compensation on a case-by-case basis. MFS will vote against an advisory vote on executive compensation if MFS determines that the issuer has adopted excessive executive compensation practices and will vote in favor of an advisory vote on executive compensation if MFS has not determined that the issuer has adopted excessive executive compensation practices. Examples of excessive executive compensation practices may include, but are not limited to, a pay-for-performance disconnect, employment contract terms such as guaranteed bonus provisions, unwarranted pension payouts, backdated stock options, overly generous hiring bonuses for chief executive officers, unnecessary perquisites, or the potential reimbursement of excise taxes to an executive in regards to a severance package. In cases where MFS (i) votes against consecutive advisory pay votes, or (ii) determines that a particularly egregious excessive executive compensation practice has occurred, then MFS may also vote against certain or all board nominees. MFS may also vote against certain or all board nominees if an advisory pay vote for a U.S. issuer is not on the agenda, or the company has not implemented the advisory vote frequency supported by a plurality/ majority of shareholders.
MFS generally supports proposals to include an advisory shareholder vote on an issuer’s executive compensation practices on an annual basis.
“Golden Parachutes”
From time to time, MFS may evaluate a separate, advisory vote on severance packages or “golden parachutes” to certain executives at the same time as a vote on a proposed merger or acquisition. MFS will support an advisory vote on a severance package on a on a case-by-case basis, and MFS may vote against the severance package regardless of whether MFS supports the proposed merger or acquisition.
Shareholders of companies may also submit proxy proposals that would require shareholder approval of severance packages for executive officers that exceed certain predetermined thresholds. MFS votes in favor of such shareholder proposals when they would require shareholder approval of any severance package for an executive officer that exceeds a certain multiple of such officer’s annual compensation that is not determined in MFS’ judgment to be excessive.
B-216
Anti-Takeover Measures
In general, MFS votes against any measure that inhibits capital appreciation in a stock, including proposals that protect management from action by shareholders. These types of proposals take many forms, ranging from “poison pills” and “shark repellents” to super-majority requirements.
MFS generally votes for proposals to rescind existing “poison pills” and proposals that would require shareholder approval to adopt prospective “poison pills,” unless the company already has adopted a clearly satisfactory policy on the matter. MFS may consider the adoption of a prospective “poison pill” or the continuation of an existing “poison pill” if we can determine that the following two conditions are met: (1) the “poison pill” allows MFS clients to hold an aggregate position of up to 15% of a company’s total voting securities (and of any class of voting securities); and (2) either (a) the “poison pill” has a term of not longer than five years, provided that MFS will consider voting in favor of the “poison pill” if the term does not exceed seven years and the “poison pill” is linked to a business strategy or purpose that MFS believes is likely to result in greater value for shareholders; or (b) the terms of the “poison pill” allow MFS clients the opportunity to accept a fairly structured and attractively priced tender offer (e.g. a “chewable poison pill” that automatically dissolves in the event of an all cash, all shares tender offer at a premium price). MFS will also consider on a case-by-case basis proposals designed to prevent tenders which are disadvantageous to shareholders such as tenders at below market prices and tenders for substantially less than all shares of an issuer.
MFS will consider any poison pills designed to protect a company’s net-operating loss carryforwards on a case-by-case basis, weighing the accounting and tax benefits of such a pill against the risk of deterring future acquisition candidates.
Proxy Contests
From time to time, a shareholder may express alternative points of view in terms of a company’s strategy, capital allocation, or other issues. Such shareholder may also propose a slate of director nominees different than the slate of director nominees proposed by the company (a “Proxy Contest”). MFS will analyze Proxy Contests on a case-by-case basis, taking into consideration the track record and current recommended initiatives of both company management and the dissident shareholder(s). Like all of our proxy votes, MFS will support the slate of director nominees that we believe is in the best, long-term economic interest of our clients.
Reincorporation and Reorganization Proposals
When presented with a proposal to reincorporate a company under the laws of a different state, or to effect some other type of corporate reorganization, MFS considers the underlying purpose and ultimate effect of such a proposal in determining whether or not to support such a measure. MFS generally votes with management in regards to these types of proposals, however, if MFS believes the proposal is in the best long-term economic interests of its clients, then MFS may vote against management (e.g. the intent or effect would be to create additional inappropriate impediments to possible acquisitions or takeovers).
Issuance of Stock
There are many legitimate reasons for the issuance of stock. Nevertheless, as noted above under “Stock Plans,” when a stock option plan (either individually or when aggregated with other plans of the same company) would substantially dilute the existing equity (e.g. by approximately 10-15% as described above), MFS generally votes against the plan. In addition, MFS typically votes against proposals where management is asking for authorization to issue common or preferred stock with no reason stated (a “blank check”) because the unexplained authorization could work as a potential anti-takeover device. MFS may also vote against the authorization or issuance of common or preferred stock if MFS determines that the requested authorization is excessive or not warranted.
B-217
Repurchase Programs
MFS supports proposals to institute share repurchase plans in which all shareholders have the opportunity to participate on an equal basis. Such plans may include a company acquiring its own shares on the open market, or a company making a tender offer to its own shareholders.
Cumulative Voting
MFS opposes proposals that seek to introduce cumulative voting and for proposals that seek to eliminate cumulative voting. In either case, MFS will consider whether cumulative voting is likely to enhance the interests of MFS’ clients as minority shareholders.
Written Consent and Special Meetings
The right to call a special meeting or act by written consent can be a powerful tool for shareholders. As such, MFS supports proposals requesting the right for shareholders who hold at least 10% of the issuer’s outstanding stock to call a special meeting. MFS also supports proposals requesting the right for shareholders to act by written consent.
Independent Auditors
MFS believes that the appointment of auditors for U.S. issuers is best left to the board of directors of the company and therefore supports the ratification of the board’s selection of an auditor for the company. Some shareholder groups have submitted proposals to limit the non-audit activities of a company’s audit firm or prohibit any non-audit services by a company’s auditors to that company. MFS opposes proposals recommending the prohibition or limitation of the performance of non-audit services by an auditor, and proposals recommending the removal of a company’s auditor due to the performance of non-audit work for the company by its auditor. MFS believes that the board, or its audit committee, should have the discretion to hire the company’s auditor for specific pieces of non-audit work in the limited situations permitted under current law.
Other Business
MFS generally votes against “other business” proposals as the content of any such matter is not known at the time of our vote.
Adjourn Shareholder Meeting
MFS generally supports proposals to adjourn a shareholder meeting if we support the other ballot items on the meeting’s agenda. MFS generally votes against proposals to adjourn a meeting if we do not support the other ballot items on the meeting’s agenda.
Environmental, Social and Governance (“ESG”) Issues
MFS believes that a company’s ESG practices may have an impact on the company’s long-term economic financial performance and will generally support proposals relating to ESG issues that MFS believes are in the best long-term economic interest of the company’s shareholders. For those ESG proposals for which a specific policy has not been adopted, MFS considers such ESG proposals on a case-by-case basis. As a result, it may vote similar proposals differently at various shareholder meetings based on the specific facts and circumstances of such proposal.
MFS generally supports proposals that seek to remove governance structures that insulate management from shareholders (i.e., anti-takeover measures) or that seek to enhance shareholder rights. Many of these
B-218
governance-related issues, including compensation issues, are outlined within the context of the above guidelines. In addition, MFS typically supports proposals that require an issuer to reimburse successful dissident shareholders (who are not seeking control of the company) for reasonable expenses that such dissident incurred in soliciting an alternative slate of director candidates. MFS also generally supports reasonably crafted shareholder proposals requesting increased disclosure around the company’s use of collateral in derivatives trading. MFS typically supports proposals for an independent board chairperson. However, we may not support such proposals if we determine there to be an appropriate and effective counter-balancing leadership structure in place (e.g.; a strong, independent lead director with an appropriate level of powers and duties). For any governance-related proposal for which an explicit guideline is not provided above, MFS will consider such proposals on a case-by-case basis and will support such proposals if MFS believes that it is in the best long-term economic interest of the company’s shareholders.
MFS generally supports proposals that request disclosure on the impact of environmental issues on the company’s operations, sales, and capital investments. However, MFS may not support such proposals based on the facts and circumstances surrounding a specific proposal, including, but not limited to, whether (i) the proposal is unduly costly, restrictive, or burdensome, (ii) the company already provides publicly-available information that is sufficient to enable shareholders to evaluate the potential opportunities and risks that environmental matters pose to the company’s operations, sales and capital investments, or (iii) the proposal seeks a level of disclosure that exceeds that provided by the company’s industry peers. MFS will analyze all other environmental proposals on a case-by-case basis and will support such proposals if MFS believes such proposal is in the best long-term economic interest of the company’s shareholders.
MFS will analyze social proposals on a case-by-case basis. MFS will support such proposals if MFS believes that such proposal is in the best long-term economic interest of the company’s shareholders. Generally, MFS will support shareholder proposals that (i) seek to amend a company’s equal employment opportunity policy to prohibit discrimination based on sexual orientation and gender identity; and (ii) request additional disclosure regarding a company’s political contributions (including trade organizations and lobbying activity) (unless the company already provides publicly-available information that is sufficient to enable shareholders to evaluate the potential opportunities and risks that such contributions pose to the company’s operations, sales and capital investments).
The laws of various states or countries may regulate how the interests of certain clients subject to those laws (e.g. state pension plans) are voted with respect to social issues. Thus, it may be necessary to cast ballots differently for certain clients than MFS might normally do for other clients.
Foreign Issuers
MFS generally supports the election of a director nominee standing for re-election in uncontested or non-contentious elections unless it can be determined that (1) he or she failed to attend at least 75% of the board and/or relevant committee meetings in the previous year without a valid reason given in the proxy materials; (2) since the last annual meeting of shareholders and without shareholder approval, the board or its compensation committee has re-priced underwater stock options; or (3) since the last annual meeting, the board has either implemented a poison pill without shareholder approval or has not taken responsive action to a majority shareholder approved resolution recommending that the “poison pill” be rescinded. In such circumstances, we will vote against director nominee(s). Also, certain markets outside of the U.S. have adopted best practice guidelines relating to corporate governance matters (e.g. the United Kingdom’s and Japan Corporate Governance Codes). Many of these guidelines operate on a “comply or explain” basis. As such, MFS will evaluate any explanations by companies relating to their compliance with a particular corporate governance guideline on a case-by-case basis and may vote against the board nominees or other relevant ballot item if such explanation is not satisfactory. In some circumstances, MFS may submit a vote to abstain from certain director nominees or the relevant ballot items if we have concerns with the nominee or ballot item, but do not believe these concerns rise to the level where a vote against is warranted.
B-219
MFS generally supports the election of auditors, but may determine to vote against the election of a statutory auditor in certain markets if MFS reasonably believes that the statutory auditor is not truly independent.
Some international markets have also adopted mandatory requirements for all companies to hold shareholder votes on executive compensation. MFS will vote against such proposals if MFS determines that a company’s executive compensation practices are excessive, considering such factors as the specific market’s best practices that seek to maintain appropriate pay-for-performance alignment and to create long-term shareholder value. We may alternatively submit an abstention vote on such proposals in circumstances where our executive compensation concerns are not as severe.
Many other items on foreign proxies involve repetitive, non-controversial matters that are mandated by local law. Accordingly, the items that are generally deemed routine and which do not require the exercise of judgment under these guidelines (and therefore voted with management) for foreign issuers include, but are not limited to, the following: (i) receiving financial statements or other reports from the board; (ii) approval of declarations of dividends; (iii) appointment of shareholders to sign board meeting minutes; (iv) discharge of management and supervisory boards; and (v) approval of share repurchase programs (absent any anti-takeover or other concerns). MFS will evaluate all other items on proxies for foreign companies in the context of the guidelines described above, but will generally vote against an item if there is not sufficient information disclosed in order to make an informed voting decision. For any ballot item where MFS wishes to express a more moderate level of concern than a vote of against, we will cast a vote to abstain.
In accordance with local law or business practices, some foreign companies or custodians prevent the sale of shares that have been voted for a certain period beginning prior to the shareholder meeting and ending on the day following the meeting (“share blocking”). Depending on the country in which a company is domiciled, the blocking period may begin a stated number of days prior or subsequent to the meeting (e.g. one, three or five days) or on a date established by the company. While practices vary, in many countries the block period can be continued for a longer period if the shareholder meeting is adjourned and postponed to a later date. Similarly, practices vary widely as to the ability of a shareholder to have the “block” restriction lifted early (e.g. in some countries shares generally can be “unblocked” up to two days prior to the meeting whereas in other countries the removal of the block appears to be discretionary with the issuer’s transfer agent). Due to these restrictions, MFS must balance the benefits to its clients of voting proxies against the potentially serious portfolio management consequences of a reduced flexibility to sell the underlying shares at the most advantageous time. For companies in countries with share blocking periods or in markets where some custodians may block shares, the disadvantage of being unable to sell the stock regardless of changing conditions generally outweighs the advantages of voting at the shareholder meeting for routine items. Accordingly, MFS will not vote those proxies in the absence of an unusual, significant vote that outweighs the disadvantage of being unable to sell the stock.
From time to time, governments may impose economic sanctions which may prohibit us from transacting business with certain companies or individuals. These sanctions may also prohibit the voting of proxies at certain companies or on certain individuals. In such instances, MFS will not vote at certain companies or on certain individuals if it determines that doing so is in violation of the sanctions.
In limited circumstances, other market specific impediments to voting shares may limit our ability to cast votes, including, but not limited to, late delivery of proxy materials, untimely vote cut-off dates, power of attorney and share re-registration requirements, or any other unusual voting requirements. In these limited instances, MFS votes securities on a best efforts basis in the context of the guidelines described above.
| B. | ADMINISTRATIVE PROCEDURES |
1. MFS Proxy Voting Committee
The administration of these MFS Proxy Voting Policies and Procedures is overseen by the MFS Proxy Voting Committee, which includes senior personnel from the MFS Legal and Global Investment Support
B-220
Departments. The Proxy Voting Committee does not include individuals whose primary duties relate to client relationship management, marketing, or sales. The MFS Proxy Voting Committee:
| a. | Reviews these MFS Proxy Voting Policies and Procedures at least annually and recommends any amendments considered to be necessary or advisable; |
| b. | Determines whether any potential material conflict of interest exists with respect to instances in which MFS (i) seeks to override these MFS Proxy Voting Policies and Procedures; (ii) votes on ballot items not governed by these MFS Proxy Voting Policies and Procedures; (iii) evaluates an excessive executive compensation issue in relation to the election of directors; or (iv) requests a vote recommendation from an MFS portfolio manager or investment analyst (e.g. mergers and acquisitions); and |
| c. | Considers special proxy issues as they may arise from time to time. |
2. Potential Conflicts of Interest
The MFS Proxy Voting Committee is responsible for monitoring potential material conflicts of interest on the part of MFS or its subsidiaries that could arise in connection with the voting of proxies on behalf of MFS’ clients. Due to the client focus of our investment management business, we believe that the potential for actual material conflict of interest issues is small. Nonetheless, we have developed precautions to assure that all proxy votes are cast in the best long-term economic interest of shareholders.1 Other MFS internal policies require all MFS employees to avoid actual and potential conflicts of interests between personal activities and MFS’ client activities. If an employee (including investment professionals) identifies an actual or potential conflict of interest with respect to any voting decision (including the ownership of securities in their individual portfolio), then that employee must recuse himself/herself from participating in the voting process. Any significant attempt by an employee of MFS or its subsidiaries to unduly influence MFS’ voting on a particular proxy matter should also be reported to the MFS Proxy Voting Committee.
In cases where proxies are voted in accordance with these MFS Proxy Voting Policies and Procedures, no material conflict of interest will be deemed to exist. In cases where (i) MFS is considering overriding these MFS Proxy Voting Policies and Procedures, (ii) matters presented for vote are not governed by these MFS Proxy Voting Policies and Procedures, (iii) MFS evaluates a potentially excessive executive compensation issue in relation to the election of directors or advisory pay or severance package vote, or (iv) a vote recommendation is requested from an MFS portfolio manager or investment analyst (e.g. mergers and acquisitions); (collectively, “Non-Standard Votes”); the MFS Proxy Voting Committee will follow these procedures:
| a. | Compare the name of the issuer of such proxy against a list of significant current (i) distributors of MFS Fund shares, and (ii) MFS institutional clients (the “MFS Significant Distributor and Client List”); |
| b. | If the name of the issuer does not appear on the MFS Significant Distributor and Client List, then no material conflict of interest will be deemed to exist, and the proxy will be voted as otherwise determined by the MFS Proxy Voting Committee; |
| c. | If the name of the issuer appears on the MFS Significant Distributor and Client List, then the MFS Proxy Voting Committee will be apprised of that fact and each member of the MFS Proxy Voting Committee will carefully evaluate the proposed vote in order to ensure that the proxy ultimately is voted in what MFS believes to be the best long-term economic interests of MFS’ clients, and not in MFS’ corporate interests; and |
| d. | For all potential material conflicts of interest identified under clause (c) above, the MFS Proxy Voting Committee will document: the name of the issuer, the issuer’s relationship to MFS, the analysis of the |
1 For clarification purposes, note that MFS votes in what we believe to be the best, long-term economic interest of our clients entitled to vote at the shareholder meeting, regardless of whether other MFS clients hold “short” positions in the same issuer.
B-221
| matters submitted for proxy vote, the votes as to be cast and the reasons why the MFS Proxy Voting Committee determined that the votes were cast in the best long-term economic interests of MFS’ clients, and not in MFS’ corporate interests. A copy of the foregoing documentation will be provided to MFS’ Conflicts Officer. |
The members of the MFS Proxy Voting Committee are responsible for creating and maintaining the MFS Significant Distributor and Client List, in consultation with MFS’ distribution and institutional business units. The MFS Significant Distributor and Client List will be reviewed and updated periodically, as appropriate.
For instances where MFS is evaluating a director nominee who also serves as a director of the MFS Funds, then the MFS Proxy Voting Committee will adhere to the procedures described in section (d) above regardless of whether the portfolio company appears on our Significant Distributor and Client List.
If an MFS client has the right to vote on a matter submitted to shareholders by Sun Life Financial, Inc. or any of its affiliates (collectively “Sun Life”), MFS will cast a vote on behalf of such MFS client pursuant to the recommendations of Institutional Shareholder Services, Inc.’s (“ISS”) benchmark policy, or as required by law.
Except as described in the MFS Fund’s prospectus, from time to time, certain MFS Funds (the “top tier fund”) may own shares of other MFS Funds (the “underlying fund”). If an underlying fund submits a matter to a shareholder vote, the top tier fund will generally vote its shares in the same proportion as the other shareholders of the underlying fund. If there are no other shareholders in the underlying fund, the top tier fund will vote in what MFS believes to be in the top tier fund’s best long-term economic interest. If an MFS client has the right to vote on a matter submitted to shareholders by a pooled investment vehicle advised by MFS, MFS will cast a vote on behalf of such MFS client in the same proportion as the other shareholders of the pooled investment vehicle.
3. Gathering Proxies
Most proxies received by MFS and its clients originate at Broadridge Financial Solutions, Inc. (“Broadridge”). Broadridge and other service providers, on behalf of custodians, send proxy related material to the record holders of the shares beneficially owned by MFS’ clients, usually to the client’s proxy voting administrator or, less commonly, to the client itself. This material will include proxy ballots reflecting the shareholdings of Funds and of clients on the record dates for such shareholder meetings, as well as proxy materials with the issuer’s explanation of the items to be voted upon.
MFS, on behalf of itself and certain of its clients (including the MFS Funds) has entered into an agreement with an independent proxy administration firm pursuant to which the proxy administration firm performs various proxy vote related administrative services such as vote processing and recordkeeping functions. Except as noted below, the proxy administration firm for MFS and its clients, including the MFS Funds, is ISS. The proxy administration firm for MFS Development Funds, LLC is Glass, Lewis & Co., Inc. (“Glass Lewis”; Glass Lewis and ISS are each hereinafter referred to as the “Proxy Administrator”).
The Proxy Administrator receives proxy statements and proxy ballots directly or indirectly from various custodians, logs these materials into its database and matches upcoming meetings with MFS Fund and client portfolio holdings, which are input into the Proxy Administrator’s system by an MFS holdings data-feed. Through the use of the Proxy Administrator system, ballots and proxy material summaries for all upcoming shareholders’ meetings are available on-line to certain MFS employees and members of the MFS Proxy Voting Committee.
It is the responsibility of the Proxy Administrator and MFS to monitor the receipt of ballots. When proxy ballots and materials for clients are received by the Proxy Administrator, they are input into the Proxy Administrator’s on-line system. The Proxy Administrator then reconciles a list of all MFS accounts that hold
B-222
shares of a company’s stock and the number of shares held on the record date by these accounts with the Proxy Administrator’s list of any upcoming shareholder’s meeting of that company. If a proxy ballot has not been received, the Proxy Administrator contacts the custodian requesting the reason as to why a ballot has not been received.
4. Analyzing Proxies
Proxies are voted in accordance with these MFS Proxy Voting Policies and Procedures. The Proxy Administrator, at the prior direction of MFS, automatically votes all proxy matters that do not require the particular exercise of discretion or judgment with respect to these MFS Proxy Voting Policies and Procedures as determined by MFS. With respect to proxy matters that require the particular exercise of discretion or judgment, the MFS Proxy Voting Committee or its representatives considers and votes on those proxy matters. MFS also receives research and recommendations from the Proxy Administrator which it may take into account in deciding how to vote. MFS uses the research of Proxy Administrators and/or other 3rd party vendors to identify (i) circumstances in which a board may have approved excessive executive compensation, (ii) environmental and social proposals that warrant further consideration or (iii) circumstances in which a non-U.S. company is not in compliance with local governance or compensation best practices. In those situations where the only MFS fund that is eligible to vote at a shareholder meeting has Glass Lewis as its Proxy Administrator, then we will utilize research from Glass Lewis to identify such issues. MFS analyzes such issues independently and does not necessarily vote with the ISS or Glass Lewis recommendations on these issues. MFS may also use other research tools in order to identify the circumstances described above. Representatives of the MFS Proxy Voting Committee review, as appropriate, votes cast to ensure conformity with these MFS Proxy Voting Policies and Procedures.
As a general matter, portfolio managers and investment analysts have little involvement in most votes taken by MFS. This is designed to promote consistency in the application of MFS’ voting guidelines, to promote consistency in voting on the same or similar issues (for the same or for multiple issuers) across all client accounts, and to minimize the potential that proxy solicitors, issuers, or third parties might attempt to exert inappropriate influence on the vote. For votes that require a case-by-case analysis per the MFS Proxy Policies (e.g. proxy contests, potentially excessive executive compensation issues, or certain shareholder proposals), a representative of MFS Proxy Voting Committee will consult with or seek recommendations from MFS investment analysts and/or portfolio managers.2 However, the MFS Proxy Voting Committee will ultimately determine the manner in which such proxies are voted.
As noted above, MFS reserves the right to override the guidelines when such an override is, in MFS’ best judgment, consistent with the overall principle of voting proxies in the best long-term economic interests of MFS’ clients. Any such override of the guidelines shall be analyzed, documented and reported in accordance with the procedures set forth in these policies.
5. Voting Proxies
In accordance with its contract with MFS, the Proxy Administrator also generates a variety of reports for the MFS Proxy Voting Committee, and makes available on-line various other types of information so that the MFS Proxy Voting Committee or proxy team may review and monitor the votes cast by the Proxy Administrator on behalf of MFS’ clients.
For those markets that utilize a “record date” to determine which shareholders are eligible to vote, MFS generally will vote all eligible shares pursuant to these guidelines regardless of whether all (or a portion of) the shares held by our clients have been sold prior to the meeting date.
2 From time to time, due to travel schedules and other commitments, an appropriate portfolio manager or research analyst may not be available to provide a vote recommendation. If such a recommendation cannot be obtained within a reasonable time prior to the cut-off date of the shareholder meeting, the MFS Proxy Voting Committee may determine to abstain from voting.
B-223
6. Securities Lending
From time to time, the MFS Funds or other pooled investment vehicles sponsored by MFS may participate in a securities lending program. In the event MFS or its agent receives timely notice of a shareholder meeting for a U.S. security, MFS and its agent will attempt to recall any securities on loan before the meeting’s record date so that MFS will be entitled to vote these shares. However, there may be instances in which MFS is unable to timely recall securities on loan for a U.S. security, in which cases MFS will not be able to vote these shares. MFS will report to the appropriate board of the MFS Funds those instances in which MFS is not able to timely recall the loaned securities. MFS generally does not recall non-U.S. securities on loan because there may be insufficient advance notice of proxy materials, record dates, or vote cut-off dates to allow MFS to timely recall the shares in certain markets on an automated basis. As a result, non-U.S. securities that are on loan will not generally be voted. If MFS receives timely notice of what MFS determines to be an unusual, significant vote for a non-U.S. security whereas MFS shares are on loan, and determines that voting is in the best long-term economic interest of shareholders, then MFS will attempt to timely recall the loaned shares.
7. Engagement
The MFS Proxy Voting Policies and Procedures are available on www.mfs.com and may be accessed by both MFS’ clients and the companies in which MFS’ clients invest. From time to time, MFS may determine that it is appropriate and beneficial for representatives from the MFS Proxy Voting Committee to engage in a dialogue or written communication with a company or other shareholders regarding certain matters on the company’s proxy statement that are of concern to shareholders, including environmental, social and governance matters. A company or shareholder may also seek to engage with representatives of the MFS Proxy Voting Committee in advance of the company’s formal proxy solicitation to review issues more generally or gauge support for certain contemplated proposals. For further information on requesting engagement with MFS on proxy voting issues, please visit www.mfs.com and refer to our most recent Annual Global Proxy Voting and Engagement Report for contact information.
| C. | RECORDS RETENTION |
MFS will retain copies of these MFS Proxy Voting Policies and Procedures in effect from time to time and will retain all proxy voting reports submitted to the Board of Trustees of the MFS Funds for the period required by applicable law. Proxy solicitation materials, including electronic versions of the proxy ballots completed by representatives of the MFS Proxy Voting Committee, together with their respective notes and comments, are maintained in an electronic format by the Proxy Administrator and are accessible on-line by the MFS Proxy Voting Committee. All proxy voting materials and supporting documentation, including records generated by the Proxy Administrator’s system as to proxies processed, including the dates when proxy ballots were received and submitted, and the votes on each company’s proxy issues, are retained as required by applicable law.
| D. | REPORTS |
U.S. Registered MFS Funds
MFS publicly discloses the proxy voting records of the U.S. registered MFS Funds on a quarterly basis. MFS will also report the results of its voting to the Board of Trustees of the U.S. registered MFS Funds. These reports will include: (i) a summary of how votes were cast (including advisory votes on pay and “golden parachutes”); (ii) a summary of votes against management’s recommendation; (iii) a review of situations where MFS did not vote in accordance with the guidelines and the rationale therefore; (iv) a review of the procedures used by MFS to identify material conflicts of interest and any matters identified as a material conflict of interest; (v) a review of these policies and the guidelines; (vi) a review of our proxy engagement activity; (vii) a report and impact assessment of instances in which the recall of loaned securities of a U.S. issuer was unsuccessful; and (viii) as necessary or appropriate, any proposed modifications thereto to reflect new developments in corporate governance and other issues. Based on these reviews, the Trustees of the U.S. registered MFS Funds will consider possible modifications to these policies to the extent necessary or advisable.
B-224
Other MFS Clients
MFS may publicly disclose the proxy voting records of certain other clients (including certain MFS Funds) or the votes it casts with respect to certain matters as required by law. A report can also be printed by MFS for each client who has requested that MFS furnish a record of votes cast. The report specifies the proxy issues which have been voted for the client during the year and the position taken with respect to each issue and, upon request, may identify situations where MFS did not vote in accordance with the MFS Proxy Voting Policies and Procedures.
Except as described above, MFS generally will not divulge actual voting practices to any party other than the client or its representatives because we consider that information to be confidential and proprietary to the client. However, as noted above, MFS may determine that it is appropriate and beneficial to engage in a dialogue with a company regarding certain matters. During such dialogue with the company, MFS may disclose the vote it intends to cast in order to potentially effect positive change at a company in regards to environmental, social or governance issues.
B-225
METROPOLITAN WEST ASSET MANAGEMENT, LLC
Proxy Voting Guidelines And Procedures
February 22, 2016
Introduction
Certain affiliates of The TCW Group, Inc. (these affiliates are collectively referred to as “TCW”) act as investment advisors for a variety of clients, including mutual funds. If TCW has responsibility for voting proxies in connection with these investment advisory duties, or has the responsibility to specify to an agent of the client how to vote the proxies, TCW exercises such voting responsibilities for its clients through the corporate proxy voting process. TCW believes that the right to vote proxies is a significant asset of its clients’ holdings. In order to carry out its fiduciary responsibilities in the voting of proxies for its clients, TCW has established a proxy voting committee (the “Proxy Committee”) and adopted these proxy voting guidelines and procedures (the “Guidelines”).
The Proxy Committee generally meets quarterly (or at such other frequency as determined by the Proxy Committee), and its duties include establishing proxy voting guidelines and procedures, overseeing the internal proxy voting process, and reviewing proxy voting issues. The members of the Proxy Committee include TCW personnel from the investment, compliance, legal and marketing departments. TCW also uses outside proxy voting services (each an “Outside Service”) to help manage the proxy voting process. An Outside Service facilitates TCW’s voting according to the Guidelines (or, if applicable, according to guidelines submitted by TCW’s clients) and helps maintain TCW’s proxy voting records. All proxy voting and record keeping by TCW is, of course, dependent on the timely provision of proxy ballots by custodians, clients and other third parties. Under specified circumstances described below involving potential conflicts of interest, an Outside Service may also be requested to help decide certain proxy votes. In those instances, the Proxy Committee shall periodically review and evaluate the voting recommendations of such Outside Service to ensure that recommendations are consistent with TCW’s clients’ best interests. In certain limited circumstances, particularly in the area of structured financing, TCW may enter into voting agreements or other contractual obligations that govern the voting of shares. In the event of a conflict between any such contractual requirements and the Guidelines, TCW will vote in accordance with its contractual obligations. In the event that TCW inadvertently receives any proxy materials on behalf of a client that has retained proxy voting responsibility, and where it is reasonably feasible for TCW to determine the identity of the client, TCW will promptly forward such materials to the client.
As a matter of firm policy, TCW does not disclose to unaffiliated third parties how it expects to vote on upcoming proxies and does not disclose the way it voted proxies without a legitimate need to know such information.
Philosophy
When voting proxies, TCW’s utmost concern is that all decisions be made solely in the interests of the client and with the goal of maximizing the value of the client’s investments. Generally, proposals will be voted in accordance with the Guidelines and any applicable guidelines provided by TCW’s clients. TCW’s underlying philosophy, however, is that its portfolio managers, who are primarily responsible for evaluating the individual holdings of TCW’s clients, are best able to determine how to further client interests and goals. The portfolio managers may, in their discretion, take into account the recommendations of TCW management, the Proxy Committee, and an Outside Service.
Proxy Voting Overrides
Individual portfolio managers, in the exercise of their best judgment and discretion, may from time to time override the Guidelines and vote proxies in a manner that they believe will enhance the economic value of
B-226
clients’ assets, keeping in mind the best interests of the beneficial owners. A portfolio manager choosing to abstain on a vote or override the Guidelines must deliver a written rationale for each such decision to TCW’s Proxy Specialist (the “Proxy Specialist”), who will maintain such documentation in TCW’s proxy voting records and deliver a quarterly report to the Proxy Committee of all votes cast other than in accordance with the Guidelines. If the Proxy Specialist believes there is a question regarding a portfolio manager’s written rationale, he/she will obtain the approval of TCW’s Director of Research (the “Director of Research”) for the written rationale before submitting it. The Director of Research will review the portfolio manager’s written rationale and make a determination. If the Director of Research believes it appropriate, he/she may elect to convene the Proxy Committee for its independent consideration as to how the vote should be cast.
Conflicts of Interest
In the event a potential conflict of interest arises in the context of voting proxies for TCW’s clients, the primary means by which TCW will avoid a conflict is by casting such votes solely according to the Guidelines and any applicable guidelines provided by TCW’s clients, as outlined below. If a potential conflict of interest arises and there is no predetermined vote, or the Guidelines (or any applicable TCW client guidelines) themselves refer such vote to the portfolio manager for decision, or the portfolio manager would like to override a predetermined vote, then TCW will undertake the following analysis:
Where the issuer soliciting proxy votes is itself a client of TCW’s (or because an affiliate of such issuer, such as a pension or profit sharing plan sponsored by such issuer, is a client of TCW’s), then the Proxy Specialist will determine whether such relationship may be deemed not to be material to TCW based on the level of assets under management and other relevant facts and circumstances. Where the relationship is deemed material, TCW will refrain completely from exercising its discretion with respect to voting the proxy with respect to such vote and will, instead, refer that vote to an Outside Service for its independent consideration as to how the vote should be cast.
Where an employee of TCW sits on the Board of a public company, the Proxy Specialist will determine whether such Board member is the portfolio manager for the account holding the security, or whether the Board member has spoken with the portfolio managers for the account holding the security. If either the particular Board member is the portfolio manager or there has been communication concerning such proxy vote between the portfolio manager and the particular Board member, then the Proxy Specialist will provide the Proxy Committee with the facts and vote rationale so that it can determine and vote the securities.
When the issuer is a key vendor or broker of TCW, the Proxy Specialist will determine if the portfolio manager for the account(s) holding the security has spoken with the key vendor or broker about the upcoming proxy vote. If there has been communication concerning the proxy vote between the portfolio manager and the key vendor or broker, the relationship will be deemed material. The Proxy Specialist will provide the Proxy Committee with the relevant facts and the Proxy Committee will vote the proxy.
Where the issuer is an affiliate of TCW, TCW will refrain completely from exercising its discretion with respect to voting the proxy with respect to such a vote and will, instead, refer that vote to an Outside Service for its independent consideration as to how the vote should be cast.
Where any other portfolio manager conflict is identified with respect to a given proxy vote, the Proxy Committee will remove such vote from the conflicted portfolio manager and will itself consider and cast the vote.
Proxy Voting Information and Recordkeeping
Upon request to the Proxy Specialist, TCW provides proxy voting records to its clients. These records state how votes were cast on behalf of client accounts, whether a particular matter was proposed by the company or a shareholder, and whether or not TCW voted in line with management recommendations.
B-227
TCW or an Outside Service will keep records of the following items: (i) these Proxy Voting Guidelines and any other proxy voting procedures; (ii) proxy statements received regarding client securities (unless such statements are available on the SEC’s Electronic Data Gathering, Analysis, and Retrieval (EDGAR) system); (iii) records of votes cast on behalf of clients (if maintained by an Outside Service, that Outside Service will provide copies of those records promptly upon request); (iv) records of written requests for proxy voting information and TCW’s response (whether a client’s request was oral or in writing); and (v) any documents prepared by TCW that were material to making a decision how to vote, or that memorialized the basis for the decision, including proxy overrides delivered to the Proxy Specialist and decisions of the Proxy Committee. Additionally, TCW or an Outside Service will maintain any documentation related to an identified material conflict of interest.
TCW or an Outside Service will maintain these records in an easily accessible place for at least five years from the end of the fiscal year during which the last entry was made on such record. For the first two years, TCW or an Outside Service will store such records at its principal office.
International Proxy Voting
While TCW utilizes these Proxy Voting Guidelines for both international and domestic portfolios and clients, there are some significant differences between voting U.S. company proxies and voting non-U.S. company proxies. For U.S. companies, it is relatively easy to vote proxies, as the proxies are automatically received and may be voted by mail or electronically. In most cases, the officers of a U.S. company soliciting a proxy act as proxies for the company’s shareholders.
For proxies of non-U.S. companies, however, it is typically both difficult and costly to vote proxies. The major difficulties and costs may include: (i) appointing a proxy; (ii) knowing when a meeting is taking place; (iii) obtaining relevant information about proxies, voting procedures for foreign shareholders, and restrictions on trading securities that are subject to proxy votes; (iv) arranging for a proxy to vote; and (v) evaluating the cost of voting.
Furthermore, the operational hurdles to voting proxies vary by country. As a result, TCW considers whether or not to vote an international proxy based on the particular facts and circumstances. However, when TCW believes that an issue to be voted is likely to affect the economic value of the portfolio securities, that its vote may influence the ultimate outcome of the contest, and that the benefits of voting the proxy exceed the expected costs, TCW will make every reasonable effort to vote such proxies.
Guidelines
The proxy voting decisions set forth below refer to proposals by company management except for the categories of “Shareholder Proposals” and “Social Issue Proposals.” The voting decisions in these latter two categories refer to proposals by outside shareholders.
Governance
| · | For director and management nominees in uncontested elections |
| · | For management nominees in contested elections |
| · | For ratifying auditors, except against if the previous auditor was dismissed because of a disagreement with the company or if the non-audit services exceed 51% of fees |
| · | Generally for routine management proposals |
| · | For amendments to the company’s certificate of incorporation or bylaws, except against if an amendment would have the effect of reducing shareholders’ rights |
B-228
Capital Structure
| · | Generally for reasonable changes in authorized common stock |
| · | For the issuance of common stock or preferred stock, except against if the shares have voting rights superior to those of other common or preferred shareholders, as applicable |
| · | For approving the issuance or exercise of stock warrants |
| · | For authorizing preferred stock and making reasonable changes to authorized preferred stock, except against if the board has unlimited rights to set the terms and conditions of the shares |
| · | For amending or canceling a class or series of preferred stock |
| · | Against authorizing and for eliminating or amending dual or multiple classes of common stock |
| · | For a stock repurchase program |
| · | For a stock split |
| · | For a reverse stock split, except against if the company does not intend to proportionally reduce the number of authorized shares |
Mergers and Restructuring
| · | Generally for mergers and restructurings, including recapitalization, bankruptcy restructurings, liquidations, reincorporating in a different state, leveraged buyout of the company, spinning off certain company operations or divisions, the sale of assets |
| · | Against adopting or preserving cumulative voting |
Board of Directors
| · | For limiting the liability of directors |
| · | For setting the board size |
| · | For allowing the directors to fill vacancies on the board without shareholder approval |
| · | Against giving the board the authority to set the size of the board as needed without shareholder approval |
| · | For a proposal regarding the removal of directors, except against if the proposal limits the removal of directors to cases where there is legal cause |
Anti-Takeover Provisions
| · | Generally against the concept of a classified board |
| · | Generally against the concept of a shareholder rights plan (poison pill) |
| · | Against eliminating or limiting shareholders’ right to call a special meeting |
| · | For restoring shareholders’ right to call a special meeting |
| · | Against eliminating or limiting shareholders’ right to act by written consent |
| · | For restoring shareholders’ right to act by written consent |
| · | Against establishing or maintaining a supermajority vote provision to (i) approve a merger or other business combination, (ii) change certain bylaw or charter provisions |
B-229
| · | Against expanding or clarifying the authority of the board of directors to consider factors other than the interests of shareholders in assessing a takeover bid |
| · | Against fair price provisions |
| · | For limiting the payment of greenmail |
| · | Against adopting advance notice requirements |
| · | Against opting into a state takeover statutory provision |
Compensation
| · | Generally in favor of reasonable compensation and bonus plans proposed by management, including one-time stock options and deferred compensation plans |
| · | For adopting, amending or adding shares to a stock incentive, purchase or award plan for employees and non-employee directors, provided that outstanding common stock is not overly diluted |
| · | For limiting per-employee option awards |
| · | For extending the term of a stock incentive plan for employees |
| · | Refer on assuming stock incentive plans |
| · | With management on “say on pay” proposals |
Shareholder Proposals
| · | For requiring shareholder ratification of auditors |
| · | Against requiring the auditors to attend the annual meeting |
| · | Against limiting consulting by auditors |
| · | Against requiring the rotation of auditors |
| · | Against restoring preemptive rights |
| · | For asking the company to study sales, spin-offs, or other strategic alternatives |
| · | For asking the board to adopt confidential voting and independent tabulation of the proxy ballots |
| · | Against asking the company to refrain from counting abstentions and broker non-votes in vote tabulations |
| · | Against eliminating the company’s discretion to vote unmarked proxy ballots. |
| · | For providing equal access to the proxy materials for shareholders |
| · | Generally against making changes to board or chairman election, composition or eligibility requirements |
| · | Against changing the annual meeting location or date |
| · | For increasing disclosure regarding the board’s role in the development and monitoring of the company’s long-term strategic plan |
| · | Against urging the creation of a shareholder committee |
| · | For adopting cumulative voting |
| · | Against making directors liable for acts or omissions that constitute a breach of fiduciary care resulting from a director’s gross negligence and/or reckless or willful neglect |
B-230
| · | For repealing a classified board |
| · | Against asking the board to redeem or to allow shareholders to vote on a poison pill shareholder rights plan |
| · | Generally against supermajority provisions |
| · | Against repealing fair price provisions |
| · | For restoring shareholders’ right to call a special meeting or act by written consent |
| · | For limiting the board’s discretion to issue targeted share placements or requiring shareholder approval before such block placements can be made |
| · | For seeking to force the company to opt out of a state takeover statutory provision |
| · | Against reincorporating the company in another state |
| · | For limiting greenmail payments |
| · | Generally against restricting executive or director compensation, but for reasonable enhanced disclosure of executive compensation |
| · | For banning or calling for a shareholder vote on future golden parachutes |
| · | Against seeking to award performance-based stock options |
| · | Against establishing a policy of expensing the costs of all future stock options issued by the company in the company’s annual income statement |
| · | Against requesting that future executive compensation be determined without regard to any pension fund income |
| · | Against approving extra benefits under Supplemental Executive Retirement Plans (SERPs) |
| · | Against requiring option shares to be held |
| · | Generally for the creation of a compensation and a nominating committee |
| · | For increasing the independence of key committees |
Social Issue Proposals
| · | Generally for proposals that ask a company to review operations or impacts or disclosure activities or impacts, except against if the proposal calls for action beyond reporting |
| · | Generally against proposals that ask the company to implement changes in procedure, including the development of social, economic, environmental or ethical criteria to govern contracts and production |
Additional Information
A description of TCW’s policies and procedures relating to proxy voting and class actions can also be found in the firm’s Part 2A of Form ADV. A copy of TCW’s Form ADV is available to clients upon request to the Proxy Specialist.
B-231
NORTHERN TRUST INVESTMENTS, INC.
PROXY VOTING
The Trust, on behalf of the Funds, has delegated the voting of portfolio securities to Northern Trust Investments, Inc. (“NTI”) in its capacity as Subadviser. NTI has adopted its proprietary proxy voting policies (the “Northern Proxy Voting Policy”) for the voting of proxies on behalf of client accounts for which NTI has voting discretion. Under the Northern Proxy Voting Policy, shares are to be voted in the best interests of the Funds.
A Proxy Committee (“NTI’s Proxy Committee”) comprised of senior NTI investment and compliance officers has adopted certain guidelines (the “Proxy Guidelines”) concerning various corporate governance issues. NTI’s Proxy Committee has the responsibility for the content, interpretation and application of the Proxy Guidelines and may apply these Proxy Guidelines with a measure of flexibility. NTI has retained an independent third party (the “Service Firm”) to review proxy proposals and to make voting recommendations to NTI’s Proxy Committee in a manner consistent with the Proxy Guidelines. NTI’s Proxy Committee will apply the Proxy Guidelines as discussed below to any such recommendation.
The Proxy Guidelines provide that NTI’s Proxy Committee will generally vote for or against various proxy proposals, usually based upon certain specified criteria. As an example, the Proxy Guidelines provide that NTI’s Proxy Committee will generally vote in favor of proposals to:
| · | Repeal existing classified boards and elect directors on an annual basis; |
| · | Adopt a written majority voting or withhold policy (in situations in which a company has not previously adopted such a policy); |
| · | Lower supermajority shareholder vote requirements for charter and bylaw amendments; |
| · | Lower supermajority shareholder vote requirements for mergers and other business combinations; |
| · | Increase common share authorizations for a stock split; |
| · | Implement a reverse stock split; |
| · | Approve an ESOP (employee stock ownership plan) or other broad based employee stock purchase or ownership plan, or increase authorized shares for existing plans; and |
| · | Adopt certain social and environmental issues regarding discrimination, disclosures of environmental impact, animal treatment and corporate sustainability, when appropriate. |
The Proxy Guidelines also provide that NTI’s Proxy Committee will generally vote against proposals to:
| · | Elect director nominees that sit on more than five public company boards, or, if the nominee is a CEO, more than three public company boards; |
| · | Elect director nominees who attend fewer than 75 percent of board and board-committee meetings for two consecutive years without a satisfactory explanation. |
| · | Classify the board of directors; |
| · | Require that poison pill plans be submitted for shareholder ratification; |
| · | Adopt dual class exchange offers or dual class recapitalizations; |
| · | Require a supermajority shareholder vote to approve mergers and other significant business combinations; |
| · | Require a supermajority shareholder vote to approve charter and bylaw amendments; and |
| · | Adopt certain social and environmental proposals deemed unwarranted by the company’s board of directors. |
B-232
In certain circumstances, the Proxy Guidelines provide that proxy proposals will be addressed on a case-by-case, including those regarding executive and director compensation plans, mergers and acquisitions, ratification of poison pill plans, a change in the company’s state of incorporation and an increase in authorized common stock.
Except as otherwise provided in the Proxy Voting Policy, NTI’s Proxy Committee may vote proxies contrary to the recommendations of the Service Firm if it determines that such action is in the best interest of a Fund. In exercising its discretion, NTI’s Proxy Committee may take into account a wide array of factors relating to the matter under consideration, the nature of the proposal and the company involved. As a result, NTI’s Proxy Committee may vote in one manner in the case of one company and in a different manner in the case of another where, for example, the past history of the company, the character and integrity of its management, the role of outside directors, and the company’s record of producing performance for investors justifies a high degree of confidence in the company and the effect of the proposal on the value of the investment. Similarly, poor past performance, uncertainties about management and future directions, and other factors may lead NTI’s Proxy Committee to conclude that particular proposals present unacceptable investment risks and should not be supported. In addition, NTI’s Proxy Committee also evaluates proposals in context. For example, a particular proposal may be acceptable standing alone, but objectionable when part of an existing or proposed package. Special circumstances may also justify casting different votes for different clients with respect to the same proxy vote.
NTI may occasionally be subject to conflicts of interest in the voting of proxies due to business or personal relationships with persons having an interest in the outcome of certain votes. For example, NTI may provide trust, custody, investment management, brokerage, underwriting, banking and related services to accounts owned or controlled by companies whose management is soliciting proxies. Occasionally, NTI may also have business or personal relationships it maintains with other proponents of proxy proposals, participants in proxy contests, corporate directors or candidates for directorships. NTI may also be required to vote proxies for securities issued by Northern Trust Corporation or its affiliates or on matters in which NTI has a direct financial interest, such as shareholder approval of a change in the advisory fees paid by a Fund. NTI seeks to address such conflicts of interest through various measures, including the establishment, composition and authority of NTI’s Proxy Committee and the retention of the Service Firm to perform proxy review and vote recommendation functions. NTI’s Proxy Committee has the responsibility to determine whether a proxy vote involves a conflict of interest and how the conflict should be addressed in conformance with the Northern Proxy Voting Policy. NTI’s Proxy Committee may resolve such conflicts in any of a variety of ways, including without limitation the following: (i) voting in accordance with the Proxy Guidelines based recommendation of the Service Firm; (ii) voting in accordance with the recommendation of an independent fiduciary appointed for that purpose; (iii) voting pursuant to client direction by seeking instructions from the Board of Trustees of the Trust; or by (iv) voting pursuant to a “mirror voting” arrangement under which shares are voted in the same manner and proportion as shares over which NTI does not have voting discretion. The method selected by NTI’s Proxy Committee may vary depending upon the facts and circumstances of each situation.
NTI may choose not to vote proxies in certain situations. This may occur, for example, in situations where the exercise of voting rights could restrict the ability to freely trade the security in question (as is the case, for example, in certain foreign jurisdictions known as “blocking markets”). In circumstances in which the Service Firm does not provide recommendations for a particular proxy, NTI’s Proxy Committee may obtain recommendations from analysts at NTI who review the issuer in question or the industry in general. NTI’s Proxy Committee will apply the Proxy Guidelines as discussed above to any such recommendation.
This foregoing is only a summary of the Proxy Voting Policy and Proxy Voting Guidelines. You may obtain, upon request and without charge, a full-version paper copy of the Proxy Voting Policy and Proxy Guidelines by calling 800-595-9111.
B-233
OFI GLOBAL INSTITUTIONAL, INC.
PROXY VOTING POLICIES AND GUIDELINES
| APPLICABLE RULES, REGULATIONS & OTHER SOURCES: | • Rule 206(4)-6 under the Investment Advisers Act • Rule 204-2 under the Investment Advisers Act • Form N-1A, Item 12 | |
| RISK ADDRESSED: | Proxies with respect to securities held in Client Accounts are not voted in the best interest of the clients by OFI. | |
| APPLIESTO: | • All OFI Advisers • All Client Accounts | |
| DEPARTMENTS IMPACTED: | • Proxy Voting Committee • Investment Teams • Investment Operations | |
| LAST UPDATED: | January 2016 | |
| APPROVEDBY: | • NY Board: February 2016 • Denver Board: February 2016 • Business: January 2016 |
| A. | POLICY STATEMENT |
Overview. Rule 206(4)-6 under the Investment Advisers Act requires an investment adviser that exercises voting authority with respect to client securities to adopt and implement written policies and procedures that are reasonably designed to ensure that the adviser votes proxies in the best interest of its clients These Proxy Voting Policies and Guidelines (the “Policies and Guidelines”) set forth the prudent and diligent manner in which OFI votes proxies for Clients (as defined below).
| A. | Accounts for which OFI has Proxy Voting Responsibility |
Funds. Each Board of the Funds has delegated to OFI the authority to vote portfolio proxies pursuant to these Policies and Guidelines, subject to Board supervision.
Sub-Advised Funds. OFI also serves as an investment sub-adviser for funds registered with the SEC and not overseen by the Boards (the “Sub-Advised Funds”). Generally, pursuant to contractual arrangements between OFI and many of those Sub-Advised Funds’ managers, OFI is responsible for portfolio proxy voting of the portfolio proxies held by those Sub-Advised Funds. When voting on matters for which the Guidelines dictate that a vote shall be decided on a case-by-case basis, OFI may refer the vote to the portfolio manager of the Sub-Advised Fund.
Other Accounts. OFI also serves as an investment adviser for separately managed accounts, collective investment trusts, non-registered investment companies and 529 college savings plans (the “Other Accounts” and, together with the Funds and Sub-Advised Funds, the “Clients”). Generally, pursuant to contractual arrangements between OFI and each such Other Account, OFI is responsible for portfolio proxy voting of the portfolio proxies held by those Other Accounts.
In the case of Clients that are deemed to constitute the assets of an employee benefit plan subject to ERISA, and entities subject to Section 4975 of the IRC (the “Plans”), OFI shall vote proxies unless the named fiduciary for the Plan has reserved the authority for itself or for an outside party.
| B. | Proxy Voting Committee |
OFI’s Proxy Voting Committee (the “Committee”) is responsible for overseeing the proxy voting process and ensuring that OFI and Clients, if applicable, meet their regulatory and corporate governance obligations for voting of portfolio proxies. The Committee has adopted a written charter that outlines its responsibilities.
B-234
The Committee shall oversee the proxy voting agent’s compliance with these Policies Guidelines, including any deviations by the proxy voting agent from the Guidelines.
| C. | Administration and Voting of Portfolio Proxies |
| 1. | Fiduciary Duty and Objective |
As an investment adviser that has been granted the authority to vote portfolio proxies, OFI owes a fiduciary duty to the Clients to monitor corporate events and to vote portfolio proxies consistent with the best interests of the Clients, and, when applicable, their shareholders. In this regard, OFI seeks to ensure that all votes are free from unwarranted and inappropriate influences. Accordingly, OFI generally votes portfolio proxies in a uniform manner for the Clients and in accordance with these Policies and Guidelines, subject to the contrary direction of the respective advisers of the Sub-Advised Funds or instructions of the Other Accounts. If a portfolio manager requests that OFI vote in a manner inconsistent with the Guidelines, the portfolio manager must submit his/her rationale for voting in this manner to the Committee. The Committee will review the portfolio manager’s rationale to determine that such a request is in the best interests of the Fund (and, if applicable, its shareholders).
In meeting its fiduciary duty, OFI generally undertakes to vote portfolio proxies with a view to enhancing the value of the company’s stock held by the Clients. Similarly, when voting on matters for which the Guidelines dictate a vote is decided on a case-by-case basis, OFI’s primary consideration is the economic interests of the Clients.
From time to time, a Client may be asked to enter into an arrangement, in the context of a corporate action (e.g., a corporate reorganization), whereby the Client becomes contractually obligated to vote in a particular manner with respect to certain agenda items at future shareholders’ meetings. To the extent practicable, portfolio managers must notify the Committee of these proposed arrangements prior to contractually committing a Client to vote in a set manner with respect to future agenda items. The Committee will review these arrangements to determine that such arrangements are in the best interests of the Clients (and, if applicable, their shareholders), and the Committee may ask a portfolio manager to present his/her rationale in support of their proposed course of action.
| 2. | Proxy Voting Agent |
On behalf of the Funds, OFI retains an independent, third party proxy voting agent to assist OFI in its proxy voting responsibilities in accordance with these Policies and Guidelines. As discussed above, the Committee is responsible for monitoring the proxy voting agent.
In general, OFI may consider the proxy voting agent’s research and analysis as part of OFI’s own review of a proxy proposal in which the Guidelines recommend that the vote be considered on a case-by-case basis. OFI bears ultimate responsibility for how portfolio proxies are voted. Unless instructed otherwise by OFI, the proxy voting agent will vote each portfolio proxy in accordance with the Guidelines. The proxy voting agent also will assist OFI in maintaining records of OFI’s and the Funds’ and Sub-Advised Funds’ portfolio proxy votes, including the appropriate records necessary for the Funds’ to meet their regulatory obligations regarding the annual filing of proxy voting records on Form N-PX with the SEC as required by Rule 30b1-4 under the Investment Company Act.
| 3. | Material Conflicts of Interest |
OFI votes portfolio proxies without regard to any other business relationship between OFI (or its affiliates) and the company to which the portfolio proxy relates. To this end, OFI must identify material conflicts of interest that may arise between the interests of a Client (and, if applicable, its shareholders) and OFI, its affiliates or their business relationships. A material conflict of interest may arise from a business relationship between a portfolio
B-235
company or its affiliates (together the “company”), on one hand, and OFI or any of its affiliates, on the other, including, but not limited to, the following relationships:
| · | OFI provides significant investment advisory or other services to a company whose management is soliciting proxies or OFI is seeking to provide such services; |
| · | a company that is a significant selling agent of OFI’s products and services solicits proxies; |
| · | OFI serves as an investment adviser to the pension or other investment account of the portfolio company or OFI is seeking to serve in that capacity; or |
| · | OFI and the company have a lending or other financial-related relationship. |
In each of these situations, voting against company management’s recommendation may cause OFI a loss of revenue or other benefit.
OFI and its affiliates generally seek to avoid such material conflicts of interest by maintaining separate investment decision making processes to prevent the sharing of business objectives with respect to proposed or actual actions regarding portfolio proxy voting decisions. The Committee maintains a list of companies that, based on business relationships, may potentially give rise to a conflict of interest (“Conflicts List”). In addition, OFI and the Committee employ the following procedures to further minimize any potential conflict of interest, as long as the Committee determines that the course of action is consistent with the best interests of the Client, and, if applicable, its shareholders:
| · | If the proposal for a company on the Conflicts List is specifically addressed in the Guidelines, OFI will vote the portfolio proxy in accordance with the Guidelines. If the proposal for the company on the Conflicts List is not specifically addressed in the Guidelines, or if the Guidelines provide discretion to OFI on how to vote (i.e., on a case-by-case basis), OFI will vote in accordance with its proxy voting agent’s general recommended guidelines on the proposal provided that OFI has reasonably determined there is no conflict of interest on the part of the proxy voting agent. |
| · | With respect to proposals of a company on the Conflicts List where a portfolio manager has requested that OFI vote (i) in a manner inconsistent with the Guidelines, or (ii) if the proposal is not specifically addressed in the Guidelines, in a manner inconsistent with the proxy voting agent’s general recommended guidelines, the Committee may determine that such a request is in the best interests of the Client (and, if applicable, its shareholders) and does not pose an actual material conflict of interest. In making its determination, the Committee may consider, among other things, whether the portfolio manager is aware of the business relationship with the company, and/or is sufficiently independent from the business relationship, and to the Committee’s knowledge, whether OFI has been contacted or influenced by the company in connection with the proposal. |
If none of the previous procedures provides an appropriate voting recommendation, the Committee may: (i) determine how to vote on the proposal; (ii) recommend that OFI retain an independent fiduciary to advise OFI on how to vote the proposal; or (iii) determine that voting on the particular proposal is impracticable and/or is outweighed by the cost of voting and direct OFI to abstain from voting.
| 4. | Certain Foreign Securities |
Portfolio proxies relating to foreign securities held by the Clients are subject to these Policies and Guidelines. In certain foreign jurisdictions, however, the voting of portfolio proxies can result in additional restrictions that have an economic impact or cost to the security, such as “share-blocking.” Share-blocking would prevent OFI from selling the shares of the foreign security for a period of time if OFI votes the portfolio proxy relating to the foreign security. In determining whether to vote portfolio proxies subject to such restrictions, OFI, in consultation with the Committee, considers whether the vote, either itself or together with the votes of other shareholders, is expected to have an effect on the value of the investment that will outweigh the cost of voting.
B-236
Accordingly, OFI may determine not to vote such securities. If OFI determines to vote a portfolio proxy and during the “share-blocking period” OFI would like to sell an affected foreign security for one or more Clients, OFI, in consultation with the Committee, will attempt to recall the shares (as allowable within the market time-frame and practices).
| 5. | Securities Lending Programs |
Certain Clients may participate in securities lending programs with various counterparties. Under most securities lending arrangements, proxy voting rights during the lending period generally are transferred to the borrower, and thus proxies received in connection with the securities on loan may not be voted by the lender (i.e., the Client) unless the loan is recalled in advance of the record date. If a Client participates in a securities lending program, OFI will attempt to recall the Client’s portfolio securities on loan and vote proxies relating to such securities if OFI has knowledge of a shareholder vote in time to recall such loaned securities and if OFI determines that the votes involve matters that would have a material effect on the Client’s investment in such loaned securities.
| 6. | Shares of Registered Investment Companies (Fund of Funds) |
Certain Funds are structured as funds of funds and invest their assets primarily in other underlying Funds (the “Fund of Funds”). Accordingly, the Fund of Funds is a shareholder in the underlying Funds and may be requested to vote on a matter pertaining to those underlying Funds. With respect to any such matter the Fund of Funds shall vote its shares on each matter submitted to shareholders of the underlying Funds for a vote in accordance with the recommendation of the Board of the underlying Fund, except as otherwise determined by the Board of the Fund of Funds.
| D. | Board Reports and Recordkeeping |
OFI will prepare periodic reports for submission to each Board describing:
| · | any issues arising under these Policies and Guidelines since the last report to the Board and the resolution of such issues, including but not limited to, information about conflicts of interest not addressed in the Policies and Guidelines; and |
| · | any proxy votes taken by OFI on behalf of the Funds since the last report to the Board which were deviations from the Policies and Guidelines and the reasons for any such deviations. |
In addition, no less frequently than annually, OFI will provide the Boards with a written report identifying any recommended changes in existing policies based upon OFI’s experience under these Policies and Guidelines, evolving industry practices and developments in applicable laws or regulations.
OFI will maintain all records required to be maintained under, and in accordance with, the Investment Company Act and the Investment Advisers Act with respect to OFI’s voting of portfolio proxies, including, but not limited to:
| · | these Policies and Guidelines, as amended from time to time; |
| · | records of votes cast with respect to portfolio proxies, reflecting the information required to be included in Form N-PX; |
| · | records of written client requests for proxy voting information and any written responses of OFI to such requests; and |
| · | any written materials prepared by OFI that were material to making a decision in how to vote, or that memorialized the basis for the decision. |
B-237
| E. | Amendments to these Policies and Guidelines |
In addition to the Committee’s responsibilities as set forth in its Charter, the Committee shall periodically review and update these Policies and Guidelines as necessary. Any amendments to these Policies and Guidelines shall be provided to the Boards for review, approval and ratification at the Boards’ next regularly scheduled meetings.
| F. | Proxy Voting Guidelines |
The Guidelines adopted by OFI and the Boards are attached as Appendix A. The importance of various issues shifts as political, economic and corporate governance issues come to the forefront and then recede. Accordingly, the Guidelines address the issues OFI has most frequently encountered in the past several years.
B-238
Appendix A
PORTFOLIO PROXY VOTING GUIDELINES
(updated: January 2016)
| 1.0 | OPERATIONAL ITEMS |
| 1.1.1 | Amend Quorum Requirements. |
| • | Vote AGAINST proposals to reduce quorum requirements for shareholder meetings below a majority of the shares outstanding unless there are compelling reasons to support the proposal. |
| • | Generally vote AGAINST proposals to establish two different quorum levels, unless there are compelling reasons to support the proposal. |
| 1.1.2 | Amend Articles of Incorporation/Association or Bylaws |
| • | Vote amendments to the bylaws/charter on a CASE-BY-CASE basis. |
| • | Vote FOR bylaw/charter changes if: |
| • | shareholder rights are protected; |
| • | there is a negligible or positive impact on shareholder value; |
| • | management provides sufficiently valid reasons for the amendments; and/or |
| • | the company is required to do so by law (if applicable); and |
| • | they are of a housekeeping nature (updates or corrections). |
| 1.1.3 | Change Company Name. |
| • | Vote WITH Management. |
| 1.1.4 | Change Date, Time, or Location of Annual Meeting. |
| • | Vote FOR management proposals to change the date/time/location of the annual meeting unless the proposed change is unreasonable. |
| • | Vote AGAINST shareholder proposals to change the date/time/location of the annual meeting unless the current scheduling or location is unreasonable. |
| 1.1.5 | Transact Other Business. |
| • | Vote AGAINST proposals to approve other business when it appears as voting item. |
| 1.1.6 | Change in Company Fiscal Term |
| • | Vote FOR resolutions to change a company’s fiscal term for sufficiently valid business reasons. |
| • | Vote AGAINST if a company’s motivation for the change is to postpone its AGM. |
| 1.1.7 | Adjourn Meeting |
| • | Generally vote AGAINST proposals to provide management with the authority to adjourn an annual or special meeting, unless there are compelling reasons to support the proposal. |
B-239
AUDITORS
| 1.2 | Ratifying Auditors |
| • | Vote FOR Proposals to ratify auditors, unless any of the following apply: |
| • | an auditor has a financial interest in or association with the company, and is therefore not independent; |
| • | fees for non-audit services are excessive; |
| • | there is reason to believe that the independent auditor has rendered an opinion which is neither accurate nor indicative of the company’s financial position; or |
| • | poor accounting practices are identified that rise to a serious level of concern, such as: fraud; misapplication of Generally Accepted Accounting Principles (“GAAP”) or International Financial Reporting Standards (“IFRS”); or material weaknesses identified in Section 404 disclosures. |
| • | Vote AGAINST shareholder proposals asking companies to prohibit or limit their auditors from engaging in non-audit services. |
| • | Vote AGAINST shareholder proposals asking for audit firm rotation. |
| • | Vote on a CASE-BY-CASE basis on shareholder proposals asking the company to discharge the auditor(s). |
| • | Proposals are adequately covered under applicable provisions of Sarbanes-Oxley Act or NYSE or SEC regulations. |
| • | Vote AGAINST the appointment of external auditors if they have previously served the company in an executive capacity or can otherwise be considered affiliated with the company. |
| 2.0 | THE BOARD OF DIRECTORS |
| 2.1 | Voting on Director Nominees |
| • | Vote on director nominees should be made on a CASE-BY-CASE basis, examining the following factors: |
| • | composition of the board and key board committees; |
| • | attendance at board meetings; |
| • | corporate governance provisions and takeover activity; |
| • | long-term company performance relative to a market index; |
| • | directors’ investment in the company; |
| • | whether the chairman is also serving as CEO; |
| • | whether a retired CEO sits on the board. |
| • | whether the company or director is targeted in connection with public “vote no” campaigns. |
| • | There are some actions by directors that should result in votes being WITHHELD/AGAINST (whichever vote option is applicable on the ballot). These instances include directors who: |
| • | attend less than 75% of the board and committee meetings without a valid excuse; |
| • | implement or renew a dead-hand or modified dead-hand poison pill; |
B-240
| • | failed to adequately respond to a majority supported shareholder proposal; |
| • | failed to act on takeover offers where the majority of the shareholders tendered their shares; |
| • | are inside directors or affiliated outsiders; and sit on the audit, compensation, or nominating committees or the company does not have one of these committees; |
| • | re audit committee members and any of the following has applied and become public information since the last vote, and has not been otherwise corrected or proper controls have not been put in place: |
| • | the non-audit fees paid to the auditor are excessive; |
| • | a material weakness is identified in the Section 404 Sarbanes-Oxley Act disclosures which rises to a level of serious concern, there are chronic internal control issues and an absence of established effective control mechanisms; |
| • | there is persuasive evidence that the audit committee entered into an inappropriate indemnification agreement with its auditor that limits the ability of the company, or its shareholders, to pursue legitimate legal recourse against the audit firm; or |
| • | the company receives an adverse opinion on the company’s financial statements from its auditors. |
| • | are compensation committee members and any of the following has applied and become public information since the last vote, and has not been otherwise corrected or proper controls have not been put in place: |
| • | there is a clearly negative correlation between the chief executive’s pay and company performance under standards adopted in this policy; |
| • | the company re-prices underwater options for stock, cash or other consideration without prior shareholder approval, even if allowed in their equity plan; |
| • | the company fails to submit one-time transfers of stock options to a shareholder vote; |
| • | the company fails to fulfill the terms of a burn rate commitment they made to shareholders; |
| • | the company has inappropriately backdated options; or |
| • | the company has egregious compensation practices including, but not limited to, the following: |
| • | egregious employment contracts; |
| • | excessive perks/tax reimbursements; |
| • | abnormally large bonus payouts without justifiable performance linkage or proper disclosure; |
| • | egregious pension/supplemental executive retirement plan (SERP) payouts; |
| • | new CEO with overly generous new hire package; |
| • | excessive severance and/or change in control provisions; or |
| • | dividends or dividend equivalents paid on unvested performance shares or units. |
| • | enacted egregious corporate governance policies or failed to replace management as appropriate; |
B-241
| • | are inside directors or affiliated outside directors; and the full board is less than majority independent; |
| • | are CEOs of public companies who serve on more than three public company boards, i.e., more than two public company boards other than their own board (the term “public company” excludes an investment company). Vote should be WITHHELD only at their outside board elections; |
| • | serve on more than five public company boards. (The term “public company” excludes an investment company.) |
| • | WITHHOLD/AGAINST on all incumbents if the board clearly lacks accountability and oversight, coupled with sustained poor performance relative to its peers. |
| • | Additionally, the following should result in votes being WITHHELD/AGAINST (except from new nominees): |
| • | if the director(s) receive more than 50% withhold votes of votes cast and the issue that was the underlying cause of the high level of withhold votes in the prior election has not been addressed; or |
| • | if the company has adopted or renewed a poison pill without shareholder approval since the company’s last annual meeting, does not put the pill to a vote at the current annual meeting, and there is no requirement to put the pill to shareholder vote within 12 months of its adoption; |
| • | if a company that triggers this policy commits to putting its pill to a shareholder vote within 12 months of its adoption, OFI will not recommend a WITHHOLD vote. |
| 2.2 | Board Size |
| • | Vote on a CASE-BY-CASE basis on shareholder proposals to maintain or improve ratio of independent versus non-independent directors. |
| • | Vote FOR proposals seeking to fix the board size or designate a range for the board size. |
| • | Vote on a CASE-BY-CASE basis on proposals that give management the ability to alter the size of the board outside of a specified range without shareholder approval. |
| 2.3 | Classification/Declassification of the Board |
| • | Vote AGAINST proposals to classify the board. |
| • | Vote FOR proposals to repeal classified boards and to elect all directors annually. In addition, if 50% of voting shareholders request repeal of the classified board and the board remains classified, WITHHOLD votes for those directors at the next meeting at which directors are elected, provided however, if the company has majority voting for directors that meets the standards under this policy, WITHHOLD votes only from directors having responsibility to promulgate classification/declassification policies, such as directors serving on the governance committee, nominating committee or either of its equivalent. |
| 2.4 | Cumulative Voting |
| • | Vote FOR proposal to eliminate cumulative voting. |
| • | Vote on a CASE-BY-CASE basis on cumulative voting proposals at controlled companies (where insider voting power is greater than 50%). |
B-242
| 2.5 | Establishment of Board Committees |
| • | Generally vote AGAINST shareholder proposals to establish a new board committee, as such proposals seek a specific oversight mechanism/structure that potentially limits a company’s ability to maintain its own affairs. However, exceptions may be made if determined that it would be in the best interest of the company’s governance structure. |
| 2.6 | Require Majority Vote for Approval of Directors |
| • | OFI will generally vote FOR precatory and binding resolutions requesting that the board change the company’s bylaws to stipulate that directors need to be elected with an affirmative majority of votes cast, provided it does not conflict with state law where the company is incorporated. Binding resolutions need to allow for a carve-out for a plurality vote standard when there are more nominees than board seats. |
Companies are strongly encouraged to also adopt a post-election policy (also known as a director resignation policy) that will provide guidelines so that the company will promptly address the situation of a holdover director.
| 2.7 | Director and Officer Indemnification and Liability Protection |
| • | Proposals on director and officer indemnification and liability protection should be evaluated on a CASE-BY-CASE basis, using Delaware law as the standard. |
| • | Vote on a CASE-BY-CASE basis on proposals to eliminate entirely directors’ and officers’ liability for monetary damages for violating the duty of care, provided the liability for gross negligence is not eliminated. |
| • | Vote on a CASE-BY-CASE basis on indemnification proposals that would expand coverage beyond just legal expenses to acts, such as negligence, that are more serious violations of fiduciary obligation than mere carelessness, provided coverage is not provided for gross negligence acts. |
| • | Vote on a CASE-BY-CASE basis on proposals to expand the scope of indemnification to provide for mandatory indemnification of company officials in connection with acts that previously the company was permitted to provide indemnification for at the discretion of the company’s board (i.e. “permissive indemnification”) but that previously the company was not required to indemnify. |
| • | Vote FOR only those proposals providing such expanded coverage in cases when a director’s or officer’s legal defense was unsuccessful if both of the following apply: |
| • | the director was found to have acted in good faith and in a manner that he reasonable believed was in the best interests of the company; and |
| • | only if the director’s legal expenses would be covered. |
| 2.8 | Establish/Amend Nominee Qualifications |
| • | Vote on a CASE-BY-CASE basis on proposals that establish or amend director qualifications. |
| • | Votes should be based on how reasonable the criteria are and to what degree they may preclude dissident nominees from joining the board. |
| • | Vote AGAINST shareholder proposals requiring two candidates per board seat. |
| 2.9 | Filling Vacancies/Removal of Directors. |
| • | Vote AGAINST proposals that provide that directors may be removed only for cause. |
B-243
| • | Vote FOR proposals to restore shareholder ability to remove directors with or without cause. |
| • | Vote AGAINST proposals that provide that only continuing directors may elect replacements to fill board vacancies. |
| • | Vote FOR proposals that permit shareholders to elect directors to fill board vacancies. |
| 2.10 | Independent Chairman (Separate Chairman/CEO) |
| • | Generally vote FOR shareholder proposals requiring the position of chairman to be filled by an independent director unless there are compelling reasons to recommend against the proposal such as a counterbalancing governance structure. This should include all of the following: |
| • | designated lead director, elected by and from the independent board members with clearly delineated and comprehensive duties; |
| • | two-thirds independent board; |
| • | all-independent key committees; |
| • | established governance guidelines; |
| • | the company should not have underperformed its peers and index on a one-year and three-year basis, unless there has been a change in the Chairman/CEO position within that time (performance will be measured according to shareholder returns against index and peers from the performance summary table); |
| • | the company does not have any problematic governance or management issues, examples of which include, but are not limited to: |
| • | egregious compensation practices; |
| • | multiple related-party transactions or other issues putting director independence at risk; |
| • | corporate and/or management scandal; |
| • | excessive problematic corporate governance provisions; or |
| • | flagrant actions by management or the board with potential or realized negative impacts on shareholders. |
| 2.11 | Majority of Independent Directors/Establishment of Committees |
| • | Vote FOR shareholder proposals asking that a majority of directors be independent but vote CASE-BY-CASE on proposals that more than a majority of directors be independent. NYSE and NASDAQ already require that listed companies have a majority of independent directors. |
| • | Vote FOR shareholder proposals asking that board audit, compensation, and/or nominating committees are composed exclusively of independent directors if they currently do not meet that standard. |
| • | For purposes of Special Purpose Acquisition Corporations (SPAC), when a former CEO of a SPAC company serves on the board of an acquired company, that director will generally be classified as independent unless determined otherwise taking into account the following factors: |
| • | the applicable listing standards determination of such director’s independence; |
| • | any operating ties to the firm; and |
| • | if there are any other conflicting relationships or related party transactions. |
B-244
| • | A director who is a party to an agreement to vote in line with management on proposals being brought to a shareholder vote shall be classified as an affiliated outside director. However, when dissident directors are parties to a voting agreement pursuant to a settlement arrangement, such directors shall be classified as independent unless determined otherwise taking into account the following factors: |
| • | the terms of the agreement; |
| • | the duration of the standstill provision in the agreement; |
| • | the limitations and requirements of actions that are agreed upon; |
| • | if the dissident director nominee(s) is subject to the standstill; and |
| • | if there are any conflicting relationships or related party transactions. |
| 2.12 | Require More Nominees than Open Seats |
| • | Vote AGAINST shareholder proposals that would require a company to nominate more candidates than the number of open board seats. |
| 2.13 | Open Access |
| • | Vote CASE-BY-CASE on shareholder proposals asking for open access taking into account the ownership threshold specified in the proposal and the proponent’s rationale for targeting the company in terms of board and director conduct. |
| 2.14 | Stock Ownership Requirements |
| • | Vote on a CASE-BY-CASE basis on shareholder proposals that mandate a minimum amount of stock that a director must own in order to qualify as a director or to remain on the board. While stock ownership on the part of directors is favored, the company should determine the appropriate ownership requirement. |
| • | Vote on a CASE-BY-CASE basis on shareholder proposals asking companies to adopt holding periods or retention ratios for their executives, taking into account: |
| • | actual officer stock ownership and the degree to which it meets or exceeds the proponent’s suggested holding period/retention ratio or the company’s own stock ownership or retention requirements. |
| • | problematic pay practices, current and past. |
| 2.15 | Age or Term Limits |
| • | Vote AGAINST shareholder or management proposals to limit the tenure of directors either through term limits or mandatory retirement ages. OFI views as management decision. |
| 3.0 | PROXY CONTESTS |
| 3.1 | Voting for Director Nominees in Contested Elections |
| • | Votes in a contested election of directors must be evaluated on a CASE-BY-CASE basis considering the following factors: |
| • | long-term financial performance of the target company relative to its industry; |
| • | management’s track record; |
B-245
| • | background to the proxy contest; |
| • | qualifications of director nominees (both slates); |
| • | evaluation of what each side is offering shareholders as well as the likelihood that the proposed objectives and goals can be met; and |
| • | stock ownership position. |
| 3.2 | Reimbursing Proxy Solicitation Expenses |
| • | Voting to reimburse proxy solicitation expenses should be analyzed on a CASE-BY-CASE basis. In cases, which OFI recommends in favor of the dissidents, OFI also recommends voting for reimbursing proxy solicitation expenses. |
| 3.3 | Confidential Voting and Vote Tabulation |
| • | Vote on a CASE-BY-CASE basis on shareholder proposals regarding proxy voting mechanics including, but not limited to, confidential voting of individual proxies and ballots, confidentiality of running vote tallies, and the treatment of abstentions and/or broker non-votes in the company’s vote counting methodology. The factors considered, as applicable to the proposal, may include: |
| • | The scope and structure of the proposal; |
| • | The company’s stated confidential voting policy (or other relevant policies) and whether it ensures a “level playing field” by providing shareholder proponents with equal access to vote information prior to the annual meeting; |
| • | The company’s vote standard for management and shareholder proposals and whether it ensures consistency and fairness in the proxy voting process and maintains the integrity of vote results; |
| • | Whether the company’s disclosure regarding its vote counting method and other relevant voting policies with respect to management and shareholder proposals are consistent and clear; |
| • | Any recent controversies or concerns related to the company’s proxy voting mechanics; |
| • | Any unintended consequences resulting from implementation of the proposal; and |
| • | Any other factors that may be relevant. |
| 4.0 | ANTITAKEOVER DEFENSES AND VOTING RELATED ISSUES |
| 4.1 | Advance Notice Requirements for Shareholder Proposals/Nominations. |
| • | Votes on advance notice proposals are determined on a CASE-BY-CASE basis, generally giving support to those proposals which allow shareholders to submit proposals as close to the meeting date as reasonably possible and within the broadest window possible. |
| 4.2 | Amend Bylaws without Shareholder Consent |
| • | Vote AGAINST proposals giving the board exclusive authority to amend the bylaws. |
| • | Vote FOR proposals giving the board the ability to amend the bylaws in addition to shareholders. |
B-246
| 4.3 | Poison Pills |
| • | Vote AGAINST proposals that increase authorized common stock for the explicit purpose of implementing a shareholder rights plan (poison pill). |
| • | Vote FOR shareholder proposals requesting that the company submit its poison pill to a shareholder vote or redeem it. |
| • | Vote FOR shareholder proposals asking that any future pill be put to a shareholder vote. |
| • | Votes regarding management proposals to ratify a poison pill should be determined on a CASE-BY-CASE basis. Ideally, plans should embody the following attributes: |
| • | 20% or higher flip-in or flip-over; |
| • | two to three-year sunset provision; |
| • | no dead-hand, slow-hand, no-hand or similar features; |
| • | shareholder redemption feature-if the board refuses to redeem the pill 90 days after an offer is announced, ten percent of the shares may call a special meeting or seek a written consent to vote on rescinding the pill; |
| • | considerations of the company’s existing governance structure including: board independence, existing takeover defenses, and any problematic governance concerns; |
| • | for management proposals to adopt a poison pill for the stated purpose of preserving a company’s net operating losses (“NOL pills”), the following factors will be considered: |
| • | the trigger (NOL pills generally have a trigger slightly below 5%); |
| • | the value of the NOLs; |
| • | the term; |
| • | shareholder protection mechanisms (sunset provision, causing expiration of the pill upon exhaustion or expiration of NOLs); and |
| • | other factors that may be applicable. |
| 4.4 | Net Operating Loss (NOL) Protective Amendments |
| • | OFI will evaluate amendments to the company’s NOL using the same criteria as a NOL pill. |
| 4.5 | Shareholder Ability to Act by Written Consent |
| • | Vote AGAINST proposals to restrict or prohibit shareholder ability to take action by written consent. |
| • | Generally vote FOR proposals that remove restrictions on or provide the right of shareholders to act by written consent independently of management taking into account the company’s specific governance provisions including right to call special meetings, poison pills, vote standards, etc. on a CASE-BY-CASE basis. |
| 4.6 | Shareholder Ability to Call Special Meetings |
| • | Vote AGAINST proposals to restrict or prohibit shareholder ability to call special meetings. |
| • | Generally vote FOR proposals that remove restrictions on or provide the right of shareholders to call special meetings and act independently of management taking into account the company’s specific governance provisions. |
B-247
| 4.7 | Establish Shareholder Advisory Committee |
| • | Vote on a CASE-BY-CASE basis. |
| 4.8 | Supermajority Vote Requirements |
| • | Vote AGAINST proposals to require a supermajority shareholder vote. |
| • | Vote FOR management or shareholder proposals to reduce supermajority vote requirements. However, for companies with shareholder(s) who have significant ownership levels, vote CASE-BY-CASE. |
| 5.0 | Mergers and Corporate Restructurings |
| 5.1 | Appraisal Rights |
| • | Vote FOR proposals to restore, or provide shareholders with, rights of appraisal. |
| 5.2 | Asset Purchases |
| • | Vote CASE-BY-CASE on asset purchase proposals, considering the following factors: |
| • | purchase price; |
| • | fairness opinion; |
| • | financial and strategic benefits; |
| • | how the deal was negotiated; |
| • | conflicts of interest; |
| • | other alternatives for the business; and |
| • | non-completion risk. |
| 5.3 | Asset Sales |
| • | Vote CASE-BY-CASE on asset sale proposals, considering the following factors: |
| • | impact on the balance sheet/working capital; |
| • | potential elimination of diseconomies; |
| • | anticipated financial and operating benefits; |
| • | anticipated use of funds; |
| • | value received for the asset; |
| • | fairness opinion; |
| • | how the deal was negotiated; and |
| • | conflicts of interest. |
| 5.4 | Bundled Proposals |
| • | Review on a CASE-BY-CASE basis on bundled or “conditioned” proxy proposals. In the case of items that are conditioned upon each other, examine the benefits and costs of the packaged items. In instances when the joint effect of the conditioned items is not in shareholders’ best interests, vote against the proposals. If the combined effect is positive, support such proposals. |
B-248
| 5.5 | Conversion of Securities |
| • | Votes on proposals regarding conversion of securities are determined on a CASE-BY-CASE basis. When evaluating these proposals, the investor should review the dilution to existing shareholders, the conversion price relative to the market value, financial issues, control issues, termination penalties, and conflicts of interest. |
| • | Vote FOR the conversion if it is expected that the company will be subject to onerous penalties or will be forced to file for bankruptcy if the transaction is not approved. |
| 5.6 | Corporate Reorganization/Debt Restructuring/Prepackaged Bankruptcy Plans/Reverse Leveraged Buyouts/Wrap Plans |
| • | Votes on proposals to increase common and/or preferred shares and to issue shares as part of a debt restructuring plan are determined on a CASE-BY-CASE basis, taking into consideration the following: |
| • | dilution to existing shareholders’ position; |
| • | terms of the offer; |
| • | financial issues; |
| • | management’s efforts to pursue other alternatives; |
| • | control issues; and |
| • | conflicts of interest. |
| • | Vote FOR the debt restructuring if it is expected that the company will file for bankruptcy if the transaction is not approved. |
| 5.7 | Formation of Holding Company |
| • | Votes on proposals regarding the formation of a holding company should be determined on a CASE-BY-CASE basis, taking into consideration the following: |
| • | the reasons for the change; |
| • | any financial or tax benefits; |
| • | regulatory benefits; |
| • | increases in capital structure; and |
| • | changes to the articles of incorporation or bylaws of the company. |
| • | Absent compelling financial reasons to recommend the transaction, vote AGAINST the formation of a holding company if the transaction would include either of the following: |
| • | increases in common or preferred stock in excess of the allowable maximum as calculated by the RMG Capital Structure Model; and/or |
| • | adverse changes in shareholder rights. |
| 5.8 | Going Private Transactions (LBOs, Minority Squeezeouts) and Going Dark Transactions |
| • | Vote on going private transactions on a CASE-BY-CASE basis, taking into account the following: |
| • | offer price/premium; |
B-249
| • | fairness opinion; |
| • | how the deal was negotiated; |
| • | conflicts of interests; |
| • | other alternatives/offers considered; and |
| • | non-completion risk. |
| • | Vote CASE-BY-CASE on going dark transactions, determining whether the transaction enhances shareholder value by taking into consideration: |
| • | whether the company has attained benefits from being publicly-traded (examination of trading volume, liquidity, and market research of the stock); |
| • | cash-out value; |
| • | whether the interests of continuing and cashed-out shareholders are balanced; and |
| • | the market reaction to public announcement of the transaction. |
| 5.9 | Joint Venture |
| • | Votes on a CASE-BY-CASE basis on proposals to form joint ventures, taking into account the following: |
| • | percentage of assets/business contributed; |
| • | percentage of ownership; |
| • | financial and strategic benefits; |
| • | governance structure; |
| • | conflicts of interest; |
| • | other alternatives; and |
| • | non-completion risk. |
| 5.10 | Liquidations |
| • | Votes on liquidations should be made on a CASE-BY-CASE basis after reviewing management’s efforts to pursue other alternatives, appraisal value of assets, and the compensation plan for executives managing the liquidation. |
| • | Vote FOR the liquidation if the company will file for bankruptcy if the proposal is not approved. |
| 5.11 | Mergers and Acquisitions/Issuance of Shares to Facilitate Merger or Acquisition |
| • | Votes on mergers and acquisitions should be considered on a CASE-BY-CASE basis, determining whether the transaction enhances shareholder value by giving consideration to the following: |
| • | prospects of the combined company anticipated financial and operating benefits; |
| • | offer price (premium or discount); |
| • | fairness opinion; |
| • | how the deal was negotiated; |
B-250
| • | changes in corporate governance; |
| • | changes in the capital structure; and |
| • | conflicts of interest. |
| 5.12 | Private Placements/Warrants/Convertible Debenture |
| • | Votes on proposals regarding private placements should be determined on a CASE-BY-CASE basis. When evaluating these proposals the invest should review: |
| • | dilution to existing shareholders’ position; |
| • | terms of the offer; |
| • | financial issues; |
| • | management’s efforts to pursue other alternatives; |
| • | control issues; and |
| • | conflicts of interest. |
| • | Vote FOR the private placement if it is expected that the company will file for bankruptcy if the transaction is not approved. |
| 5.13 | Spinoffs |
| • | Votes on spinoffs should be considered on a CASE-BY-CASE basis depending on: |
| • | tax and regulatory advantages; |
| • | planned use of the sale proceeds; |
| • | valuation of spinoff; |
| • | fairness opinion; |
| • | benefits to the parent company; |
| • | conflicts of interest; |
| • | managerial incentives; |
| • | corporate governance changes; and |
| • | changes in the capital structure. |
| 5.14 | Value Maximization Proposals |
| • | Votes on a CASE-BY-CASE basis on shareholder proposals seeking to maximize shareholder value by hiring a financial advisor to explore strategic alternatives, selling the company or liquidating the company and distributing the proceeds to shareholders. These proposals should be evaluated based on the following factors: prolonged poor performance with no turnaround in sight, signs of entrenched board and management, strategic plan in place for improving value, likelihood of receiving reasonable value in a sale or dissolution and whether the company is actively exploring its strategic options, including retaining a financial advisor. |
| 5.15 | Severance Agreements that are Operative in Event of Change in Control |
| • | Review CASE-BY-CASE, with consideration given to RMG “transfer-of-wealth” analysis. (See section 8.2). |
B-251
| 5.16 | Special Purpose Acquisition Corporations (SPACs) |
| • | Vote on mergers and acquisitions involving SPAC will be voted on a CASE-BY-CASE using a model developed by RMG which takes in consideration: |
| • | valuation; |
| • | market reaction; |
| • | deal timing; |
| • | negotiations and process; |
| • | conflicts of interest; |
| • | voting agreements; and |
| • | governance. |
| 6.0 | STATE OF INCORPORATION |
| 6.1 | Control Share Acquisition Provisions |
| • | Vote FOR proposals to opt out of control share acquisition statutes unless doing so would enable the completion of a takeover that would be detrimental to shareholders. |
| • | Vote AGAINST proposals to amend the charter to include control share acquisition provisions. |
| • | Vote FOR proposals to restore voting rights to the control shares. |
| 6.2 | Control Share Cashout Provisions |
| • | Vote FOR proposals to opt out of control share cash-out statutes. |
| 6.3 | Disgorgement Provisions |
| • | Vote FOR proposals to opt out of state disgorgement provisions. |
| 6.4 | Fair Price Provisions |
| • | Vote proposals to adopt fair price provisions on a CASE-BY-CASE basis, evaluating factors such as the vote required to approve the proposed acquisition, the vote required to repeal the fair price provision, and the mechanism for determining the fair price. |
| • | Generally vote AGAINST fair price provisions with shareholder vote requirements greater than a majority of disinterested shares. |
| 6.5 | Freezeout Provisions |
| • | Vote FOR proposals to opt out of state freeze-out provisions. |
| 6.6 | Greenmail |
| • | Vote FOR proposals to adopt anti-greenmail charter of bylaw amendments or otherwise restrict a company’s ability to make greenmail payments. |
| • | Review on a CASE-BY-CASE basis on anti-greenmail proposals when they are bundled with other charter or bylaw amendments. |
B-252
| 6.7 | Reincorporation Proposals |
| • | Proposals to change a company’s state of incorporation should be evaluated on a CASE-BY-CASE basis, giving consideration to both financial and corporate governance concerns, including the reasons for reincorporating, a comparison of the governance provisions, and a comparison of the jurisdictional laws. |
| • | Vote FOR reincorporation when the economic factors outweigh any neutral or negative governance changes. |
| 6.8 | Stakeholder Provisions |
| • | Vote AGAINST proposals that ask the board to consider non-shareholder constituencies or other non-financial effects when evaluating a merger or business combination. |
| 6.9 | State Anti-takeover Statutes |
| • | Review on a CASE-BY-CASE basis proposals to opt in or out of state takeover statutes (including control share acquisition statutes, control share cash-out statutes, freeze-out provisions, fair price provisions, stakeholder laws, poison pill endorsements, severance pay and labor contract provisions, anti-greenmail provisions, and disgorgement provisions). |
| 7.0 | CAPITAL STRUCTURE |
| 7.1 | Adjustments to Par Value of Common Stock |
| • | Vote FOR management proposals to reduce the par value of common stock. |
| 7.2 | Common Stock Authorization |
| • | Votes on proposals to increase the number of shares of common stock authorized for issuance are determined on a CASE-BY-CASE basis using a model developed by RMG which considers the following factors: |
| • | specific reasons/rationale for the proposed increase; |
| • | the dilutive impact of the request as determined through an allowable cap generated by RiskMetrics’ quantitative model; |
| • | the board’s governance structure and practices; and |
| • | risks to shareholders of not approving the request. |
| • | Vote AGAINST proposals at companies with dual-class capital structures to increase the number of authorized shares of the class of stock that has superior voting rights. Vote FOR proposals to approve increases beyond the allowable increase when a company’s shares are in danger of being delisted or if a company’s ability to continue to operate as a going concern is uncertain. |
| 7.3 | Dual-Class Stock |
| • | Vote AGAINST proposals to create a new class of common stock with superior voting rights. |
| • | Vote FOR proposals to create a new class of non-voting or sub-voting common stock if: |
| • | it is intended for financing purposes with minimal or no dilution to current shareholders; and |
B-253
| • | it is not designed to preserve the voting power of an insider or significant shareholder. |
| 7.4 | Issue Stock for Use with Rights Plan |
| • | Vote AGAINST proposals that increase authorized common stock for the explicit purpose of implementing a non-shareholder approved shareholder rights plan (poison pill). |
| 7.5 | Preemptive Rights |
| • | Review on a CASE-BY-CASE basis on shareholder proposals that seek preemptive rights. In evaluating proposals on preemptive right, consider the size of a company, the characteristics of its shareholder base, and the liquidity of the stock. |
| 7.6 | Preferred Stock |
| • | OFI will vote CASE-BY-CASE on proposals to increase the number of shares of preferred stock authorized for issuance using a model developed by ISS, taking into account company-specific factors including past board performance and governance structure as well as whether the stock is “blank check” (preferred stock with unspecified voting, conversion, dividend distribution, and other rights) or “declawed” (preferred stock that cannot be used as takeover defense). |
| 7.7 | Recapitalization |
| • | Votes CASE-BY-CASE on recapitalizations (reclassification of securities), taking into account the following: |
| • | more simplified capital structure; |
| • | enhanced liquidity; |
| • | fairness of conversion terms; |
| • | impact on voting power and dividends; |
| • | reasons for the reclassification; |
| • | conflicts of interest; and |
| • | other alternatives considered. |
| 7.8 | Reverse Stock Splits |
| • | Vote FOR management proposals to implement a reverse stock split when the number of authorized shares will be proportionately reduced. |
| • | Vote FOR management proposals to implement a reverse stock split to avoid delisting. |
| • | Votes on proposals to implement a reverse stock split that do not proportionately reduce the number of shares authorized for issue should be determined on a CASE-BY-CASE basis using a model developed by RMG. |
| 7.9 | Share Purchase Programs |
| • | Vote CASE-BY-CASE on management proposals to institute open-market share repurchase plans, taking into consideration, but not limited to, the following factors: |
| • | whether all shareholders may participate on equal terms; |
B-254
| • | the volume of shares to be repurchased and/or held in treasury; |
| • | the duration of the authority; |
| • | whether the repurchase may be used for anti-takeover purposes; |
| • | past use of repurchased shares; and |
| • | pricing provisions and other safeguards |
| * | The above factors will take into account market best practices and apply those standards deemed acceptable in the market. |
| 7.10 | Stock Distributions: Splits and Dividends |
| • | Vote FOR management proposals to increase the common share authorization for a stock split or share dividend, provided that the increase in authorized shares would not result in an excessive number of shares available for issuance as determined using a model developed by RMG. |
| 7.11 | Tracking Stock |
| • | Votes on the creation of tracking stock are determined on a CASE-BY-CASE basis, weighing the strategic value of the transaction against such factors as: adverse governance changes, excessive increases in authorized capital stock, unfair method of distribution, diminution of voting rights, adverse conversion features, negative impact on stock option plans, and other alternatives such as spinoff. |
| 8.0 | EXECUTIVE AND DIRECTOR COMPENSATION |
| 8.1 | Equity-based Compensation Plans |
| • | Vote compensation proposals on a CASE-BY-CASE basis. |
| • | OFI analyzes stock option plans, paying particular attention to their dilutive effect. OFI opposes compensation proposals that OFI believes to be excessive, with consideration of factors including the company’s industry, market capitalization, revenues and cash flow. |
| • | In certain cases, vote AGAINST equity proposal and compensation committee members taking into consideration whether: |
| • | the total cost of the company’s equity plans is unreasonable; |
| • | the plan expressly permits the re-pricing of stock options/stock appreciate rights (SARs) without prior shareholder approval; |
| • | the CEO is a participant in the proposed equity-based compensation plan and there is a disconnect between CEO pay and the company’s performance where over 50 percent of the year-over-year increase is attributed to equity awards; |
| • | the plan provides for the acceleration of vesting of equity awards even though an actual change in control may not occur (e.g., upon shareholder approval of a transaction or the announcement of a tender offer); or |
| • | the plan is a vehicle for poor pay practices. |
| • | For Real Estate Investment Trusts (REITs), common shares issuable upon conversion of outstanding Operating Partnership (OP) units will be included in the share count for the purposes of determining: (1) market capitalization in the Shareholder Value Transfer (SVT) analysis and (2) shares outstanding in the burn rate analysis. |
B-255
| 8.2 | Director Compensation |
| • | Vote CASE-BY-CASE on stock plans or non-cash compensation plans for non-employee directors, based on the cost of the plans against the company’s allowable cap. On occasion, director stock plans that set aside a relatively small number of shares when combined with employee or executive stock compensation plans will exceed the allowable cap. |
| • | Vote FOR the plan if ALL of the following qualitative factors in the board’s compensation are met and disclosed in the proxy statement: |
| • | director stock ownership guidelines with a minimum of three times the annual cash retainer; |
| • | vesting schedule or mandatory holding/deferral period: |
| • | a minimum vesting of three years for stock options or restricted stock; or |
| • | deferred stock payable at the end of a three-year deferral period; |
| • | mix between cash and equity: |
| • | a balanced mix of cash and equity, for example 40% cash/60% equity or 50% cash/50% equity; or |
| • | if the mix is heavier on the equity component, the vesting schedule or deferral period should be more stringent, with the lesser of five years or the term of directorship; |
| • | no retirement/benefits and perquisites provided to non-employee directors; and |
| • | detailed disclosure provided on cash and equity compensation delivered to each non-employee director for the most recent fiscal year in a table. The column headers for the table may include the following: name of each non-employee director, annual retainer, board meeting fees, committee retainer, committee-meeting fees, and equity grants. |
| 8.3 | Bonus for Retiring Director |
| • | Examine on a CASE-BY CASE basis. Factors we consider typically include length of service, company’s accomplishments during the Director’s tenure, and whether we believe the bonus is commensurate with the Director’s contribution to the company. |
| 8.4 | Cash Bonus Plan |
| • | Consider on a CASE-BY-CASE basis. In general, OFI considers compensation questions such as cash bonus plans to be ordinary business activity. While we generally support management proposals, we oppose compensation proposals we believe are excessive. |
| 8.5 | Stock Plans in Lieu of Cash |
| • | Generally vote FOR management proposals, unless OFI believe the proposal is excessive. |
In casting its vote, OFI reviews the RMG recommendation per a “transfer of wealth” binomial formula that determines an appropriate cap for the wealth transfer based upon the company’s industry peers.
| • | Vote FOR plans which provide participants with the option of taking all or a portion of their cash compensation in the form of stock are determined on a CASE-BY-CASE basis. |
| • | Vote FOR plans which provide a dollar-for-dollar cash for stock exchange. |
B-256
| 8.6 | Pre-Arranged Trading Plans (10b5-1 Plans) |
| • | Generally vote FOR shareholder proposals calling for certain principles regarding the use of prearranged trading plans (10b5-1 plans) for executives. These principles include: |
| • | adoption, amendment, or termination of a 10b5-1 Plan must be disclosed within two business days in a Form 8-K; |
| • | amendment or early termination of a 10b5-1 Plan is allowed only under extraordinary circumstances, as determined by the board; |
| • | ninety days must elapse between adoption or amendment of a 10b5-1 Plan and initial trading under the plan; |
| • | reports on Form 4 must identify transactions made pursuant to a 10b5-1 Plan; |
| • | an executive may not trade in company stock outside the 10b5-1 Plan; and |
| • | trades under a 10b5-1 Plan must be handled by a broker who does not handle other securities transactions for the executive. |
| 8.7 | Management Proposals Seeking Approval to Reprice Options |
| • | Votes on management proposals seeking approval to exchange/reprice options are evaluated on a CASE-BY-CASE basis giving consideration to the following: |
| • | historic trading patterns; |
| • | rationale for the repricing; |
| • | value-for-value exchange; |
| • | option vesting; |
| • | term of the option; |
| • | exercise price; |
| • | participation; and |
| • | market best practices |
Transfer Stock Option (TSO) Programs
Vote FOR if One-time Transfers:
| • | executive officers and non-employee directors are excluded from participating; |
| • | stock options are purchased by third-party financial institutions at a discount to their fair value using option pricing models; |
| • | there is a two-year minimum holding period for sale proceeds. |
| • | Vote AGAINST equity plan proposals if the details of ongoing TSO programs are not provided to shareholders. |
| 8.8 | Employee Stock Purchase Plans |
Qualified Plans
| • | Votes on employee stock purchase plans should be determined on a CASE-BY-CASE basis. |
| • | Votes FOR employee stock purchase plans where all of the following apply: |
| • | purchase price is at least 85% of fair market value; |
B-257
| • | offering period is 27 months or less; and |
| • | the number of shares allocated to the plan is 10% or less of the outstanding shares. |
| • | Votes AGAINST employee stock purchase plans where any of the following apply: |
| • | purchase price is not at least 85% of fair market value; |
| • | offering period is greater than 27 months; and |
| • | the number of shares allocated to the plan is more than 10% of the outstanding shares. |
Non-Qualified Plans
| • | Vote FOR nonqualified employee stock purchase plans with all the following features: |
| • | broad-based participation; |
| • | limits on employee contribution; |
| • | company matching contribution up to 25 percent; |
| • | no discount on the stock price on the date of purchase. |
| 8.9 | Incentive Bonus Plans and Tax Deductibility Proposals (OBRA-Related Compensation Proposals) |
| • | Vote FOR proposals that simply amend shareholder-approved compensation plans to include administrative features or place a cap on the annual grants any one participant may receive to comply with the provisions of Section 162(m). |
| • | Vote FOR proposals to add performance goals to existing compensation plans to comply with the provisions of Section 162(m) unless they are clearly inappropriate. |
| • | Votes to amend existing plans to increase shares reserved and to qualify for favorable tax treatment under the provisions of Section 162(m) should be considered on a CASE-BY-CASE basis using a proprietary, quantitative model developed by RMG. |
| • | Generally vote FOR cash or cash and stock bonus plans that are submitted to shareholders for the purpose of exempting compensation from taxes under the provisions of Section 162(m) if no increase in shares is requested. |
| • | Vote AGAINST proposals if the compensation committee does not fully consist of independent outsiders, as defined in RMG’s definition of director independence. |
| 8.10 | Employee Stock Ownership Plans (ESOPs) |
| • | Vote FOR proposals to implement an ESOP or increase authorized shares for existing ESOPs, unless the number of shares allocated to the ESOP is excessive (more than 5% of outstanding shares). |
| 8.11 | Shareholder Proposal to Submit Executive Compensation to Shareholder Vote |
| • | Vote on a CASE-BY-CASE basis. |
| 8.12 | Advisory Vote on Executive Compensation (Say-on-Pay) Management Proposal |
| • | Evaluate executive pay and practices, as well as certain aspects of outside director compensation, on a CASE-BY-CASE basis. |
B-258
| • | Vote AGAINST management say on pay (MSOP) proposals, AGAINST/WITHHOLD on compensation committee members (or, in rare cases where the full board is deemed responsible, all directors including the CEO), and/or AGAINST an equity-based incentive plan proposal if: |
| • | There is a misalignment between CEO pay and company performance (pay for performance); |
| • | The company maintains problematic pay practices; |
| • | The board exhibits poor communication and responsiveness to shareholders. |
| • | Additional CASE-BY-CASE considerations for the management say on pay (MSOP) proposals: |
| • | Evaluation of performance metrics in short-term and long-term plans, as discussed and explained in the Compensation Discussion & Analysis (CD&A); |
| • | Evaluation of peer group benchmarking used to set target pay or award opportunities; and |
| • | Balance of performance-based versus non-performance-based pay. |
| • | Frequency of Advisory Vote on Executive Compensation (Management “Say on Pay”) |
| • | Vote FOR annual advisory votes on compensation, which provide the most consistent and clear communication channel for shareholder concerns about companies’ executive pay programs. |
| 8.13 | 401(k) Employee Benefit Plans |
| • | Vote FOR proposals to implement a 401(k) savings plan for employees. |
| 8.14 | Shareholder Proposals Regarding Executive and Director Pay |
| • | Generally, vote FOR shareholder proposals seeking additional disclosure of executive and director pay information, provided the information requested is relevant to shareholders’ needs, would not put the company at a competitive disadvantage relative to its industry, and is not unduly burdensome to the company. |
| • | Generally vote FOR shareholder proposals seeking disclosure regarding the company’s, board’s, or committee’s use of compensation consultants, such as company name, business relationship(s) and fees paid. |
| • |
| • | Vote FOR shareholder proposals to put option repricings to a shareholder vote. |
| • | Vote on a CASE-BY-CASE basis for all other shareholder proposals regarding executive and director pay, taking into account company performance, pay level versus peers, pay level versus industry, and long term corporate outlook. |
| 8.15 | Performance-Based Stock Options |
| • | Generally vote FOR shareholder proposals advocating the use of performance-based stock options (indexed, premium-priced, and performance-vested options), unless: |
| • | the proposal is overly restrictive (e.g., it mandates that awards to all employees must be performance-based or all awards to top executives must be a particular type, such as indexed options); or |
B-259
| • | the company demonstrates that it is using a substantial portion of performance-based awards for its top executives. |
| 8.16 | Pay-for-Performance |
| • | Generally vote FOR shareholder proposals that align a significant portion of total compensation of senior executives to company performance. In evaluating the proposals, the following factors will be analyzed: |
| • | What aspects of the company’s short-term and long-term incentive programs are performance-driven? |
| • | Can shareholders assess the correlation between pay and performance based on the company’s disclosure? |
| • | What type of industry does the company belong to? |
| • | Which stage of the business cycle does the company belong to? |
| 8.17 | Pay-for-Superior-Performance Standard |
| • | Generally vote FOR shareholder proposals based on a case-by-case analysis that requests the board establish a pay-for-superior-performance standard in the company’s executive compensation plan for senior executives. |
| 8.18 | Golden Parachutes and Executive Severance Agreements |
| • | Vote FOR shareholder proposals to require golden parachutes or executive severance agreements to be submitted for shareholder ratification, unless the proposal requires shareholder approval prior to entering into employment contracts. |
| • | Vote on a CASE-BY-CASE basis on proposals to ratify or cancel golden parachutes. An acceptable parachute should include the following: |
| • | the parachute should be less attractive than an ongoing employment opportunity with the firm; |
| • | the triggering mechanism should be beyond the control of management; |
| • | the amount should not exceed three times base salary plus guaranteed benefits; and |
| • | change-in-control payments should be double-triggered, i.e., (1) after a change in control has taken place, and (2) termination of the executive as a result of the change in control. Change in control is defined as a change in the company ownership structure. |
| • | Voting on Golden Parachutes in an Acquisition, Merger, Consolidation, or Proposed Sale |
| • | If presented as a separate voting item, OFI will apply the same policy as above. |
| • | In cases where the golden parachute vote is incorporated into a company’s separate advisory vote on compensation (“management say on pay”), OFI will evaluate the “say on pay” proposal in accordance with these guidelines, which may give higher weight to that component of the overall evaluation. |
| 8.19 | Pension Plan Income Accounting |
| • | Generally vote FOR shareholder proposals to exclude pension plan income in the calculation of earnings used in determining executive bonuses/compensation. |
B-260
| 8.20 | Supplemental Executive Retirement Plans (SERPs) |
| • | Generally vote FOR shareholder proposals requesting to put extraordinary benefits contained in SERP agreement to a shareholder vote unless the company’s executive pension plans do not contain excessive benefits beyond what it offered under employee-wide plans. |
| • | Generally vote FOR shareholder proposals requesting to limit the executive benefits provided under the company’s supplemental executive retirement plan (SERP) by limiting covered compensation to a senior executive’s annual salary and excluding all incentive or bonus pay from the plan’s definition of covered compensation used to establish such benefits. |
| 8.21 | Claw-back of Payments under Restatements |
| • | Vote on a CASE-BY-CASE basis on shareholder proposals requesting clawbacks or recoupment of bonuses or equity, considering factors such as: |
| • | the coverage of employees, whether it applies to all employees, senior executives or only employees committing fraud which resulted in the restatement; |
| • | the nature of the proposal where financial restatement is due to fraud; |
| • | whether or not the company has had material financial problems resulting in chronic restatements; and/or |
| • | the adoption of a robust and formal bonus/equity recoupment policy. |
| • | If a company’s bonus recoupment policy provides overly broad discretion to the board in recovering compensation, generally vote FOR the proposal. |
| • | If the proposal seeks bonus recoupment from senior executives or employees committing fraud, generally vote FOR the proposal. |
| 8.22 | Tax Gross-Up Proposals |
| • | Generally vote FOR shareholder proposals calling for companies to adopt a policy of not providing tax gross-up payments, except in limited situations for broadly accepted business practices, such as reasonable relocation or expatriate tax equalization arrangements applicable to substantially all or a class of management employees of the company. |
| 8.23 | Bonus Banking/Bonus Banking “Plus” |
| • | Vote CASE-BY-CASE on proposals seeking deferral of a portion of annual bonus pay, with ultimate payout linked to sustained results for the performance metrics on which the bonus was earned, taking into account the company’s past practices regarding equity and cash compensation, whether the company has a holding period or stock ownership requirements in place, and whether the company has a rigorous claw-back policy in place. |
| 8.24 | Golden Coffins/Executive Death Benefits |
| • | Generally vote FOR proposals calling companies to adopt a policy of obtaining shareholder approval for any future agreements and corporate policies that could oblige the company to make payments or awards following the death of a senior executive in the form of unearned salary or bonuses, accelerated vesting or the continuation in force of unvested equity grants, perquisites and other payments or awards made in lieu of compensation. This would not apply to any benefit programs or equity plan proposals that the broad-based employee population is eligible. |
B-261
| 8.25 | Eliminate Accelerated Vesting of Unvested Equity |
| • | Generally vote FOR proposals seeking a policy that prohibits acceleration of the vesting of equity wards to senior executives in the event of a change in control (except for pro rata vesting considering the time elapsed and attainment of any related performance goals between the award date and the change in control). |
| 9.0 | SOCIAL, POLITICAL AND ENVIRONMENTAL ISSUES |
In the case of social, political and environmental responsibility issues, OFI will generally ABSTAIN where there could be a detrimental impact on share value or where the perceived value if the proposal was adopted is unclear or unsubstantiated.
| • | OFI will only vote “FOR” a proposal that would clearly: |
| • | have a discernable positive impact on short-term or long-term share value; or |
| • | have a presently indiscernible impact on short or long-term share value but promotes general long-term interests of the company and its shareholders, such as: |
| • | prudent business practices which support the long-term sustainability of natural resources within the company’s business lines, including reasonable disclosure on environmental policy issues that are particularly relevant to the company’s business; |
| • | reasonable and necessary measures to mitigate business operations from having disproportionately adverse impacts on the environment, absent which could potentially lead to onerous government sanctions, restrictions, or taxation regimes, major customer backlash, or other significant negative ramifications. |
In the evaluation of social, political, and environmental proposals, the following factors may be considered:
| • | what percentage of sales, assets and earnings will be affected; |
| • | the degree to which the company’s stated position on the issues could affect its reputation or sales, leave it vulnerable to boycott, selective purchasing, government sanctions, viable class action or shareholder derivative lawsuits; |
| • | whether the issues presented should be dealt with through government or company-specific action; |
| • | whether the company has already responded in some appropriate manner to the request embodied in the proposal; |
| • | whether the company’s analysis and voting recommendation to shareholders is persuasive; |
| • | what other companies have done in response to the issue; |
| • | whether the proposal itself is well framed and reasonable; |
| • | whether implementation of the proposal would achieve the objectives sought in the proposal; |
| • | whether the subject of the proposal is best left to the discretion of the board; |
| • | whether the requested information is available to shareholders either from the company or from a publicly available source; and |
| • | whether providing this information would reveal proprietary or confidential information that would place the company at a competitive disadvantage. |
OPPENHEIMER FUNDS INTERNATIONAL POLICY GUIDELINES
These international voting guidelines shall apply in non-US markets only as a supplement to the general OFI voting guidelines. The general guidelines shall be applied to the greatest extent possible in non-US markets,
B-262
taking into account best market practice, with the overall goal of maximizing the primary principles of board accountability and independence and protection of shareholder rights. In cases where the international guidelines and the primary guidelines conflict, the international guidelines shall take precedence for non-US market proposals. If the international guidelines do not cover the subject matter of a non-US market proposal, the primary guidelines should be followed.
Companies in several non-US markets routinely disclose shareholder vote results. In cases where a management proposal receives a significant level of opposition, OFI will evaluate how the company has responded to that opposition and may vote AGAINST future relevant resolutions in certain circumstances where OFI determines the company has not adequately addressed the concerns or responded to the shareholder opposition.
| 1.0 | OPERATIONAL ITEMS |
| 1.1.1 | Routine Items |
| • | Vote FOR proposals to Open Meeting, Close Meeting, Allow Questions, Elect Chairman of Meeting, Prepare and Approve List of Shareholders, Acknowledge Proper Convening of Meeting, and other routine procedural proposals. |
| 1.1.2 | Financial Results/Director and Auditor Reports |
| • | Vote FOR approval of financial statements and director and auditor reports, unless: |
| • | there are material concerns about the financials presented or audit procedures used; |
| • | the company is not responsive to shareholder questions about specific items that should be publicly disclosed; |
| • | other significant corporate governance concerns exist at the company. |
| 1.1.3 | Allocation of Income and Dividends |
| • | Vote FOR approval of allocation of income and distribution of dividends, unless: |
| • | the dividend payout ratio has been consistently below 30% without an adequate explanation; or |
| • | the payout ratio is excessive given the company’s financial position. |
| 1.1.4 | Stock (Scrip) Dividend Alternative |
| • | Vote FOR reasonable stock (scrip) dividend proposals that allow for cash options. |
| • | Vote AGAINST proposals that do not allow for a cash option unless management demonstrates that the cash option is harmful to shareholder value. |
| 1.1.5 | Lower Disclosure Threshold for Stock Ownership |
| • | Vote AGAINST resolutions to lower the stock ownership disclosure threshold below 5% unless compelling reasons exist to implement a lower threshold. |
| 1.1.6 | Controlling Shareholder / Personal Interest |
| • | Generally vote AGAINST proposals requesting shareholders to indicate whether they are a controlling shareholder, as defined by statute, or possess a personal interest in any resolutions on the agenda, unless such an affiliation or interest has been identified. |
B-263
| 1.1.7 | Designate Independent Proxy |
| • | Generally vote FOR proposals to designate an independent proxy unless compelling reasons exist to oppose. |
AUDITORS
| 1.2 | Appointment of Internal Statutory Auditors |
| • | Vote FOR the appointment and reelection of statutory auditors, unless: |
| • | there are serious concerns about the statutory reports presented or the audit procedures used; |
| • | questions exist concerning any of the statutory auditors being appointed; or |
| • | the auditors have previously served the company is an executive capacity or can otherwise be considered affiliated with the company. |
| 1.3 | Remuneration of Auditors |
| • | Vote FOR proposals to authorize the board to determine the remuneration of auditors, unless there is evidence of excessive compensation relative to the size and nature of the company or the scope of the services provided. |
| 1.4 | Indemnification of Auditors |
| • | Vote AGAINST proposals to indemnify auditors. |
| 1.5 | Remuneration of Internal Statutory Auditors |
| • | Generally vote FOR proposals to fix the remuneration of internal statutory auditors, taking into consideration the proposed remuneration relative to peers, justifications for any proposed increase, and the presence of any concerns with regard to statutory reports or audit procedures used. |
| 2.0 | THE BOARD OF DIRECTORS |
| 2.1 | Discharge of Board and Management |
| • | Vote FOR discharge from responsibility of the board and management, unless: |
| • | there are serious questions about actions of the board or management for the year in questions, including reservations from auditors; or |
| • | material legal or regulatory action is being taken against the company or the board by shareholders or regulators. |
| 2.2 | Voting on Director Nominees |
| • | Vote on director nominees should be made on a CASE-BY-CASE basis, taking into account company practices, corporate governance codes, disclosure, and best practices, examining factors such as: |
| • | Composition of the board and key board committees; |
| • | Long-term company performance relative to a market index; |
B-264
| • | Corporate governance provisions and takeover activity; and |
| • | Company practices and corporate governance codes. |
| • | There are some actions by directors that should result in votes being WITHHELD/AGAINST (whichever vote option is applicable on the ballot). Such instances generally fall into the following categories: |
| • | The board fails to meet minimum corporate governance standards; |
| • | Adequate disclosure has not been provided in a timely manner; |
| • | There are clear concerns over questionable finances or restatements; |
| • | There have been questionable transactions with conflicts of interest; |
| • | There are any records of abuses against minority shareholder interests; |
| • | There are specific concerns about the individual, such as criminal wrongdoing or breach of fiduciary responsibilities; |
| • | Material failures of governance, stewardship, risk oversight, or fiduciary responsibilities at the company; |
| • | Failure to replace management as appropriate; or |
| • | Egregious actions related to the director(s)’ service on other boards that raise substantial doubt about his or her ability to effectively oversee management and serve the best interests of shareholders at any company. |
| 3.0 | ANTITAKEOVER DEFENSES AND VOTING RELATED ISSUES |
| 3.1 | Poison Pills |
| • | Votes on poison pills or shareholder rights plans, are determined on a CASE-BY-CASE basis. A plan is supportable if its scope is limited to the following two purposes and it conforms to ‘new generation’ rights plan guidelines: |
| • | to give the board more time to find an alternative value enhancing transaction; and |
| • | to ensure the equal treatment of shareholders. |
| • | Vote AGAINST plans that go beyond this purpose by giving discretion to the board to either: |
| • | determine whether actions by shareholders constitute a change in control; |
| • | amend material provisions without shareholder approval; |
| • | interpret other provisions; |
| • | redeem the plan without a shareholder vote; or |
| • | prevent a bid from going to shareholders. |
| • | Vote AGAINST plans that have any of the following characteristics: |
| • | unacceptable key definitions; |
| • | flip-over provision; |
| • | permitted bid period greater than 60 days; |
| • | maximum triggering threshold set at less than 20% of outstanding shares; |
| • | does not permit partial bids; |
B-265
| • | bidder must frequently update holdings; |
| • | requirement for a shareholder meeting to approve a bid; or |
| • | requirement that the bidder provide evidence of financing. |
| • | In addition to the above, a plan must include: |
| • | an exemption for a “permitted lock up agreement”; |
| • | clear exemptions for money managers, pension funds, mutual funds, trustees and custodians who are not making a takeover bid; and |
| • | exclude reference to voting agreements among shareholders. |
| 3.2 | Renew Partial Takeover Provision |
| • | Vote FOR proposals to renew partial takeover provision. |
| 3.3 | Depositary Receipts and Priority Shares |
| • | Vote on a CASE-BY-CASE basis on the introduction of depositary receipts. |
| • | Vote AGAINST the introduction of priority shares. |
| 3.4 | Issuance of Free Warrants |
| • | Vote AGAINST the issuance of free warrants. |
| 3.5 | Defensive Use of Share Issuances |
| • | Vote AGAINST management requests to issue shares in the event of a takeover offer or exchange bid for the company’s shares. |
| 4.0 | Mergers and Corporate Restructurings |
| 4.1 | Mandatory Takeover Bid Waivers |
| • | Vote proposals to waive mandatory takeover bid requirements on a CASE-BY-CASE basis. |
| 4.2 | Related-Party Transactions |
| • | In evaluating resolutions that seek shareholder approval on related-party transactions (RPTs), vote on a CASE-BY-CASE basis, considering factors including, but not limited to, the parties, assets, and pricing of the transactions. |
| 4.3 | Expansion of Business Activities |
| • | Vote favorable expansion of business lines WITH MANAGEMENT unless the proposed new business takes the company into endeavors that are not justified from a shareholder risk/reward perspective. If the risk/reward is unclear, vote on a CASE-BY-CASE basis. |
| 4.4 | Independent Appraisals |
| • | Generally vote FOR proposals to appoint independent appraisal firms and approve associated appraisal reports, unless there are compelling reasons to oppose the proposal. |
B-266
| 5.0 | CAPITAL STRUCTURE |
| 5.1 | Pledge of Assets for Debt |
| • | OFI will consider these proposals on a CASE-BY-CASE basis. Generally, OFI will support increasing the debt-to-equity ratio to 100%. Any increase beyond 100% will require further assessment, with a comparison of the company to its industry peers or country of origin. |
In certain foreign markets, such as France, Latin America and India, companies often propose to pledge assets for debt, or seek to issue bonds which increase debt-to-equity ratios up to 300%.
| 5.2 | Increase in Authorized Capital |
| • | Vote FOR nonspecific proposals to increase authorized capital up to 100% over the current authorization, unless the increase would leave the company with less than 30% of its new authorization outstanding. |
| • | Vote FOR specific proposals to increase authorized capital to any amount, unless: |
| • | the specific purpose of the increase (such as a share-based acquisition or merger) does not meet OFI guidelines for the purpose being proposed; or |
| • | the increase would leave the company with less than 30% of its new authorization outstanding after adjusting for all proposed issuances. |
| • | Vote AGAINST proposals to adopt unlimited capital authorization. |
| 5.3 | Share Issuance Requests |
General issuance requests under both authorized and conditional capital systems allow companies to issue shares to raise funds for general financing purposes. Issuances can be carried out with or without preemptive rights. Corporate law in many countries recognizes preemptive rights and requires shareholder approval for the disapplication of such rights.
| • | Vote FOR issuance requests with preemptive rights to a maximum of 100%* over currently issued capital. |
| • | Vote FOR issuance requests without preemptive rights to a maximum of 20%* of currently issued capital. |
| • | The potential use of issuances for antitakeover purposes will be evaluated on a case-by-case basis. |
| * | In the absence of a best practice recommendation on volume of shares to be issued, apply the above guidelines. In markets where the best practice recommends, or where company practice necessitates it (e.g. France, UK, and Hong Kong), the stricter guideline(s) will be applied. |
| 5.4 | Reduction of Capital |
| • | Vote FOR proposals to reduce capital for routine accounting purposes unless the terms are unfavorable to shareholders. Examples of routine capital reduction proposals found overseas include: |
| • | reduction in the stated capital of the company’s common shares to effect a reduction in a company’s deficit and create a contributed surplus. If net assets are in danger of falling below the aggregate of a company’s liabilities and stated capital, some corporate law statutes prohibit the company from paying dividends on its shares. |
B-267
| • | Reduction in connection with a previous buyback authorization, as typically seen in Scandinavia, Japan, Spain, and some Latin American markets. In most instances, the amount of equity that may be cancelled is usually limited to 10% by national law. |
| • | Vote proposals to reduce capital in connection with corporate restructuring on a CASE-BY-CASE basis, considering individual merits of each request. |
| 5.5 | Convertible Debt Issuance Requests |
| • | Vote FOR the creation/issuance of convertible debt instruments as long as the maximum number of common shares that could be issued upon conversion meets the above guidelines on equity issuance requests. |
| 5.6 | Debt Issuance Requests (Non-convertible) |
When evaluating a debt issuance request, the issuing company’s present financial situation is examined. The main factor for analysis is the company’s current debt-to-equity ratio, or gearing level. A high gearing level may incline markets and financial analysts to downgrade the company’s bond rating, increasing its investment risk factor in the process. A gearing level up to 100% is considered acceptable.
| • | Vote FOR debt issuances for companies when the gearing level is between zero and 100%. |
| • | Proposals involving the issuance of debt that result in the gearing level being greater than 100% are considered on a CASE-BY-CASE basis. Any proposed debt issuance is compared to industry and market standards. |
| 5.7 | Reissuance of Shares Repurchased |
| • | Vote FOR requests to reissue any repurchased shares unless there is clear evidence of abuse of this authority in the recent past. |
| 5.8 | Capitalization of Reserves for Bonus Issues/Increase in Par Value |
| • | Vote FOR requests to capitalize reserves for bonus issues of shares or to increase par value. |
| 5.9 | Control and Profit Agreements/Affiliation Agreements with Subsidiaries |
| • | Vote FOR management proposals to approve parent-subsidiary affiliation agreements including, but not limited to control and profit transfer agreements, unless there are compelling reasons to oppose the proposal. |
| 5.10 | Acceptance of Deposits |
| • | Generally vote AGAINST proposals to accept deposits from shareholders and/or the public, taking into consideration the terms or conditions of the deposit as well as the company’s rationale for additional funding. |
| 6.0 | EXECUTIVE AND DIRECTOR COMPENSATION |
| 6.1 | Director Remuneration |
| • | Vote FOR proposals to award cash fees to non-executive directors, unless the amounts are excessive relative to other companies in the country or industry. |
B-268
| • | Vote non-executive director compensation proposals that include both cash and share-based components on a CASE-BY-CASE basis. |
| • | Vote proposals that bundle compensation for both non-executive and executive directors into a single resolution on a CASE-BY-CASE basis. |
| • | Vote AGAINST proposals to introduce retirement benefits for non-executive directors. |
| 6.2 | Retirement Bonuses for Directors and Statutory Auditors |
| • | Vote AGAINST the payment of retirement bonuses to directors and statutory auditors when one or more of the individuals to whom the grants are being proposed has not served in an executive capacity for the company or where one or more of the individuals to whom the grants are being proposed has not served in their current role with the company for the last five consecutive years. |
| • | Vote AGAINST the payment of retirement bonuses to any directors or statutory auditors who have been designated by the company as independent. |
| 6.2 | Executive Remuneration Report or Policy |
| • | Vote AGAINST such proposals in cases where: |
| • | The company does not provide shareholders with clear, comprehensive compensation disclosures; |
| • | The company does not maintain an appropriate pay-for-performance alignment and there is not an emphasis on long-term shareholder value; |
| • | The arrangement creates the risk of a “pay for failure” scenario; |
| • | The company does not maintain an independent and effective compensation committee; |
| • | The company provides inappropriate pay to non-executive directors; or |
| • | The company maintains other problematic pay practices. |
B-269
SANDS CAPITAL MANAGEMENT, LLC
PROXY VOTING POLICY AND PROCEDURES
Most Recent Amendment: March 2015
Implementation Date: November 2006
Issue
Rule 206(4)-6 under the Advisers Act requires every registered investment adviser to adopt and implement written policies and procedures, reasonably designed to ensure that the adviser votes proxies in the best interest of its clients. The procedures must address material conflicts that may arise in connection with proxy voting. The Rule further requires the adviser to provide a concise summary of the adviser’s proxy voting process and offer to provide copies of the complete proxy voting policy and procedures to clients upon request. Lastly, the Rule requires that the adviser disclose to clients how they may obtain information on how the adviser voted their proxies.
Sands Capital Management, LLC (“SCM”) votes proxies for a significant number of its clients, and therefore has adopted and implemented this Proxy Voting Policy and Procedures.
Policy
It is the policy of SCM to vote client proxies in the best interest of our clients. Proxies are an asset of a client account, which should be treated by SCM with the same care, diligence, and loyalty as any asset belonging to a client. Consideration will be given to both the short and long term implications of each proposal to be voted on. In voting proxies, we typically are neither an activist in corporate governance nor an automatic supporter of management. However, because SCM believes that the management teams of most companies it invests in generally seek to serve shareholder interests, SCM believes that voting proxy proposals in the client’s best economic interests usually means voting with the recommendations of these management teams. Any specific voting instructions provided by an advisory client or its designated agent in writing will supersede this policy. Clients with their own general or specific proxy voting and governance policies may wish to have their proxies voted by an independent third party or other named fiduciary or agent, at the client’s expense.
Proxy Committee
SCM has established a Proxy Committee. The Proxy Committee consists of two permanent members, the Chief Administrative Officer (“CAO”) and Chief Compliance Officer (“CCO”), and one or more rotating members from the Investment Research Team (“Research Team”). The Proxy Committee meets at least annually and as necessary to fulfill its responsibilities. A majority of the members of the Proxy Committee constitutes a quorum for the transaction of business. The CAO acts as secretary of the Proxy Committee and maintains a record of Proxy Committee meetings and actions.
The Proxy Committee is responsible for (i) the oversight and administration of proxy voting on behalf of SCM’s clients, including developing, authorizing, implementing and updating this Proxy Voting Policy and Procedures; (ii) overseeing the proxy voting process; and (iii) engaging and overseeing any third-party service provider as voting agent to receive proxy statements and/or to provide information, research or other services intended to facilitate the proxy voting decisions made by SCM. The Proxy Committee reviews reports on SCM’s proxy voting activity at least annually, and as necessary, to fulfill its responsibilities.
The Proxy Committee has developed a set of criteria for evaluating proxy issues. These criteria and general voting guidelines are set forth in SCM’s Proxy Voting Guidelines (the “Guidelines”), a copy of which is attached hereto as Attachment A. The Proxy Committee may amend or supplement the Guidelines from time to time. All Guidelines are to be applied generally and not absolutely, such that the evaluation of each proposal will be performed in the context of the Guidelines giving appropriate consideration to the circumstances of the company whose proxy is being voted.
B-270
Procedures for Identification and Voting of Proxies
The following procedures are designed to enable SCM to resolve material conflicts of interest before voting client proxies.
| 1. | SCM maintains a list of all clients for which it votes proxies. The list may be maintained either in hard copy or electronically, and is updated by the Portfolio Administration Team who obtains proxy voting information from client agreements or internal account onboarding documentation. |
| 2. | As part of the account opening procedure, the Portfolio Administration Team will note whether or not SCM is responsible for voting proxies for the new client. |
| 3. | In cases where it has been designated to vote client proxies, SCM, through its Portfolio Administration and Client Service Teams, will work with the client to ensure that SCM is the designated party to receive proxy voting materials from companies or intermediaries. |
| 4. | The CAO, through a proxy voting designee working as a proxy administrator, receives all proxy voting materials and has overall responsibility for ensuring that proxies are voted and submitted in a timely manner. |
| 5. | SCM’s Research Team is responsible for reviewing proxy proposals for portfolio securities. Prior to a proxy voting deadline, the appropriate Research Team member will make a determination as how to vote each proxy proposal based on his or her analysis of the proposal and the Guidelines. In evaluating a proxy proposal, a Research Team member may consider information from a number of sources, including management of the company, shareholder groups and independent proxy research services. |
| 6. | SCM Staff Members will reasonably try to assess whether there are any material conflicts between SCM’s interests and those of its clients with respect to proxy voting by considering the situations identified in the Conflicts of Interest section of this document. |
| 7. | So long as no material conflicts of interest have been identified, SCM will vote proxies according to SCM’s policy. SCM may also elect not to vote if it deems doing so in its clients’ best interest. (See #8 and Proxies of Certain Non-U.S. Issuers below.) The rationale for not voting a client proxy will be documented and the documentation will be maintained in SCM’s permanent files. |
| 8. | Upon detection of a conflict of interest, the conflict will be brought to the attention of the Proxy Committee for resolution. See Conflicts of Interest section for additional information. |
| 9. | SCM is not required to vote every client proxy provided that electing not to vote is consistent with SCM’s fiduciary obligations. SCM shall at no time ignore or neglect its proxy voting responsibilities. However, there may be times when refraining from voting is in the client’s best interest, such as when an analysis of a particular client proxy reveals that the cost of voting the proxy may exceed the expected benefit to the client. See Proxies of Certain Non-U.S. Issuers below. |
| 10. | SCM may process certain proxies without voting them or may systematically vote with management. Examples include, without limitation, proxies issued by companies SCM has decided to sell, proxies issued for securities that SCM did not select for a client portfolio, such as, securities that were selected by a previous adviser, unsupervised or non-managed securities held in a client’s custody account, money market securities, or other securities selected by clients or their representatives other than SCM. |
| 11. | In the event that SCM votes the same proxy in two directions, it shall maintain documentation to support its voting (this may occur if a client requires SCM to vote a certain way on an issue, while SCM deems it beneficial to vote in the opposite direction for its other clients) in SCM’s permanent files. |
| 12. | The CAO and the Research Team member will report any attempts by SCM’s personnel to influence the voting of client proxies in a manner that is inconsistent with SCM’s policy, as well as any attempts by persons or entities outside SCM seeking to influence the voting of client proxies. Such report shall be made to SCM’s CCO, or if the CCO is the person attempting to influence the voting, then to SCM’s General Counsel. |
B-271
| 13. | All proxy votes will be recorded and the following information will be maintained: |
| · | The name of the issuer of the portfolio security; |
| · | The exchange ticker symbol of the portfolio security; |
| · | The Council on Uniform Securities Identification Procedures (“CUSIP”) number for the portfolio security; |
| · | The shareholder meeting date; |
| · | The number of shares SCM is voting firm-wide; |
| · | A brief identification of the matter voted on; |
| · | Whether the matter was proposed by the issuer or by a security holder; |
| · | Whether or not SCM cast its vote on the matter; |
| · | How SCM cast its vote (e.g., for or against proposal, or abstain; for or withhold regarding election of directors); |
| · | Whether SCM cast its vote with or against management; and |
| · | Whether any client requested an alternative vote of its proxy. |
Loaned Securities
When an SCM client participates in a securities lending program, SCM will not be able to vote the proxy of the shares out on loan. SCM will generally not seek to recall for voting the client shares on loan. However, under rare circumstances, for voting issues that may have a particularly significant impact on the investment, SCM may request a client to recall securities that are on loan if we determine that the benefit of voting outweighs the costs and lost revenue to the client and the administrative burden of retrieving the securities. The Research Team member who is responsible for voting the proxy will notify the Proxy Committee in the event they believe a recall of loaned securities is necessary.
In determining whether a recall of a security is warranted (“Significant Event”), SCM will take into consideration whether the benefit of the vote would be in the client’s best interest despite the costs and the lost revenue to the client and the administrative burden of retrieving the securities. SCM may utilize third-party service providers to assist it in identifying and evaluating whether an event constitutes a Significant Event. The Proxy Committee will review the proxy proposals that have been determined to be Significant Events from time to time and will adjust the foregoing standard as it deems necessary.
Proxies of Certain Non-U.S. Issuers
It is SCM’s policy to seek to vote all proxies for securities held in client accounts for which we have proxy voting authority where SCM can reasonably determine that voting such proxies will be in the best interest of its clients.
Voting proxies of issuers in non-US markets may give rise to a number of administrative/operational issues that may cause SCM to determine that voting such proxies are not in the best interest of its clients or that it is not reasonably possible to determine whether voting such proxies will be in the best interests of its clients. While not exhaustive, the following list of considerations highlights some potential instances in which a proxy vote might not be entered.
| · | SCM may receive meeting notices without enough time to fully consider the proxy or after the cut-off date for voting. |
B-272
| · | Some markets require SCM to provide local agents with a power of attorney or consularization prior to implementing SCM’s voting instructions. |
| · | Proxy material may not be available in English. |
| · | SCM may be unable to enter an informed vote in certain circumstances due to the lack of information provided in the proxy statement or by the issuer or other resolution sponsor, and may not vote in those instances. |
| · | Proxy voting in certain countries requires “share blocking.” Shareholders wishing to vote their proxies must deposit their shares shortly before the date of the meeting with a designated depositary. During this blocking period, shares that will be voted at the meeting cannot be sold until the meeting has taken place and the shares are returned to the clients’ custodian banks. Absent compelling reasons to the contrary, SCM believes that the benefit to the client of exercising the vote is outweighed by the cost of voting (i.e., not being able to sell the shares during this period). Accordingly, if share blocking is required SCM generally elects not to vote those shares. The Research Team member in conjunction with the Proxy Committee retains the final authority to determine whether to block the shares in the client’s portfolio or to pass on voting the meeting. |
Conflicts of Interest
Although SCM has not currently identified any material conflicts of interest that would affect its proxy voting decisions, it is aware of the following potential conflicts that could exist in the future:
| · | Conflict: SCM is retained by a firm, or is in the process of being retained by a firm, which is affiliated with an issuer that is held in SCM’s client portfolios; |
| · | Conflict: SCM is retained by an individual, or is in the process of being retained by an individual, who is an officer or director of an issuer that is held in SCM’s client portfolios; |
| · | Conflict: SCM’s Staff Members maintain a personal and/or business relationship (not an advisory relationship) with issuers or individuals that serve as officers or directors of issuers. For example, the spouse of an SCM Staff Member may be a high-level executive of an issuer that is held in SCM’s client portfolios. The spouse could attempt to influence SCM to vote in favor of management; and |
| · | Conflict: SCM or a Staff Member(s) personally owns a significant number of an issuer’s securities that are also held in SCM’s client portfolios. The Staff Member(s) may seek to vote proxies in a different direction for his/her personal holdings than would otherwise be warranted by SCM’s policy. The Staff Member(s) could oppose voting the proxies according to the policy and successfully influence SCM to vote proxies in contradiction to the policy. |
Resolution:
SCM realizes that, due to the difficulty of predicting and identifying all material conflicts, it must rely on its Staff Members to notify the CAO and/or the CCO of any material conflict that may impair SCM’s ability to vote proxies in an objective manner. Upon such notification, the CAO and/or the CCO will notify the Proxy Committee of the conflict.
In the event that the Proxy Committee determines that SCM has a conflict of interest with respect to a proxy proposal, the Proxy Committee shall also determine whether the conflict is “material” to that proposal. The Proxy Committee may determine on a case-by-case basis that a particular proposal does not involve a material conflict of interest. To make this determination, the Proxy Committee must conclude that the proposal is not directly related to SCM’s conflict with the issuer. If the Proxy Committee determines that a conflict is not material, then SCM may vote the proxy in accordance with the recommendation of the Research Team member.
B-273
In the event that the Proxy Committee determines that SCM has a material conflict of interest with respect to a proxy proposal, SCM will vote on the proposal in accordance with the determination of the Proxy Committee. Prior to voting on the proposal, SCM may (i) contact an independent third party (such as another plan fiduciary) to recommend how to vote on the proposal and vote in accordance with the recommendation of such third party (or have the third party vote such proxy); or (ii) with respect to client accounts that are not subject to ERISA, fully disclose the nature of the conflict to the client and obtain the client’s consent as to how SCM will vote on the proposal (or otherwise obtain instructions from the client as to how to vote the proxy).
Recordkeeping
SCM must maintain the documentation described in the following section for a period of not less than five (5) years in an easily accessible place, the first two (2) years at its principal place of business. The CAO will be responsible for the following procedures and for ensuring that the required documentation is retained.
Client request to review proxy votes:
| · | Any request, whether written (including e-mail) or oral, received by any Staff Member of SCM, must be promptly reported to the CAO. All written requests must be retained in the permanent file. |
| · | The CAO or designee will record the identity of the client, the date of the request, and the disposition (e.g., provided a written or oral response to client’s request, referred to third party, not a proxy voting client, other dispositions, etc.) in a suitable place. |
| · | Clients are permitted to request the proxy voting record for the 5-year period prior to their request. |
Proxy statements received regarding client securities:
| · | Upon receipt of a proxy, copy or print a sample of the proxy statement or card and maintain the copy in a central file along with a sample of the proxy solicitation instructions. |
Note: SCM is permitted to rely on proxy statements filed on the SEC’s EDGAR system instead of keeping its own copies.
Proxy voting records:
| · | Documents prepared or created by SCM that were material to making a decision on how to vote, or that memorialized the basis for the decision. |
| · | Documentation or notes or any communications received from third parties, other industry analysts, third-party service providers, company’s management discussions, etc. that were material in the basis for the decision. |
Disclosure
| · | SCM will ensure that Part 2A of Form ADV is updated as necessary to reflect: (i) all material changes to the Proxy Voting Policy and Procedures; and (ii) information about how clients may obtain information on how SCM voted their securities. |
Proxy Solicitation
As a matter of practice, it is SCM’s policy to not reveal or disclose to any outside third party how SCM may have voted (or intends to vote) on a particular proxy until after such proxies have been counted at a shareholder’s meeting.
B-274
The CAO is to be promptly informed of the receipt of any solicitation from any person to vote proxies on behalf of clients. At no time may any Staff Member accept any remuneration in the solicitation of proxies. The CAO or a designee shall handle all responses to such solicitations.
Procedures for SCM’s Receipt of Class Actions
The following procedures outline SCM’s receipt of “Class Action” documents from clients and custodians:
SCM will not file “Class Actions” on behalf of any client. If “Class Action” documents are received by SCM from a client’s custodian, SCM will make a best effort to forward the documents to the client. Likewise if “Class Action” documents are received by SCM from a client, SCM will make a best effort to gather, at the client’s request, any requisite information it has regarding the matter and forward it to the client, to enable the client to file the “Class Action.”
Responsibility
The CAO is responsible for overseeing and implementing this Proxy Voting Policy and Procedures.
B-275
Attachment A
PROXY VOTING GUIDELINES
One of the primary factors SCM considers when determining the desirability of investing in a particular company is the quality and depth of its management. Accordingly, SCM believes that the recommendation of management on any issue should be given substantial weight in determining how proxy issues are resolved. As a matter of practice, SCM will vote on most issues presented in a portfolio company proxy statement in accordance with the position of the company’s management, unless SCM determines that voting in accordance with management’s recommendation would adversely affect the investment merits of owning the stock. However, SCM will consider each issue on its own merits, and will not support the position of the company’s management in any situation where, in SCM’s judgment, it would not be in the best interests of the client to do so.
I. The Board of Directors
| A. | Voting on Director Nominees in Uncontested Elections |
Votes on director nominees are made on a case-by-case basis, and may consider the following factors:
| · | Long-term corporate performance record relative to a market index; |
| · | Composition of board and key board committees; |
| · | Corporate governance provisions and takeover activity; |
| · | Board decisions regarding executive pay; and |
| · | Director compensation. |
| B. | Director and Officer Indemnification and Liability Protection |
Proposals concerning director and officer indemnification and liability protection are evaluated on a case-by-case basis.
| C. | Voting for Director Nominees in Contest Elections |
Votes in a contested election of directors are evaluated on a case-by-case basis, and may consider the following factors:
| · | Long-term financial performance of the target company relative to its industry; |
| · | Management’s track record; |
| · | Background to the proxy contest; |
| · | Qualifications of director nominees (both slates); |
| · | Evaluation of what each side is offering shareholders as well as the likelihood that the proposed objectives and goals can be met; and |
| · | Stock ownership positions. |
| D. | Size of the Board |
Proposals to limit the size of the Board should be evaluated on a case-by-case basis.
B-276
II. Auditors
Ratifying Auditors
We generally vote for proposals to ratify auditors, unless: an auditor has a financial interest in or association with the company, and is therefore not independent; or there is reason to believe that the independent auditor has rendered an opinion which is neither accurate nor indicative of the company’s financial position.
III. Proxy Contest Defenses
Cumulative Voting
We vote against proposals to eliminate cumulative voting.
We vote for proposals to permit cumulative voting.
IV. Anti-Takeover Issues
We generally oppose anti-takeover measures because they reduce shareholder rights. However, as with all proxy issues, we conduct an independent review of each anti-takeover proposal. On occasion, we may vote with management when it is concluded that the proposal is not onerous and would not harm clients’ interests as shareholders. Anti-takeover issues include the following:
| A. | Poison Pills |
The “poison pill” entitles shareholders to purchase certain securities at discount prices in the event of a change in corporate control. Such a measure would make a potential takeover prohibitively expensive to the acquirer.
We review on a case-by-case basis management proposals to ratify a poison pill.
| B. | Fair Price Provisions |
Fair price provisions attempt to ensure approximately equal treatment for all shareholders in the event of a full-scale takeover. Typically, such a provision requires would-be acquirers that have established threshold positions in target companies at given per-share prices to pay at least as much if they opt for complete control, unless certain conditions are met.
We vote for fair price proposals, as long as the shareholder vote requirement embedded in the provision is no more than a majority of disinterested shares.
We vote for shareholder proposals to lower the shareholder vote requirement in existing fair price provisions.
| C. | Greenmail |
Proposals relating to the prohibition of “greenmail” are designed to disallow the repurchase of stock from a person or group owning 5% or more of the company’s common stock, unless approved by the disinterested holders of two-thirds or more of the outstanding stock. They could also prevent the company from repurchasing any class of stock at a price more than 5% above the current fair market price, unless an offer is made to all shareholders.
B-277
We vote for proposals to adopt anti-greenmail charter or bylaw amendments or otherwise restrict a company’s ability to make greenmail payments.
We review on a case-by-case basis anti-greenmail proposals when they are bundled with other charter or bylaw amendments.
| D. | Superstock |
Another takeover defense is superstock, i.e., shares that give holders disproportionate voting rights. For example, one company proposed authorizing a class of preferred stock which “could be issued in a private placement with one or more institutional investors” and “could be designated as having voting rights which might dilute or limit the present voting rights of the holders of common stock….” The purpose of this additional class of stock would be to give insiders an edge in fending off an unsolicited or hostile takeover attempt.
We will review on case-by-case basis proposals that would authorize the creation of new classes of “superstock.”
| E. | Supermajority Rules |
Supermajority provisions require approval by holders of minimum amounts of the common shares (usually 75% to 80%). While applied mainly to merger bids, supermajority rules also may be extended to cover substantive transfers of corporate assets, liquidations, reverse splits and removal of directors for reasons other than cause. A supermajority provision would make it nearly impossible in some cases for shareholders to benefit from a takeover attempt.
1. Supermajority Shareholder Vote Requirement to Approve Mergers
We vote against management proposals to require a supermajority shareholder vote to approve mergers and other significant business combinations.
We vote for shareholder proposals to lower supermajority shareholder vote requirements for mergers and other significant business combinations.
2. Supermajority Shareholder Vote Requirement to Amend the Charter or Bylaws
We vote against management proposals to require a supermajority shareholder vote to approve charter and bylaw amendments.
We vote for shareholder proposals to lower supermajority shareholder vote requirements for charter and bylaw amendments.
| F. | Board Classification |
High on the agenda of defense-minded corporate executives are staggered terms for directors, whereby only some (typically one-third) of the directors are elected each year. The “staggered board” acts as a bar to unwelcome takeover bids. An aggressive, affluent acquirer would need two years to gain a working majority of directors at a company whose board members are elected to staggered three-year terms of office.
We vote against proposals to classify the board.
We vote for proposals to repeal classified boards and elect all directors annually.
B-278
IV. Miscellaneous Governance Provision
Bundled Proposals
We review on a case-by-case basis bundled or “conditioned” proxy proposals. In this case where items are conditioned upon each other, we examine the benefits and costs of the packages items. In instances when the joint effect of the conditioned items is not in shareholder’s best interests, we vote against the proposals. If the combined effect is positive, we support such proposals.
V. Capital Structure
| A. | Common Stock Authorization |
We review on a case-by-case basis proposals to increase the number of shares of common stock authorized for issue.
| B. | Debt Restructuring |
We review on a case-by-case basis proposals to increase common and/or preferred shares and to issue shares as part of a debt restructuring plan.
VI. Executive and Director Compensation
In general, we vote on a case-by-case basis on executive and director compensation plans, including stock option plans, with the view that viable compensation programs reward the creation of stockholder wealth.
VII. State of Incorporation
| A. | Voting on State Takeover Statutes |
We review on a case-by-case basis proposals to opt in or out of state takeover statutes (including control share acquisition statutes, control share cash-out statutes, freeze-out provisions, fair price provisions, stakeholder laws, poison pill endorsements, severance pay and labor contract provisions, anti-greenmail provisions and disgorgement provisions).
| B. | Voting on Reincorporation Proposals |
Proposals to change a company’s state of incorporation are examined on a case-by-case basis.
VIII. Mergers and Corporate Restructurings
| A. | Mergers and Acquisitions |
Votes on mergers and acquisitions are considered on a case-by-case basis.
| B. | Corporate Restructuring |
Votes on corporate restructuring proposals, including minority squeezeouts, leveraged buyouts, spin-offs, liquidations and asset sales are considered on a case-by-case basis.
B-279
| C. | Spin-offs |
Votes on spin-offs are considered on a case-by-case basis.
| D. | Changing Corporate Name |
We generally vote for changing the corporate name.
IX. Social and Environmental Issues
Consistent with its fiduciary duty to clients, SCM will vote on social issues with a view toward promoting good corporate citizenship. However, SCM realizes that it cannot require a portfolio company to go beyond applicable legal requirements or put itself in a non-competitive position. Social responsibility issues may include proposals regarding the following:
| · | Ecological issues, including toxic hazards and pollution of the air and water; |
| · | Employment practices, such as the hiring of women and minority groups; |
| · | Product quality and safety; |
| · | Advertising practices; |
| · | Animal rights, including testing, experimentation and factory farming; |
| · | Military and nuclear issues; and |
| · | International politics and operations, including the world debt crisis, infant formula, U.S. corporate activity in Northern Ireland, and the policy of apartheid in South Africa. |
We review on a case-by-case basis proposals regarding social or environmental issues.
B-280
SYSTEMATIC FINANCIAL MANAGEMENT, L.P.
Summary of Proxy Voting Policies and Procedures
Systematic Financial Management, L.P. (“Systematic”), has adopted written proxy voting policies pursuant to Rule 206(4)-6 under the Advisers Act of 1940, as amended and has retained an independent proxy-voting agent (“agent”). Systematic generally follows the agent’s proxy voting guidelines when voting proxies. The adoption of the agent’s proxy voting policies provides pre-determined policies for voting proxies and is thus designed to remove conflicts of interest that could affect the outcome of a vote if Systematic made the voting determination independently. One intent of the policy is to remove any discretion that Systematic may have in cases where Systematic has a conflict of interest or the appearance of a conflict of interest. Systematic’s Proxy Voting Committee convenes as necessary. Issues reviewed by the Committee may include the consideration of any vote involving a potential conflict of interest, the documentation of the resolution of any conflict of interest or to review its voting policies and procedures.
Voting Guidelines
Systematic maintains five sets of proxy voting guidelines, one based on AFL-CIO policies for Taft-Hartley Plan Sponsors, another for clients with Socially Responsible Investing guidelines, another for Public Plans, another for Catholic or other faith-based entities and the fifth being a General Policy for all other clients, covering U.S. and global proxies. Institutional clients may select which set of proxy guidelines they wish be used to vote their account’s proxies. In instances where the client does not select a voting policy, Systematic would typically apply the General Proxy Voting Policy when voting on behalf of the client. Systematic may process certain proxies without voting them, such as by making a decision to abstain from voting or take no action on such proxies (or on certain proposals within such proxies). Examples include, without limitation, proxies issued by companies that the Firm has decided to sell, proxies issued for securities that the Firm did not select for a client portfolio (such as securities selected by the client or a previous adviser, unsupervised securities held in a client’s account, money market securities or other securities selected by clients or their representatives other than Systematic), or proxies issued by foreign companies that impose burdensome or unreasonable voting, power of attorney or holding requirements such as with share blocking as further noted below.
Systematic also seeks to ensure that, to the extent reasonably feasible, proxies for which it receives ballots in good order and receives timely notice will be voted or otherwise processed (such as through a decision to abstain or take no action).
Systematic may be unable to vote or otherwise process proxy ballots that are not received in a timely manner due to limitations of the proxy voting system, custodial limitations or other factors beyond the firm’s control. Such ballots may include, without limitation, ballots for securities out on loan under securities lending programs initiated by the client or its custodian, ballots not timely forwarded by a custodian, or ballots that were not received by Systematic’s proxy voting vendor on a timely basis.
Share Blocking
In general, unless otherwise directed by the client, Systematic will make reasonable efforts to vote client proxies in accordance with the proxy voting recommendations of the Firm’s proxy voting service provider. Systematic will generally decline to vote proxies if to do so would cause a restriction to be placed on Systematic’s ability to trade securities held in client accounts in “share blocking” countries. Accordingly, Systematic may abstain from votes in a share blocking country in favor of preserving its ability to trade any particular security at any time. Systematic maintains written Proxy Voting Policies and Procedures as required by Rule 206(4)-6 under the Investment Advisers Act. These policies and procedures in addition to how Systematic voted proxies for securities held in account(s) are available upon request.
B-281
T. ROWE PRICE ASSOCIATES, INC.
T. ROWE PRICE INTERNATIONAL LTD
T. ROWE PRICE (CANADA), INC
T. ROWE PRICE HONG KONG LIMITED
T. ROWE PRICE SINGAPORE PRIVATE LTD.
PROXY VOTING POLICIES AND PROCEDURES
RESPONSIBILITY TO VOTE PROXIES
T. Rowe Price Associates, Inc., T. Rowe Price International Ltd, T. Rowe Price (Canada), Inc., T. Rowe Price Hong Kong Limited, and T. Rowe Price Singapore Private Ltd. (collectively, “T. Rowe Price”) recognize and adhere to the principle that one of the privileges of owning stock in a company is the right to vote in the election of the company’s directors and on matters affecting certain important aspects of the company’s structure and operations that are submitted to shareholder vote. As an investment adviser with a fiduciary responsibility to its clients, T. Rowe Price analyzes the proxy statements of issuers whose stock is owned by the U.S.-registered investment companies which it sponsors and serves as investment adviser (“Price Funds”) and by common trust funds, offshore funds, institutional and private counsel clients who have requested that T. Rowe Price be involved in the proxy process. T. Rowe Price has assumed the responsibility for voting proxies on behalf of the T. Rowe Price Funds and certain counsel clients who have delegated such responsibility to T. Rowe Price. In addition, T. Rowe Price makes recommendations regarding proxy voting to counsel clients who have not delegated the voting responsibility but who have requested voting advice. T. Rowe Price reserves the right to decline to vote proxies in accordance with client-specific voting guidelines.
T. Rowe Price has adopted these Proxy Voting Policies and Procedures (“Policies and Procedures”) for the purpose of establishing formal policies and procedures for performing and documenting its fiduciary duty with regard to the voting of client proxies. This document is updated annually.
Fiduciary Considerations. It is the policy of T. Rowe Price that decisions with respect to proxy issues will be made in light of the anticipated impact of the issue on the desirability of investing in the portfolio company from the viewpoint of the particular client or Price Fund. Proxies are voted solely in the interests of the client, Price Fund shareholders or, where employee benefit plan assets are involved, in the interests of plan participants and beneficiaries. Our intent has always been to vote proxies, where possible to do so, in a manner consistent with our fiduciary obligations and responsibilities. Practicalities and costs involved with international investing may make it impossible at times, and at other times disadvantageous, to vote proxies in every instance.
Other Considerations. One of the primary factors T. Rowe Price considers when determining the desirability of investing in a particular company is the quality and depth of its management. We recognize that a company’s management is entrusted with the day-to-day operations of the company, as well as its long-term direction and strategic planning, subject to the oversight of the company’s board of directors. Accordingly, our proxy voting guidelines are not intended to substitute our judgment for management’s with respect to the company’s day-to-day operations. Rather, our proxy voting guidelines are designed to promote accountability of a company’s management and board of directors to its shareholders; to align the interests of management with those of shareholders; and to encourage companies to adopt best practices in terms of their corporate governance. In addition to our proxy voting guidelines, we rely on a company’s disclosures, its board’s recommendations, a company’s track record, country-specific best practices codes, our research providers and, most importantly, our investment professionals’ views, in making voting decisions.
ADMINISTRATION OF POLICIES AND PROCEDURES
Proxy Committee. T. Rowe Price’s Proxy Committee (“Proxy Committee”) is responsible for establishing positions with respect to corporate governance and other proxy issues, including those involving corporate social responsibility issues. Certain delegated members of the Proxy Committee also review questions and respond to
B-282
inquiries from clients and mutual fund shareholders pertaining to proxy issues. While the Proxy Committee sets voting guidelines and serves as a resource for T. Rowe Price portfolio management, it does not have proxy voting authority for any Price Fund or counsel client. Rather, this responsibility is held by the Chairperson of the Price Fund’s Investment Advisory Committee or counsel client’s portfolio manager.
Global Proxy Services Group. The Global Proxy Services Group is responsible for administering the proxy voting process as set forth in the Policies and Procedures.
Proxy Administrator. The Global Proxy Services Group will assign a Proxy Administrator who will be responsible for ensuring that all meeting notices are reviewed and important proxy matters are communicated to the portfolio managers for consideration.
Global Corporate Governance Analyst. Our Global Corporate Governance Analyst is responsible for reviewing the proxy agendas for all upcoming meetings and making company-specific recommendations to our global industry analysts and portfolio managers with regard to the voting decisions in their portfolios.
HOW PROXIES ARE REVIEWED, PROCESSED AND VOTED
In order to facilitate the proxy voting process, T. Rowe Price has retained Glass, Lewis & Co. (“Glass Lewis”) as an expert in the proxy voting and corporate governance area. Glass Lewis specializes in providing a variety of fiduciary-level proxy advisory and voting services. These services include voting recommendations as well as vote execution and reporting for the handling of proxy voting responsibility. In order to reflect T. Rowe Price’s issue-by-issue voting guidelines as approved each year by the Proxy Committee, Glass Lewis maintains and implements a custom voting policy for the Price Funds and other client accounts.
Meeting Notification
T. Rowe Price utilizes Glass Lewis’ voting agent services to notify us of upcoming shareholder meetings for portfolio companies held in client accounts and to transmit votes to the various custodian banks of our clients. Glass Lewis tracks and reconciles T. Rowe Price holdings against incoming proxy ballots. If ballots do not arrive on time, Glass Lewis procures them from the appropriate custodian or proxy distribution agent. Meeting and record date information is updated daily, and transmitted to T. Rowe Price through ViewPoint, Glass Lewis’ web-based application.
Vote Determination
Each day, Glass Lewis delivers into T. Rowe Price’s proprietary proxy research platform a comprehensive summary of upcoming meetings, proxy proposals, publications discussing key proxy voting issues, and custom vote recommendations to assist us with proxy research and processing. The final authority and responsibility for proxy voting decisions remains with T. Rowe Price. Decisions with respect to proxy matters are made primarily in light of the anticipated impact of the issue on the desirability of investing in the company from the perspective of our clients.
Portfolio managers may decide to vote their proxies consistent with the Policies and Procedures, as set by the Proxy Committee, and instruct our Proxy Administrator to vote all proxies accordingly. Alternatively, portfolio managers may request to review the vote recommendations and sign off on all proxies before the votes are cast, or they may choose only to sign off on those votes cast against management. The portfolio managers are also given the option of reviewing and determining the votes on all proxies without utilizing the vote guidelines of the Proxy Committee. In all cases, the portfolio managers may elect to receive current reports summarizing all proxy votes in their client accounts. Portfolio managers who vote their proxies inconsistent with T. Rowe Price guidelines are required to document the rationale for their votes. The Proxy Administrator is responsible for maintaining this documentation and assuring that it adequately reflects the basis for any vote which is cast contrary to our proxy voting guidelines.
B-283
T. Rowe Price Voting Policies
Specific proxy voting guidelines have been adopted by the Proxy Committee for all regularly occurring categories of management and shareholder proposals. A detailed set of proxy voting guidelines is available on the T. Rowe Price website, www.troweprice.com. The following is a summary of our guidelines on the most significant proxy voting topics:
Election of Directors—For U.S. companies, T. Rowe Price generally supports slates with a majority of independent directors. However, T. Rowe Price may vote against outside directors who do not meet our criteria relating to their independence, particularly when they serve on key board committees, such as compensation and nominating committees, for which we believe that all directors should be independent. Outside of the U.S., we expect companies to adhere to the minimum independence standard established by regional corporate governance codes. At a minimum, however, we believe boards in all regions should include a blend of executive and non-executive members, and we are likely to vote against senior executives at companies without any independent directors. We also vote against directors who are unable to dedicate sufficient time to their board duties due to their commitments to other boards. We may vote against certain directors who have served on company boards where we believe there has been a gross failure in governance or oversight. Additionally, we may vote against compensation committee members who approve excessive executive compensation or severance arrangements. We support efforts to elect all board members annually because boards with staggered terms lessen directors’ accountability to shareholders and act as deterrents to takeover proposals. To strengthen boards’ accountability, T. Rowe Price supports proposals calling for a majority vote threshold for the election of directors and we may withhold votes from an entire board if they fail to implement shareholder proposals that receive majority support.
Anti-Takeover, Capital Structure and Corporate Governance Issues—T. Rowe Price generally opposes anti-takeover measures since they adversely impact shareholder rights and limit the ability of shareholders to act on potential value-enhancing transactions. Such anti-takeover mechanisms include classified boards, supermajority voting requirements, dual share classes, and poison pills. When voting on capital structure proposals, T. Rowe Price will consider the dilutive impact to shareholders and the effect on shareholder rights. We may support shareholder proposals that call for the separation of the Chairman and CEO positions if we determine that insufficient governance safeguards are in place at the company.
Executive Compensation Issues—T. Rowe Price’s goal is to assure that a company’s equity-based compensation plan is aligned with shareholders’ long-term interests. We evaluate plans on a case-by-case basis, using a proprietary, scorecard-based approach that employs a number of factors, including dilution to shareholders, problematic plan features, burn rate, and the equity compensation mix. Plans that are constructed to effectively and fairly align executives’ and shareholders’ incentives generally earn our approval. Conversely, we oppose compensation packages that provide what we view as excessive awards to few senior executives, contain the potential for excessive dilution relative to the company’s peers, or rely on an inappropriate mix of options and full-value awards. We also may oppose equity plans at any company where we deem the overall compensation practices to be problematic. We generally oppose efforts to reprice options in the event of a decline in value of the underlying stock unless such plans appropriately balance shareholder and employee interests. For companies with particularly egregious pay practices such as excessive severance packages, executives with outsized pledged/hedged stock positions, executive perks, and bonuses that are not adequately linked to performance, we may vote against compensation committee members. We analyze management proposals requesting ratification of a company’s executive compensation practices (“Say-on-Pay” proposals) on a case-by-case basis, using a proprietary scorecard-based approach that assesses the long-term linkage between executive compensation and company performance as well as the presence of objectionable structural features in compensation plans. With respect to the frequency in which companies should seek advisory votes on compensation, we believe shareholders should be offered the opportunity to vote annually. Finally, we may withhold votes from compensation committee members or even the entire board if we have cast votes against a company’s “Say-on-Pay” vote in consecutive years.
B-284
Mergers and Acquisitions—T. Rowe Price considers takeover offers, mergers, and other extraordinary corporate transactions on a case-by-case basis to determine if they are beneficial to shareholders’ current and future earnings stream and to ensure that our Price Funds and clients are receiving fair consideration for their securities. We oppose a high proportion of proposals for the ratification of executive severance packages (“Say on Golden Parachute” proposals) in conjunction with merger transactions if we conclude these arrangements reduce the alignment of executives’ incentives with shareholders’ interests.
Corporate Social Responsibility Issues—Vote recommendations for corporate responsibility issues are generated by the Global Corporate Governance Analyst using Glass Lewis’ proxy research and company reports. T. Rowe Price generally votes with a company’s management on social, environmental and corporate responsibility issues unless the issue has substantial investment implications for the company’s business or operations which have not been adequately addressed by management. T. Rowe Price supports well-targeted shareholder proposals on environmental and other public policy issues that are particularly relevant to a company’s businesses.
Global Portfolio Companies—Glass Lewis applies a two-tier approach to determining and applying global proxy voting policies. The first tier establishes baseline policy guidelines for the most fundamental issues, which span the corporate governance spectrum without regard to a company’s domicile. The second tier takes into account various idiosyncrasies of different countries, making allowances for standard market practices, as long as they do not violate the fundamental goals of good corporate governance. The goal is to enhance shareholder value through effective use of the shareholder franchise, recognizing that application of policies developed for U.S. corporate governance issues are not appropriate for all markets. The Proxy Committee has reviewed Glass Lewis’ general global policies and has developed international proxy voting guidelines which in most instances are consistent with Glass Lewis recommendations.
Fixed Income, Index and Passively Managed Accounts—Proxy voting for fixed income, index and other passively-managed portfolios is administered by the Proxy Services Group using T. Rowe Price’s policies as set by the Proxy Committee. If a portfolio company is held in both an actively managed account and an index account, the index account will default to the vote as determined by the actively managed proxy voting process. In addition, fixed income accounts will generally follow the proxy vote determinations on security holdings held by our equity accounts unless the matter is specific to a particular fixed income security (i.e., consents, restructurings, reorganization proposals).
Divided Votes—In situations where a decision is made which is contrary to the policies established by the Proxy Committee, or differs from the vote for any other client or Price Fund, the Proxy Services Group advises the portfolio managers involved of the divided vote. The persons representing opposing views may wish to confer to discuss their positions. In such instances, it is the normal practice for the portfolio manager to document the reasons for the vote if it is against our proxy voting guidelines. The Proxy Administrator is responsible for assuring that adequate documentation is maintained to reflect the basis for any vote which is cast in opposition to our proxy voting guidelines.
Shareblocking—Shareblocking is the practice in certain foreign countries of “freezing” shares for trading purposes in order to vote proxies relating to those shares. In markets where shareblocking applies, the custodian or sub-custodian automatically freezes shares prior to a shareholder meeting once a proxy has been voted. Shareblocking typically takes place between one and fifteen (15) days before the shareholder meeting, depending on the market. In markets where shareblocking applies, there is a potential for a pending trade to fail if trade settlement takes place during the blocking period. T. Rowe Price’s policy is generally to abstain from voting shares in shareblocking countries unless the matter has compelling economic consequences that outweigh the loss of liquidity in the blocked shares.
Securities on Loan—The Price Funds and our institutional clients may participate in securities lending programs to generate income. Generally, the voting rights pass with the securities on loan; however, lending
B-285
agreements give the lender the right to terminate the loan and pull back the loaned shares provided sufficient notice is given to the custodian bank in advance of the voting deadline. T. Rowe Price’s policy is generally not to vote securities on loan unless the portfolio manager has knowledge of a material voting event that could affect the value of the loaned securities. In this event, the portfolio manager has the discretion to instruct the Proxy Administrator to pull back the loaned securities in order to cast a vote at an upcoming shareholder meeting.
Monitoring and Resolving Conflicts of Interest
The Proxy Committee is also responsible for monitoring and resolving potential material conflicts between the interests of T. Rowe Price and those of its clients with respect to proxy voting. We have adopted safeguards to ensure that our proxy voting is not influenced by interests other than those of our fund shareholders. While membership on the Proxy Committee is diverse, it does not include individuals whose primary duties relate to client relationship management, marketing, or sales. Since T. Rowe Price’s voting guidelines are predetermined by the Proxy Committee, application of the guidelines by fund portfolio managers to vote fund proxies should in most instances adequately address any potential conflicts of interest. However, consistent with the terms of the Policies and Procedures, which allow portfolio managers to vote proxies opposite our general voting guidelines, the Proxy Committee regularly reviews all such proxy votes that are inconsistent with the proxy voting guidelines to determine whether the portfolio manager’s voting rationale appears reasonable. The Proxy Committee also assesses whether any business or other material relationships between T. Rowe Price and a portfolio company (unrelated to the ownership of the portfolio company’s securities) could have influenced an inconsistent vote on that company’s proxy.
Issues raising potential conflicts of interest are referred to designated members of the Proxy Committee for immediate resolution prior to the time T. Rowe Price casts its vote. With respect to personal conflicts of interest, T. Rowe Price’s Code of Ethics and Conduct requires all employees to avoid placing themselves in a “compromising position” in which their interests may conflict with those of our clients and restrict their ability to engage in certain outside business activities. Portfolio managers or Proxy Committee members with a personal conflict of interest regarding a particular proxy vote must recuse themselves and not participate in the voting decisions with respect to that proxy.
Specific Conflict of Interest Situations—Voting of T. Rowe Price Group, Inc. common stock (sym: TROW) by certain T. Rowe Price Index Funds will be done in all instances in accordance with T. Rowe Price policy, and votes inconsistent with policy will not be permitted. In the event that there is no previously established guideline for a specific voting issue appearing on the T. Rowe Price Group proxy, the Price Funds will abstain on that voting item. In addition, T. Rowe Price has voting authority for proxies of the holdings of certain Price Funds that invest in other Price Funds. In cases where the underlying fund of an investing Price Fund, including a fund-of-funds, holds a proxy vote, T. Rowe Price will mirror vote the fund shares held by the upper-tier fund in the same proportion as the votes cast by the shareholders of the underlying funds (other than the T. Rowe Price Reserve Investment Funds).
Limitations on Voting Proxies of Banks
T. Rowe Price has obtained relief from the U.S. Federal Reserve Board (the “FRB Relief”) which permits, subject to a number of conditions, T. Rowe Price to acquire in the aggregate on behalf of its clients, 10% or more of the total voting stock of a bank, bank holding company, savings and loan holding company or savings association (each a “Bank”), not to exceed a 15% aggregate beneficial ownership maximum in such Bank. One such condition affects the manner in which T. Rowe Price will vote its clients’ shares of a Bank in excess of 10% of the Bank’s total voting stock (“Excess Shares”). The FRB Relief requires that T. Rowe Price use its best efforts to vote the Excess Shares in the same proportion as all other shares voted, a practice generally referred to as “mirror voting,” or in the event that such efforts to mirror vote are unsuccessful, Excess Shares will not be voted. With respect to a shareholder vote for a Bank of which T. Rowe Price has aggregate beneficial ownership
B-286
of greater than 10% on behalf of its clients, T. Rowe Price will determine which of its clients’ shares are Excess Shares on a pro rata basis across all of its clients’ portfolios for which T. Rowe Price has the power to vote proxies.
REPORTING, RECORD RETENTION AND OVERSIGHT
The Proxy Committee, and certain personnel under the direction of the Proxy Committee, perform the following oversight and assurance functions, among others, over T. Rowe Price’s proxy voting: (1) periodically samples proxy votes to ensure that they were cast in compliance with T. Rowe Price’s proxy voting guidelines; (2) reviews, no less frequently than annually, the adequacy of the Policies and Procedures to make sure that they have been implemented effectively, including whether they continue to be reasonably designed to ensure that proxies are voted in the best interests of our clients; (3) performs due diligence on whether a retained proxy advisory firm has the capacity and competency to adequately analyze proxy issues, including the adequacy and quality of the proxy advisory firm’s staffing and personnel and its policies; and (4) oversees any retained proxy advisory firms and their procedures regarding their capabilities to (i) produce proxy research that is based on current and accurate information and (ii) identify and address any conflicts of interest and any other considerations that we believe would be appropriate in considering the nature and quality of the services provided by the proxy advisory firm.
Vote Summary Reports will be generated for each client that requests T. Rowe Price to furnish proxy voting records. The report specifies the portfolio companies, meeting dates, proxy proposals, and votes which have been cast for the client during the period and the position taken with respect to each issue. Reports normally cover quarterly or annual periods and are provided to clients upon request.
T. Rowe Price retains proxy solicitation materials, memoranda regarding votes cast in opposition to the position of a company’s management, and documentation on shares voted differently. In addition, any document which is material to a proxy voting decision such as the T. Rowe Price proxy voting guidelines, Proxy Committee meeting materials, and other internal research relating to voting decisions will be kept. All proxy voting materials and supporting documentation are retained for six years (except for proxy statements available on the SEC’s EDGAR database).
Updated: December 2016
B-287
WELLINGTON MANAGEMENT COMPANY LLP
Global Proxy Policy and Procedures
Introduction
Wellington Management Company llp (“Wellington Management”) has adopted and implemented policies and procedures that it believes are reasonably designed to ensure that proxies are voted in the best economic interests of clients for whom it exercises proxy-voting discretion.
Wellington Management’s Proxy Voting Guidelines (the “Guidelines”) set forth broad guidelines and positions on common proxy issues that Wellington Management uses in voting on proxies. In addition, Wellington Management also considers each proposal in the context of the issuer, industry and country or countries in which the issuer’s business is conducted. The Guidelines are not rigid rules and the merits of a particular proposal may cause Wellington Management to enter a vote that differs from the Guidelines.
Statement of Policy
Wellington Management:
| 1) | Votes client proxies for which clients have affirmatively delegated proxy-voting authority, in writing, unless it determines that it is in the best interest of one or more clients to refrain from voting a given proxy. |
| 2) | Votes all proxies in the best interests of the client for whom it is voting, i.e., to maximize economic value. |
| 3) | Identifies and resolves all material proxy-related conflicts of interest between the firm and its clients in the best interests of the client. |
Responsibility and Oversight
The Investment Research Group (“Investment Research”) monitors regulatory requirements with respect to proxy voting and works with the firm’s Legal and Compliance Group and the Corporate Governance Committee to develop practices that implement those requirements. Investment Research also acts as a resource for portfolio managers and research analysts on proxy matters as needed. Day-to-day administration of the proxy voting process is the responsibility of Investment Research. The Corporate Governance Committee is responsible for oversight of the implementation of the Global Proxy Policy and Procedures, review and approval of the Guidelines and for providing advice and guidance on specific proxy votes for individual issuers.
Procedures
Use of Third-Party Voting Agent Wellington Management uses the services of a third-party voting agent to manage the administrative aspects of proxy voting. The voting agent processes proxies for client accounts, casts votes based on the Guidelines and maintains records of proxies voted.
Receipt of Proxy If a client requests that Wellington Management votes proxies on its behalf, the client must instruct its custodian bank to deliver all relevant voting material to Wellington Management or its voting agent.
Reconciliation Each public security proxy received by electronic means is matched to the securities eligible to be voted and a reminder is sent to any custodian or trustee that has not forwarded the proxies as due. Although proxies received for private securities, as well as those received in non-electronic format, are voted as received, Wellington Management is not able to reconcile these proxies to holdings, nor does it notify custodians of non-receipt.
B-288
Research In addition to proprietary investment research undertaken by Wellington Management investment professionals, Investment Research conducts proxy research internally, and uses the resources of a number of external sources to keep abreast of developments in corporate governance and of current practices of specific companies.
Proxy Voting Following the reconciliation process, each proxy is compared against the Guidelines, and handled as follows:
| · | Generally, issues for which explicit proxy voting guidance is provided in the Guidelines (i.e., “For”, “Against”, “Abstain”) are reviewed by Investment Research and voted in accordance with the Guidelines. |
| · | Issues identified as “case-by-case” in the Guidelines are further reviewed by Investment Research. In certain circumstances, further input is needed, so the issues are forwarded to the relevant research analyst and/or portfolio manager(s) for their input. |
| · | Absent a material conflict of interest, the portfolio manager has the authority to decide the final vote. Different portfolio managers holding the same securities may arrive at different voting conclusions for their clients’ proxies. |
Wellington Management reviews regularly the voting record to ensure that proxies are voted in accordance with these Global Proxy Policy and Procedures and the Guidelines; and ensures that documentation and reports, for clients and for internal purposes, relating to the voting of proxies are promptly and properly prepared and disseminated.
Material Conflict of Interest Identification and Resolution Processes Wellington Management’s broadly diversified client base and functional lines of responsibility serve to minimize the number of, but not prevent, material conflicts of interest it faces in voting proxies. Annually, the Corporate Governance Committee sets standards for identifying material conflicts based on client, vendor, and lender relationships, and publishes those standards to individuals involved in the proxy voting process. In addition, the Corporate Governance Committee encourages all personnel to contact Investment Research about apparent conflicts of interest, even if the apparent conflict does not meet the published materiality criteria. Apparent conflicts are reviewed by designated members of the Corporate Governance Committee to determine if there is a conflict and if so whether the conflict is material.
If a proxy is identified as presenting a material conflict of interest, the matter must be reviewed by designated members of the Corporate Governance Committee, who will resolve the conflict and direct the vote. In certain circumstances, the designated members may determine that the full Corporate Governance Committee should convene.
Other Considerations
In certain instances, Wellington Management may be unable to vote or may determine not to vote a proxy on behalf of one or more clients. While not exhaustive, the following are potential instances in which a proxy vote might not be entered.
Securities Lending In general, Wellington Management does not know when securities have been lent out pursuant to a client’s securities lending program and are therefore unavailable to be voted. Efforts to recall loaned securities are not always effective, but, in rare circumstances, Wellington Management may recommend that a client attempt to have its custodian recall the security to permit voting of related proxies.
Share Blocking and Re-registration Certain countries impose trading restrictions or requirements regarding re-registration of securities held in omnibus accounts in order for shareholders to vote a proxy. The potential impact of such requirements is evaluated when determining whether to vote such proxies.
B-289
Lack of Adequate Information, Untimely Receipt of Proxy Materials, or Excessive Costs Wellington Management may abstain from voting a proxy when the proxy statement or other available information is inadequate to allow for an informed vote, when the proxy materials are not delivered in a timely fashion or when, in Wellington Management’s judgment, the costs exceed the expected benefits to clients (such as when powers of attorney or consularization are required).
Additional Information
Wellington Management maintains records related to proxies pursuant to Rule 204-2 of the Investment Advisers Act of 1940 (the “Advisers Act”), the Employee Retirement Income Security Act of 1974, as amended (“ERISA”), and other applicable laws.
Wellington Management provides clients with a copy of its Global Proxy Policy and Procedures, including the Guidelines, upon written request. In addition, Wellington Management will make specific client information relating to proxy voting available to a client upon reasonable written request.
Dated: 1 November 2016
B-290
WELLINGTON MANAGEMENT COMPANY LLP
Global Proxy Voting Guidelines
Introduction
Upon a client’s written request, Wellington Management Company llp (“Wellington Management”) votes securities that are held in the client’s account in response to proxies solicited by the issuers of such securities. Wellington Management established these Global Proxy Voting Guidelines to document positions generally taken on common proxy issues voted on behalf of clients.
These guidelines are based on Wellington Management’s fiduciary obligation to act in the best economic interest of its clients as shareholders. Hence, Wellington Management examines and seeks to vote each proposal so that the long-term effect of the vote will ultimately increase shareholder value for our clients. Because ethical considerations can have an impact on the long-term value of assets, our voting practices are also attentive to these issues, and votes will be cast against unlawful and unethical activity. Further, Wellington Management’s experience in voting proposals has shown that similar proposals often have different consequences for different companies. Moreover, while these Global Proxy Voting Guidelines are written to apply globally, differences in local practice and law make universal application impractical. Therefore, each proposal is evaluated on its merits, taking into account its effects on the specific company in question and on the company within its industry. It should be noted that the following are guidelines, not rigid rules, and Wellington Management reserves the right in all cases to vote contrary to guidelines where doing so is judged to represent the best economic interest of our clients.
Following is a list of common proposals and the guidelines on how Wellington Management anticipates voting on these proposals. The “(SP)” after a proposal indicates that the proposal is usually presented as a shareholder proposal.
Voting guidelines
Composition and role of the board of directors | ||
| Elect directors | Case by case | |
| We believe that shareholders’ ability to elect directors annually is the most important right shareholders have. We generally support management nominees, but will withhold votes from any director who is demonstrated to have acted contrary to the best economic interest of shareholders. We may also withhold votes from directors who failed to implement shareholder proposals that received majority support, implemented dead-hand or no-hand poison pills, or failed to attend at least 75% of scheduled board meetings. | ||
| Declassify board of directors | For | |
| Adopt director tenure/retirement age (SP) | Against | |
| Adopt director and officer indemnification | For | |
| We generally support director and officer indemnification as critical to the attraction and retention of qualified candidates to the board. Such proposals must incorporate the duty of care. | ||
| Allow special interest representation to board (SP) | Against | |
| Require board independence | For | |
| We believe that, in the absence of a compelling counter-argument or prevailing market norms, at least two-thirds of a board should be composed of independent directors, with independence defined by the local market regulatory authority. Our support for this level of independence may include withholding approval for non-independent directors, as well as votes in support of shareholder proposals calling for independence. | ||
B-291
| Require key board committees to be independent | For | |
| Key board committees are the nominating, audit, and compensation committees. Exceptions will be made, as above, with respect to local market conventions. | ||
| Require a separation of chair and CEO or require a lead director (SP) | Case by case | |
| We will generally support management proposals to separate the chair and CEO or establish a lead director. | ||
| Approve directors’ fees | Case by case | |
| Approve bonuses for retiring directors | For | |
| Approve board size | For | |
| Elect supervisory board/corporate assembly/statutory auditors | Case by case | |
| Companies in certain markets are governed by multitiered boards, with each tier having different powers and responsibilities. We hold supervisory board members to similar standards described above under “Elect directors,” subject to prevailing local governance best practices. | ||
| Majority vote on election of directors (SP) | For | |
| We believe that the election of directors by a majority of votes cast is the appropriate standard for companies to adopt and therefore generally will support those proposals that seek to adopt such a standard. Our support for such proposals will extend typically to situations where the relevant company has an existing resignation policy in place for directors that receive a majority of “withhold” votes. We believe that it is important for majority voting to be defined within the company’s charter and not simply within the company’s corporate governance policy. | ||
| Generally we will not support proposals that fail to provide for the exceptional use of a plurality standard in the case of contested elections. Further, we will not support proposals that seek to adopt a majority of votes outstanding (i.e., total votes eligible to be cast as opposed to actually cast) standard. | ||
| Adopt proxy access | For | |
| We generally support proposals that allow significant and long-term shareholders the right to nominate director candidates on management’s proxy card. That being said, we may vote against a proxy access proposal if it is shareholder-sponsored and it requests that the company adopt proxy access without reasonable constraints or in a way that markedly differs from prevailing market norms. | ||
| Contested director election | Case by case | |
Compensation | ||
| Adopt/amend stock option plans | Case by case | |
| While we believe equity compensation helps align plan participants’ and shareholders’ interests, we will vote against plans that we find excessively dilutive or costly. Additionally, we will generally vote against plans that allow the company to reprice options without shareholder approval. We will also vote against plans that allow the company to add shares to the plan without shareholder approval, otherwise known as an “evergreen” provision. | ||
| Adopt/amend employee stock purchase plans | Case by case | |
| We generally support employee stock purchase plans, as they may align employees’ interests with the interests of shareholders. That being said, we typically vote against plans that do not offer shares to a broad group of employees (i.e., only executives are allowed to participate) or plans that offer shares at a significant discount. | ||
B-292
| Approve/amend bonus plans | Case by case | |
| In the US, bonus plans are customarily presented for shareholder approval pursuant to section 162(m) of the omnibus budget reconciliation act of 1992 (“OBRA”). OBRA stipulates that certain forms of compensation are not tax deductible unless approved by shareholders and subject to performance criteria. Because OBRA does not prevent the payment of subject compensation, we generally vote “for” these proposals. Nevertheless, occasionally these proposals are presented in a bundled form seeking 162(m) approval and approval of a stock option plan. In such cases, failure of the proposal prevents the awards from being granted. We will vote against these proposals where the grant portion of the proposal fails our guidelines for the evaluation of stock option plans. | ||
| Approve remuneration policy | Case by case | |
| Approve compensation packages for named executive officers | Case by case | |
| Determine whether the compensation vote will occur every one, two, or three years | One year | |
| Exchange underwater options | Case by case | |
| We may support value-neutral exchanges in which senior management is ineligible to participate. | ||
| Eliminate or limit severance agreements (golden parachutes) | Case by case | |
| We will oppose excessively generous arrangements, but may support agreements structured to encourage management to negotiate in shareholders’ best economic interest. | ||
| Approve golden parachute arrangements in connection with certain corporate transactions | Case by case | |
| Shareholder approval of future severance agreements covering senior executives (SP) | Case by case | |
| We believe that severance arrangements require special scrutiny, and are generally supportive of proposals that call for shareholder ratification thereof. But we are also mindful of the board’s need for flexibility in recruitment and retention and will therefore oppose placing additional limitations on compensation where we feel the board as already demonstrated reasonable respect for industry practice and overall levels of compensation have historically been sensible. | ||
| Adopt a clawback policy (SP) | Case by case | |
| We believe that companies should have the ability to recoup incentive compensation from members of management who received awards based on fraudulent activities or an accounting misstatement. Consequently, we may support shareholder proposals requesting that a company establish a clawback provision if the company’s existing policies do not cover these circumstances. | ||
Reporting of results | ||
| Approve financial statements | For | |
| Set dividends and allocate profits | For | |
| Limit non-audit services provided by auditors (SP) | Case by case | |
| We follow the guidelines established by the public company accounting oversight board regarding permissible levels of non-audit fees payable to auditors. | ||
| Ratify selection of auditors and approve their fees | Case by case | |
| We will generally support management’s choice of auditors, unless the auditors have demonstrated failure to act in shareholders’ best economic interest. | ||
| Shareholder approval of auditors (SP) | For | |
B-293
Shareholder voting rights | ||
| Adopt cumulative voting (SP) | Against | |
| As an exception, we may support cumulative voting proposals at “controlled” companies (i.e., companies with a single majority shareholder) or at companies with two-tiered voting rights. | ||
| Shareholder rights plans | Case by case | |
| Also known as poison pills, we believe these plans do not encourage strong corporate governance, since they can entrench management and restrict opportunities for takeovers. That being said, we recognize that limited poison pills can enable boards of directors to negotiate higher takeover prices on behalf of shareholders. Consequently, we may support plans that include: | ||
| • Shareholder approval requirement | ||
| • Sunset provision | ||
| • Permitted bid feature (i.e., bids that are made for all shares and demonstrate evidence of financing must be submitted to a shareholder vote) | ||
| Because boards generally have the authority to adopt shareholder rights plans without shareholder approval, we are equally vigilant in our assessment of requests for authorization of blank check preferred shares (see below). | ||
| Authorize blank check preferred stock | Case by case | |
| We may support authorization requests that specifically proscribe the use of such shares for anti-takeover purposes. | ||
| Establish right to call a special meeting | For | |
| A reasonably high ownership threshold should be required to convene special meetings in order to ensure that they address broadly-supported shareholder interests. | ||
| Establish the right to act by written consent (SP) | Case by case | |
| We will generally oppose written consent proposals when the company already offers the shareholders the right to call a special meeting. | ||
| Increase supermajority vote requirement | Against | |
| We likely will support shareholder and management proposals to remove existing supermajority vote requirements. | ||
| Adopt anti-greenmail provision | For | |
| Adopt confidential voting (SP) | Case by case | |
| As an exception, we require such proposals to include a provision to suspend confidential voting during contested elections so that management is not subject to constraints that do not apply to dissidents. | ||
| Increase authorized common stock | Case by case | |
| We generally support requests for increases up to 100% of the shares currently authorized, so long as the new authority respects preemption rights. Exceptions will be made when the company has clearly articulated a reasonable need for a greater increase. Conversely, at companies trading in less liquid markets, we may impose a lower threshold. | ||
| Approve merger or acquisition | Case by case | |
| Approve technical amendments to charter | Case by case | |
| Opt out of state takeover statutes | For | |
| Eliminate multiclass voting structure (SP) | For | |
| We believe that shareholders’ voting power should be reflected by their economic stake in a company. | ||
B-294
Capital structure | ||
| Authorize share repurchase | For | |
| Approve stock splits | Case by case | |
| We approve stock splits and reverse stock splits that preserve the level of authorized but unissued shares. | ||
| Approve recapitalization/restructuring | Case by case | |
| Issue stock with or without preemptive rights | Case by case | |
| Issue debt instruments | Case by case | |
Environmental and social issues | ||
| Environmental and social issues typically appear on ballots as shareholder-sponsored proposals. We may support these proposals in situations where we believe that doing so will improve the prospects for long-term success of a company and investment returns. At a minimum, we expect companies to comply with applicable laws and regulations with regards to environmental and social standards. | Case by case | |
Miscellaneous | ||
| Approve other business | Against | |
| Approve re-incorporation | Case by case | |
| Approve third-party transactions | Case by case | |
January 2016
B-295
WESTERN ASSET MANAGEMENT COMPANY
WESTERN ASSET MANAGEMENT COMPANY LIMITED
PROXY VOTING
BACKGROUND
An investment adviser is required to adopt and implement policies and procedures that we believe are reasonably designed to ensure that proxies are voted in the best interest of clients, in accordance with fiduciary duties and SEC Rule 206(4)-6 under the Investment Advisers Act of 1940 (“Advisers Act”). The authority to vote the proxies of our clients is established through investment management agreements or comparable documents. In addition to SEC requirements governing advisers, long-standing fiduciary standards and responsibilities have been established for ERISA accounts. Unless a manager of ERISA assets has been expressly precluded from voting proxies, the Department of Labor has determined that the responsibility for these votes lies with the investment manager.
POLICY
As a fixed income only manager, the occasion to vote proxies is very rare. However, the Firm has adopted and implemented policies and procedures that we believe are reasonably designed to ensure that proxies are voted in the best interest of clients, in accordance with our fiduciary duties and SEC Rule 206(4)-6 under the Advisers Act. In addition to SEC requirements governing advisers, our proxy voting policies reflect the long-standing fiduciary standards and responsibilities for ERISA accounts. Unless a manager of ERISA assets has been expressly precluded from voting proxies, the Department of Labor has determined that the responsibility for these votes lies with the Investment Manager.
While the guidelines included in the procedures are intended to provide a benchmark for voting standards, each vote is ultimately cast on a case-by-case basis, taking into consideration the Firm’s contractual obligations to our clients and all other relevant facts and circumstances at the time of the vote (such that these guidelines may be overridden to the extent the Firm deems appropriate).
In exercising its voting authority, Western Asset will not consult or enter into agreements with officers, directors or employees of Legg Mason Inc. or any of its affiliates (other than Western Asset Management Company Limited) regarding the voting of any securities owned by its clients.
B-296
APPENDIX C—ADDITIONAL PORTFOLIO MANAGER INFORMATION
American Century Investment Management, Inc.
The portfolio managers of the Mid-Cap Value Fund are Phillip N. Davidson, Michael Liss, Kevin Toney, and Brian Woglom.
Other Accounts Managed:
| Number of Accounts Managed* | Total Assets* | Number of Accounts Managed for which Advisory Fee is Performance- Based* | Total Assets* | |||||||||||||
Phillip N. Davidson | ||||||||||||||||
Registered investment companies** | 14 | $ | 28.648 billion | 0 | $ | 0 | ||||||||||
Other pooled investment vehicles | 6 | $ | 2.787 billion | 0 | $ | 0 | ||||||||||
Other accounts | 2 | $ | 295.4 million | 0 | $ | 0 | ||||||||||
Michael Liss | ||||||||||||||||
Registered investment companies** | 14 | $ | 28.648 billion | 0 | $ | 0 | ||||||||||
Other pooled investment vehicles | 6 | $ | 2.787 billion | 0 | $ | 0 | ||||||||||
Other accounts | 2 | $ | 295.4 million | 0 | $ | 0 | ||||||||||
Kevin Toney | ||||||||||||||||
Registered investment companies** | 14 | $ | 28.648 billion | 0 | $ | 0 | ||||||||||
Other pooled investment vehicles | 6 | $ | 2.787 billion | 0 | $ | 0 | ||||||||||
Other accounts | 2 | $ | 295.4 million | 0 | $ | 0 | ||||||||||
Brian Woglom | ||||||||||||||||
Registered investment companies** | 18 | $ | 20.283 billion | 0 | $ | 0 | ||||||||||
Other pooled investment vehicles | 4 | $ | 1.007 billion | 0 | $ | 0 | ||||||||||
Other accounts | 1 | $ | 67.9 million | 0 | $ | 0 | ||||||||||
| * | The information provided is as of September 30, 2016. |
| ** | Does not include the Mid-Cap Value Fund. |
Ownership of Securities:
As of September 30, 2016, the portfolio managers did not own any shares of the Mid-Cap Value Fund.
B-297
Conflicts of Interest:
Certain conflicts of interest may arise in connection with the management of multiple portfolios. Potential conflicts include, for example, conflicts among investment strategies, such as one portfolio buying or selling a security while another portfolio has a differing, potentially opposite position in such security. This may include one portfolio taking a short position in the security of an issuer that is held long in another portfolio (or vice versa). Other potential conflicts may arise with respect to the allocation of investment opportunities, which are discussed in more detail below. American Century has adopted policies and procedures that are designed to minimize the effects of these conflicts.
Responsibility for managing American Century client portfolios is organized according to investment discipline. Investment disciplines include, for example, disciplined equity, U.S. growth mid- and small-cap, U.S. growth large-cap, value, global and non-U.S., fixed income and asset allocation. Within each discipline are one or more portfolio teams responsible for managing specific client portfolios. Generally, client portfolios with similar strategies are managed by the same team using the same objective, approach, and philosophy. Accordingly, portfolio holdings, position sizes, and industry and sector exposures tend to be similar across similar portfolios, which minimizes the potential for conflicts of interest. In addition, American Century maintains an ethical wall around each of its equity investment disciplines (U.S. growth large-cap, U.S. growth mid- and small-cap, value, disciplined equity and global and non-U.S.), meaning that access to information regarding any portfolio’s transactional activities is only available to team members of the investment discipline that manages such portfolio. The ethical wall is intended to aid in preventing the misuse of portfolio holdings information and trading activity in the other disciplines.
For each investment strategy, one portfolio is generally designated as the “policy portfolio.” Other portfolios with similar investment objectives, guidelines and restrictions, if any, are referred to as “tracking portfolios.” When managing policy and tracking portfolios, a portfolio team typically purchases and sells securities across all portfolios that the team manages. American Century’s trading systems include various order entry programs that assist in the management of multiple portfolios, such as the ability to purchase or sell the same relative amount of one security across several funds. In some cases a tracking portfolio may have additional restrictions or limitations that cause it to be managed separately from the policy portfolio. Portfolio managers make purchase and sale decisions for such portfolios alongside the policy portfolio to the extent the overlap is appropriate, and separately, if the overlap is not. American Century may aggregate orders to purchase or sell the same security for multiple portfolios when it believes such aggregation is consistent with its duty to seek best execution on behalf of its clients. Orders of certain client portfolios may, by investment restriction or otherwise, be determined not available for aggregation. American Century has adopted policies and procedures to minimize the risk that a client portfolio could be systematically advantaged or disadvantaged in connection with the aggregation of orders. To the extent equity trades are aggregated, shares purchased or sold are generally allocated to the participating portfolios pro rata based on order size. Because initial public offerings (IPOs) are usually available in limited supply and in amounts too small to permit across-the-board pro rata allocations, American Century has adopted special procedures designed to promote a fair and equitable allocation of IPO securities among clients over time. Fixed income securities transactions are not executed through a centralized trading desk. Instead, portfolio teams are responsible for executing trades with broker/dealers in a predominantly dealer marketplace. Trade allocation decisions are made by the portfolio manager at the time of trade execution and orders entered on the fixed income order management system.
Finally, investment of American Century’s corporate assets in proprietary accounts may raise additional conflicts of interest. To mitigate these potential conflicts of interest, American Century has adopted policies and procedures intended to provide that trading in proprietary accounts is performed in a manner that does not give improper advantage to American Century to the detriment of client portfolios.
Compensation:
American Century portfolio manager compensation is structured to align the interests of portfolio managers with those of the shareholders whose assets they manage. For the fiscal year ended September 30, 2016, it
B-298
includes the components described below, each of which is determined with reference to a number of factors such as overall performance, market competition, and internal equity.
Base Salary
Portfolio managers receive base pay in the form of a fixed annual salary.
Bonus
A significant portion of portfolio manager compensation takes the form of an annual incentive bonus tied to performance. Bonus payments are determined by a combination of factors. One factor is fund investment performance. For most American Century mutual funds, investment performance is measured by a combination of one-, three- and five-year pre-tax performance relative to various benchmarks (the Russell Midcap® Value Index is used for purposes of the Mid-Cap Value Fund) and/or internally-customized peer groups. The performance comparison periods may be adjusted based on a fund’s inception date or a portfolio manager’s tenure on the fund. Custom peer groups are constructed using all the funds in the indicated categories as a starting point. Funds are then eliminated from the peer group based on a standardized methodology designed to result in a final peer group that is both more stable over the long term (i.e., has less peer turnover) and that more closely represents the fund’s true peers based on internal investment mandates.
Portfolio managers may have responsibility for multiple American Century mutual funds. In such cases, the performance of each is assigned a percentage weight appropriate for the portfolio manager’s relative levels of responsibility.
Portfolio managers also may have responsibility for portfolios that are managed in a fashion similar to that of other American Century mutual funds. This is the case for the Mid-Cap Value Fund. If the performance of a similarly managed account is considered for purposes of compensation, it is measured in the same way as a comparable American Century mutual fund (i.e., relative to the performance of a benchmark and/or peer group). Performance of the Mid-Cap Value Fund is not separately considered in determining portfolio manager compensation.
A second factor in the bonus calculation relates to the performance of all American Century funds managed according to a particular investment style, such as U.S. growth, U.S. value, global and non-U.S., disciplined equity, fixed- income, and asset allocation. Performance is measured for each product individually as described above and then combined to create an overall composite for the product group. These composites may measure one-year performance (equal weighted) or a combination of one-, three- and five-year performance (equal or asset weighted) depending on the portfolio manager’s responsibilities and products managed. This feature is designed to encourage effective teamwork among fund management teams in achieving long-term investment success for similarly styled portfolios.
A portion of some portfolio managers’ bonuses may be tied to individual performance goals, such as research projects and the development of new products.
Restricted Stock Plans
Portfolio managers are eligible for grants of restricted stock of ACC. These grants are discretionary, and eligibility and availability can vary from year to year. The size of an individual’s grant is determined by individual and product performance as well as other product-specific considerations such as profitability. Grants can appreciate/depreciate in value based on the performance of the ACC stock during the restriction period (generally three to four years).
Deferred Compensation Plans
Portfolio managers are eligible for grants of deferred compensation. These grants are used in limited situations, primarily for retention purposes. Grants are fixed and can appreciate/depreciate in value based on the performance of the American Century mutual funds in which the portfolio manager chooses to invest them.
B-299
Barrow, Hanley, Mewhinney & Strauss, LLC
The portfolio managers of the Large Cap Value Fund are Ray Nixon Jr., Brian F. Quinn, and Lewis Ropp.
Other Accounts Managed:
| Number of Accounts Managed* | Total Assets* | Number of Accounts Managed for which Advisory Fee is Performance- Based* | Total Assets* | |||||||||||||
Ray Nixon Jr. | ||||||||||||||||
Registered investment companies** | 4 | $ | 1,288.8 million | 0 | $ | 0 | ||||||||||
Other pooled investment vehicles | 1 | $ | 104.0 million | 0 | $ | 0 | ||||||||||
Other accounts | 8 | $ | 1,093.4 million | 0 | $ | 0 | ||||||||||
Brian F. Quinn | ||||||||||||||||
Registered investment companies** | 4 | $ | 1,288.8 million | 0 | $ | 0 | ||||||||||
Other pooled investment vehicles | 1 | $ | 104.0 million | 0 | $ | 0 | ||||||||||
Other accounts | 8 | $ | 1,093.4 million | 0 | $ | 0 | ||||||||||
Lewis Ropp*** | ||||||||||||||||
Registered investment companies** | 4 | $ | 1,700.3 million | 0 | $ | 0 | ||||||||||
Other pooled investment vehicles | 1 | $ | 257.9 million | 0 | $ | 0 | ||||||||||
Other accounts | 45 | $ | 4,657.1 million | 0 | $ | 0 | ||||||||||
| * | The information provided is as of September 30, 2016. |
| ** | Does not include the Large Cap Value Fund. |
| *** | Mr. Ropp is a member of a team managing 51 other accounts and $4.4 billion in the large cap value equity strategy. |
Ownership of Securities:
As of September 30, 2016, the portfolio managers did not own any shares of the Large Cap Value Fund.
The portfolio managers of the Small Cap Value Equity Fund are James S. McClure and John P. Harloe.
Other Accounts Managed:
| Number of Accounts Managed* | Total Assets* | Number of Accounts Managed for which Advisory Fee is Performance- Based* | Total Assets* | |||||||||||||
James S. McClure | ||||||||||||||||
Registered investment companies** | 4 | $ | 1,609.9 million | 0 | $ | 0 | ||||||||||
Other pooled investment vehicles | 2 | $ | 10.5 million | 0 | $ | 0 | ||||||||||
Other accounts | 18 | $ | 1,361.9 million | 0 | $ | 0 | ||||||||||
John P. Harloe | ||||||||||||||||
Registered investment companies** | 4 | $ | 1,609.9 million | 0 | $ | 0 | ||||||||||
Other pooled investment vehicles | 2 | $ | 10.5 million | 0 | $ | 0 | ||||||||||
Other accounts | 18 | $ | 1,361.9 million | 0 | $ | 0 | ||||||||||
| * | The information provided is as of September 30, 2016. |
| ** | Does not include the Small Cap Value Equity Fund. |
B-300
Ownership of Securities:
As of September 30, 2016, the portfolio managers did not own any shares of the Small Cap Value Equity Fund.
Conflicts of Interest:
Actual or potential conflicts of interest may arise when a portfolio manager has management responsibilities to more than one account (including the Large Cap Value Fund and Small Cap Value Equity Fund). Barrow Hanley manages potential conflicts between funds or with other types of accounts through allocation policies and procedures, internal review processes, and oversight by directors and independent third parties to ensure that no client, regardless of type or fee structure, is intentionally favored or disfavored at the expense of another. Allocation policies are designed to address potential conflicts in situations where two or more funds or accounts participate in investment decisions involving the same securities.
Compensation:
The discussion below describes the portfolio managers’ compensation as of September 30, 2016.
Compensation, or remuneration, is paid or awarded to Barrow Hanley employees for the services they provide to the Firm. In addition to base salary, all Barrow Hanley portfolio managers and analysts share in a bonus pool that is distributed semi-annually. Portfolio managers and analysts are rated on their value added to the team-oriented investment process. Total compensation is awarded with respect to all accounts managed, and does not distinguish between specific accounts managed by a portfolio manager and does not encourage excessive risk-taking, Bonuses are paid at the discretion of the Firm.
The compensation of portfolio managers is not directly tied to fund performance or growth in assets for any fund or other account managed by a portfolio manager and portfolio managers are not compensated for bringing in new business. Growth in assets from the appreciation of existing assets and/or growth in new assets will increase revenues and profit. The consistent, long-term growth in assets at any investment firm is to a great extent, dependent upon the success of the portfolio management team. The compensation of the portfolio management team at Barrow Hanley will increase over time, if and when assets continue to grow through competitive performance.
In addition, many of Barrow Hanley’s key investment personnel have a long-term incentive compensation plan in the form of an equity interest in Barrow Hanley.
B-301
BlackRock Investment Management, LLC
Dennis W. Stattman, Dan Chamby, Russ Koesterich, David Clayton, and Kent Hogshire are portfolio managers of the BlackRock Global Allocation Fund.
Other Accounts Managed:
| Number of Accounts Managed* | Total Assets* | Number of Accounts Managed for which Advisory Fee is Performance- Based* | Total Assets* | |||||||||||||
Dennis W. Stattman | ||||||||||||||||
Registered investment companies** | 6 | $ | 61.16 billion | 0 | $ | 0 | ||||||||||
Other pooled investment vehicles | 4 | $ | 22.94 billion | 1 | $ | 809.4 million | ||||||||||
Other accounts | 0 | $ | 0 | 0 | $ | 0 | ||||||||||
Dan Chamby | ||||||||||||||||
Registered investment companies** | 6 | $ | 61.16 billion | 0 | $ | 0 | ||||||||||
Other pooled investment vehicles | 4 | $ | 22.94 billion | 1 | $ | 809.4 million | ||||||||||
Other accounts | 0 | $ | 0 | 0 | $ | 0 | ||||||||||
Russ Koesterich | ||||||||||||||||
Registered investment companies** | 0 | $ | 0 | 0 | $ | 0 | ||||||||||
Other pooled investment vehicles | 0 | $ | 0 | 0 | $ | 0 | ||||||||||
Other accounts | 0 | $ | 0 | 0 | $ | 0 | ||||||||||
David Clayton | ||||||||||||||||
Registered investment companies** | 0 | $ | 0 | 0 | $ | 0 | ||||||||||
Other pooled investment vehicles | 0 | $ | 0 | 0 | $ | 0 | ||||||||||
Other accounts | 0 | $ | 0 | 0 | $ | 0 | ||||||||||
Kent Hogshire | ||||||||||||||||
Registered investment companies** | 0 | $ | 0 | 0 | $ | 0 | ||||||||||
Other pooled investment vehicles | 0 | $ | 0 | 0 | $ | 0 | ||||||||||
Other accounts | 0 | $ | 0 | 0 | $ | 0 | ||||||||||
| * | The information provided is as of September 30, 2016. |
| ** | Does not include the BlackRock Global Allocation Fund. |
Ownership of Securities:
As of September 30, 2016, the portfolio managers did not own any shares of the BlackRock Global Allocation Fund.
Conflicts of Interest:
BlackRock has built a professional working environment, firm-wide compliance culture and compliance procedures and systems designed to protect against potential incentives that may favor one account over another. BlackRock has adopted policies and procedures that address the allocation of investment opportunities, execution of portfolio transactions, personal trading by employees and other potential conflicts of interest that are designed to ensure that all client accounts are treated equitably over time. Nevertheless, BlackRock furnishes investment management and advisory services to numerous clients in addition to the Fund, and BlackRock may, consistent with applicable law, make investment recommendations to other clients or accounts (including accounts which
B-302
are hedge funds or have performance or higher fees paid to BlackRock, or in which portfolio managers have a personal interest in the receipt of such fees), which may be the same as or different from those made to the Fund. In addition, BlackRock, its affiliates and significant shareholders and any officer, director, shareholder or employee may or may not have an interest in the securities whose purchase and sale BlackRock recommends to the Fund. BlackRock, or any of its affiliates or significant shareholders, or any officer, director, shareholder, employee or any member of their families may take different actions than those recommended to the Fund by BlackRock with respect to the same securities. Moreover, BlackRock may refrain from rendering any advice or services concerning securities of companies of which any of BlackRock’s (or its affiliates’ or significant shareholders’) officers, directors or employees are directors or officers, or companies as to which BlackRock or any of its affiliates or significant shareholders or the officers, directors and employees of any of them has any substantial economic interest or possesses material non-public information. Certain portfolio managers also may manage accounts whose investment strategies may at times be opposed to the strategy utilized for a fund. It should also be noted that Messrs. Chamby, Clayton, Hogshire, Koesterich, and Stattman may be managing hedge fund and/or long only accounts, or may be part of a team managing hedge fund and/or long only accounts, subject to incentive fees. Messrs. Chamby, Clayton, Hogshire, Koesterich, and Stattman may therefore be entitled to receive a portion of any incentive fees earned on such accounts.
As a fiduciary, BlackRock owes a duty of loyalty to its clients and must treat each client fairly. When BlackRock purchases or sells securities for more than one account, the trades must be allocated in a manner consistent with its fiduciary duties. BlackRock attempts to allocate investments in a fair and equitable manner among client accounts, with no account receiving preferential treatment. To this end, BlackRock has adopted policies that are intended to ensure reasonable efficiency in client transactions and provide BlackRock with sufficient flexibility to allocate investments in a manner that is consistent with the particular investment discipline and client base, as appropriate.
Compensation:
The discussion below describes the portfolio managers’ compensation as of September 30, 2016.
BlackRock’s financial arrangements with its portfolio managers, its competitive compensation and its career path emphasis at all levels reflect the value senior management places on key resources. Compensation may include a variety of components and may vary from year to year based on a number of factors. The principal components of compensation include a base salary, a performance-based discretionary bonus, participation in various benefits programs and one or more of the incentive compensation programs established by BlackRock.
Base compensation—Generally, portfolio managers receive base compensation based on their position with the firm.
Discretionary Incentive Compensation
Generally, discretionary incentive compensation for Global Allocation portfolio managers is based on a formulaic compensation program. The team’s formulaic portfolio manager compensation program is based on team revenue with a measure of operational efficiency, and pre-tax investment performance relative to benchmark over 1 and 5-year performance periods. In most cases, these benchmarks are the same as the benchmark or benchmarks against which the performance of the funds or other accounts managed by the portfolio managers are measured. BlackRock’s Chief Investment Officers determine the benchmarks or rankings against which the performance of funds and other accounts managed by each portfolio management team is compared and the period of time over which performance is evaluated. With respect to these portfolio managers, such benchmarks for the Fund and other accounts are a combination of S&P 500 Index, FTSE World ex U.S. Index, Bank of America Merrill Lynch Current 5-Year U.S. Treasury Index and Citigroup Non-U.S. Dollar World Government Bond Index.
B-303
A smaller element of portfolio manager discretionary compensation may include consideration of: financial results, expense control, profit margins, strategic planning and implementation, quality of client service, market share, corporate reputation, capital allocation, compliance and risk control, leadership, technology and innovation. These factors are considered collectively by BlackRock management.
Distribution of Discretionary Incentive Compensation
Discretionary incentive compensation is distributed to portfolio managers in a combination of cash and BlackRock, Inc. restricted stock units which vest ratably over a number of years. For some portfolio managers, discretionary incentive compensation is also distributed in deferred cash awards that notionally track the returns of select BlackRock investment products they manage and that vest ratably over a number of years. The BlackRock, Inc. restricted stock units, upon vesting, will be settled in BlackRock, Inc. common stock. Typically, the cash portion of the discretionary incentive compensation, when combined with base salary, represents more than 60% of total compensation for the portfolio managers. Paying a portion of discretionary incentive compensation in BlackRock, Inc. stock puts compensation earned by a portfolio manager for a given year “at risk” based on BlackRock’s ability to sustain and improve its performance over future periods. Providing a portion of discretionary incentive compensation in deferred cash awards that notionally track the BlackRock investment products they manage provides direct alignment with investment product results.
Long-Term Incentive Plan Awards From time to time long-term incentive equity awards are granted to certain key employees to aid in retention, align their interests with long-term shareholder interests and motivate performance. Equity awards are generally granted in the form of BlackRock, Inc. restricted stock units that, once vested, settle in BlackRock, Inc. common stock. With the exception of Messrs. Hogshire and Koesterich, the portfolio managers of this Fund have unvested long-term incentive awards.
Deferred Compensation Program—A portion of the compensation paid to eligible United States based BlackRock employees may be voluntarily deferred at their election for defined periods of time into an account that tracks the performance of certain of the firm’s investment products. Any portfolio manager who is either a managing director or director at BlackRock with compensation above a specified threshold is eligible to participate in the deferred compensation program.
Other Compensation Benefits
In addition to base salary and discretionary incentive compensation, portfolio managers may be eligible to receive or participate in one or more of the following:
Incentive Savings Plans—BlackRock, Inc. has created a variety of incentive savings plans in which BlackRock employees are eligible to participate, including a 401(k) plan, the BlackRock Retirement Savings Plan (RSP), and the BlackRock Employee Stock Purchase Plan (ESPP). The employer contribution components of the RSP include a company match equal to 50% of the first 8% of eligible pay contributed to the plan capped at $5,000 per year, and a company retirement contribution equal to 3-5% of eligible compensation up to the IRS limit ($265,000 for 2016). The RSP offers a range of investment options, including registered investment companies and collective investment funds managed by the firm. BlackRock contributions follow the investment direction set by participants for their own contributions or, absent participant investment direction, are invested into a target date fund that corresponds to, or is closest to, the year in which the participant attains age 65. The ESPP allows for investment in BlackRock common stock at a 5% discount on the fair market value of the stock on the purchase date. Annual participation in the ESPP is limited to the purchase of 1,000 shares of common stock or a dollar value of $25,000 based on its fair market value on the purchase date. All of the eligible portfolio managers are eligible to participate in these plans.
B-304
Brandywine Global Investment Management, LLC
The portfolio managers of the Diversified Value Fund are Joseph J. Kirby, Henry F. Otto, and Steven M. Tonkovich.
Other Accounts Managed:
| Number of Accounts Managed* | Total Assets* | Number of Accounts Managed for which Advisory Fee is Performance- Based* | Total Assets* | |||||||||||||
Joseph J. Kirby | ||||||||||||||||
Registered investment companies** | 5 | $ | 6,881,648,577 | 0 | $ | 0 | ||||||||||
Other pooled investment vehicles | 1 | $ | 3,112,674 | 0 | $ | 0 | ||||||||||
Other accounts | 4 | $ | 28,336,863 | 0 | $ | 0 | ||||||||||
Henry F. Otto | ||||||||||||||||
Registered investment companies** | 8 | $ | 8,667,860,909 | 0 | $ | 0 | ||||||||||
Other pooled investment vehicles | 13 | $ | 508,161,974 | 0 | $ | 0 | ||||||||||
Other accounts | 13 | $ | 394,991,338 | 0 | $ | 0 | ||||||||||
Steven M. Tonkovich | ||||||||||||||||
Registered investment companies** | 8 | $ | 8,465,641,370 | 0 | $ | 0 | ||||||||||
Other pooled investment vehicles | 13 | $ | 508,161,974 | 0 | $ | 0 | ||||||||||
Other accounts | 13 | $ | 394,991,338 | 0 | $ | 0 | ||||||||||
| * | The information provided is as of September 30, 2016. |
| ** | Does not include the Diversified Value Fund. |
Ownership of Securities:
As of September 30, 2016, the portfolio managers did not own any shares of the Diversified Value Fund.
Conflicts of Interest:
Brandywine Global believes that there are no material conflicts of interest that arise in connection with its simultaneous management of its various portfolios. All portfolios within a given investment style are treated in a similar fashion for all investment decisions, unless a client provides specific investment restrictions. All trade executions of a given investment decision are allocated in an unbiased manner to avoid any conflict over allocation of investment opportunities.
Compensation:
The discussion below describes the portfolio managers’ compensation as of September 30, 2016.
All Portfolio Managers receive a competitive base salary. In addition, from the firm’s profits, a bonus is paid quarterly and based on the performance of their investment strategies relative to a relevant peer-group universe over one-quarter, one-, three- and five-year time periods. After this performance-based incentive compensation is allocated, profits associated with individual product groups are allocated as follows: a majority is retained within the product group and the remainder is allocated to a pool shared by all product groups. More subjective measurements of an individual’s contributions to the success of their product group and to the overall success of the firm are considered as part of the individual allocation decision. Finally, all investment professionals are eligible for options on Legg Mason stock, provided from time-to-time at Legg Mason’s discretion to its investment management subsidiaries. Brandywine Global believes this system achieves the goal of retaining top-quality investment professionals, as it provides extremely competitive compensation with entrepreneurial potential, and of fostering excellent performance, growth, and teamwork.
B-305
Federated Clover Investment Advisors
The portfolio managers of the Small Company Value Fund are Stephen K. Gutch and Martin A. Jarzebowski.
Other Accounts Managed:
| Number of Accounts Managed* | Total Assets* | Number of Accounts Managed for which Advisory Fee is Performance- Based* | Total Assets* | |||||||||||||
Stephen K. Gutch | ||||||||||||||||
Registered investment companies** | 2 | $ | 932.0 million | 0 | $ | 0 | ||||||||||
Other pooled investment vehicles | 0 | $ | 0 | 0 | $ | 0 | ||||||||||
Other accounts*** | 19 | $ | 1.0 billion | 0 | $ | 0 | ||||||||||
Martin A. Jarzebowski | ||||||||||||||||
Registered investment companies** | 2 | $ | 932.0 million | 0 | $ | 0 | ||||||||||
Other pooled investment vehicles | 0 | $ | 0 | 0 | $ | 0 | ||||||||||
Other accounts*** | 2 | $ | 242.5 million | 0 | $ | 0 | ||||||||||
| * | The information provided is as of September 30, 2016. |
| ** | Does not include the Small Company Value Fund. |
| *** | Please note there are other privately managed accounts for which the portfolio manager is only responsible for creating the investment model, but Federated Clover employs a team of portfolio coordinators who are charged with the day-to-day management of these other privately managed accounts. |
Ownership of Securities:
As of September 30, 2016, the portfolio managers did not own any shares of the Small Company Value Fund.
Conflicts of Interest:
As a general matter, certain conflicts of interest may arise in connection with a portfolio manager’s management of a fund’s investments, on the one hand, and the investments of other accounts for which the portfolio manager is responsible, on the other. For example, it is possible that the various accounts managed could have different investment strategies that, at times, might conflict with one another to the possible detriment of the Fund. Alternatively, to the extent that the same investment opportunities might be desirable for more than one account, possible conflicts could arise in determining how to allocate them. Other potential conflicts might include conflicts created by specific portfolio manager compensation arrangements, (including, for example, the allocation or weighting given to the performance of the Fund or other accounts or activities for which the portfolio manager is responsible in calculating the portfolio manager’s compensation), and conflicts relating to selection of brokers or dealers to execute fund portfolio trades and/or specific uses of commissions from Fund portfolio trades (for example, research or “soft dollars”). Federated Clover has adopted policies and procedures and has structured the portfolio managers’ compensation in a manner reasonably designed to safeguard the Fund from being negatively affected as a result of any such potential conflicts.
Compensation:
The discussion below describes the portfolio managers’ compensation as of September 30, 2016.
Stephen K. Gutch and Martin A. Jarzebowski are paid a fixed base salary and a variable annual incentive. Base salary is determined within a market competitive, position-specific salary range, based on the portfolio manager’s experience and performance. The annual incentive amount is determined based primarily on Investment Product Performance (“IPP”) and, to a lesser extent, Financial Success, and may be paid entirely in
B-306
cash, or in a combination of cash and restricted stock of Federated Investors, Inc. (“Federated”). The total combined annual incentive opportunity is intended to be competitive in the market for this portfolio manager role.
For purposes of calculating the annual incentive amount, each mutual fund and institutional account managed by Federated Clover is categorized as reflecting one of several designated “Strategies.” The annual incentive amount is based on the current calendar year asset-weighted composite IPP of each Strategy, which is measured on a rolling one, three, and five calendar year pre-tax gross total return basis versus the Strategy’s designated peer group of comparable accounts and versus the Strategy’s benchmark (i.e., Russell 2000 Value Index). Performance periods are adjusted if a portfolio manager has been managing an account for less than five years; accounts with less than one year of performance history under a portfolio manager may be excluded. As noted above, Messrs. Gutch and Jarzebowski are also the portfolio managers for other funds/accounts in addition to the Fund. Such other funds/accounts may be categorized as reflecting different Strategies, which may have different peer groups and benchmarks. The performance of the Strategy to which the Fund is assigned currently represents a significant portion of the calculation (but can be adjusted periodically). A portion of the bonus tied to the IPP score may be adjusted based on management’s assessment of overall contributions to fund performance and any other factors as deemed relevant. As a separate matter, pursuant to the terms of a business acquisition agreement, portfolio managers may receive additional consideration based on the achievement of specified revenue targets.
The Financial Success category is designed to tie the portfolio manager’s bonus, in part, to Federated’s overall financial results. Funding for the Financial Success category may be determined on a product or asset class basis, as well as on corporate financial results. Senior Management determines individual Financial Success bonuses on a discretionary basis, considering overall contributions and any other factors deemed relevant.
B-307
Frontier Capital Management Company, LLC
The portfolio managers of the Mid Cap Growth Equity II Fund are Stephen M. Knightly and Christopher J. Scarpa.
Other Accounts Managed:
| Number of Accounts Managed* | Total Assets* | Number of Accounts Managed for which Advisory Fee is Performance- Based* | Total Assets* | |||||||||||||
Stephen M. Knightly | ||||||||||||||||
Registered investment companies** | 3 | $ | 2.878 billion | 1 | $ | 1.656 billion | ||||||||||
Other pooled investment vehicles | 1 | $ | 162 million | 0 | $ | 0 | ||||||||||
Other accounts | 36 | $ | 2.048 billion | 0 | $ | 0 | ||||||||||
Christopher J. Scarpa | ||||||||||||||||
Registered investment companies** | 3 | $ | 2.878 billion | 1 | $ | 1.656 billion | ||||||||||
Other pooled investment vehicles | 1 | $ | 162 million | 0 | $ | 0 | ||||||||||
Other accounts | 36 | $ | 2.048 billion | 0 | $ | 0 | ||||||||||
| * | The information provided is as of September 30, 2016. |
| ** | Does not include the Mid Cap Growth Equity II Fund. |
Ownership of Securities:
As of September 30, 2016, the portfolio managers did not own any shares of the Mid Cap Growth Equity II Fund.
Conflicts of Interest:
In connection with its management of clients’ accounts, Frontier is subject to a number of actual or apparent conflicts of interest. These conflicts may arise when a portfolio manager has day-to-day management responsibilities with respect to more than one fund or other account. A portfolio manager potentially could give favorable treatment to some accounts for a variety of reasons, including favoring larger accounts, accounts that have a different advisory fee arrangement (including any accounts that pay performance-based fees) or accounts in which the portfolio manager has a personal investment. In addition, conflicts may arise relating to the allocation of investments among accounts with similar investment objectives but managed by different portfolio managers.
Frontier’s portfolio managers typically manage multiple accounts. Generally, however, accounts within a particular investment strategy (e.g., mid cap growth) with similar objectives are managed similarly. Accordingly, portfolio holdings and industry and sector exposure tend to be similar across a group of accounts in the same strategy with similar objectives, which tend to minimize the potential for conflicts of interest.
Frontier has adopted trade allocation and aggregation policies that seek to treat all clients fairly and equitably. These policies address the allocation of limited investment opportunities, such as IPOs, and the allocation of transactions and aggregations of orders across multiple accounts. Investment personnel of Frontier or its affiliates may be permitted to be commercially or professionally involved with an issuer of securities. Any potential conflicts of interest from such involvement would be monitored for compliance with the Frontier’s Code of Ethics.
Compensation:
The discussion below describes the portfolio managers’ compensation as of September 30, 2016.
B-308
Frontier’s portfolio manager compensation structure is designed to align the interests of portfolio managers with those of the shareholders whose assets they manage. Frontier’s portfolio manager compensation program consists of a base salary, annual bonus, and participation in company-funded retirement plans. In addition, all of Frontier’s portfolio managers are partners at Frontier, which entitles them to share in the firm’s profits and the long-term growth of the firm. The annual bonus is variable and based partially or primarily upon management-fee revenues generated from client accounts.
B-309
Harris Associates L.P.
The portfolio managers of the Focused Value Fund are Anthony P. Coniaris, M. Colin Hudson, and Robert F. Bierig.
Other Accounts Managed:
| Number of Accounts Managed* | Total Assets* | Number of Accounts Managed for which Advisory Fee is Performance- Based* | Total Assets* | |||||||||||||
Anthony P. Coniaris | ||||||||||||||||
Registered investment companies** | 2 | $ | 5,150,359,160.66 | 0 | $ | 0 | ||||||||||
Other pooled investment vehicles | 3 | $ | 546,426,821.54 | 0 | $ | 0 | ||||||||||
Other accounts | 0 | $ | 0 | 0 | $ | 0 | ||||||||||
M. Colin Hudson | ||||||||||||||||
Registered investment companies** | 4 | $ | 16,789,935,844.44 | 0 | $ | 0 | ||||||||||
Other pooled investment vehicles | 3 | $ | 437,134,459.54 | 0 | $ | 0 | ||||||||||
Other accounts | 1 | $ | 236,283,250.02 | 0 | $ | 0 | ||||||||||
Robert F. Bierig | ||||||||||||||||
Registered investment companies** | 1 | $ | 153,013,811.97 | 0 | $ | 0 | ||||||||||
Other pooled investment vehicles | 3 | $ | 366,326,809.37 | 0 | $ | 0 | ||||||||||
Other accounts | 20 | $ | 19,780,509.31 | 0 | $ | 0 | ||||||||||
| * | The information provided is as of September 30, 2016. |
| ** | Does not include the Focused Value Fund. |
Ownership of Securities:
As of September 30, 2016, the portfolio managers did not own any shares of the Focused Value Fund.
The portfolio managers of the Overseas Fund are David G. Herro and Michael L. Manelli.
Other Accounts Managed:
| Number of Accounts Managed* | Total Assets* | Number of Accounts Managed for which Advisory Fee is Performance- Based* | Total Assets* | |||||||||||||
David G. Herro | ||||||||||||||||
Registered investment companies** | 12 | $ | 35,068,425,852.86 | 0 | $ | 0 | ||||||||||
Other pooled investment vehicles | 28 | $ | 7,686,104,908.92 | 0 | $ | 0 | ||||||||||
Other accounts | 48 | $ | 11,156,778,925.94 | 1 | $ | 153,536,018.27 | ||||||||||
B-310
| Number of Accounts Managed* | Total Assets* | Number of Accounts Managed for which Advisory Fee is Performance- Based* | Total Assets* | |||||||||||||
Michael L. Manelli | ||||||||||||||||
Registered investment companies** | 3 | $ | 2,760,992,161.47 | 0 | $ | 0 | ||||||||||
Other pooled investment vehicles | 15 | $ | 2,258,458,558.50 | 0 | $ | 0 | ||||||||||
Other accounts | 25 | $ | 5,439,931,536.02 | 1 | $ | 153,536,018.27 | ||||||||||
| * | The information provided is as of September 30, 2016. |
| ** | Does not include the Overseas Fund. |
Ownership of Securities:
As of September 30, 2016, the portfolio managers did not own any shares of the Overseas Fund.
Conflicts of Interest:
Conflicts of interest may arise in the allocation of investment opportunities and the allocation of aggregated orders among the Funds and the other accounts managed by the portfolio managers. A portfolio manager potentially could give favorable treatment to some accounts for a variety of reasons, including favoring larger accounts, accounts that have a different advisory fee arrangement (including any accounts that pay performance-based fees), accounts of affiliated companies, or accounts in which the portfolio manager has a personal investment. With respect to the allocation of investment opportunities, Harris makes decisions to recommend, purchase, sell or hold securities for all of its client accounts, including the Funds, based on the specific investment objectives, guidelines, restrictions and circumstances of each account. It is Harris’ policy to allocate investment opportunities to each account, including the Funds, over a period of time on a fair and equitable basis relative to its other accounts. With respect to the allocation of aggregated orders, each account that participates in the aggregated order will participate at the average share price, and where the order has not been completely filled, each institutional account, including the Funds, will generally participate on a pro rata basis. Harris has compliance policies and procedures in place that it believes are reasonably designed to mitigate these conflicts. However, there is no guarantee that such procedures will detect each and every situation in which an actual or potential conflict may arise.
Compensation:
The discussion below describes the portfolio managers’ compensation as of September 30, 2016.
Each of Harris’ portfolio managers is compensated solely by Harris. Compensation for each of the portfolio managers is based on Harris’ assessment of the individual’s long-term contribution to the investment success of the firm. Each portfolio manager receives a base salary and participates in a discretionary bonus pool. In addition most of the portfolio managers also participate in a long-term compensation plan that provides current compensation to certain key employees and deferred compensation to both current and former key employees. The compensation plan consists of bonus units awarded to participants that vest and are paid out over a period of time.
The determination of the amount of each portfolio manager’s base salary and discretionary bonus pool participation and, where applicable, participation in the long-term compensation plan is based on a variety of qualitative and quantitative factors. The factor given the most significant weight is the subjective assessment of the individual’s contribution to the overall investment results of Harris’ U.S. or international investment group, whether as a portfolio manager, a research analyst, or both.
B-311
The quantitative factors considered in evaluating the contribution of a portfolio manager include the performance of the portfolios managed by that individual relative to benchmarks, peers and other portfolio managers, as well as the assets under management in the Funds and other accounts managed by the portfolio manager. A portfolio manager’s compensation is not based solely on an evaluation of the performance of the Funds or the amount of Fund assets. Performance is measured in a number of ways, including by Fund, by other accounts and by strategy, and is compared to one or more benchmarks, including: S&P 500 Index, Russell Midcap Value Index, Russell 1000® Value Index, Lipper Balanced Funds Index, 60/40 S&P/Barclays (60% S&P 500 Index and 40% Barclays Bond Index), MSCI World Index, MSCI World ex U.S. Index, MSCI World ex U.S. Small Cap Index and Harris’ approved lists of stocks, depending on whether the portfolio manager manages accounts in a particular strategy for which a given benchmark would be applicable. Performance is measured over shorter- and longer-term periods, including one year, three years, five years, ten years, since a fund’s or an account’s inception or since the portfolio manager has been managing a fund or account, as applicable. Performance is measured on a pre-tax and after-tax basis to the extent such information is available.
If a portfolio manager also serves as a research analyst, then his compensation is also based on the contribution made to Harris in that role. The specific quantitative and qualitative factors considered in evaluating a research analyst’s contributions include, among other things, new investment ideas, the performance of investment ideas covered by the analyst during the current year as well as over longer-term periods, the portfolio impact of the analyst’s investment ideas, other contributions to the research process, and an assessment of the quality of analytical work. In addition, an individual’s other contributions to Harris, such as a role in investment thought leadership and management, are also taken into account in the overall compensation process.
B-312
Huber Capital Management, LLC
The portfolio manager of the Large Cap Value Fund is Joseph Huber.
Other Accounts Managed:
| Number of Accounts Managed* | Total Assets* | Number of Accounts Managed for which Advisory Fee is Performance- Based* | Total Assets* | |||||||||||||
Joseph Huber | ||||||||||||||||
Registered investment companies** | 4 | $ | 229.0 million | 0 | $ | 0 | ||||||||||
Other pooled investment vehicles | 1 | $ | 123.8 million | 1 | $ | 123.8 million | ||||||||||
Other accounts | 34 | $ | 2,308.5 million | 0 | $ | 0 | ||||||||||
| * | The information provided is as of September 30, 2016. |
| ** | Does not include the Large Cap Value Fund. |
Ownership of Securities:
As of September 30, 2016, the portfolio manager did not own any shares of the Large Cap Value Fund.
Conflicts of Interest:
The portfolio manager who has day-to-day management responsibilities with respect to other accounts may be presented with potential or actual conflicts of interest.
The management of other accounts may result in the portfolio manager devoting unequal time and attention to the management of funds and/or other accounts. With respect to securities transactions for funds, Huber Capital Management determines which broker to use to execute each transaction consistent with its duty to seek best execution of the transaction. If Huber Capital Management believes that the purchase or sale of a security is in the best interest of more than one of its clients, it may aggregate the securities to be purchased or sold to obtain favorable execution and/or lower brokerage commissions. Huber Capital Management will allocate securities so purchased or sold in the manner that it considers being equitable and consistent with its fiduciary obligations to its clients.
Huber Capital Management does not anticipate any conflicts of interest between management of the funds and accounts managed by the firm. Huber Capital Management’s brokerage and trading policies ensure that no conflicts arise between transactions involving funds and those involving separately managed accounts.
Compensation:
The discussion below describes the portfolio managers’ compensation as of September 30, 2016.
The portfolio manager is compensated with a salary and bonus package. The portfolio manager is supported by the full research team of Huber Capital Management. Compensation is used to reward, attract and retain high quality investment professionals. An investment professional such as the portfolio manager has a base salary and is eligible for an annual bonus, which may be paid in the form of either cash or stock.
Huber Capital Management believes consistent execution of the proprietary research process results in superior, risk-adjusted portfolio returns. It is the quality of the investment professional’s execution of this process rather than the performance of particular securities that is evaluated in determining compensation. Compensation likewise is not tied to performance of funds or separate accounts, specific industries within the funds or separate
B-313
accounts or to any type of asset or revenue-related objective, other than to the extent that the overall revenues of Huber Capital Management attributable to such factors may affect the size of Huber Capital Management’s overall bonus pool.
Bonuses and salaries for investment professionals are determined by the Chief Executive Officer (the managing member) of Huber Capital Management using tools which may include, but are not limited to, annual evaluations, compensation surveys, feedback from other employees and advice from outside counsel. The amount of the bonus usually is shaped by the total amount of Huber Capital Management’s bonus pool available for the year, which is generally a function of net income, but no investment professional receives a bonus that is a pre-determined percentage of net income.
The portfolio manager does not participate in a company-sponsored retirement plan and receives standard benefits commensurate with the other employees of Huber Capital Management. The portfolio manager does not receive deferred compensation.
B-314
Invesco Advisers, Inc.
The portfolio managers of the Small Company Value Fund are Andrew Waisburd, Glen Murphy, and Charles Ko.
Other Accounts Managed:
| Number of Accounts Managed* | Total Assets* | Number of Accounts Managed for which Advisory Fee is Performance- Based* | Total Assets* | |||||||||||||
Andrew Waisburd | ||||||||||||||||
Registered investment companies** | 14 | $ | 8,023 million | 0 | $ | 0 | ||||||||||
Other pooled investment vehicles | 8 | $ | 700 million | 0 | $ | 0 | ||||||||||
Other accounts*** | 21 | $ | 3,305 million | 4 | $ | 437 million | ||||||||||
Glen Murphy | ||||||||||||||||
Registered investment companies** | 11 | $ | 7,835 million | 0 | $ | 0 | ||||||||||
Other pooled investment vehicles | 8 | $ | 700 million | 0 | $ | 0 | ||||||||||
Other accounts*** | 21 | $ | 3,305 million | 4 | $ | 437 million | ||||||||||
Charles Ko | ||||||||||||||||
Registered investment companies** | 14 | $ | 8,023 million | 0 | $ | 0 | ||||||||||
Other pooled investment vehicles | 8 | $ | 700 million | 0 | $ | 0 | ||||||||||
Other accounts*** | 21 | $ | 3,305 million | 4 | $ | 437 million | ||||||||||
| * | The information provided is as of September 30, 2016. |
| ** | Does not include the Small Company Value Fund. |
Ownership of Securities:
As of September 30, 2016, the portfolio managers did not own any shares of the Small Company Value Fund.
Conflicts of Interest:
Actual or apparent conflicts of interest may arise when a portfolio manager has day-to-day management responsibilities with respect to more than one fund or other account. More specifically, portfolio managers who manage multiple funds and/or other accounts may be presented with one or more of the following potential conflicts:
| · | The management of multiple funds and/or other accounts may result in a portfolio manager devoting unequal time and attention to the management of each fund and/or other account. Invesco seeks to manage such competing interests for the time and attention of portfolio managers by having portfolio managers focus on a particular investment discipline. Most other accounts managed by a portfolio manager are managed using the same investment models that are used in connection with the management of the funds. |
| · | If a portfolio manager identifies a limited investment opportunity which may be suitable for more than one fund or other account, a fund may not be able to take full advantage of that opportunity due to an allocation of filled purchase or sale orders across all eligible funds and other accounts. To deal with these situations, Invesco has adopted procedures for allocating portfolio transactions across multiple accounts. |
B-315
| · | Invesco determines which broker to use to execute each order for securities transactions for the funds, consistent with its duty to seek best execution of the transaction. However, for certain other accounts (such as mutual funds for which Invesco or an affiliate acts as sub-adviser, other pooled investment vehicles that are not registered mutual funds, and other accounts managed for organizations and individuals), Invesco may be limited by the client with respect to the selection of brokers or may be instructed to direct trades through a particular broker. In these cases, trades for a fund in a particular security may be placed separately from, rather than aggregated with, such other accounts. Having separate transactions with respect to a security may temporarily affect the market price of the security or the execution of the transaction, or both, to the possible detriment of the fund or other account(s) involved. |
| · | Finally, the appearance of a conflict of interest may arise where Invesco has an incentive, such as a performance-based management fee, which relates to the management of one fund or account but not all funds and accounts for which a portfolio manager has day-to-day management responsibilities. |
Invesco has adopted certain compliance procedures which are designed to address these types of conflicts. However, there is no guarantee that such procedures will detect each and every situation in which a conflict arises.
Compensation:
The discussion below describes the portfolio managers’ compensation as of September 30, 2016.
Invesco seeks to maintain a compensation program that is competitively positioned to attract and retain high-caliber investment professionals. Portfolio managers receive a base salary, an incentive bonus opportunity and an equity compensation opportunity. Portfolio manager compensation is reviewed and may be modified each year as appropriate to reflect changes in the market, as well as to adjust the factors used to determine bonuses to promote competitive fund performance. Invesco evaluates competitive market compensation by reviewing compensation survey results conducted by an independent third party of investment industry compensation. Each portfolio manager’s compensation consists of the following three elements:
Base Salary. Each portfolio manager is paid a base salary. In setting the base salary, Invesco’s intention is to be competitive in light of the particular portfolio manager’s experience and responsibilities.
Annual Bonus. The portfolio managers are eligible, along with other employees of Invesco, to participate in a discretionary year-end bonus pool. The Compensation Committee of Invesco Ltd. reviews and approves the amount of the bonus pool available considering investment performance and financial results in its review. In addition, while having no direct impact on individual bonuses, assets under management are considered when determining the starting bonus funding levels. Each portfolio manager is eligible to receive an annual cash bonus which is based on quantitative (i.e. investment performance) and non-quantitative factors (which may include, but are not limited to, individual performance, risk management and teamwork).
Each portfolio manager’s compensation is linked to the pre-tax investment performance of the funds/accounts managed by the portfolio manager as described in Table 1 below.
Table 1
Sub-Adviser | Performance time period1 | |
Invesco2 | One-, Three- and Five-year performance against fund peer group. |
| 1 | Rolling time periods based on calendar year-end. |
| 2 | Portfolio Managers may be granted an annual deferral award that vests on a pro-rata basis over a four year period and final payments are based on the performance of eligible funds selected by the portfolio manager at the time the award is granted. |
B-316
High investment performance (against applicable peer group and/or benchmarks) would deliver compensation generally associated with top pay in the industry (determined by reference to the third-party provided compensation survey information) and poor investment performance (versus applicable peer group) would result in low bonus compared to the applicable peer group or no bonus at all. These decisions are reviewed and approved collectively by senior leadership which has responsibility for executing the compensation approach across the organization.
Deferred / Long Term Compensation. Portfolio managers may be granted an annual deferral award that allows them to select receipt of shares of certain Invesco Funds with a vesting period as well as common shares and/or restricted shares of Invesco Ltd. stock from pools determined from time to time by the Compensation Committee of Invesco Ltd.’s Board of Directors. Awards of deferred/long term compensation typically vest over time, so as to create incentives to retain key talent.
Portfolio managers also participate in benefit plans and programs available generally to all employees.
B-317
J.P. Morgan Investment Management Inc.
The portfolio managers of the Diversified International Fund are Gerd Woort-Menker, Jeroen Huysinga, Georgina Perceval Maxwell, and Demetris Georghiou. Upon his retirement in the 2nd quarter of 2017, Gerd Woort-Menker will no longer be a portfolio manager of the Fund.
Other Accounts Managed:
| Number of Accounts Managed* | Total Assets* | Number of Accounts Managed for which Advisory Fee is Performance- Based* | Total Assets* | |||||||||||||
Gerd Woort-Menker | ||||||||||||||||
Registered investment companies** | 11 | $ | 5,564 million | 0 | $ | 0 | ||||||||||
Other pooled investment vehicles | 8 | $ | 3,710 million | 0 | $ | 0 | ||||||||||
Other accounts | 2 | $ | 445 million | 0 | $ | 0 | ||||||||||
Jeroen Huysinga | ||||||||||||||||
Registered investment companies** | 11 | $ | 5,779 million | 0 | $ | 0 | ||||||||||
Other pooled investment vehicles | 9 | $ | 6,146 million | 0 | $ | 0 | ||||||||||
Other accounts | 23 | $ | 9,431 million | 3 | $ | 4,790 million | ||||||||||
Georgina Perceval Maxwell | ||||||||||||||||
Registered investment companies** | 12 | $ | 7,258 million | 0 | $ | 0 | ||||||||||
Other pooled investment vehicles | 4 | $ | 1,529 million | 0 | $ | 0 | ||||||||||
Other accounts | 7 | $ | 2,340 million | 0 | $ | 0 | ||||||||||
Demetris Georghiou | ||||||||||||||||
Registered investment companies** | 10 | $ | 5,132 million | 0 | $ | 0 | ||||||||||
Other pooled investment vehicles | 5 | $ | 254 million | 0 | $ | 0 | ||||||||||
Other accounts | 1 | $ | 466 million | 0 | $ | 0 | ||||||||||
| * | The information provided is as of September 30, 2016. |
| ** | Does not include the Diversified International Fund. |
Ownership of Securities:
As of September 30, 2016, the portfolio managers did not own any shares of the Diversified International Fund.
The portfolio managers of the Overseas Fund are Gerd Woort-Menker, Jeroen Huysinga, Georgina Perceval Maxwell, and Demetris Georghiou. Upon his retirement in the 2nd quarter of 2017, Gerd Woort-Menker will no longer be a portfolio manager of the Fund.
Other Accounts Managed:
| Number of Accounts Managed* | Total Assets* | Number of Accounts Managed for which Advisory Fee is Performance- Based* | Total Assets* | |||||||||||||
Gerd Woort-Menker | ||||||||||||||||
Registered investment companies** | 11 | $ | 5,465 million | 0 | $ | 0 | ||||||||||
Other pooled investment vehicles | 8 | $ | 3,710 million | 0 | $ | 0 | ||||||||||
Other accounts | 2 | $ | 445 million | 0 | $ | 0 | ||||||||||
B-318
| Number of Accounts Managed* | Total Assets* | Number of Accounts Managed for which Advisory Fee is Performance- Based* | Total Assets* | |||||||||||||
Jeroen Huysinga | ||||||||||||||||
Registered investment companies** | 11 | $ | 5,680 million | 0 | $ | |||||||||||
Other pooled investment vehicles | 9 | $ | 6,146 million | 0 | $ | |||||||||||
Other accounts | 23 | $ | 9,431 million | 3 | $ | 4,790 million | ||||||||||
Georgina Perceval Maxwell | ||||||||||||||||
Registered investment companies** | 12 | $ | 7,159 million | 0 | $ | 0 | ||||||||||
Other pooled investment vehicles | 4 | $ | 1,529 million | 0 | $ | 0 | ||||||||||
Other accounts | 7 | $ | 2,340 million | 0 | $ | 0 | ||||||||||
Demetris Georghiou | ||||||||||||||||
Registered investment companies** | 10 | $ | 5,033 million | 0 | $ | 0 | ||||||||||
Other pooled investment vehicles | 5 | $ | 254 million | 0 | $ | 0 | ||||||||||
Other accounts | 1 | $ | 466 million | 0 | $ | 0 | ||||||||||
| * | The information provided is as of September 30, 2016. |
| ** | Does not include the Overseas Fund. |
Ownership of Securities:
As of September 30, 2016, the portfolio managers did not own any shares of the Overseas Fund.
Conflicts of Interest:
The potential for conflicts of interest exists when portfolio managers manage other accounts with similar investment objectives and strategies as the Fund (“Similar Accounts”). Potential conflicts may include, for example, conflicts between investment strategies and conflicts in the allocation of investment opportunities.
Responsibility for managing J.P. Morgan’s and its affiliates’ clients’ portfolios is organized according to investment strategies within asset classes. Generally, client portfolios with similar strategies are managed by portfolio managers in the same portfolio management group using the same objectives, approach and philosophy. Underlying sectors or strategy allocations within a larger portfolio are likewise managed by portfolio managers who use the same approach and philosophy as similarly managed portfolios. Therefore, portfolio holdings, relative position sizes and industry and sector exposures tend to be similar across similar portfolios and strategies, which minimizes the potential for conflicts of interest.
J.P. Morgan and/or its affiliates (“JPMorgan Chase”) perform investment services, including rendering investment advice, to varied clients. J.P. Morgan, JPMorgan Chase and its or their directors, officers, agents, and/or employees may render similar or differing investment advisory services to clients and may give advice or exercise investment responsibility and take such other action with respect to any of its other clients that differs from the advice given or the timing or nature of action taken with respect to another client or group of clients. It is J.P. Morgan’s policy, to the extent practicable, to allocate, within its reasonable discretion, investment opportunities among clients over a period of time on a fair and equitable basis. One or more of J.P. Morgan’s other client accounts may at any time hold, acquire, increase, decrease, dispose, or otherwise deal with positions in investments in which another client account may have an interest from time-to-time.
J.P. Morgan, JPMorgan Chase, and any of its or their directors, partners, officers, agents or employees, may also buy, sell, or trade securities for their own accounts or the proprietary accounts of J.P. Morgan and/or JPMorgan Chase. J.P. Morgan and/or JPMorgan Chase, within their discretion, may make different investment
B-319
decisions and other actions with respect to their own proprietary accounts than those made for client accounts, including the timing or nature of such investment decisions or actions. Further, J.P. Morgan is not required to purchase or sell for any client account securities that it, JPMorgan Chase, and any of its or their employees, principals, or agents may purchase or sell for their own accounts or the proprietary accounts of J.P. Morgan, or JPMorgan Chase or its clients.
J.P. Morgan and/or its affiliates may receive more compensation with respect to certain Similar Accounts than that received with respect to the Fund or may receive compensation based in part on the performance of certain Similar Accounts. This may create a potential conflict of interest for J.P. Morgan and its affiliates or the portfolio managers by providing an incentive to favor these Similar Accounts when, for example, placing securities transactions. In addition, J.P. Morgan or its affiliates could be viewed as having a conflict of interest to the extent that J.P. Morgan or an affiliate has a proprietary investment in Similar Accounts, the portfolio managers have personal investments in Similar Accounts or the Similar Accounts are investment options in J.P. Morgan’s or its affiliates’ employee benefit plans. Potential conflicts of interest may arise with both the aggregation and allocation of securities transactions and allocation of investment opportunities because of market factors or investment restrictions imposed upon J.P. Morgan and its affiliates by law, regulation, contract or internal policies. Allocations of aggregated trades, particularly trade orders that were only partially completed due to limited availability and allocation of investment opportunities generally, could raise a potential conflict of interest, as J.P. Morgan or its affiliates may have an incentive to allocate securities that are expected to increase in value to favored accounts. Initial public offerings, in particular, are frequently of very limited availability. J.P. Morgan and its affiliates may be perceived as causing accounts they manage to participate in an offering to increase J.P. Morgan’s and its affiliates’ overall allocation of securities in that offering.
A potential conflict of interest also may be perceived to arise if transactions in one account closely follow related transactions in a different account, such as when a purchase increases the value of securities previously purchased by another account, or when a sale in one account lowers the sale price received in a sale by a second account. If J.P. Morgan or its affiliates manage accounts that engage in short sales of securities of the type in which the Fund invests, J.P. Morgan or its affiliates could be seen as harming the performance of the Fund for the benefit of the accounts engaging in short sales if the short sales cause the market value of the securities to fall.
As an internal policy matter, J.P. Morgan or its affiliates may from time to time maintain certain overall investment limitations on the securities positions or positions in other financial instruments J.P. Morgan or its affiliates will take on behalf of its various clients due to, among other things, liquidity concerns and regulatory restrictions. Such policies may preclude a Fund from purchasing particular securities or financial instruments, even if such securities or financial instruments would otherwise meet the Fund’s objectives.
The goal of J.P. Morgan and its affiliates is to meet their fiduciary obligation with respect to all clients. J.P. Morgan and its affiliates have policies and procedures designed to manage conflicts. J.P. Morgan and its affiliates monitor a variety of areas, including compliance with fund guidelines, review of allocation decisions and compliance with J.P. Morgan’s Codes of Ethics and J.P. Morgan Chase and Co.’s Code of Conduct. With respect to the allocation of investment opportunities, J.P. Morgan and its affiliates also have certain policies that seek to achieve fair and equitable allocation of investment opportunities among its clients over time. For example:
Orders received in the same security and within a reasonable time period from a market event (e.g., a change in a security rating) are continuously aggregated on the appropriate trading desk so that new orders are aggregated with current outstanding orders consistent with J.P. Morgan’s duty of best execution for its clients. However, there are circumstances when it may be appropriate to execute the second order differently due to other constraints or investment objectives. Such exceptions often depend on the asset class. Examples of these exceptions, particularly in the fixed income area, are sales to meet redemption deadlines or orders related to less liquid assets.
B-320
If aggregated trades are fully executed, accounts participating in the trade will typically be allocated their pro rata share on an average price basis. Partially filled orders generally will be allocated among the participating accounts on a pro-rata average price basis, subject to certain limited exceptions. Use of average price for execution of aggregated trade orders is particularly true in the equity area. However, certain investment strategies, such as the use of derivatives, or asset classes, such as fixed income that use individual trade executions due to the nature of the strategy or supply of the security, may not be subject to average execution price policy and would receive the actual execution price of the transaction. Additionally, some accounts may be excluded from pro rata allocations. Accounts that would receive a de minimis allocation relative to their size may be excluded from the order. Another exception may occur when thin markets or price volatility require that an aggregated order be completed in multiple executions over several days.
Deviations from pro rata allocations are documented by the business. J.P. Morgan attempts to mitigate any potential unfairness by basing non-pro rata allocations traded through a single trading desk or system upon an objective predetermined criteria for the selection of investments and a disciplined process for allocating securities with similar duration, credit quality and liquidity in the good faith judgment of J.P. Morgan so that fair and equitable allocation will occur over time.
Compensation:
The discussion below describes the portfolio managers’ compensation as of September 30, 2016.
J.P. Morgan’s portfolio managers participate in a competitive compensation program that is designed to attract, retain and motivate talented people and closely link the performance of investment professionals to client investment objectives. The total compensation program includes a base salary fixed from year to year and a variable discretionary performance based incentive consisting of cash incentives and deferred compensation which includes mandatory notional investments (as described below) in selected mutual funds advised by J.P. Morgan or its affiliates (“Mandatory Investment Plan”). These elements reflect individual performance and the performance of J.P. Morgan’s business as a whole.
Each portfolio manager’s performance is formally evaluated annually based on a variety of factors including the aggregate size and blended performance of the portfolios such portfolio manager manages, individual contribution relative to client risk and return objectives, and adherence with J.P. Morgan’s compliance, risk and regulatory procedures. In evaluating each portfolio manager’s performance with respect to the mutual funds he or she manages, the pre-tax performance of the funds (or the portion of the funds managed by the portfolio manager) is compared to the appropriate market peer group and to the competitive indices J.P. Morgan has identified for the investment strategy over one, three and five year periods (or such shorter time as the portfolio manager has managed the funds). Investment performance is generally more heavily weighted to the long term.
Deferred compensation granted as part of an employee’s annual incentive compensation comprises from 0% to 60% of a portfolio manager’s total performance based incentive. As the level of incentive compensation increases, the percentage of compensation awarded in deferred incentives also increases. J.P. Morgan’s portfolio managers are required to notionally invest a certain percentage of their deferred compensation (typically 20% to 50% depending on the level of compensation) into the selected funds they manage. The remaining portion of the non-cash incentive is elective and may be notionally invested in any of the other mutual funds available in the Mandatory Investment Plan or can be placed in restricted stock. When these awards vest over time, the portfolio manager receives cash equal to the market value of the notional investment in the selected mutual funds.
B-321
Jackson Square Partners, LLC
The portfolio managers of the Growth Opportunities Fund are Jeffrey S. Van Harte, Christopher J. Bonavico, Christopher M. Ericksen, and Daniel J. Prislin. They are the persons primarily responsible for investing the Fund’s assets on a daily basis.
Other Accounts Managed:
| Number of Accounts Managed* | Total Assets* | Number of Accounts Managed for which Advisory Fee is Performance- Based* | Total Assets* | |||||||||||||
Jeffrey S. Van Harte | ||||||||||||||||
Registered investment companies** | 16 | $ | 7,986 million | 2 | $ | 2,682 million | ||||||||||
Other pooled investment vehicles | 7 | $ | 812 million | 0 | $ | 0 | ||||||||||
Other accounts*** | 56 | $ | 7,861 million | 4 | $ | 832 million | ||||||||||
Christopher J. Bonavico | ||||||||||||||||
Registered investment companies** | 19 | $ | 8,850 million | 2 | $ | 2,682 million | ||||||||||
Other pooled investment vehicles | 13 | $ | 3,985 million | 0 | $ | 0 | ||||||||||
Other accounts*** | 64 | $ | 9,435 million | 5 | $ | 906 million | ||||||||||
Christopher M. Ericksen | ||||||||||||||||
Registered investment companies** | 15 | $ | 7,905 million | 2 | $ | 2,682 million | ||||||||||
Other pooled investment vehicles | 5 | $ | 643 million | 0 | $ | 0 | ||||||||||
Other accounts*** | 51 | $ | 7,067 million | 2 | $ | 436 million | ||||||||||
Daniel J. Prislin | ||||||||||||||||
Registered investment companies** | 16 | $ | 7,986 million | 2 | $ | 2,682 million | ||||||||||
Other pooled investment vehicles | 7 | $ | 812 million | 0 | $ | 0 | ||||||||||
Other accounts*** | 58 | $ | 7,846 million | 4 | $ | 832 million | ||||||||||
| * | The information provided is as of September 30, 2016. |
| ** | Does not include the Growth Opportunities Fund. |
| *** | Other accounts include accounts managed in a personal capacity as well as accounts managed in a professional capacity. The personal account information is current as of September 30, 2016. |
Ownership of Securities:
As of September 30, 2016, the portfolio managers did not own any shares of the Growth Opportunities Fund.
Conflicts of Interest:
Individual portfolio managers may perform investment management services for other funds or accounts similar to those provided to the Fund and the investment action for each other fund or account and the Fund may differ. For example, one fund or account may be selling a security, while another fund or account may be purchasing or holding the same security. As a result, transactions executed for one fund or account or the Fund may adversely affect the value of securities held by another fund or account or the Fund. In addition, the management of multiple other funds or accounts and the Fund may give rise to potential conflicts of interest, as a portfolio manager must allocate time and effort to multiple funds or accounts and the Fund. A portfolio manager may discover an investment opportunity that may be suitable for more than one fund or account. The investment opportunity may be limited, however, so that all funds or accounts for which the investment would be suitable may not be able to participate. Jackson Square has adopted procedures designed to allocate investments fairly across multiple funds or accounts. Certain of the accounts managed by the portfolio managers have a
B-322
performance-based fees. This compensation structure presents a potential conflict of interest. The portfolio managers have an incentive to manage such accounts so as to enhance their performance, to the possible detriment of other accounts for which the investment manager does not receive a performance-based fee. A portfolio manager’s management of personal accounts also may present certain conflicts of interest. Although Jackson Square’s code of ethics is designed to address these potential conflicts, there is no guarantee that it will do so.
Compensation:
The discussion below describes the portfolio managers’ compensation as of September 30, 2016.
Jackson Square’s investment professionals have remained together, bound by culture and the unique nature of the team’s research/portfolio manager role, for over a decade on average. Through various market and organizational circumstances over the years, the group has maintained a meritocracy and very strong pay-for-performance ethos that rewards positive impact to client portfolios. Each stock in each portfolio has two or more ‘sponsors’ who have mathematical ownership of those names for performance attribution purposes (e.g., 60/40 or 50/50-type responsibility splits). This stock-by-stock attribution can then be aggregated and the individual contributions of team members measured, down to the basis point, for each performance period measured: 1/3/5 year and since inception.
Aggregate compensation is ultimately driven by revenues, which – in turn – is correlated with assets under management, which ultimately correlates with performance over the long term, in a self-reinforcing cycle of better performance leading to more assets under management (both via flows and appreciation) and greater revenues/compensation. Additionally, qualitative factors such as contribution to debates of other team members’ ideas are also considered in compensation. Certain employees, including eight members of the investment team, also have equity ownership as part of their compensation.
In terms of the composition of compensation paid to the investment team, it is expected to be a combination of base salary, discretionary annual bonuses, and for those members with equity, partnership equity distributions. Jackson Square believes this combination will have the proper incentives to award prudent long term focus on building a stable and sustainable business while also rewarding professionals for superior relative interim results.
B-323
Loomis, Sayles & Company, L.P.
The portfolio managers of the Diversified Value Fund are Arthur Barry and Adam C. Liebhoff.
Other Accounts Managed:
| Number of Accounts Managed* | Total Assets* | Number of Accounts Managed for which Advisory Fee is Performance- Based* | Total Assets* | |||||||||||||
Arthur Barry | ||||||||||||||||
Registered investment companies** | 4 | $ | 1,817,664,007 | 0 | $ | 0 | ||||||||||
Other pooled investment vehicles | 1 | $ | 8,637,999 | 0 | $ | 0 | ||||||||||
Other accounts | 83 | $ | 1,448,656,074 | 0 | $ | 0 | ||||||||||
Adam C. Liebhoff | ||||||||||||||||
Registered investment companies** | 4 | $ | 1,817,664,007 | 0 | $ | 0 | ||||||||||
Other pooled investment vehicles | 1 | $ | 8,637,999 | 0 | $ | 0 | ||||||||||
Other accounts | 79 | $ | 1,441,790,874 | 0 | $ | 0 | ||||||||||
| * | The information provided is as of September 30, 2016. |
| ** | Does not include the Diversified Value Fund. |
Ownership of Securities:
As of September 30, 2016, the portfolio managers did not own any shares of the Diversified Value Fund.
The portfolio manager of the Blue Chip Growth Fund is Aziz V. Hamzaogullari.
Other Accounts Managed:
| Number of Accounts Managed* | Total Assets* | Number of Accounts Managed for which Advisory Fee is Performance- Based* | Total Assets* | |||||||||||||
Aziz V. Hamzaogullari | ||||||||||||||||
Registered investment companies** | 15 | $ | 16,520,832,129 | 0 | $ | 0 | ||||||||||
Other pooled investment vehicles | 12 | $ | 2,222,369,297 | 1 | $ | 710,474,433 | ||||||||||
Other accounts | 87 | $ | 9,618,981,662 | 0 | $ | 0 | ||||||||||
| * | The information provided is as of September 30, 2016. |
| ** | Does not include the Blue Chip Growth Fund. |
Ownership of Securities:
As of September 30, 2016, the portfolio manager did not own any shares of the Blue Chip Growth Fund.
Conflicts of Interest:
Conflicts of interest may arise in the allocation of investment opportunities and the allocation of aggregated orders among the Funds and other accounts managed by the portfolio managers. A portfolio manager potentially could give favorable treatment to some accounts for a variety of reasons, including favoring larger accounts,
B-324
accounts that pay higher fees, accounts that pay performance-based fees, accounts of affiliated companies and accounts in which the portfolio manager has an interest. Such favorable treatment could lead to more favorable investment opportunities or allocations for some accounts. Loomis Sayles makes investment decisions for all accounts (including institutional accounts, mutual funds, hedge funds and affiliated accounts) based on each account’s availability of other comparable investment opportunities and Loomis Sayles’ desire to treat all accounts fairly and equitably over time. Loomis Sayles maintains trade allocation and aggregation policies and procedures to address these potential conflicts. Conflicts of interest also may arise to the extent a portfolio manager short sells a stock in one client account but holds that stock long in other accounts, including the Funds, or sells a stock for some accounts while buying the stock for others, and through the use of “soft dollar arrangements,” which are discussed in Loomis Sayles’ Brokerage Allocation Policies and Procedures and Loomis Sayles’ Trade Aggregation and Allocation Policies and Procedures.
Compensation:
The discussion below describes the portfolio managers’ compensation as of September 30, 2016.
Loomis Sayles believes that portfolio manager compensation should be driven primarily by the delivery of consistent and superior long-term performance for its clients. Portfolio manager compensation is made up primarily of three main components: base salary, variable compensation and a long-term incentive program. Although portfolio manager compensation is not directly tied to assets under management, a portfolio manager’s base salary and/or variable compensation potential may reflect the amount of assets for which the manager is responsible relative to other portfolio managers. Loomis Sayles also offers a profit sharing plan. Base salary is a fixed amount based on a combination of factors, including industry experience, firm experience, job performance and market considerations. Variable compensation is an incentive-based component and generally represents a significant multiple of base salary. Variable compensation is based on four factors: investment performance, profit growth of the firm, profit growth of the manager’s business unit and team commitment. Investment performance is the primary component of total variable compensation and generally represents at least 70% of the total for equity managers. The other three factors are used to determine the remainder of variable compensation, subject to the discretion of the Chief Investment Officer (“CIO”) and senior management. The CIO and senior management evaluate these other factors annually.
Equity Managers. While mutual fund performance and asset size do not directly contribute to the compensation calculation, investment performance for equity managers is measured by comparing the performance of Loomis Sayles’ institutional composites to the performance of the applicable Morningstar peer group and/or the Lipper universe. Generally speaking the performance of the respective product’s fund is compared against the applicable Morningstar peer group and/or the Lipper universe. If the majority of the assets in the product are contained in the mutual fund that comparison will drive compensation. To the extent the majority of assets managed in the fund strategy are for institutional separate accounts, the Evestment Alliance institutional peer group will also be used as an additional comparison. In situations where substantially all of the assets for the strategy are institutional, the institutional peer group will be used as the primary method of comparison. A manager’s performance relative to the peer group for the 1, 3 and 5 year periods (or since the start of the manager’s tenure, if shorter) is used to calculate the amount of variable compensation payable due to performance. The 1 year period may be eliminated with regards to the Large Cap Growth strategy. Longer-term performance (3 and 5 years (or 7 years for Large Cap Growth) or since the start of the manager’s tenure, if shorter) combined is weighted more than shorter-term performance (1 year). In addition, the performance measurement for equity compensation incorporates a consistency metric using longer term (3, 5, etc.) rolling return compared to the peer group over a sustained measurement period (5, 7, etc. years). The exact method may be adjusted to a product’s particular style. If a manager is responsible for more than one product, the rankings of each product are weighted based on the relative revenue of accounts represented in each product. An external benchmark is used as a secondary comparison. The benchmark for the Diversified Value Fund is the Russell 1000 Value Index. The benchmark for the Blue Chip Growth Fund is the Russell 1000 Growth Index.
B-325
In cases where the institutional peer groups are used, Loomis Sayles believes they represent the most competitive product universe while closely matching the investment styles offered by the Loomis Sayles fund.
In addition to the compensation described above, portfolio managers may receive additional compensation based on the overall growth of their strategies.
General
Most mutual funds are not included in the Loomis Sayles strategy composites, so unlike managed accounts, fund performance and asset size in those cases would not directly contribute to this calculation. However, each fund managed by Loomis Sayles employs strategies endorsed by Loomis Sayles and fits into the product category for the relevant investment style. Loomis Sayles may adjust compensation if there is significant dispersion among the returns of the composite and accounts not included in the composite.
Loomis Sayles has developed and implemented two distinct long-term incentive plans to attract and retain investment talent. The plans supplement existing compensation. The first plan has several important components distinguishing it from traditional equity ownership plans:
| · | the plan grants units that entitle participants to an annual payment based on a percentage of company earnings above an established threshold; |
| · | upon retirement, a participant will receive a multi-year payout for his or her vested units; and |
| · | participation is contingent upon signing an award agreement, which includes a non-compete covenant. |
The second plan is similarly constructed although the participants’ annual participation in company earnings is deferred for two years from the time of award and is only payable if the portfolio manager remains at Loomis Sayles. In this plan, there is no post-retirement payments or non-compete covenants.
Senior management expects that the variable compensation portion of overall compensation will continue to remain the largest source of income for those investment professionals included in the plan. The plan is initially offered to portfolio managers and over time the scope of eligibility is likely to widen. Management has full discretion over what units are issued and to whom.
Portfolio managers also participate in the Loomis Sayles profit sharing plan, in which Loomis Sayles makes a contribution to the retirement plan of each employee based on a percentage of base salary (up to a maximum amount). The portfolio managers also participate in the Loomis Sayles defined benefit pension plan, which applies to all Loomis Sayles employees who joined the firm prior to May 3, 2003. The defined benefit is based on years of service and base compensation (up to a maximum amount).
B-326
Massachusetts Financial Services Company
The portfolio managers of the Overseas Fund (the “Fund”) are Daniel Ling, Marcus Smith and Filipe Benzinho. Effective April 1, 2017, Marcus Smith will no longer be a portfolio manager of the Fund.
Other Accounts Managed:
| Number of Accounts Managed* | Total Assets* | Number of Accounts Managed for which Advisory Fee is Performance- Based* | Total Assets* | |||||||||||||
Daniel Ling | ||||||||||||||||
Registered investment companies** | 13 | $ | 15.4 billion | 0 | $ | 0 | ||||||||||
Other pooled investment vehicles | 5 | $ | 2.5 billion | 0 | $ | 0 | ||||||||||
Other accounts | 32 | $ | 7.1 billion | 0 | $ | 0 | ||||||||||
Marcus Smith | ||||||||||||||||
Registered investment companies** | 13 | $ | 15.4 billion | 0 | $ | 0 | ||||||||||
Other pooled investment vehicles | 5 | $ | 2.5 billion | 0 | $ | 0 | ||||||||||
Other accounts | 32 | $ | 7.1 billion | 0 | $ | 0 | ||||||||||
Filipe Benzinho | ||||||||||||||||
Registered investment companies** | 13 | $ | 15.4 billion | 0 | $ | 0 | ||||||||||
Other pooled investment vehicles | 5 | $ | 2.5 billion | 0 | $ | 0 | ||||||||||
Other accounts | 32 | $ | 7.1 billion | 0 | $ | 0 | ||||||||||
| * | The information provided is as of September 30, 2016. |
| ** | Does not include the Overseas Fund. |
Ownership of Securities:
As of September 30, 2016, the portfolio managers did not own any shares of the Overseas Fund.
Conflicts of Interest:
MFS seeks to identify potential conflicts of interest resulting from a portfolio manager’s management of both the Fund and other accounts, and has adopted policies and procedures designed to address such potential conflicts.
The management of multiple funds and accounts (including proprietary accounts) gives rise to conflicts of interest if the funds and accounts have different objectives and strategies, benchmarks, time horizons and fees as a portfolio manager must allocate his or her time and investment ideas across multiple funds and accounts. In certain instances there are securities which are suitable for the Fund’s portfolio as well as for accounts of MFS or its subsidiaries with similar investment objectives. MFS’ trade allocation policies may give rise to conflicts of interest if the Fund’s orders do not get fully executed or are delayed in getting executed due to being aggregated with those of other accounts of MFS or its subsidiaries. A portfolio manager may execute transactions for another fund or account that may adversely affect the value of the Fund’s investments. Investments selected for funds or accounts other than the Fund may outperform investments selected for the Fund.
When two or more clients are simultaneously engaged in the purchase or sale of the same security, the securities are allocated among clients in a manner believed by MFS to be fair and equitable to each. Allocations may be based on many factors and may not always be pro rata based on assets managed. The allocation methodology could have a detrimental effect on the price or volume of the security as far as the Fund is concerned.
B-327
MFS and/or a portfolio manager may have a financial incentive to allocate favorable or limited opportunity investments or structure the timing of investments to favor accounts other than the Fund, for instance, those that pay a higher advisory fee and/or have a performance adjustment and/or include an investment by the portfolio manager.
Compensation:
Portfolio manager compensation is reviewed annually. As of September 30, 2016, portfolio manager total cash compensation is a combination of base salary and performance bonus:
| · | Base Salary—Base salary represents a smaller percentage of portfolio manager total cash compensation than performance bonus. |
| · | Performance Bonus—Generally, the performance bonus represents more than a majority of portfolio manager total cash compensation. |
The performance bonus is based on a combination of quantitative and qualitative factors, generally with more weight given to the former and less weight given to the latter.
The quantitative portion is based on the pre-tax performance of assets managed by the portfolio manager over one-, three-, and five-year periods relative to peer group universes and/or indices (“benchmarks”). As of September 30, 2016, the following benchmarks were used to measure the following portfolio managers’ performance for the Overseas Fund:
Portfolio Manager | Benchmark(s) | |
Filipe Benzinho | MSCI EAFE (Europe, Australasia, Far East) Index | |
Daniel Ling | MSCI EAFE (Europe, Australasia, Far East) Index | |
Marcus Smith | MSCI EAFE (Europe, Australasia, Far East) Index | |
Additional or different benchmarks, including versions and components of indices, custom indices, and linked indices that combine performance of different indices for different portions of the time period, may also be used. Consideration is given to portfolio performance over one, three, and five years with emphasis placed on the longer periods. For portfolio managers who have served for more than five years, additional longer-term performance periods are also considered. For portfolio managers who have served for less than five years, performance periods are adjusted as appropriate.
The qualitative portion is based on the results of an annual internal peer review process (conducted by other portfolio managers, analysts, and traders) and management’s assessment of overall portfolio manager contributions to investor relations and the investment process (distinct from fund and other account performance). This performance bonus may be in the form of cash and/or a deferred cash award, at the discretion of management. A deferred cash award is issued for a cash value and becomes payable over a three-year vesting period if the portfolio manager remains in the continuous employ of MFS or its affiliates. During the vesting period, the value of the unfunded deferred cash award will fluctuate as though the portfolio manager had invested the cash value of the award in an MFS Fund(s) selected by the portfolio manager. A selected fund may be, but is not required to be, a fund that is managed by the portfolio manager.
Portfolio managers also typically benefit from the opportunity to participate in the MFS Equity Plan. Equity interests are awarded by management, on a discretionary basis, taking into account tenure at MFS, contribution to the investment process, and other factors.
B-328
Finally, portfolio managers also participate in benefit plans (including a defined contribution plan and health and other insurance plans) and programs available generally to other employees of MFS. The percentage such benefits represent of any portfolio manager’s compensation depends upon the length of the individual’s tenure at MFS and salary level, as well as other factors.
B-329
Metropolitan West Asset Management, LLC
The portfolio managers of the Total Return Bond Fund are Tad Rivelle, Laird R. Landmann, Stephen M. Kane, and Bryan T. Whalen.
Other Accounts Managed:
| Number of Accounts Managed* | Total Assets* | Number of Accounts Managed for which Advisory Fee is Performance- Based* | Total Assets* | |||||||||||||
Tad Rivelle | ||||||||||||||||
Registered investment companies** | 29 | $ | 114,503.2 million | 0 | $ | 0 | ||||||||||
Other pooled investment vehicles | 39 | $ | 5,940.3 million | 22 | $ | 1,769.7 million | ||||||||||
Other accounts | 236 | $ | 36,159.8 million | 6 | $ | 3,441.1 million | ||||||||||
Laird R. Landmann | ||||||||||||||||
Registered investment companies** | 26 | $ | 102,362.3 million | 0 | $ | 0 | ||||||||||
Other pooled investment vehicles | 39 | $ | 5,968.3 million | 22 | $ | 1,769.7 million | ||||||||||
Other accounts | 236 | $ | 36,159.8 million | 6 | $ | 3,441.1 million | ||||||||||
Stephen M. Kane | ||||||||||||||||
Registered investment companies** | 28 | $ | 102,689.4 million | 0 | $ | 0 | ||||||||||
Other pooled investment vehicles | 42 | $ | 7,132.5 million | 22 | $ | 1,769.7 million | ||||||||||
Other accounts | 236 | $ | 36,159.8 million | 6 | $ | 3,441.1 million | ||||||||||
Bryan T. Whalen | ||||||||||||||||
Registered investment companies** | 24 | $ | 112,479.3 million | 0 | $ | 0 | ||||||||||
Other pooled investment vehicles | 41 | $ | 8,088.4 million | 22 | $ | 1,769.7 million | ||||||||||
Other accounts | 236 | $ | 36,159.8 million | 6 | $ | 3,441.1 million | ||||||||||
| * | The information provided is as of September 30, 2016. |
| ** | Does not include the Total Return Bond Fund. |
Ownership of Securities:
As of September 30, 2016, the portfolio managers did not own any shares of the Total Return Bond Fund.
Conflicts of Interest:
As a member of The TCW Group, Inc. (“TCW”), MetWest is subject to TCW’s Code of Ethics, which has been designed to minimize conflicts of interest between clients and its investment personnel. MetWest also reviews potential conflicts of interest through its Trading and Allocation Committee.
Compensation:
The discussion below describes the portfolio managers’ compensation as of September 30, 2016.
Since MetWest is a subsidiary of TCW, MetWest’s investment professionals are compensated under the TCW compensation structure as detailed below.
The overall objective of TCW’s compensation program for portfolio managers is to attract experienced and expert investment professionals and to retain them over the long-term. Compensation is comprised of several components which, in the aggregate, are designed to achieve these objectives and to reward the portfolio managers for their contributions to the successful performance of the accounts they manage. Portfolio managers
B-330
are compensated through a combination of base salary, profit sharing based compensation (“profit sharing”), bonus and equity incentive participation in TCW’s parent company (“equity incentives”). Profit sharing and equity incentives generally represent most of the managers’ compensation. In some cases, portfolio managers are eligible for discretionary bonuses.
Salary. Salary is agreed to with managers at time of employment and is reviewed from time to time. It does not change significantly and often does not constitute a significant part of the portfolio manager’s compensation.
Profit Sharing. Profit sharing for investment professionals is based on net income relating to accounts in the investment strategy area for which the investment professionals are responsible. In most cases, revenues are allocated to a pool and profit sharing compensation allocated among members of the investment team after the deduction of certain expenses (including base salaries) related to the strategy group. The allocations are based on the investment professionals’ contribution to TCW and its clients.
The profit sharing percentage used to compensate a portfolio manager for investment services related to the funds is generally the same as that used to compensate portfolio managers for other client accounts in the same strategy managed by MetWest or one of the other TCW-affiliated advisers (together, “the TCW Group”). In some cases, the profit sharing pool that includes revenues related to more than one product, in which case each participant in the pool is entitled to profit sharing derived from his or her contributions to all the included products.
Investment professionals are not directly compensated for generating performance fees. In some cases, the profit sharing percentage is subject to increase based on the relative pre-tax performance of the investment strategy composite returns, net of fees and expenses, to that of the benchmark. The measurement of performance relative to the benchmark can be based on single year or multiple year metrics, or a combination thereof. The benchmark used is the one associated with the fund managed by the portfolio manager as disclosed in the prospectus. Benchmarks vary from strategy to strategy but, within a given strategy, the same benchmark applies to all accounts, including the fund.
Discretionary Bonus/Guaranteed Minimums. Discretionary bonuses may be paid out of an investment team’s profit sharing pool, as determined by the supervisor(s) in the department. In other cases where portfolio managers do not receive profit sharing or where the company has determined the combination of salary and profit sharing does not adequately compensate the portfolio manager, discretionary bonuses may be paid by the TCW Group. Also, pursuant to contractual arrangements, some portfolio managers received minimum bonuses.
Equity Incentives. Management believes that equity ownership aligns the interest of portfolio managers with the interests of the firm and its clients. Accordingly, TCW’s key investment professionals participate in equity incentives, through ownership or participation in restricted unit plans that vest over time or unit appreciation plans of TCW’s parent company. The plans include the Fixed Income Retention Plan, Restricted Unit Plan and 2013 Equity Unit Incentive Plan.
Under the Fixed Income Retention Plan, certain portfolio managers in the fixed income area were awarded cash and/or partnership units in TCW’s parent company, either on a contractually-determined basis or on a discretionary basis. Awards under this plan were made in 2010 that vest over a period of time.
Under the Restricted Unit Plan, certain portfolio managers in the fixed income and equity areas were awarded partnership units in the TCW’s parent company. Awards under this plan have vested over time subject to satisfaction of performance criteria.
Under the 2013 Equity Unit Incentive Plan, certain portfolio managers in the fixed income and equity areas are awarded options to acquire partnership units in the TCW’s parent company with a strike price equal to the fair market value of the option at the date of grant. The options granted under the plan are subject to vesting and other conditions.
Other Plans and Compensation Vehicles. Portfolio managers may also elect to participate in the TCW Group’s 401(k) plan, to which they may contribute a portion of their pre- and post-tax compensation to the plan for investment on a tax-deferred basis.
B-331
Northern Trust Investments, Inc.
Brent Reeder is primarily responsible for the day-to-day management of the S&P 500 Index Fund.
Other Accounts Managed:
| Number of Accounts Managed* | Total Assets* | Number of Accounts Managed for which Advisory Fee is Performance- Based* | Total Assets* | |||||||||||||
Brent Reeder | ||||||||||||||||
Registered investment companies** | 37 | $ | 32,712,942,283 | 0 | $ | 0 | ||||||||||
Other pooled investment vehicles | 64 | $ | 202,444,203,489 | 0 | $ | 0 | ||||||||||
Other accounts | 75 | $ | 45,196,422,124 | 0 | $ | 0 | ||||||||||
| * | The information provided is as of September 30, 2016. |
| ** | Does not include the S&P 500 Index Fund. |
Ownership of Securities:
As of September 30, 2016, the portfolio manager did not own any shares of the S&P 500 Index Fund.
Brent Reeder is primarily responsible for the day-to-day management of the S&P Mid Cap Index Fund.
Other Accounts Managed:
| Number of Accounts Managed* | Total Assets* | Number of Accounts Managed for which Advisory Fee is Performance- Based* | Total Assets* | |||||||||||||
Brent Reeder | ||||||||||||||||
Registered investment companies** | 37 | $ | 29,514,323,854 | 0 | $ | 0 | ||||||||||
Other pooled investment vehicles | 64 | $ | 202,444,203,489 | 0 | $ | 0 | ||||||||||
Other accounts | 75 | $ | 45,196,422,124 | 0 | $ | 0 | ||||||||||
| * | The information provided is as of September 30, 2016. |
| ** | Does not include the S&P Mid Cap Index Fund. |
Ownership of Securities:
As of September 30, 2016, the portfolio manager did not own any shares of the S&P Mid Cap Index Fund.
Brent Reeder is primarily responsible for the day-to-day management of the Russell 2000 Small Cap Index Fund.
B-332
Other Accounts Managed:
| Number of Accounts Managed* | Total Assets* | Number of Accounts Managed for which Advisory Fee is Performance- Based* | Total Assets* | |||||||||||||
Brent Reeder | ||||||||||||||||
Registered investment companies** | 37 | $ | 32,905,334,651 | 0 | $ | 0 | ||||||||||
Other pooled investment vehicles | 64 | $ | 202,444,203,489 | 0 | $ | 0 | ||||||||||
Other accounts | 75 | $ | 45,196,422,124 | 0 | $ | 0 | ||||||||||
| * | The information provided is as of September 30, 2016. |
| ** | Does not include the Russell 2000 Small Cap Index Fund. |
Ownership of Securities:
As of September 30, 2016, the portfolio manager did not own any shares of the Russell 2000 Small Cap Index Fund.
Steven Santiccioli is primarily responsible for the day-to-day management of the MSCI EAFE International Index Fund.
Other Accounts Managed:
| Number of Accounts Managed* | Total Assets* | Number of Accounts Managed for which Advisory Fee is Performance- Based* | Total Assets* | |||||||||||||
Steven Santiccioli | ||||||||||||||||
Registered investment companies** | 3 | $ | 2,286,456,259 | 0 | $ | 0 | ||||||||||
Other pooled investment vehicles | 2 | $ | 21,144,354,995 | 0 | $ | 0 | ||||||||||
Other accounts | 10 | $ | 8,822,728,108 | 0 | $ | 0 | ||||||||||
| * | The information provided is as of September 30, 2016. |
| ** | Does not include the MSCI EAFE International Index Fund. |
Ownership of Securities:
As of September 30, 2016, the portfolio manager did not own any shares of the MSCI EAFE International Index Fund.
Conflicts of Interest:
NTI’s portfolio managers are often responsible for managing one or more funds, as well as other accounts, including separate accounts and other pooled investment vehicles. A portfolio manager may manage a separate account or other pooled investment vehicle that may have a materially higher or lower fee arrangement. The side-by-side management of these accounts may raise potential conflicts of interest relating to cross trading, the allocation of investment opportunities and the aggregation and allocation of trades. In addition, while portfolio managers generally only manage accounts with similar investment strategies, it is possible that due to varying investment restrictions among accounts that certain investments are made for some accounts and not others or conflicting investment positions are taken among accounts. The portfolio managers have a fiduciary responsibility to manage all client accounts in a fair and equitable manner. NTI seeks to provide best execution
B-333
of all securities transactions and aggregate and then allocate securities to client accounts in a fair and timely manner. To this end, NTI has developed policies and procedures designed to mitigate and manage the potential conflicts of interest that may arise from side-by-side management. In addition, NTI has adopted policies limiting the circumstances under which cross-trades may be effected. NTI conducts periodic reviews of trades for consistency with these policies.
Compensation:
The discussion below describes the portfolio managers’ compensation as of September 30, 2016.
The compensation for NTI index portfolio managers is based on the competitive marketplace and consists of a fixed base salary plus a variable annual cash incentive award. In addition, non-cash incentives, such as stock options or restricted stock of Northern Trust Corporation, may be awarded from time to time. In addition, the annual incentive award is discretionary and is based on a quantitative and qualitative evaluation of each portfolio manager’s investment performance and contribution to his or her respective team plus the financial performance of the investment business unit and Northern Trust Corporation as a whole. The portfolio manager’s annual cash incentive award is not based on the investment performance of the Funds or the amount of assets held in the Funds. Moreover, no material differences exist between the compensation structure for mutual fund accounts and other types of accounts.
B-334
OFI Global Institutional, Inc.
The portfolio managers of the Small Cap Growth Equity Fund are Ronald Zibelli, Jr. and Ash Shah.
Other Accounts Managed:
| Number of Accounts Managed* | Total Assets* | Number of Accounts Managed for which Advisory Fee is Performance- Based* | Total Assets* | |||||||||||||
Ronald Zibelli, Jr. | ||||||||||||||||
Registered investment companies** | 5 | $ | 3.60 billion | 0 | $ | 0 | ||||||||||
Other pooled investment vehicles | 1 | $ | 37.16 million | 0 | $ | 0 | ||||||||||
Other accounts*** | 0 | $ | 0 | 0 | $ | 0 | ||||||||||
Ash Shah | ||||||||||||||||
Registered investment companies** | 3 | $ | 2.13 billion | 0 | $ | 0 | ||||||||||
Other pooled investment vehicles | 1 | $ | 37.16 million | 0 | $ | 0 | ||||||||||
Other accounts*** | 0 | $ | 0 | 0 | $ | 0 | ||||||||||
| * | The information provided is as of September 30, 2016. |
| ** | Does not include the Small Cap Growth Equity Fund. |
| *** | Does not include personal accounts of portfolio managers and their families, which are subject to the Code of Ethics. |
Ownership of Securities:
As of September 30, 2016, the portfolio managers did not own any shares of the Small Cap Growth Equity Fund.
Conflicts of Interest:
As indicated above, a portfolio manager may also manage other funds and accounts. At different times, a portfolio manager may manage other funds or accounts with investment objectives and strategies similar to, or different from, those of the Fund. At times, those responsibilities could potentially conflict with the interests of the Fund. That may occur whether the investment objectives and strategies of the other funds and accounts are the same as, or different from, the Fund’s investment objectives and strategies. For example, a portfolio manager may need to allocate investment opportunities between the Fund and another fund or account having similar objectives or strategies, or may need to execute transactions for another fund or account that could have a negative impact on the value of securities held by the Fund. Not all funds and accounts advised by OFI Global have the same management fee. If the management fee structure of another fund or account is more advantageous to OFI Global than the fee structure of the Fund, OFI Global could have an incentive to favor the other fund or account. However, OFI Global’s compliance procedures and Code of Ethics recognize OFI Global’s obligation to treat all of its clients, including the Fund, fairly and equitably, and are designed to preclude a portfolio manager from favoring one client over another. It is possible, of course, that those compliance procedures and the Code of Ethics may not always be adequate to do so.
B-335
Compensation:
The discussion below describes the portfolio managers’ compensation as of September 30, 2016.
Portfolio managers are employed and compensated by the Subadviser or an affiliate, not by the Fund. Under the compensation program for portfolio managers and portfolio analysts, compensation is based primarily on the relative investment performance results of the funds or accounts they manage, rather than on the financial success of the Subadviser. This is intended to align the interests of the portfolio managers and analysts with the success of the funds and accounts of their shareholders. The compensation structure is designed to attract and retain highly qualified investment management professionals and to reward individual and team contributions toward creating shareholder value. A portfolio manager’s compensation is not directly based on the total value of assets they manage; however, higher total compensation potential is likely to align with greater assets under management. The compensation structure is intended to be internally and externally equitable and serve to reduce potential conflicts of interest arising from a portfolio manager’s responsibilities managing different funds or accounts.
Portfolio manager compensation generally consists of three components: a base salary, an annual bonus, and eligibility to participate in long-term awards. In general, the average proportion of total compensation among these three components is as follows: base salary is 15%, annual bonus is 65%, and long-term awards are 20%.
The base pay component for each portfolio manager is reviewed regularly to ensure that it reflects the performance of the individual, is commensurate with the requirements of the particular portfolio, reflects any specific competence or specialty of the individual manager, and is competitive with other comparable positions.
The annual bonus is calculated based on two factors: a formulaic performance portion and a discretionary portion. In general, the formulaic performance portion is a much larger part of the annual bonus than the discretionary portion. The formulaic performance portion of the annual bonus is measured against the one, three and five year performance, or performance since inception, as applicable, of the fund(s) relative to an appropriate Morningstar peer group category selected by senior management. Performance is measured on a pre-tax basis. The compensation structure is weighted towards long-term performance of the funds, with one year performance weighted at 20%, three year performance rated at 30%, and five year performance weighted at 50%. This formula has the effect of rewarding consistently above median performance, which best aligns the interests of the portfolio manager and the shareholder. Below median performance in all three periods results in an extremely low, and in some cases no, formulaic performance based bonus.
The discretionary portion of the annual bonus is determined by senior management of the Subadviser and is based on a number of factors, including, management quality (such as style consistency, risk management, sector coverage, team leadership and coaching), contributions to marketing efforts and organizational development.
Finally, the long-term award component consists of grants in the form of appreciation rights in regard to the common stock of the Subadviser’s holding company parent, restricted shares of such common stock, as well as deferred cash investments in the fund(s) managed by a portfolio manager. Portfolio managers must elect to receive either 20% or 40% of their long-term award component in the form of deferred cash investments in the fund(s) managed. Through this long-term award component, portfolio managers’ interests are further aligned with those of fund shareholders.
The compensation structure of other funds and/or accounts managed by a portfolio manager, if any, is generally the same as the compensation structure described above. A portfolio manager’s compensation with regard to other portfolios may be based on the performance of those portfolios compared to a peer group category applicable to a particular fund or account.
The peer group category for the portfolio manager with respect to the Fund is Morningstar – Small Growth.
B-336
Sands Capital Management, LLC
The portfolio managers of the Growth Opportunities Fund are Frank M. Sands, Wesley A. Johnston, and A. Michael Sramek.
Other Accounts Managed:
Discloses other accounts for which a portfolio manager or Management Team Member was jointly and primarily responsible for the day-to-day management as of September 30, 2016.
The Investment Team at Sands Capital creates a model portfolio to which all client portfolios are managed.
| Number of Accounts Managed* | Total Assets* | Number of Accounts Managed for which Advisory Fee is Performance- Based* | Total Assets* | |||||||||||||
Frank M. Sands | ||||||||||||||||
Registered investment companies** | 4 | $ | 6,297.7 million | 1 | $ | 3,277.0 million | ||||||||||
Other pooled investment vehicles | 10 | $ | 1,038.5 million | 0 | $ | 0 | ||||||||||
Other accounts | 446 | $ | 16,010.9 million | 10 | $ | 2,147.5 million | ||||||||||
Wesley A. Johnston | ||||||||||||||||
Registered investment companies** | 3 | $ | 6,245.4 million | 1 | $ | 3,277.0 million | ||||||||||
Other pooled investment vehicles | 10 | $ | 1,038.5 million | 0 | $ | 0 | ||||||||||
Other accounts | 442 | $ | 15,926.2 million | 9 | $ | 2,125.5 million | ||||||||||
A. Michael Sramek | ||||||||||||||||
Registered investment companies** | 4 | $ | 6,297.7 million | 1 | $ | 3,277.0 million | ||||||||||
Other pooled investment vehicles | 10 | $ | 1,038.5 million | 0 | $ | 0 | ||||||||||
Other accounts | 446 | $ | 16,010.9 million | 10 | $ | 2,147.5 million | ||||||||||
| * | The information provided is as of September 30, 2016. |
| ** | Does not include the Growth Opportunities Fund. |
Ownership of Securities:
As of September 30, 2016, the portfolio managers did not own any shares of the Growth Opportunities Fund.
Conflicts of Interest:
As an investment adviser to a variety of clients, Sands Capital recognizes there may be actual or potential conflicts of interest inherent in its business. For example, conflicts of interest could result from portfolio managers’ management of multiple accounts for multiple clients, the execution and allocation of investment opportunities, the use of brokerage commissions to obtain research, and personal trading by employees. Sands Capital has addressed these conflicts by developing policies and procedures reasonably designed to treat all clients in a fair and equitable manner over time. Sands Capital’s policies and procedures address such issues as execution of portfolio transactions, aggregation and allocation of trades, directed brokerage, and the use of brokerage commissions. Additionally, Sands Capital adopted a Code of Ethics and an Insider Trading Policy that address rules on personal trading and insider information.
B-337
Compensation:
The discussion below describes the portfolio managers’ compensation as of September 30, 2016.
Investment professionals benefit from a salary competitive in the industry, an annual qualitative bonus based on subjective review of the employees’ overall contribution, and a standard profit sharing plan and 401(k) plan. Additional incentives include equity participation while investment professionals also participate in an investment results bonus. The investment results bonus is calculated from the performance variance of the Sands Capital composite returns and their respective benchmarks over 1-, 3-, and 5-year periods, weighted towards the 3- and 5-year results.
B-338
Systematic Financial Management, L.P.
The portfolio managers of the Mid-Cap Value Fund are Ronald M. Mushock and D. Kevin McCreesh.
Other Accounts Managed:
| Number of Accounts Managed* | Total Assets* | Number of Accounts Managed for which Advisory Fee is Performance- Based* | Total Assets* | |||||||||||||
Ronald M. Mushock | ||||||||||||||||
Registered investment companies** | 6 | $ | 1,889 million | 0 | $ | 0 | ||||||||||
Other pooled investment vehicles | 0 | $ | 0 | 0 | $ | 0 | ||||||||||
Other accounts | 171 | $ | 1,866 million | 1 | $ | 61 million | ||||||||||
D. Kevin McCreesh | ||||||||||||||||
Registered investment companies** | 1 | $ | 28 million | 0 | $ | 0 | ||||||||||
Other pooled investment vehicles | 0 | $ | 0 | 0 | $ | 0 | ||||||||||
Other accounts | 77 | $ | 843 million | 1 | $ | 755 million | ||||||||||
| * | The information provided is as of September 30, 2016. |
| ** | Does not include the Mid-Cap Value Fund. |
Ownership of Securities:
As of September 30, 2016, the portfolio managers did not own any shares of the Mid-Cap Value Fund.
Conflicts of Interest:
Portfolio managers of Systematic oversee the investment of various types of accounts in the same strategy, such as mutual funds, pooled investment vehicles and separate accounts for individuals and institutions. The simultaneous management of these diverse accounts and specific client circumstances may create perceived conflicts of interest related to differences in the investment management fees charged and unequal time and attention devoted to certain accounts. However, Systematic recognizes its affirmative duty to treat all accounts fairly and equitably over time and maintains a series of controls in furtherance of this goal.
Generally, portfolio managers apply investment decisions to all accounts utilizing a particular strategy on a pro rata basis, while also accounting for varying client circumstances, including client objectives and preferences, instructions, restrictions, account size, cash availability and current specific needs. Nevertheless, during the normal course of managing assets for multiple clients of different types and asset levels, portfolio managers may encounter conflicts of interest that could, if not properly addressed, be harmful to one or more of our clients. Those of a material nature that are encountered most frequently involve, without limitation, investment security selection, employee personal securities trading, proxy voting and the allocation of investment opportunities. To mitigate these potential conflicts and ensure its clients are not negatively impacted by the adverse actions of Systematic or its employees, Systematic has implemented a series of policies and procedures that are overseen by compliance professionals and, in Systematic’s view, reasonably designed to prevent and detect conflicts.
For example, Systematic’s Code of Ethics restricts employees’ personal securities trading, forbids employees from giving, soliciting or accepting inappropriate gifts and entertainment and requires employees to receive explicit approval prior to serving as a board member or officer of a public company or rendering outside investment advice. Additionally, to effectively remove conflicts of interest related to voting proxies for accounts
B-339
that have delegated such authority to Systematic, Systematic has a Proxy Voting Policy that provides for an independent third-party proxy voting agent, which agent’s pre-determined voting policy guidelines Systematic has adopted. Systematic’s Allocation and Aggregation and Trade Error Correction policies similarly seek to reduce potential conflicts of interest by promoting the fair and equitable allocation of investment opportunities among client accounts over time and the consistent resolution of trading errors.
Notably, Affiliated Managers Group, Inc. (NYSE: AMG), a publicly traded asset management company, holds a majority interest in Systematic through AMG’s wholly-owned subsidiary, Titan NJ LP Holdings LLC. Systematic operates independently as a separate, autonomous affiliate of AMG, which has equity investments in a group of investment management firms including Systematic. The AMG affiliates do not formulate advice for Systematic’s clients and do not, in Systematic’s view, present any potential conflict of interest with Systematic’s clients.
Compensation:
The discussion below describes the portfolio managers’ compensation as of September 30, 2016.
Certain Systematic employees share equity ownership with AMG as Partners, which may serve to incentivize Systematic’s investment professionals to perform successfully. The compensation package for portfolio managers Ronald M. Mushock and D. Kevin McCreesh, both of whom are Managing Partners of Systematic, consists of a fixed base salary and a share of the Firm’s profits based on each Partner’s respective individual ownership position in Systematic. Total compensation is influenced by Systematic’s overall profitability, and therefore is based in part on the aggregate performance of all Systematic’s portfolios. Portfolio managers are not compensated based solely on the performance of, or the value of assets held in, any product managed by Systematic. Moreover, the portfolio managers are provided with a benefits package, including health insurance, and participation in a company 401(k) plan, comparable to that received by other Systematic employees.
B-340
T. Rowe Price Associates, Inc.
The portfolio manager of the Blue Chip Growth Fund is Larry J. Puglia.
Other Accounts Managed:
| Number of Accounts Managed* | Total Assets* | Number of Accounts Managed for which Advisory Fee is Performance- Based* | Total Assets* | |||||||||||||
Larry J. Puglia | ||||||||||||||||
Registered investment companies** | 10 | $ | 44,977,624,035 | 0 | $ | 0 | ||||||||||
Other pooled investment vehicles | 7 | $ | 5,401,753,775 | 0 | $ | 0 | ||||||||||
Other accounts | 17 | $ | 4,317,794,563 | 0 | $ | 0 | ||||||||||
| * | The information provided is as of September 30, 2016. |
| ** | Does not include the Blue Chip Growth Fund. |
Ownership of Securities:
As of September 30, 2016, the portfolio manager did not own any shares of the Blue Chip Growth Fund.
The portfolio manager of the Small Company Value Fund is J. David Wagner.
Other Accounts Managed:
| Number of Accounts Managed* | Total Assets* | Number of Accounts Managed for which Advisory Fee is Performance- Based* | Total Assets* | |||||||||||||
J. David Wagner | ||||||||||||||||
Registered investment companies** | 5 | $ | 9,680,668,979 | 0 | $ | 0 | ||||||||||
Other pooled investment vehicles | 1 | $ | 1,026,915,267 | 0 | $ | 0 | ||||||||||
Other accounts | 2 | $ | 215,109,772 | 0 | $ | 0 | ||||||||||
| * | The information provided is as of September 30, 2016. |
| ** | Does not include the Small Company Value Fund. |
Ownership of Securities:
As of September 30, 2016, the portfolio manager did not own any shares of the Small Company Value Fund.
The portfolio manager of the Mid Cap Growth Equity II Fund is Brian W.H. Berghuis.
B-341
Other Accounts Managed:
| Number of Accounts Managed* | Total Assets* | Number of Accounts Managed for which Advisory Fee is Performance- Based* | Total Assets* | |||||||||||||
Brian W.H. Berghuis | ||||||||||||||||
Registered investment companies** | 8 | $ | 38,970,961,512 | 0 | $ | 0 | ||||||||||
Other pooled investment vehicles | 1 | $ | 1,037,525,810 | 0 | $ | 0 | ||||||||||
Other accounts | 7 | $ | 1,766,930,596 | 0 | $ | 0 | ||||||||||
| * | The information provided is as of September 30, 2016. |
| ** | Does not include the Mid Cap Growth Equity II Fund. |
Ownership of Securities:
As of September 30, 2016, the portfolio manager did not own any shares of the Mid Cap Growth Equity II Fund.
Conflicts of Interest:
Portfolio managers at T. Rowe Price and its affiliates typically manage multiple accounts. These accounts may include, among others, mutual funds, separate accounts (assets managed on behalf of institutions such as pension funds, colleges and universities, and foundations), offshore funds, and common trust funds. Portfolio managers make investment decisions for each portfolio based on the investment objectives, policies, practices and other relevant investment considerations that the managers believe are applicable to that portfolio. Consequently, portfolio managers may purchase (or sell) securities for one portfolio and not another portfolio. T. Rowe Price and its affiliates have adopted brokerage and trade allocation policies and procedures which they believe are reasonably designed to address any potential conflicts associated with managing multiple accounts for multiple clients.
T. Rowe Price funds may, from time to time, own shares of Morningstar, Inc. Morningstar is a provider of investment research to individual and institutional investors, and publishes ratings on mutual funds, including the Funds. T. Rowe Price manages the Morningstar retirement plan and T. Rowe Price and its affiliates pay Morningstar for a variety of products and services. In addition, Morningstar may provide investment consulting and investment management services to clients of T. Rowe Price or its affiliates.
Compensation:
The discussion below describes the portfolio managers’ compensation as of September 30, 2016.
Portfolio manager compensation consists primarily of a base salary, a cash bonus, and an equity incentive that usually comes in the form of a stock option grant or restricted stock grant. Compensation is variable and is determined based on the following factors.
Investment performance over 1-, 3-, 5-, and 10-year periods is the most important input. The weightings for these time periods are generally balanced and are applied consistently across similar strategies. T. Rowe Price (and Price Hong Kong, Price Singapore, and T. Rowe Price International, as appropriate) evaluate performance in absolute, relative, and risk-adjusted terms. Relative performance and risk-adjusted performance are typically determined with reference to the broad-based index (eg., S&P 500) and the Lipper index (eg., Large-Cap Growth) set forth in the total returns table in the fund’s prospectus, although other benchmarks may be used as well. Investment results are also measured against comparably managed funds of competitive investment management firms. The selection of comparable funds is approved by the applicable investment steering
B-342
committee and is the same as the selection presented to the directors of the T. Rowe Price Funds in their regular review of fund performance. Performance is primarily measured on a pre-tax basis though tax-efficiency is considered and is especially important for tax efficient funds. Compensation is viewed with a long term time horizon. The more consistent a manager’s performance over time, the higher the compensation opportunity. The increase or decrease in a fund’s assets due to the purchase or sale of fund shares is not considered a material factor. In reviewing relative performance for fixed income funds, a fund’s expense ratio is usually taken into account. Contribution to T. Rowe Price’s overall investment process is an important consideration as well. Leveraging ideas and investment insights across the global investment platform, working effectively with and mentoring others, and other contributions to T. Rowe Price’s clients, the firm, or T. Rowe Price’s culture are important components of T. Rowe Price’s long-term success and are highly valued.
All employees of T. Rowe Price, including portfolio managers, participate in a 401(k) plan sponsored by T. Rowe Price Group. In addition, all employees are eligible to purchase T. Rowe Price common stock through an employee stock purchase plan that features a limited corporate matching contribution. Eligibility for and participation in these plans is on the same basis for all employees. Finally, all vice presidents of T. Rowe Price Group, including all portfolio managers, receive supplemental medical/hospital reimbursement benefits.
This compensation structure is used for all portfolios managed by the portfolio manager.
B-343
Wellington Management Company LLP
The portfolio manager of the Fundamental Value Fund is Karen H. Grimes.
Other Accounts Managed:
| Number of Accounts Managed* | Total Assets* | Number of Accounts Managed for which Advisory Fee is Performance- Based* | Total Assets* | |||||||||||||
Karen H. Grimes | ||||||||||||||||
Registered investment companies** | 8 | $ | 12,543,493,477 | 0 | $ | 0 | ||||||||||
Other pooled investment vehicles | 3 | $ | 622,300,418 | 0 | $ | 0 | ||||||||||
Other accounts | 3 | $ | 382,129,133 | 1 | $ | 334,991,944 | ||||||||||
| * | The information provided is as of September 30, 2016. |
| ** | Does not include the Fundamental Value Fund. |
Ownership of Securities:
As of September 30, 2016, the portfolio manager did not own any shares of the Fundamental Value Fund.
The portfolio manager of the Fundamental Growth Fund is Paul E. Marrkand.
Other Accounts Managed:
| Number of Accounts Managed* | Total Assets* | Number of Accounts Managed for which Advisory Fee is Performance- Based* | Total Assets* | |||||||||||||
Paul E. Marrkand | ||||||||||||||||
Registered investment companies** | 3 | $ | 6,179,380,643 | 1 | $ | 5,295,482,636 | ||||||||||
Other pooled investment vehicles | 4 | $ | 1,124,958,409 | 1 | $ | 70,796,176 | ||||||||||
Other accounts | 1 | $ | 331,797,584 | 0 | $ | 0 | ||||||||||
| * | The information provided is as of September 30, 2016. |
| ** | Does not include the Fundamental Growth Fund. |
Ownership of Securities:
As of September 30, 2016, the portfolio manager did not own any shares of the Fundamental Growth Fund.
The portfolio managers of the Small Cap Value Equity Fund are Shaun F. Pedersen and Timothy J. McCormack.
B-344
Other Accounts Managed:
| Number of Accounts Managed* | Total Assets* | Number of Accounts Managed for which Advisory Fee is Performance- Based* | Total Assets* | |||||||||||||
Shaun F. Pedersen | ||||||||||||||||
Registered investment companies** | 8 | $ | 2,126,865,485 | 0 | $ | 0 | ||||||||||
Other pooled investment vehicles | 13 | $ | 1,780,171,001 | 2 | $ | 259,083,664 | ||||||||||
Other accounts | 32 | $ | 2,666,160,441 | 0 | $ | 0 | ||||||||||
Timothy J. McCormack | ||||||||||||||||
Registered investment companies** | 8 | $ | 2,126,865,485 | 0 | $ | 0 | ||||||||||
Other pooled investment vehicles | 6 | $ | 1,507,347,760 | 1 | $ | 219,788,236 | ||||||||||
Other accounts | 26 | $ | 1,768,259,794 | 0 | $ | 0 | ||||||||||
| * | The information provided is as of September 30, 2016. |
| ** | Does not include the Small Cap Value Equity Fund. |
Ownership of Securities:
As of September 30, 2016, the portfolio managers did not own any shares of the Small Cap Value Equity Fund.
The portfolio managers of the Small Cap Growth Equity Fund are Kenneth L. Abrams, Daniel J. Fitzpatrick, Steven C. Angeli, Mario E. Abularach, and Stephen Mortimer.
Other Accounts Managed:
| Number of Accounts Managed* | Total Assets* | Number of Accounts Managed for which Advisory Fee is Performance- Based* | Total Assets* | |||||||||||||
Kenneth L. Abrams | ||||||||||||||||
Registered investment companies** | 3 | $ | 3,876,146,933 | 1 | $ | 3,747,257,324 | ||||||||||
Other pooled investment vehicles | 7 | $ | 1,019,556,317 | 0 | $ | 0 | ||||||||||
Other accounts | 14 | $ | 2,581,405,813 | 1 | $ | 32,031,736 | ||||||||||
Daniel J. Fitzpatrick | ||||||||||||||||
Registered investment companies** | 2 | $ | 3,849,760,607 | 1 | $ | 3,747,257,324 | ||||||||||
Other pooled investment vehicles | 3 | $ | 546,531,041 | 0 | $ | 0 | ||||||||||
Other accounts | 5 | $ | 1,116,587,557 | 1 | $ | 32,031,736 | ||||||||||
Steven C. Angeli | ||||||||||||||||
Registered investment companies** | 11 | $ | 2,809,710,927 | 0 | $ | 0 | ||||||||||
Other pooled investment vehicles | 20 | $ | 2,013,087,797 | 6 | $ | 599,139,376 | ||||||||||
Other accounts | 18 | $ | 1,603,544,905 | 2 | $ | 521,580,823 | ||||||||||
Mario E. Abularach | ||||||||||||||||
Registered investment companies** | 8 | $ | 9,325,129,786 | 0 | $ | 0 | ||||||||||
Other pooled investment vehicles | 1 | $ | 47,834,095 | 0 | $ | 0 | ||||||||||
Other accounts | 6 | $ | 592,683,539 | 1 | $ | 115,781,032 | ||||||||||
Stephen Mortimer | ||||||||||||||||
Registered investment companies** | 12 | $ | 11,196,830,290 | 0 | $ | 0 | ||||||||||
Other pooled investment vehicles | 3 | $ | 194,759,461 | 0 | $ | 0 | ||||||||||
Other accounts | 7 | $ | 1,076,959,307 | 1 | $ | 115,781,032 | ||||||||||
B-345
| * | The information provided is as of September 30, 2016. |
| ** | Does not include the Small Cap Growth Equity Fund. |
Ownership of Securities:
As of September 30, 2016, the portfolio managers did not own any shares of the Small Cap Growth Equity Fund.
Conflicts of Interest:
Individual investment professionals at Wellington Management manage multiple accounts for multiple clients. These accounts may include mutual funds, separate accounts (assets managed on behalf of institutions such as pension funds, insurance companies, foundations, or separately managed account programs sponsored by financial intermediaries), bank common trust accounts, and hedge funds. Each Fund’s managers listed in the prospectus who are primarily responsible for the day-to-day management of the Funds (“Investment Professionals”) generally manage accounts in several different investment styles. These accounts may have investment objectives, strategies, time horizons, tax considerations and risk profiles that differ from those of the Funds. The Investment Professionals make investment decisions for each account, including the relevant Fund, based on the investment objectives, policies, practices, benchmarks, cash flows, tax and other relevant investment considerations applicable to that account. Consequently, the Investment Professionals may purchase or sell securities, including IPOs, for one account and not another account, and the performance of securities purchased for one account may vary from the performance of securities purchased for other accounts. Alternatively, these accounts may be managed in a similar fashion to the relevant Fund and thus the accounts may have similar, and in some cases nearly identical, objectives, strategies and/or holdings to that of the relevant Fund.
The Investment Professional or other investment professionals at Wellington Management may place transactions on behalf of other accounts that are directly or indirectly contrary to investment decisions made on behalf of the relevant Fund, or make investment decisions that are similar to those made for the relevant Fund, both of which have the potential to adversely impact the relevant Fund depending on market conditions. For example, an investment professional may purchase a security in one account while appropriately selling that same security in another account. Similarly, an Investment Professional may purchase the same security for the relevant Fund and one or more other accounts at or about the same time. In those instances the other accounts will have access to their respective holdings prior to the public disclosure of the relevant Fund’s holdings. In addition, some of these accounts have fee structures, including performance fees, which are or have the potential to be higher, in some cases significantly higher, than the fees Wellington Management receives for managing the Funds. Ms. Grimes and Messrs. Abrams, Abularach, Angeli, Fitzpatrick, Marrkand, McCormack, Mortimer, and Pedersen also manage accounts, which pay performance allocations to Wellington Management or its affiliates. Because incentive payments paid by Wellington Management to the Investment Professionals are tied to revenues earned by Wellington Management, and where noted, to the performance achieved by the manager in each account, the incentives associated with any given account may be significantly higher or lower than those associated with other accounts managed by a given Investment Professional. Finally, the Investment Professionals may hold shares or investments in the other pooled investment vehicles and/or other accounts identified above.
Wellington Management’s goal is to meet its fiduciary obligation to treat all clients fairly and provide high quality investment services to all of its clients. Wellington Management has adopted and implemented policies and procedures, including brokerage and trade allocation policies and procedures, which it believes address the conflicts associated with managing multiple accounts for multiple clients. In addition, Wellington Management monitors a variety of areas, including compliance with primary account guidelines, the allocation of IPOs, and compliance with the firm’s Code of Ethics, and places additional investment restrictions on investment professionals who manage hedge funds and certain other accounts. Furthermore, senior investment and business personnel at Wellington Management periodically review the performance of Wellington Management’s
B-346
investment professionals. Although Wellington Management does not track the time an investment professional spends on a single account, Wellington Management does periodically assess whether an investment professional has adequate time and resources to effectively manage the investment professional’s various client mandates.
Compensation:
Wellington Management receives a fee based on the assets under management of each Fund as set forth in the Investment Subadvisory Agreements between Wellington Management and MML Advisers on behalf of each Fund. Wellington Management pays its investment professionals out of its total revenues, including the advisory fees earned with respect to each Fund. The following information relates to the fiscal year ended September 30, 2016.
Wellington Management’s compensation structure is designed to attract and retain high-caliber investment professionals necessary to deliver high quality investment management services to its clients. Wellington Management’s compensation of each Fund’s managers listed in the prospectus who are primarily responsible for the day-to-day management of the Funds (“Investment Professionals”) includes a base salary and incentive components. The base salary for each Investment Professional who is a partner (a “Partner”) of Wellington Management Group LLP, the ultimate holding company of Wellington Management, is generally a fixed amount that is determined by the managing partners of Wellington Management Group LLP. Each Investment Professional is eligible to receive an incentive payment based on the revenues earned by Wellington Management from the Fund managed by the Investment Professional and generally each other account managed by such Investment Professional. Each Investment Professional’s incentive payment relating to the relevant Fund is linked to the gross pre-tax performance of the portion of the Fund managed by the Investment Professional compared to the benchmark index and/or peer group identified below over one and three year periods, with an emphasis on three year results. In 2012, Wellington Management began placing increased emphasis on long-term performance and is phasing in a five-year performance comparison period, which will be fully implemented by December 31, 2016. Wellington Management applies similar incentive compensation structures (although the benchmarks or peer groups, time periods and rates may differ) to other accounts managed by these Investment Professionals, including accounts with performance fees.
Portfolio-based incentives across all accounts managed by an investment professional can, and typically do, represent a significant portion of an investment professional’s overall compensation; incentive compensation varies significantly by individual and can vary significantly from year to year. The Investment Professionals may also be eligible for bonus payments based on their overall contribution to Wellington Management’s business operations. Senior management at Wellington Management may reward individuals as it deems appropriate based on other factors. Each Partner is eligible to participate in a Partner-funded tax qualified retirement plan, the contributions to which are made pursuant to an actuarial formula. Messrs. Abrams, Abularach, Angeli, Fitzpatrick, Marrkand, McCormack, Mortimer, and Pedersen and Ms. Grimes are Partners.
Fund | Benchmark and/or Peer Group | |
Fundamental Value Fund | Russell 1000 Value Index | |
Fundamental Growth Fund | Russell 1000 Growth Index | |
Small Cap Value Equity Fund | Russell 2500 Value Index | |
Small Cap Growth Equity Fund (portfolio managed by Messrs. Abrams and Fitzpatrick) | Russell 2000 Index | |
Small Cap Growth Equity Fund (portfolio managed by Messrs. Angeli, Abularach, and Mortimer) | Russell 2000 Growth Index |
B-347
Western Asset Management Company
Western Asset Management Company Limited
A team of investment professionals led by Chief Investment Officer S. Kenneth Leech, and portfolio managers Mark S. Lindbloom, Carl L. Eichstaedt, Michael C. Buchanan, and Chia-Liang Lian, manages the Strategic Bond Fund’s assets.
Mr. Leech is responsible for the strategic oversight of the investments and for supervising the operations of the various sector specialist teams dedicated to the specific asset classes. Messrs. Lindbloom, Eichstaedt, Buchanan, and Lian are responsible for portfolio structure, including sector allocation, duration weighting, and term structure decisions.
Other Accounts Managed:
| Number of Accounts Managed* | Total Assets* | Number of Accounts Managed for which Advisory Fee is Performance- Based* | Total Assets* | |||||||||||||
S. Kenneth Leech | ||||||||||||||||
Registered investment companies** | 105 | $ | 164,226 million | 0 | $ | 0 | ||||||||||
Other pooled investment vehicles | 275 | $ | 95,401 million | 7 | $ | 1,578 million | ||||||||||
Other accounts | 613 | $ | 184,496 million | 70 | $ | 19,052 million | ||||||||||
Mark S. Lindbloom | ||||||||||||||||
Registered investment companies** | 21 | $ | 43,315 million | 0 | $ | 0 | ||||||||||
Other pooled investment vehicles | 22 | $ | 11,677 million | 0 | $ | 0 | ||||||||||
Other accounts | 162 | $ | 39,188 million | 33 | $ | 7,755 million | ||||||||||
Carl L. Eichstaedt | ||||||||||||||||
Registered investment companies** | 17 | $ | 40,618 million | 0 | $ | 0 | ||||||||||
Other pooled investment vehicles | 25 | $ | 12,466 million | 0 | $ | 0 | ||||||||||
Other accounts | 163 | $ | 47,892 million | 33 | $ | 7,910 million | ||||||||||
Michael C. Buchanan | ||||||||||||||||
Registered investment companies** | 44 | $ | 45,678 million | 0 | $ | 0 | ||||||||||
Other pooled investment vehicles | 89 | $ | 38,846 million | 3 | $ | 1,148 million | ||||||||||
Other accounts | 240 | $ | 81,639 million | 30 | $ | 11,657 million | ||||||||||
Chia-Liang Lian | ||||||||||||||||
Registered investment companies** | 28 | $ | 38,009 million | 0 | $ | 0 | ||||||||||
Other pooled investment vehicles | 42 | $ | 14,962 million | 1 | $ | 125 million | ||||||||||
Other accounts | 161 | $ | 31,707 million | 31 | $ | 7,770 million | ||||||||||
| * | The information provided is as of September 30, 2016. |
| ** | Does not include the Strategic Bond Fund. |
B-348
Ownership of Securities:
As of September 30, 2016, the portfolio managers did not own any shares of the Strategic Bond Fund.
Note: The numbers above reflect the overall number of portfolios managed by Western Asset. Mr. Leech is involved in the management of all the Firm’s portfolios, but he is not solely responsible for particular portfolios. Western’s investment discipline emphasizes a team approach that combines the efforts of groups of specialists working in different market sectors. The individuals that have been identified are responsible for overseeing implementation of the firm’s overall investment ideas and coordinating the work of the various sector teams. This structure ensures that client portfolios benefit from a consensus that draws on the expertise of all team members.
Conflicts of Interest:
Western Asset has adopted compliance policies and procedures to address a wide range of potential conflicts of interest that could directly impact client portfolios. For example, potential conflicts of interest may arise in connection with the management of multiple portfolios (including portfolios managed in a personal capacity). These could include potential conflicts of interest related to the knowledge and timing of a portfolio’s trades, investment opportunities, and broker selection. Portfolio managers are privy to the size, timing, and possible market impact of a portfolio’s trades.
It is possible that an investment opportunity may be suitable for both a portfolio and other accounts managed by a portfolio manager, but may not be available in sufficient quantities for both the portfolio and the other accounts to participate fully. Similarly, there may be limited opportunity to sell an investment held by a portfolio and another account. A conflict may arise where the portfolio manager may have an incentive to treat an account preferentially as compared to a portfolio because the account pays a performance-based fee or the portfolio manager, Western Asset, or an affiliate has an interest in the account. Western Asset has adopted procedures for allocation of portfolio transactions and investment opportunities across multiple client accounts on a fair and equitable basis over time. All eligible accounts that can participate in a trade share the same price on a pro-rata allocation basis to ensure that no conflict of interest occurs. Trades are allocated among similarly managed accounts to maintain consistency of portfolio strategy, taking into account cash availability, investment restrictions and guidelines, and portfolio composition versus strategy.
With respect to securities transactions, Western Asset determines which broker or dealer to use to execute each order, consistent with their duty to seek best execution of the transaction. However, with respect to certain other accounts (such as pooled investment vehicles that are not registered investment companies and other accounts managed for organizations and individuals), Western Asset may be limited by the client with respect to the selection of brokers or dealers or may be instructed to direct trades through a particular broker or dealer. In these cases, trades for a portfolio in a particular security may be placed separately from, rather than aggregated with, such other accounts. Having separate transactions with respect to a security may temporarily affect the market price of the security or the execution of the transaction, or both, to the possible detriment of a portfolio or the other account(s) involved. Additionally, the management of multiple portfolios and/or other accounts may result in a portfolio manager devoting unequal time and attention to the management of each portfolio and/or other account. Western Asset’s team approach to portfolio management and block trading approach works to limit this potential risk.
Western Asset also maintains a gift and entertainment policy to address the potential for a business contact to give gifts or host entertainment events that may influence the business judgment of an employee. Employees are permitted to retain gifts of only a nominal value and are required to make reimbursement for entertainment events above a certain value. All gifts (except those of a de minimus value) and entertainment events that are given or sponsored by a business contact are required to be reported in a gift and entertainment log which is reviewed on a regular basis for possible issues.
B-349
Employees of Western Asset have access to transactions and holdings information regarding client accounts and Western Asset’s overall trading activities. This information represents a potential conflict of interest because employees may take advantage of this information as they trade in their personal accounts. Accordingly, Western Asset maintains a Code of Ethics that is compliant with Rule 17j-1 and Rule 204A-1 to address personal trading. In addition, the Code of Ethics seeks to establish broader principles of good conduct and fiduciary responsibility in all aspects of the Western Asset’s business. The Code of Ethics is administered by the Legal and Compliance Department and monitored through the Western Asset’s compliance monitoring program.
Western Asset may also face other potential conflicts of interest with respect to managing client assets, and the description above is not a complete description of every conflict of interest that could be deemed to exist. Western Asset also maintains a compliance monitoring program and engages independent auditors to conduct a SSAE 16/ISAE 3402 audit on an annual basis. These steps help to ensure that potential conflicts of interest have been addressed.
Compensation:
The discussion below describes the portfolio managers’ compensation as of September 30, 2016.
At Western Asset, one compensation methodology covers all products and functional areas, including portfolio managers. Western Asset’s philosophy is to reward its employees through total compensation. Total compensation is reflective of the external market value for skills, experience, ability to produce results, and the performance of one’s group and the firm as a whole.
Discretionary bonuses make up the variable component of total compensation. These are structured to reward sector specialists for contributions to the firm as well as relative performance of their specific portfolios/product and are determined by the professional’s job function and performance as measured by a formal review process.
For portfolio managers, the formal review process includes a thorough review of portfolios they were assigned to lead, or with which they were otherwise involved, and includes not only investment performance, but maintaining a detailed knowledge of client portfolio objectives and guidelines, monitoring of risks, and performance for adherence to these parameters, execution of asset allocation consistent with current firm and portfolio strategy, and communication with clients. In reviewing pre-tax investment performance, one-, three-, and five-year annualized returns are measured against appropriate market peer groups and to each fund’s benchmark index.
B-350